Fewer departures put the focus on value per Indian student
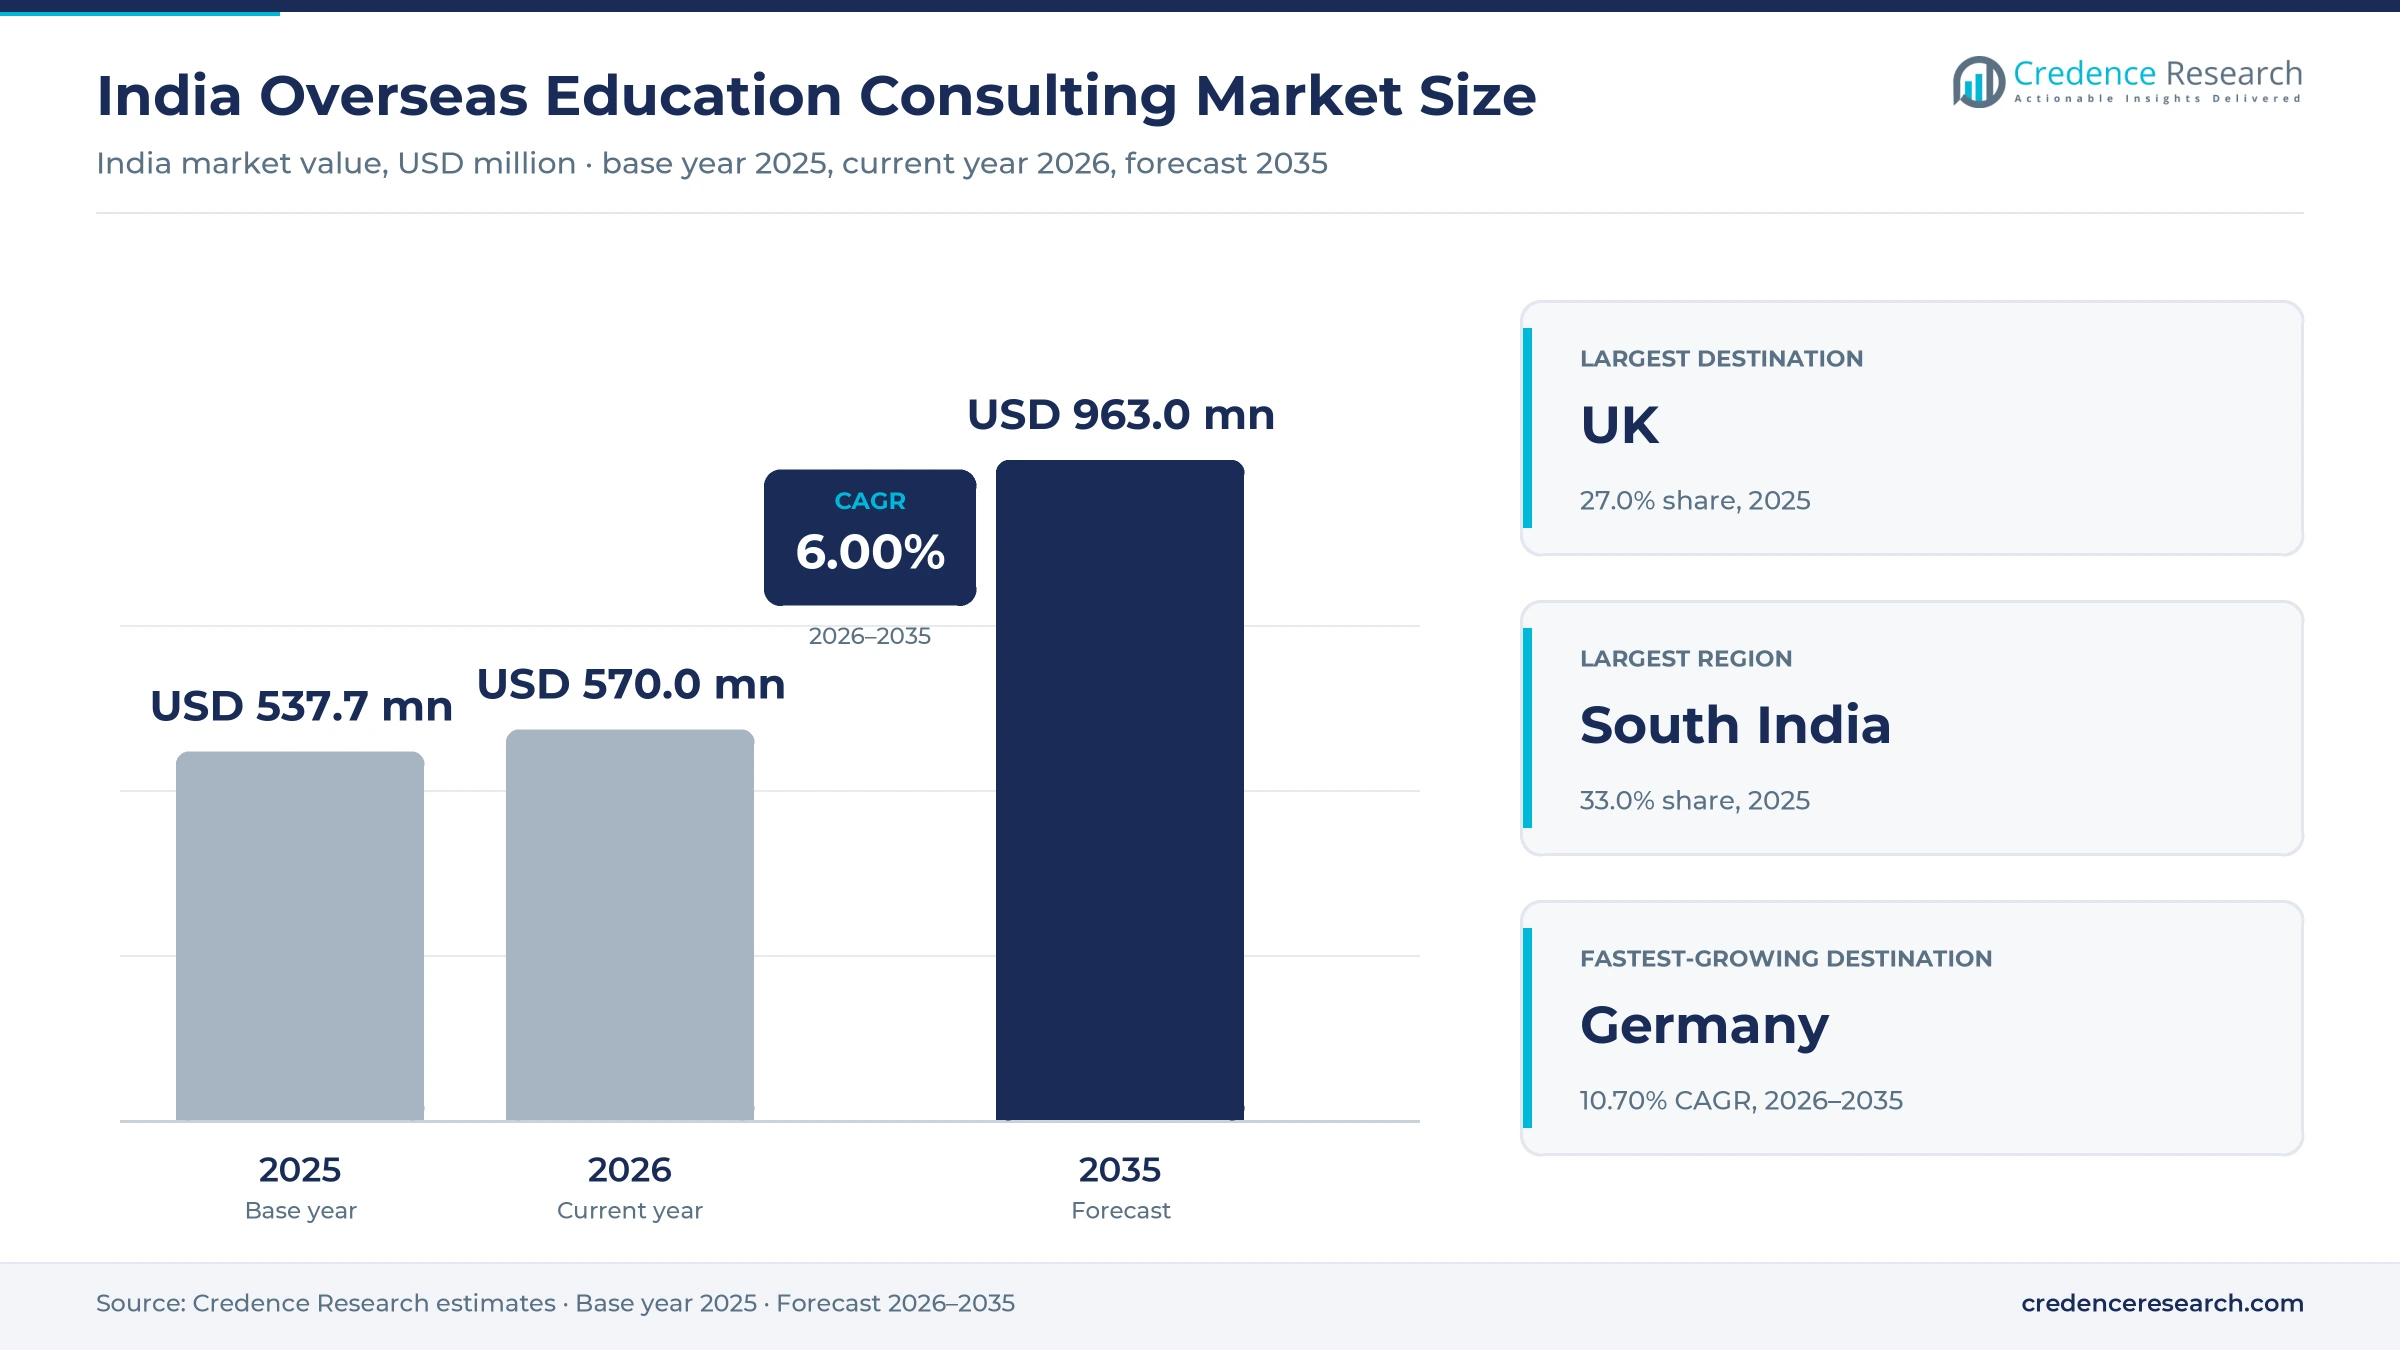
The India overseas education consulting market was valued at USD 537.7 million in 2025 and is projected to increase from USD 570.0 million in 2026 to USD 963.0 million by 2035, registering a CAGR of 6.00% during 2026–2035. Demand comes from families paying for admission advice, visa filing, test preparation and loan arranging as destination rules tighten. South India held the largest regional share, 33.0% in 2025, because Andhra Pradesh, Telangana, Tamil Nadu and Kerala have long supplied large student cohorts. Central India is the fastest-growing region at 7.01% a year as agencies follow applicants beyond metro cities. The Bureau of Immigration counted 626,000 student departures in 2025, down from 908,000 in 2023, so growth in this estimate rests on higher value per student rather than volume. Commercial conditions also changed in 2026, when India cut tax collected on education remittances to 2% and removed a place-of-supply rule that had charged agents GST on foreign commissions.
What does overseas admission advice cover for Indian students?
The estimate counts income earned in India from advising students who plan to study abroad. That income includes commissions paid by foreign universities, fees paid by students and families, and add-on income from education loans, visa filing, test preparation and housing referrals. Buyers usually purchase through a local agency counter, a global placement network or an app-led adviser.
The estimate excludes tuition and living costs paid to foreign institutions, the principal value of education loans and English test fees collected by test owners. Domestic admission coaching for Indian entrance exams is also excluded from this count. The value chain runs from foreign universities and aggregators through master agents, sub-agents and counselors to the student, and commission is often shared along that chain.
India Overseas Education Consulting Market Insights
- The market grows from USD 537.7 million in 2025 to USD 963.0 million by 2035 at a 6.00% CAGR, resting on value per student rather than departure counts.
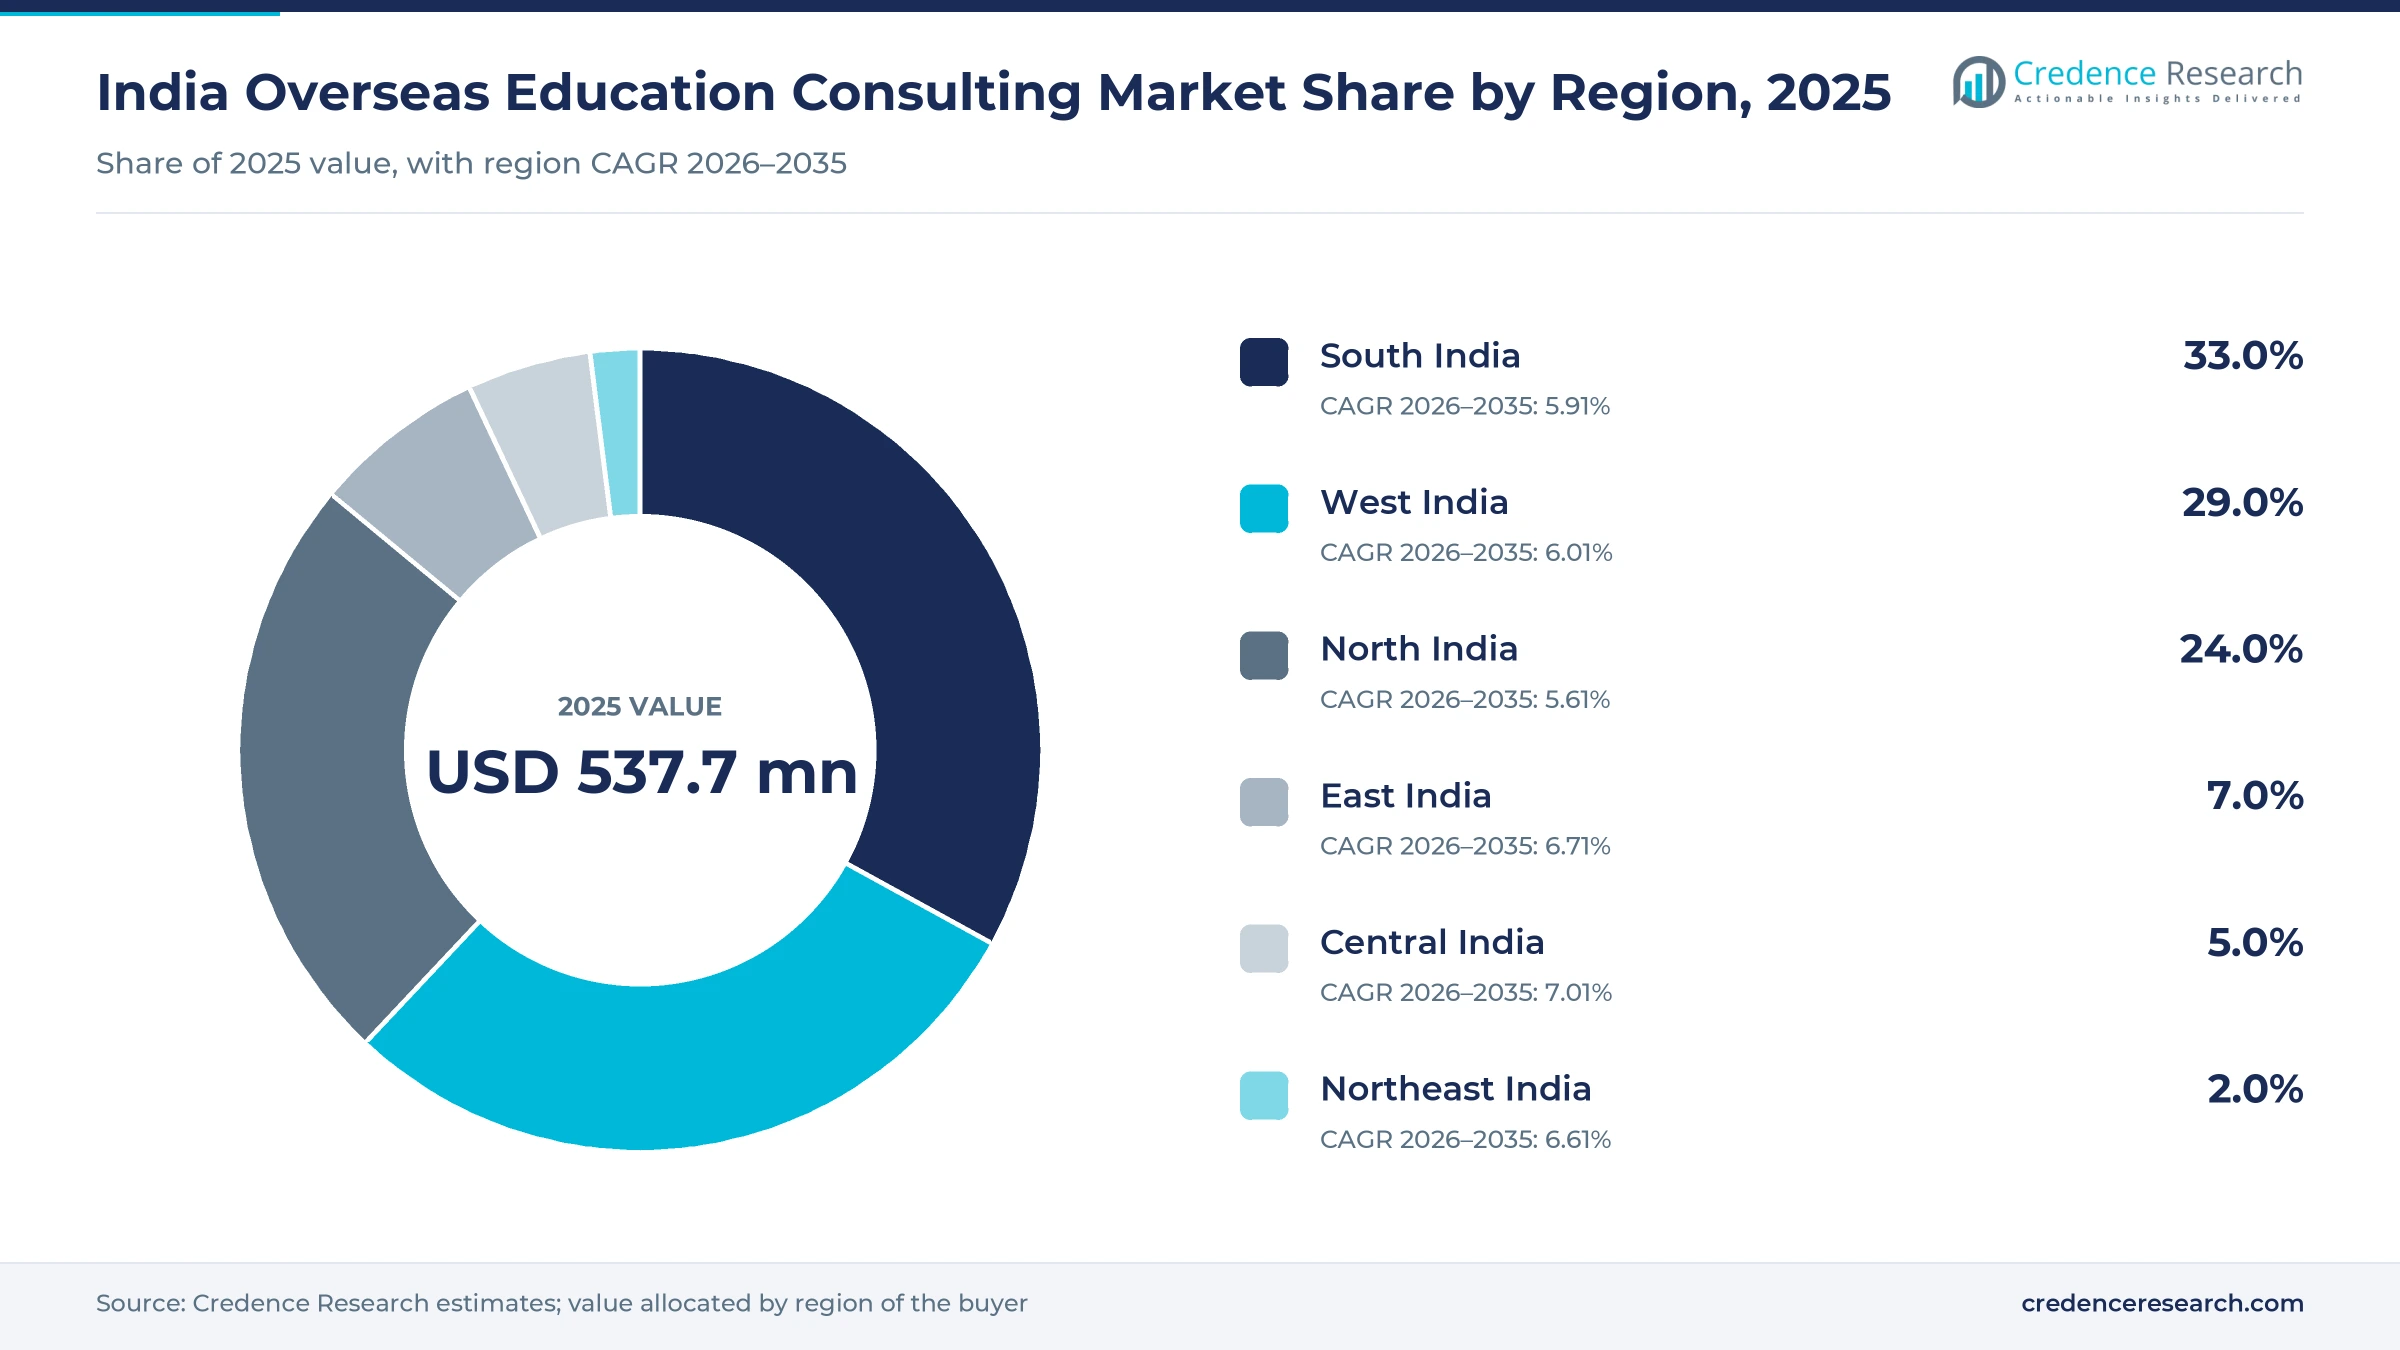
- South India held 33.0% of 2025 value, ahead of West India at 29.0%, reflecting long-established outbound cohorts in Andhra Pradesh, Telangana and Tamil Nadu.
- University commissions held 57.0% of 2025 value, because partner institutions commonly pay advisers about 10% of a student's first-year tuition.
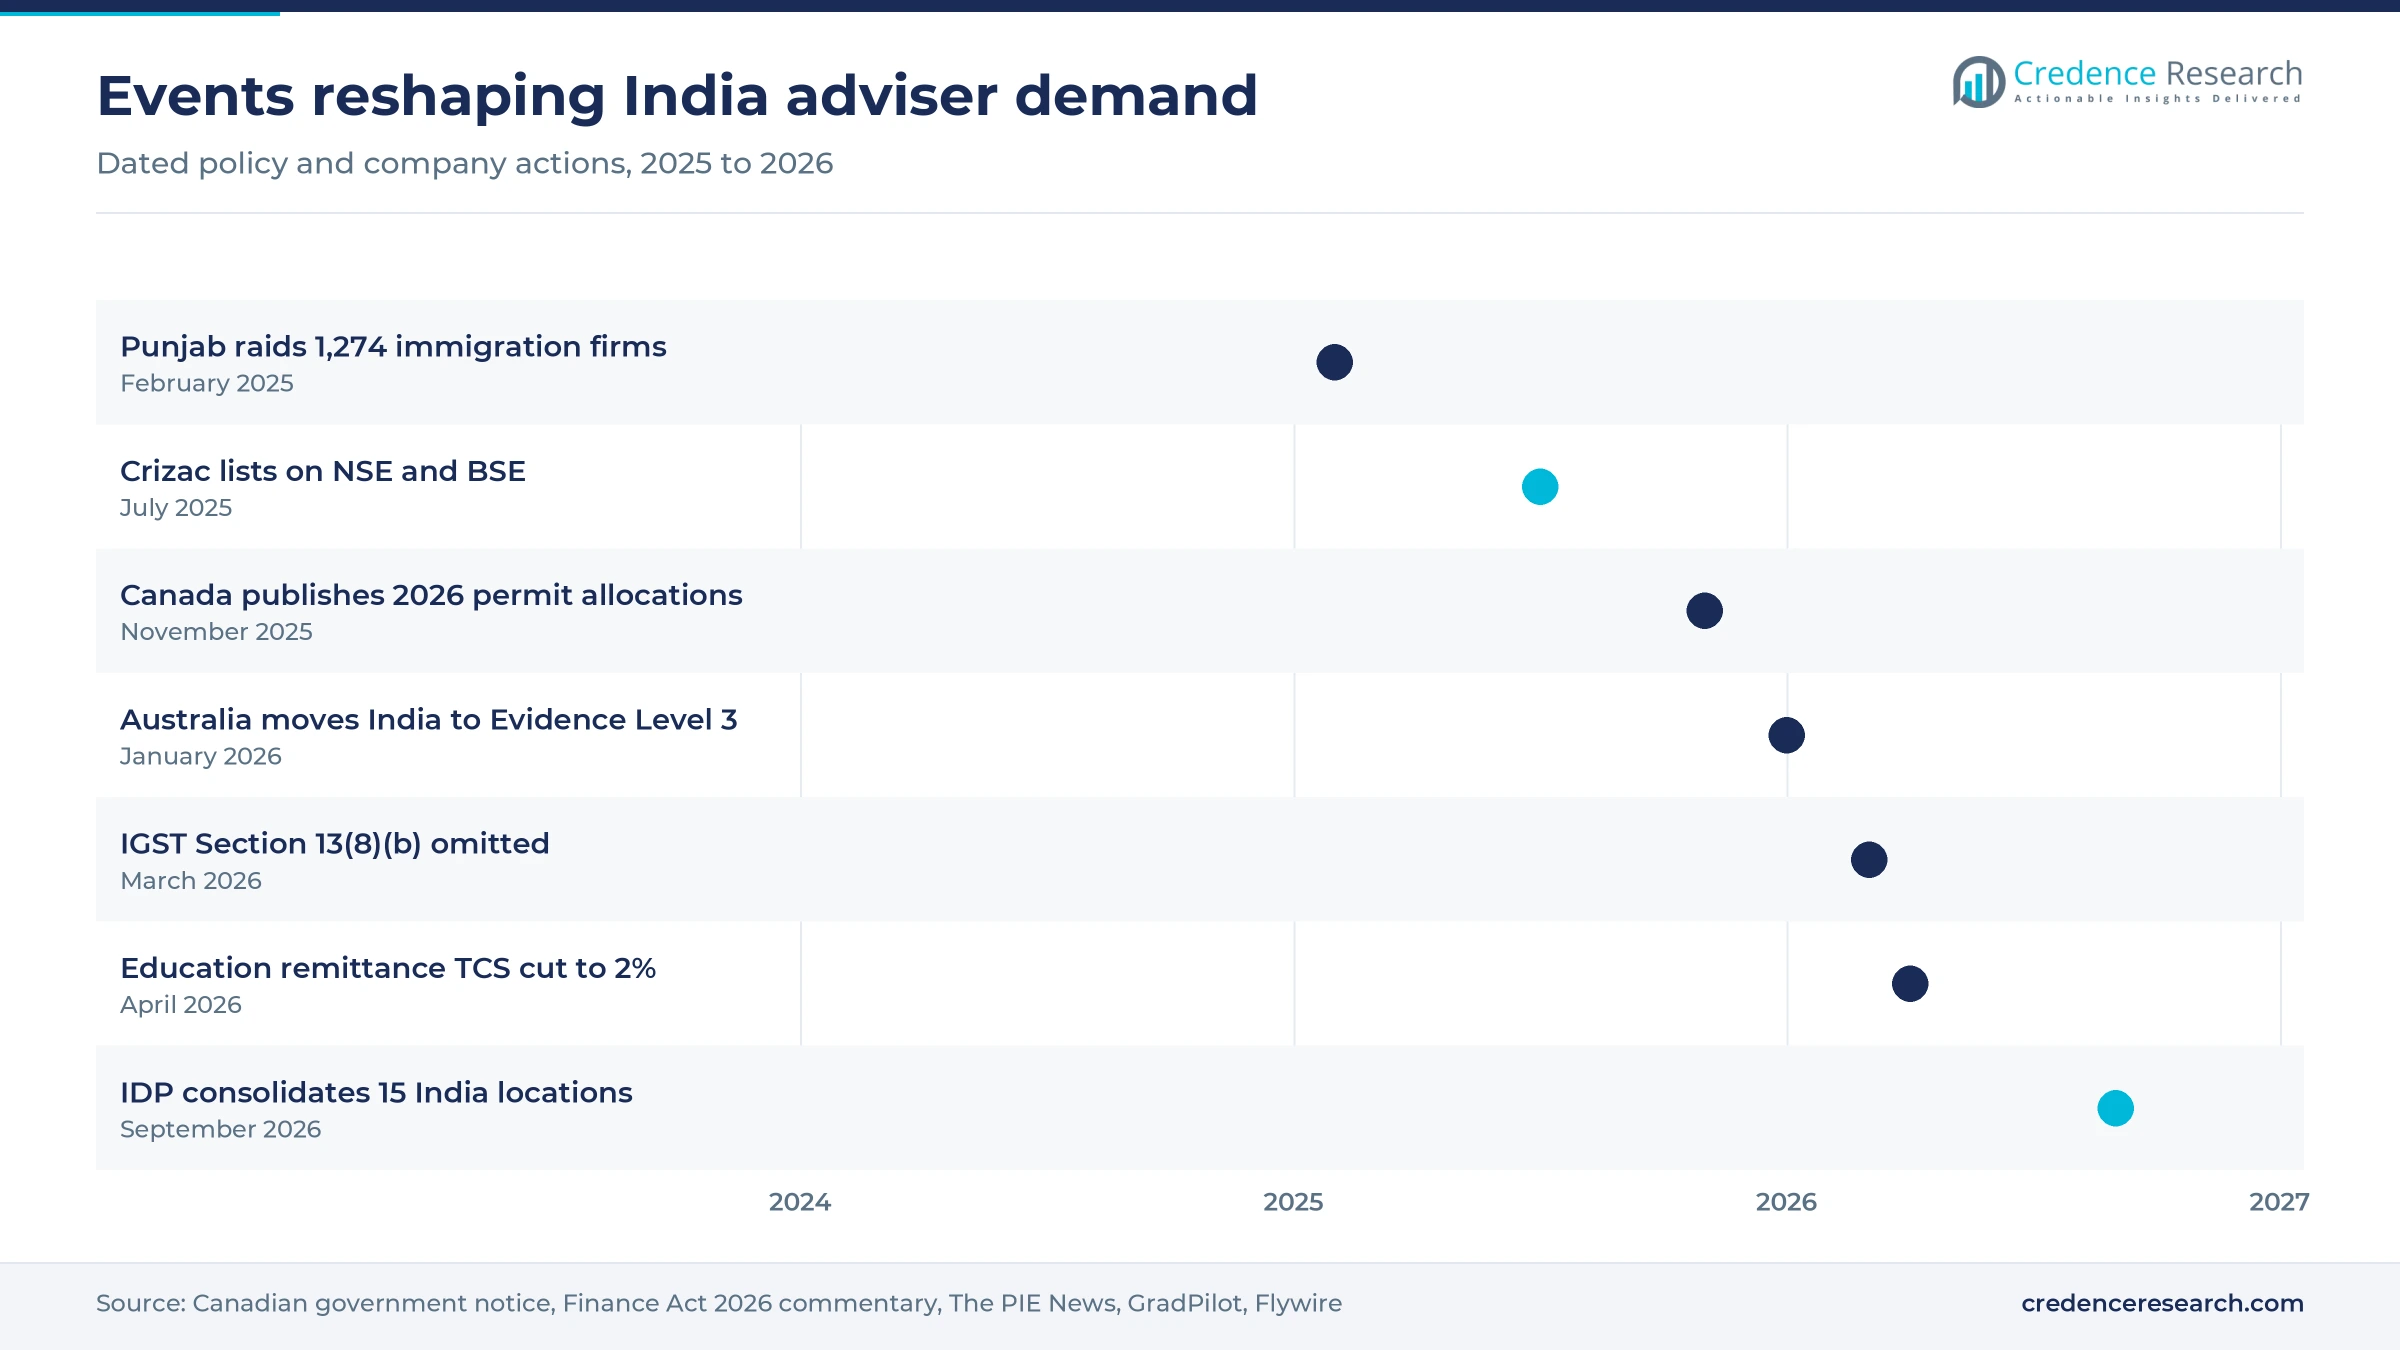
- The Finance Act 2026 omitted the place-of-supply rule behind GST on agent commissions, with effect from March 30, 2026, which improves adviser economics on foreign invoices.
- IDP Education is folding 15 Indian placement locations into larger offices, while Leverage Edu explores pre-IPO funding, so scale is moving toward well-capitalized advisers.
U.K. files and university commissions anchor adviser income
Why the U.K. leads and Germany grows fastest
Based on destination, the market is categorized into U.S., U.K., Canada, Australia, Germany and others. The U.K. led with 27.0% of 2025 value because commission-paying admissions stayed large there, with 95,231 sponsored study visas going to Indian main applicants in the year to December 2025, according to Home Office figures cited by GradPilot. Germany grows fastest at 10.70% a year because adviser files are following enrollment there, and DAAD India counted 69,816 Indian students in winter semester 2025/26, up 17.5% in one year. Advisers therefore now sell multi-country shortlists rather than single-destination files.
Commissions remain the main income line for advisers
Based on revenue, the market is categorized into university commissions, student fees and loans/visa add-ons. University Commissions led with 57.0% of 2025 value because partner universities pay consultants about 10% of the first-year tuition fee, according to a Delhi-based consultant quoted by Outlook in July 2025. Student fees form a second stream, as Yocket lists Premium counseling plans from Rs 59,999 to Rs 134,999. Loans/Visa Add-Ons grow fastest at 7.47% a year because they widen income per file, and Inc42 reported in October 2026 that fintech, housing, travel and career services form 25% to 33% of the Leverage Edu sales mix.
Offline counters still close most adviser mandates
Based on channel, the market is categorized into online platforms and offline agents. Offline Agents led with 66.0% of 2025 value because local counters remain the usual route for families, and The PIE News reported in September 2026 that IDP Education will retain 52 Indian offices even after consolidating 15 locations. Crizac also recruits through more than 10,000 agents, according to the same publisher. Online Platforms grow fastest at 7.41% a year because app-led models are scaling, as Inc42 reported that Leverage Edu added over 55,000 students in FY26 and Yocket states it has more than 1 million registered users.
| Segment Group | Leading Sub-segment | Share, 2025 | Fastest-growing Sub-segment | CAGR, 2026–2035 |
|---|---|---|---|---|
| By Destination | U.K. | 27.0% | Germany | 10.70% |
| By Revenue | University Commissions | 57.0% | Loans/Visa Add-Ons | 7.47% |
| By Channel | Offline Agents | 66.0% | Online Platforms | 7.41% |
Request a Free Sample
Fill in your details and we'll send you a free sample report.
- Sample data tables & charts
- Research methodology
Visa friction and costlier files are raising advisory value
Outbound applications keep counseling pipelines large
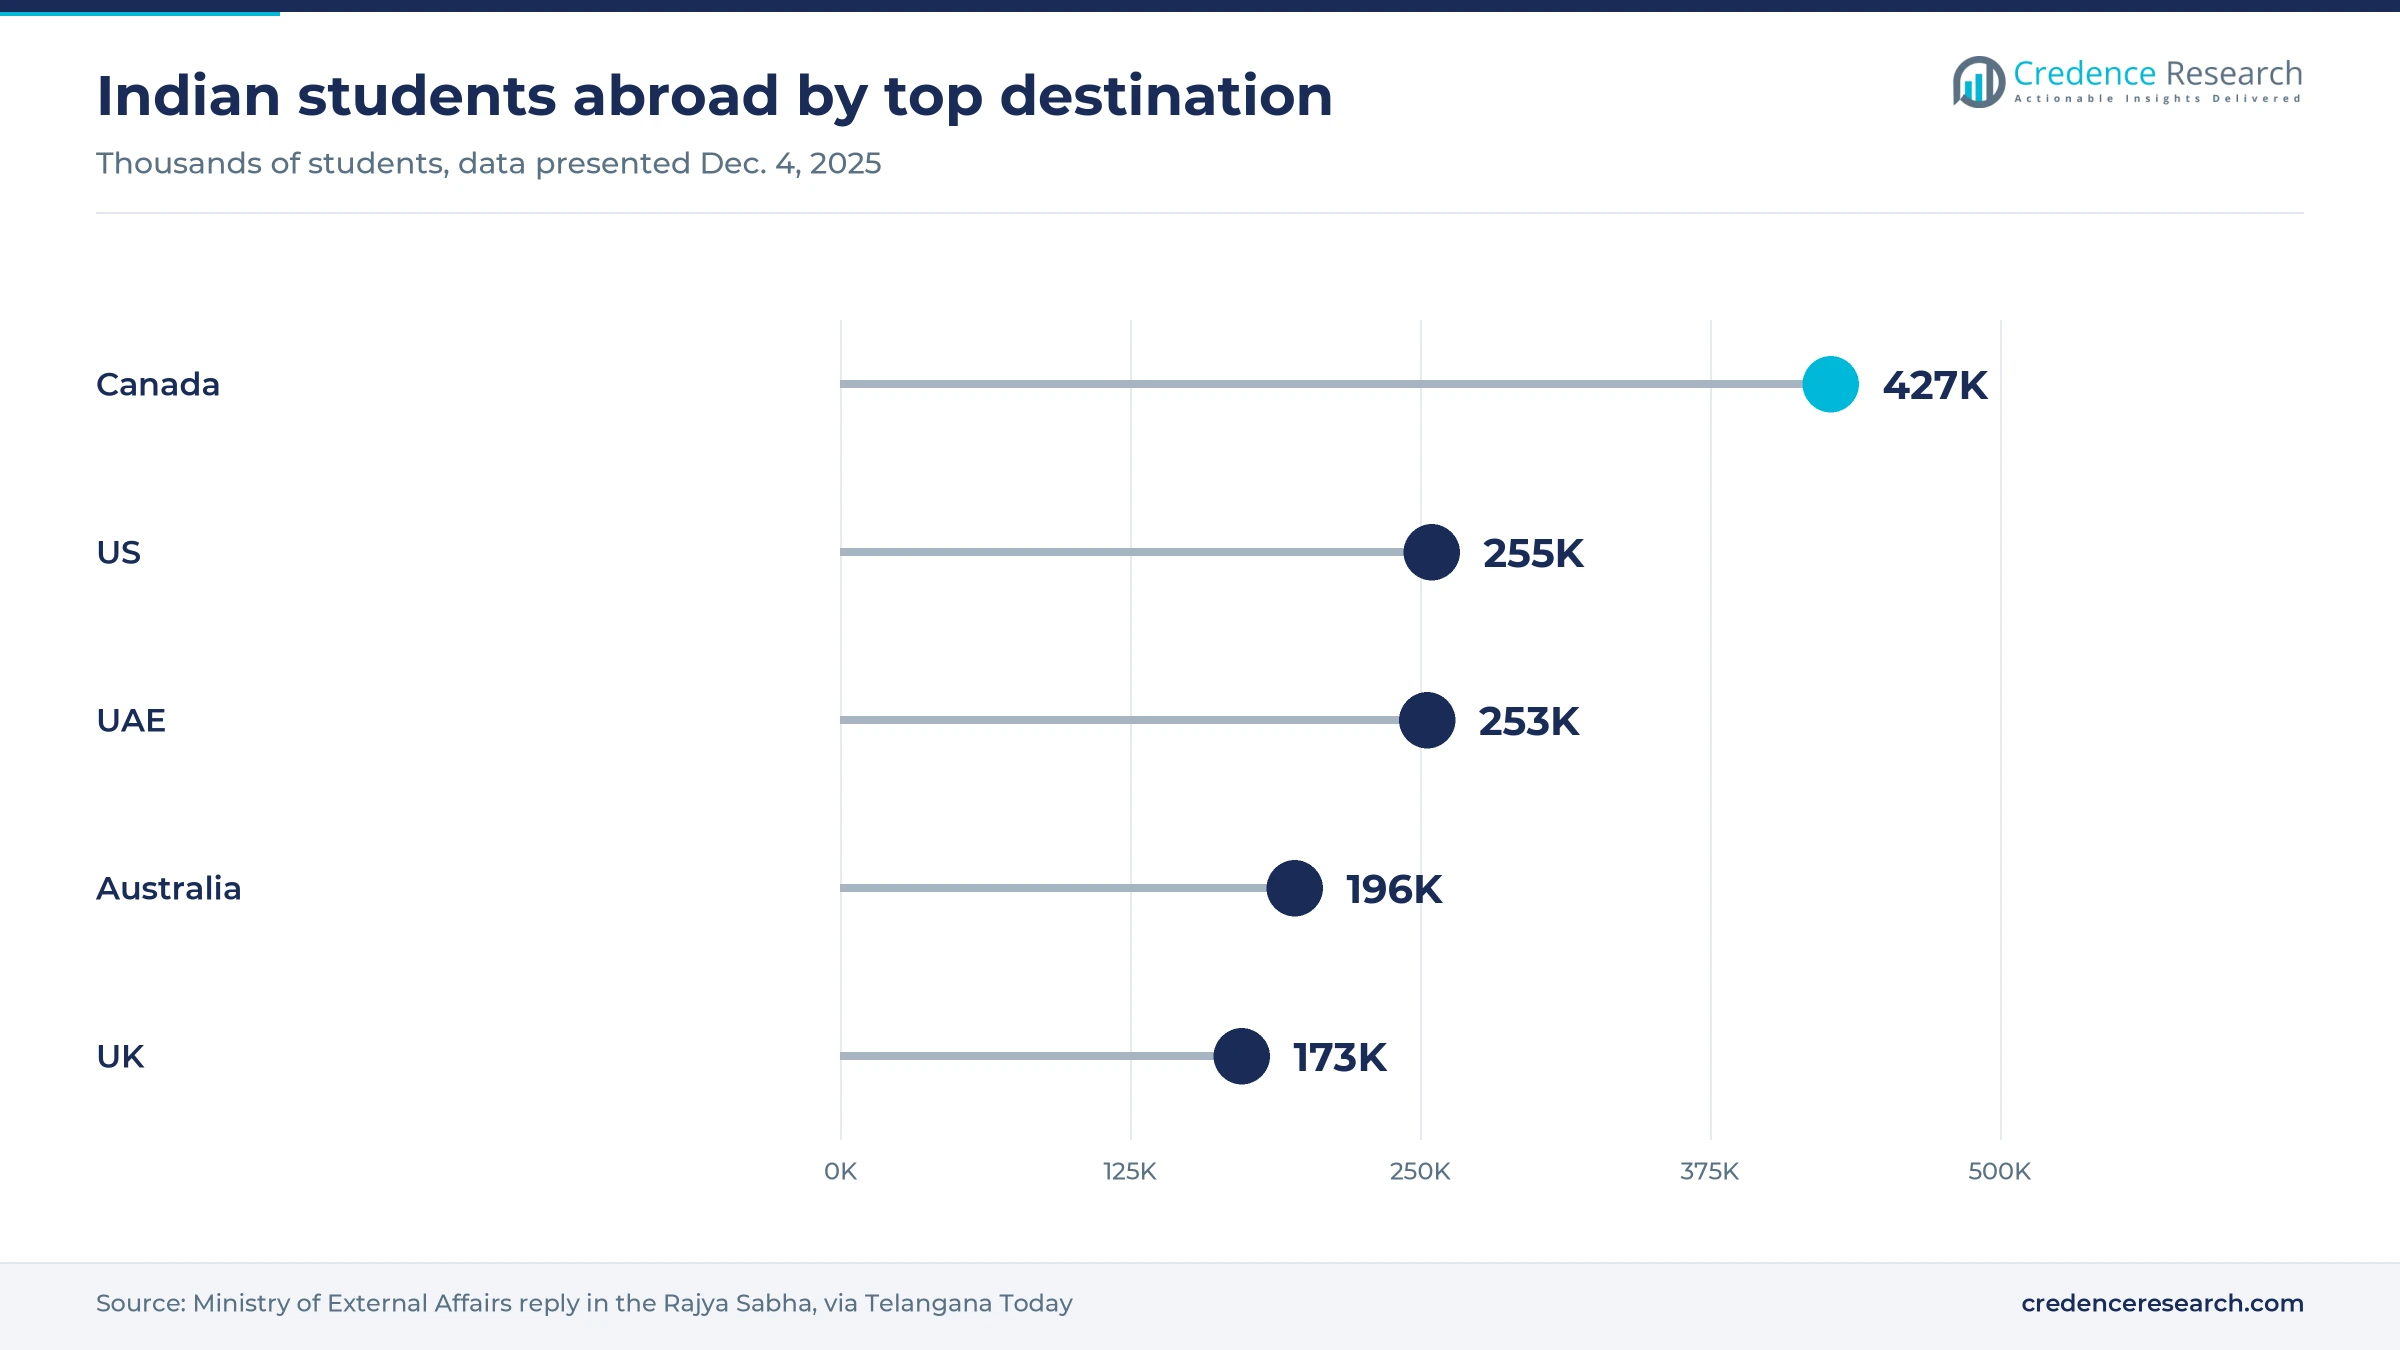
Outbound applications remain the base of adviser income, even after a sharp decline from the 2023 peak. The Ministry of External Affairs told the Rajya Sabha on Dec. 4, 2025, that over 1.88 million Indian students were studying in 153 countries, according to Telangana Today. The Bureau of Immigration still recorded 626,000 departures for study in 2025, according to GKToday, which keeps a large cohort in active counseling. Demand also moves quickly between corridors, because Business Standard reported that Indian applications for Australian student visas rose 36% year on year in February 2026. In the Credence Research model this driver adds about 2.3 percentage points to annual growth to 2035, mainly through repeat application cycles.
Admission and visa complexity raises advisory value
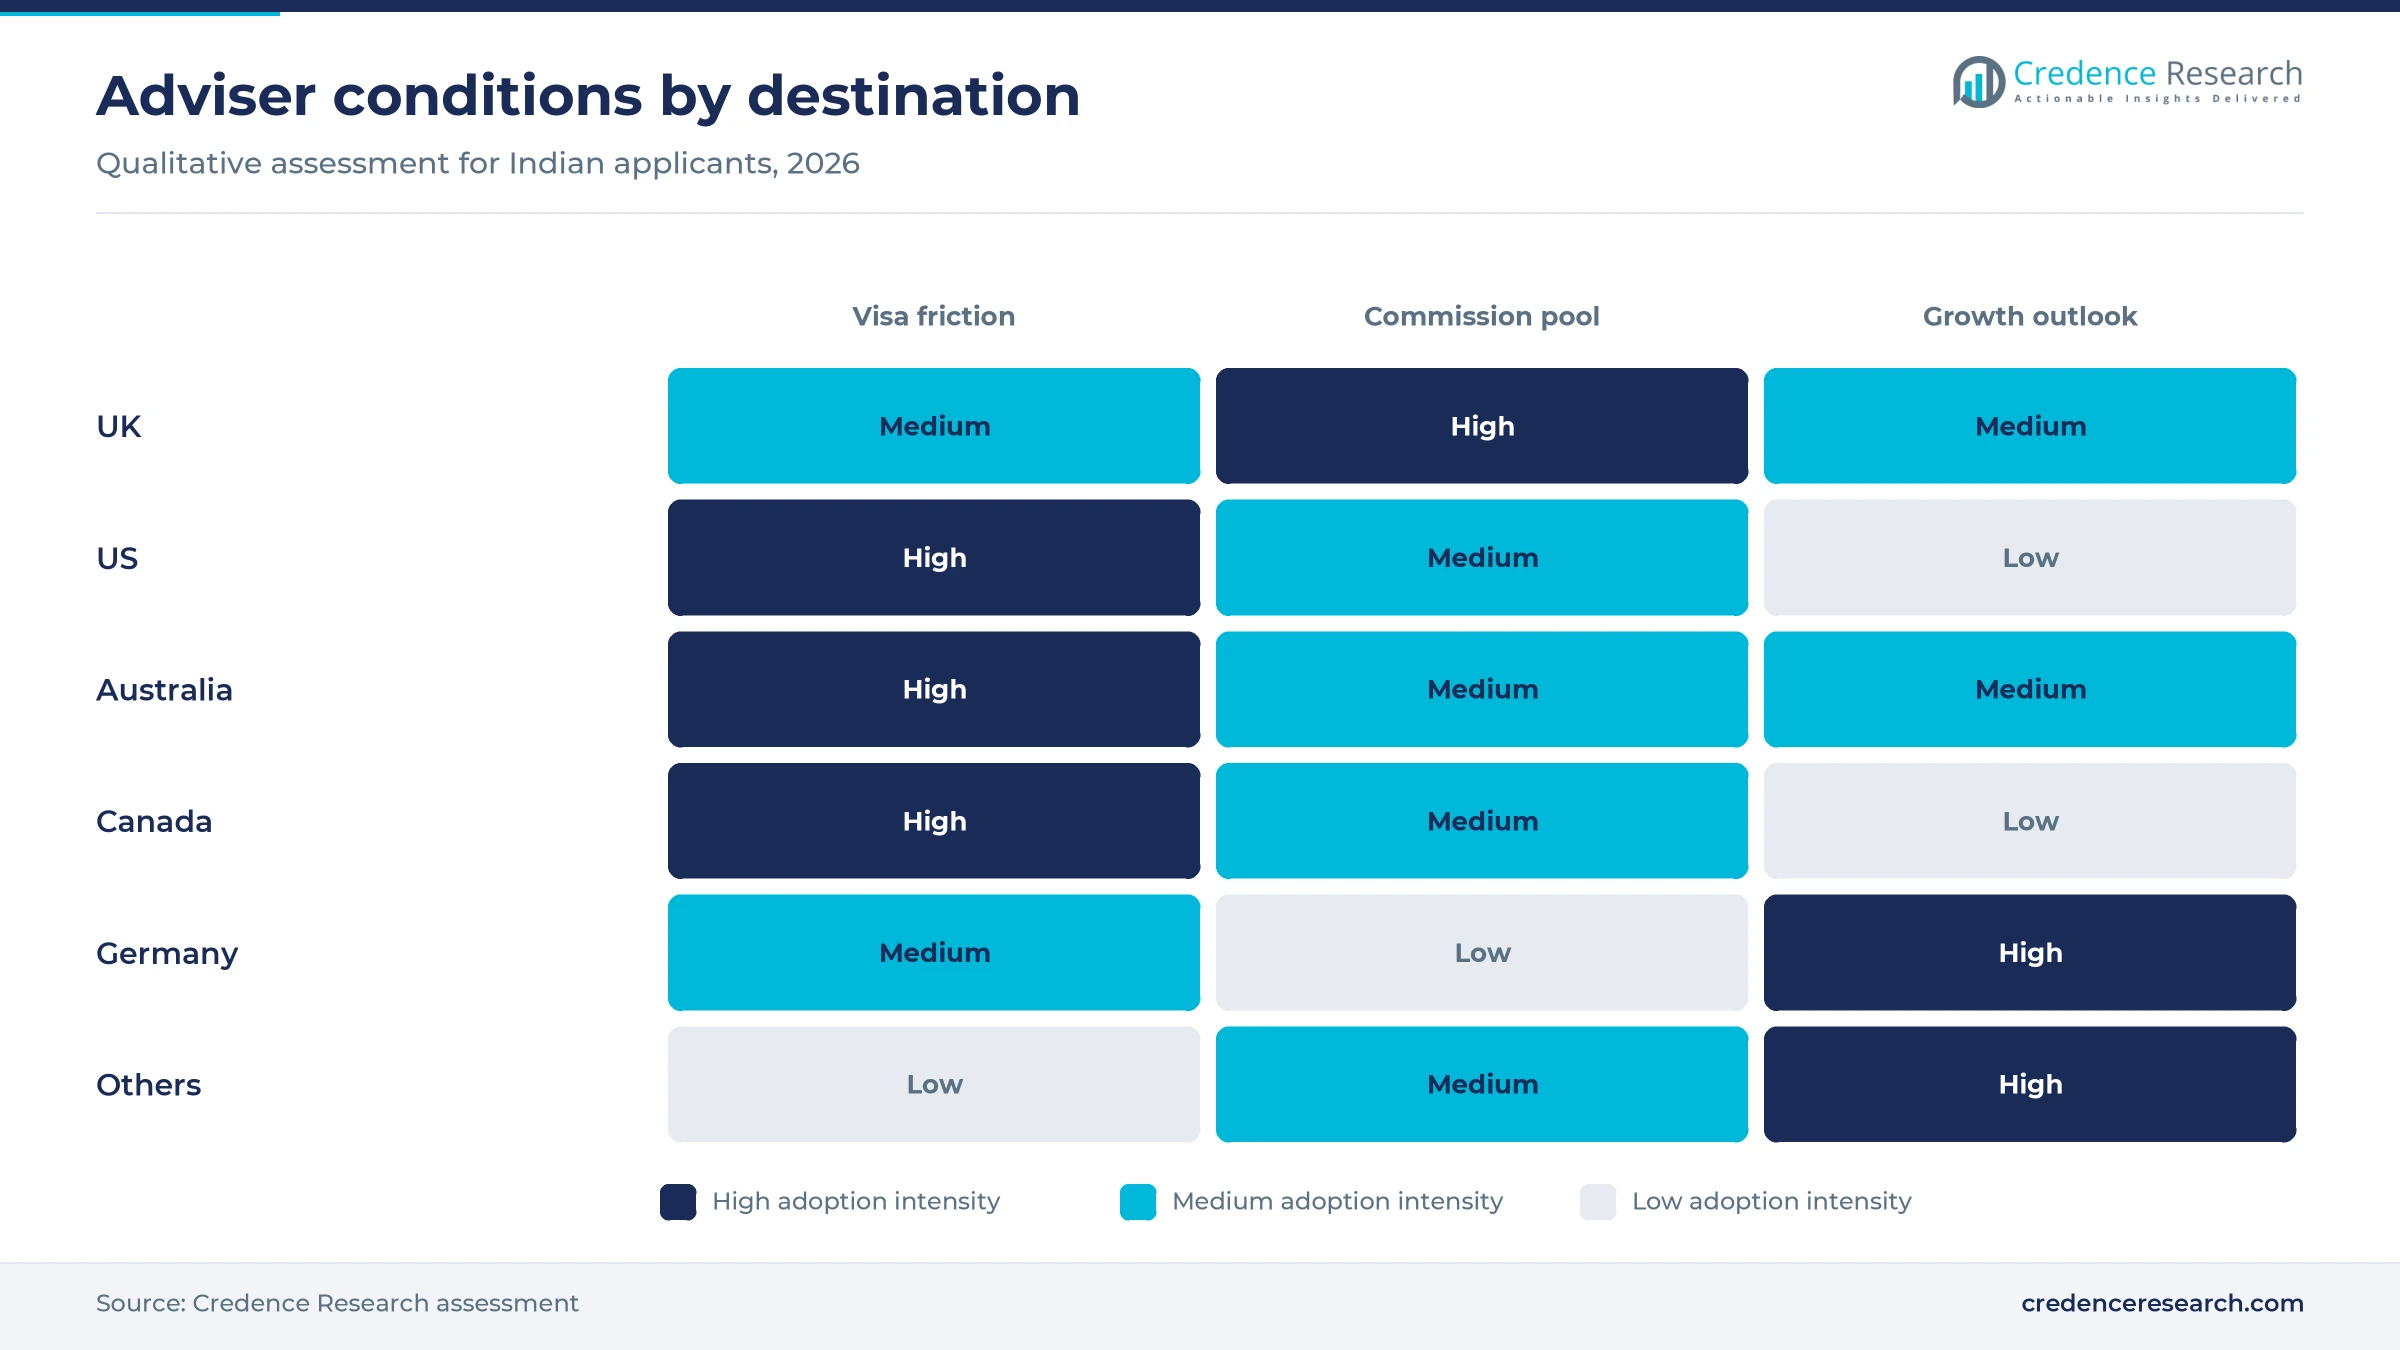
Tighter destination rules make an experienced adviser more valuable, because a weak file now costs a family far more. Canada planned 408,000 study permits for 2026, including 155,000 for new arrivals, and it accepts only 309,670 capped applications for processing. Australia moved India to Evidence Level 3 in January 2026, its highest-risk tier for student visas, according to Business Standard. In the U.S., F-1 visas to Indians fell to 22,149 in May to August 2025 from 58,694 a year earlier, according to Business Standard. A rejected or delayed file can cost a family a full intake, which strengthens the case for paid education consulting. In the Credence Research model this driver adds about 1.7 percentage points to annual growth to 2035.
Premium test-prep and application bundles lift fees
Bundled packages raise fee realization because families now pay for preparation, shortlisting and filing together. Outlook reported in July 2025 that consultants charge Rs 50,000 to Rs 4.5 lakh per student, a wide range that reflects service depth. Yocket pairs its counseling plans with GRE, GMAT and IELTS preparation, while Leverage Edu sells IELTS and TOEFL courses through dedicated language learning apps. Pricing evidence supports the shift, since IDP Education reported 11% yield growth in its global student placement business for FY26 although volumes fell 27%, a company-wide figure with no India split, according to its Aug. 20, 2026, results statement. In the Credence Research model this driver adds about 1.1 percentage points to annual growth to 2035.
Tax relief and loan access lower the cost of going abroad
Lower upfront cost keeps marginal applicants in the pipeline, which sustains adviser mandates in smaller cities. Flywire notes that tax collected at source on self-funded education remittances above Rs 10 lakh fell to 2% from 5% on April 1, 2026, and that loan-funded remittances from specified lenders carry none. Credit access has expanded as well, since The Tribune reported that non-bank education loan assets reached Rs 64,000 crore in fiscal 2025 after growing 48%. Newer fintech lenders and arrangers also feed this flow, and Yocket advertises loans of up to Rs 1.5 crore through more than 30 partner lenders.
Germany, small cities and loan bundles reshape the pipeline
Shift from the big four toward European and Asian options
Advisers are rebuilding portfolios around destinations outside the U.S., U.K., Canada and Australia. An upGrad survey cited by Reuters in September 2025 found the U.S. share of its Indian students fell to 47% in fiscal 2025 from 60% a year earlier. The PIE News reported in April 2026 that Indian students in Ireland reached 9,175 in 2024/25, while France hosts about 10,000 and targets 30,000 by 2030. The same report said students weighing several destinations rose to 35% to 40% from 10% to 15%. The OECD reported in September 2026 that India moved from third to first among origin countries for Germany between 2015 and 2024. This spread adds work per file, and it explains why the others group grows faster than the older corridors in this estimate.
Rise of tier-two and tier-three cities in adviser networks
Agency networks are moving toward smaller cities, where families have less access to reliable admission guidance. An upGrad survey from 2023, cited by Outlook, found 80% of aspiring applicants came from non-metro towns and 44% of its overseas students came from smaller cities. Consultants in the same survey reported 50% to 100% growth in tier-two applications since 2020. Meerut now has dozens of advisory firms where it once had a handful of small offices, according to that report. Intra Overseas Education was also opening branches in Lucknow and Agra at that time, which shows how mid-size agencies are following this demand into smaller markets.
Opportunity in bundling loans, remittances and housing
Advisers with lender and payment ties have an opening to earn more from each admitted student. RBI data reported by AskFuzz show studies-abroad remittances under the Liberalised Remittance Scheme of USD 2.3 billion in FY26, a large flow that passes through a few decision points. Payment providers such as Flywire already compete for this digital remittance traffic with tax guidance aimed at Indian parents. Yocket Finance shows the adviser version of the model, because it arranges loans through more than 30 partners. GradPilot, citing a TechCrunch interview from Oct. 1, 2025, reports platform businesses at about 25% of the Leverage Edu mix, which indicates room for smaller agencies.
Opportunity for agencies after GST relief and new capital
Larger Indian agencies have an opening to consolidate as tax rules and capital markets improve. Grant Thornton notes that the Finance Act 2026 omitted Section 13(8)(b) of the IGST Act from March 30, 2026, and Global Reach says agents had previously added 18% GST to invoices for foreign universities. Public investors have also accepted the model, since Crizac listed in July 2025 after an Rs 860 crore share sale, according to The PIE News. Inc42 reported in October 2026 that Leverage Edu is exploring an Rs 500 crore pre-IPO round. Agencies with clean compliance records can use this backdrop to buy local counters that struggle after volumes fall.
Visa refusals, lower volumes and fraud pressure advisers
High visa refusal rates undermine adviser promises
Refusals hurt advisers directly because commissions usually depend on enrollment, not on the application alone. The PIE News reported in April 2026 that the U.S. study visa refusal rate for Indians stood at 61%. Business Standard reported that about 40% of Indian applicants for Australian student visas were refused in February 2026. Small agencies carry the most exposure since they have few destinations to fall back on. Stronger pre-filing checks can reduce the damage, although they also lengthen each counseling cycle.
Falling departures shrink the commission base
Volume has dropped faster than most agency cost bases can adjust. Bureau of Immigration data presented in the Rajya Sabha show departures for study fell about 31% between 2023 and 2025, according to GKToday. IDP Education now plans for market volumes across its destinations, not India alone, to be 20% to 30% below FY26 in FY27, according to The PIE News in September 2026. Network owners are responding by merging offices, which leaves local staff and sub-agents most exposed. Diversifying destinations and add-on services offers education consulting firms only partial protection against this fall.
Fraud cases damage trust in small immigration agents
Fraud raises compliance costs and weakens trust in legitimate advisers across the sector. Punjab police raided 1,274 immigration firms on Feb. 24, 2025, registering 24 cases and arresting seven people, according to The Tribune. Chandigarh police also recorded 433 immigration fraud cases from 2021 to 2025, involving nearly Rs 74 crore and 232 fraudulent firms, according to The PIE News. These cases affect legitimate education consulting firms in the same cities, because families cannot easily separate them from offenders. Published partner lists and clear contracts offer the clearest mitigation for agencies.
Tighter funding tests make applications harder to complete
Rising proof-of-funds rules and slower lending reduce the number of files that reach enrollment. Outlook reported that the Canadian proof-of-funds requirement rose to CA$20,635, more than double the older CA$10,000 level. The Tribune also reported that U.S. disbursements by non-bank education lenders fell 30% in fiscal 2025, while the U.S. was still 50% of their portfolios. Education consulting firms can respond with lower-cost destinations and earlier funding checks, although that usually reduces commission per student and it lengthens counseling time.
South and West India hold most of the adviser fee pool
| Region | Value, 2025 (USD million) | Share, 2025 | CAGR, 2026–2035 |
|---|---|---|---|
| South India | 177.5 | 33.0% | 5.91% |
| West India | 155.9 | 29.0% | 6.01% |
| North India | 129.1 | 24.0% | 5.61% |
| East India | 37.6 | 7.0% | 6.71% |
| Central India | 26.9 | 5.0% | 7.01% |
| Northeast India | 10.8 | 2.0% | 6.61% |
South India leads on its large state outbound cohorts
South India held 33.0% of 2025 value and grows at 5.91% a year. MEA passport-based data reported by Kashmir Life put students abroad from Andhra Pradesh at over 240,000 in 2016 to 2020, with Tamil Nadu above 159,000 and Kerala above 113,000. These long-running cohorts give the zone its deep base of adviser files and repeat referrals. The PIE News named Kerala and Andhra Pradesh and Telangana among states with sharper slowdowns in 2026, which limits growth here.
West India pairs the largest state cohort with strong outflow
West India held 29.0% of 2025 value and grows at 6.01% a year. Maharashtra alone sent over 240,000 students abroad in 2016 to 2020, according to the same MEA data, and The Federal reported in October 2023 that the state and Gujarat held about 12.5% and 8% of outbound students. Mumbai also hosts app-led advisers, since Yocket has its headquarters there. Fee-based premium packages therefore find a stronger audience here than in most other zones.
North India rests on Punjab, Delhi and new small-city demand
North India held 24.0% of 2025 value and grows at 5.61% a year. Punjab sent over 256,000 students abroad in 2016 to 2020, the highest count in the MEA data. Agencies here remain tied to the Canadian corridor, since AECC schedules a Canada Education Fair starting in Ludhiana on Dec. 3, 2026. That corridor has weakened, as study permits for Indians fell to 94,605 in 2025 from 188,715 in 2024, according to The Tribune, so growth here trails other zones.
East India grows from a small base with state scholarships
East India held 7.0% of 2025 value and grows at 6.71% a year, from a base that remains small relative to its population. Public funding is widening access, because Odisha launched the Videsh Siksha Bruti scheme in November 2025 with 50 scholarships a year worth up to Rs 25 lakh each for SC and ST students. The numbers are modest, but admission must come from a Top 200 QS-ranked university, which rewards advisers who know the state rules.
Central India is the fastest-growing adviser market
Central India held 5.0% of 2025 value and grows at 7.01% a year, the fastest rate among the zones in this estimate. Madhya Pradesh opened its Overseas Scholarship Scheme 2026-27 with a May 25, 2026, deadline and a Rs 6 lakh family income cap, according to CareerIndia. Non-metro applicants also dominate adviser pipelines nationally, according to the upGrad survey, so this zone gains as agencies extend their networks. Growth starts from a low base, which keeps its absolute contribution small.
Northeast India stays small but draws regular exhibitions
Northeast India held 2.0% of 2025 value and grows at 6.61% a year, the smallest pool among the six zones. Guwahati anchors this market, since the Assam Tribune reported that Global Reach held a Study Abroad Exhibition there on April 26, 2026, and that its branch dates from 2005. Australian universities featured among the named attendees at that event. Advisers in this zone serve a thin student base, so most rely on periodic fairs instead of permanent counters.
Listings, tax changes and office cuts marked 2025 and 2026
| Development | Status and market relevance |
|---|---|
| In February 2025, Punjab police raided 1,274 immigration firms in one statewide action, according to The Tribune. | Completed; raises compliance scrutiny for agents in the state |
| In July 2025, Crizac listed on India's NSE and BSE after an Rs 860 crore offer for sale. | Completed; gives investors a listed student recruitment reference in India |
| In November 2025, Canada published its 2026 allocations, with 408,000 study permits expected including extensions. | In force; narrows new-arrival files for advisers |
| In March 2026, the Finance Act 2026 omitted Section 13(8)(b) of the IGST Act on intermediary services. | In force; agents can treat foreign commissions under general place-of-supply rules |
| In September 2026, IDP Education said it will consolidate 15 Indian student placement locations into nearby larger offices. | Announced; IDP Education keeps 52 offices in India |
Apps now carry test prep, shortlists and funding steps
- Application apps let students compare universities and apply through one workflow, as the flagship Leverage Edu app does for foreign admissions.
- Test-prep modules sit inside adviser platforms, with Yocket Prep covering GRE, GMAT and IELTS alongside its counseling plans.
- Loan marketplaces connect applicants with lenders inside the adviser journey, with Yocket Finance listing more than 30 partner banks and non-bank lenders.
- Virtual fairs extend reach beyond branch cities, as AECC scheduled pan-India online sessions on the U.K., Dubai and Ireland for November and December 2026.
Need a Custom Version of This Report?
Tailor the scope, geography, or segments to your exact requirements.
- Custom geography or segment scope
- Direct access to our analyst team
Global networks, app-led advisers and local agents compete
Competition in education consulting splits into three groups of providers across the country. Global placement networks such as IDP Education and AECC rely on branches and university partnerships, with AECC stating more than 850 institutional partners. App-led advisers such as Leverage Edu, Yocket and upGrad Abroad acquire students online, then earn through counseling, test preparation and finance referrals. Aggregators and master agents such as Crizac supply institutions through thousands of sub-agents, while long-running firms such as Global Reach and Intra Overseas Education rely on local reputation. Rivalry centers on visa outcomes, destination breadth and partner access rather than headline price. Network owners are also cutting weaker locations, since IDP Education is merging 15 Indian sites into larger offices. Local agents remain numerous in outbound states such as Punjab, but enforcement actions and tighter visa rules favor agencies that can document their partner agreements and placement records.
Companies profiled and their roles in this market
| Company | Type | Role in the market |
|---|---|---|
| IDP Education | Global placement network | Retains 52 offices in India after consolidating 15 student placement locations in 2026 |
| Leverage Edu | App-led adviser | Added over 55,000 students in FY26 and sells IELTS and TOEFL courses plus finance and housing services |
| upGrad Abroad | Edtech study-abroad arm | Offers one-to-one counseling and visa guidance through upGrad Abroad, listing more than 300 universities |
| Yocket | App-led adviser | Mumbai-based platform offering Premium counseling, test preparation and loan arranging |
| AECC | Global placement network | Runs in-person fairs such as the Canada Education Fair from Ludhiana plus pan-India virtual sessions |
| Crizac | Listed recruitment aggregator | Works with 173 international institutions through more than 10,000 agents |
| Global Reach | Long-running Indian agency | Operates a Guwahati branch established in 2005 and regional study abroad exhibitions |
| Intra Overseas Education | Mid-size Indian agency | Has branches across India and was adding offices in Lucknow and Agra in 2025 |
Value per student matters more than headcount to 2035
Credence Research's view is that education consulting for Indian students should be judged on income per student rather than on departures. Headcount fell about 31% in two years, yet IDP Education still recorded 11% global yield growth in FY26, which suggests pricing can hold, although no India figure is published. However, the 2026 figure carries real risk because IDP Education assumes another fall in FY27. Advisers with several destinations, lender ties and clean records should take share from single-corridor agents, and the most assumption-heavy part of this estimate is how much add-on income can replace lost commissions.
How the India adviser market was sized and split
The report uses 2025 as the base year and 2035 as the forecast year. Market values come from the Credence Research model, checked against a bottom-up calculation of student departures, the share using advisers and blended income per student. Regional and segment splits in this report are all Credence Research estimates. Sources include Indian parliamentary replies, Canadian and Australian government pages, company statements and named news reports on visas, loans and agency activity. No interviews or surveys were conducted by Credence Research for this report.
Revenue recovers through mix, not a return to 2023 volumes
Education consulting revenue is likely to rebuild through mix rather than through a return to the 2023 departure peak. The market reaches USD 963.0 million by 2035, with Germany and other non-traditional corridors taking a larger share of files. Loan, visa and housing income should grow faster than commissions as platforms widen their offers. Canada and the U.S. are likely to stay constrained in the near term, since their visa and permit policies remain tight. Education consulting firms that adapt their offices and comply with tighter state enforcement will be best placed in the next decade.
Frequently Asked Questions
How big is the India overseas education consulting market?
Why is the market growing if fewer students are leaving India?
Which region leads the market?
Which destination is the largest for advisers?
How do overseas education consultants earn money in India?
What changed for agents in the 2026 tax rules?
Who are the main companies in the market?
What is the largest risk to adviser income?
Table of Content
Chapter 1 Market Segmentation
- 1.1 Segmentation Framework
- 1.1.1 Product and Service Classification
- 1.1.2 Application and End-Use Classification
- 1.1.3 Technology and Solution Classification
- 1.1.4 Customer and Distribution Channel Classification
- 1.1.5 Geographic Segmentation
- 1.1.6 Market Segment Definitions and Boundaries
- 1.2 By Destination
- 1.2.1 UK
- 1.2.2 US
- 1.2.3 Australia
- 1.2.4 Canada
- 1.2.5 Germany
- 1.2.6 Others
- 1.3 By Revenue
- 1.3.1 University Commissions
- 1.3.2 Student Fees
- 1.3.3 Loans/Visa Add-Ons
- 1.4 By Channel
- 1.4.1 Offline Agents
- 1.4.2 Online Platforms
Chapter 2 Introduction
- 2.1 Report Objectives and Scope
- 2.2 Product Definition and Industry Terminology
- 2.3 Market Inclusions and Exclusions
- 2.4 Research Process
- 2.4.1 Primary Research and Expert Interviews
- 2.4.2 Secondary Research and Source Review
- 2.4.3 Top-Down and Bottom-Up Estimation
- 2.4.4 Data Triangulation and Verification
- 2.5 Market Size Measurement Basis
- 2.5.1 2025: USD 537.7 million → 2035: USD 963.0 million
- 2.6 Historical and Forecast Reference Periods
- 2.6.1 Historical Period: 2018-2025
- 2.6.2 Base Year: 2025
- 2.6.3 Forecast Period: 2025-2035
- 2.7 Research Assumptions and Limitations
Chapter 3 Executive Summary
- 3.1 Market Snapshot and Key Findings
- 3.2 Base-Year Market Size, 2025
- 3.3 Forecast Market Size, 2035
- 3.4 Revenue and Volume Growth Outlook
- 3.5 Key Demand and Supply Indicators
- 3.6 Leading Market Segments
- 3.7 Fastest-Growing Market Opportunities
- 3.8 Regional Performance Highlights
- 3.9 Technology and Industry Transformation
- 3.10 Competitive Landscape Summary
- 3.11 Analyst View and Strategic Implications
Chapter 4 India Overseas Education Consulting Market Trends and Developments
- 4.1 Historical Industry Development, 2018-2025
- 4.2 Recent Market Trends and Developments
- 4.3 Demand and Customer Behavior Trends
- 4.4 Technology and Product Innovation
- 4.5 Artificial Intelligence, Automation and Digitalization
- 4.6 Local Manufacturing and Supply Chain Realignment
- 4.7 Industry Partnerships, Mergers and Acquisitions
- 4.8 Sustainability and Circular Economy Developments
- 4.9 Government and Private Sector Investment Trends
- 4.10 Emerging Business Models and Commercialization
- 4.11 Industry Developments and Announcements
Chapter 5 India Overseas Education Consulting Market Supply and Demand Analysis
- 5.1 Demand Trend and Consumption Analysis, 2018-2025
- 5.2 Demand Forecast, 2025-2035
- 5.3 Supply Chain Structure and Procurement Trends
- 5.4 Supply-Demand Gap and Bottlenecks
- 5.5 Import Dependence and Sourcing Structure
- 5.6 Regional Supply and Demand Concentration
Chapter 6 India Overseas Education Consulting Market Pricing Analysis
- 6.1 Pricing Structure and Measurement
- 6.2 Historical Pricing Trends, 2018-2025
- 6.3 Pricing Outlook, 2025-2035
- 6.4 Pricing by Product and Market Segment
- 6.5 Geographic Pricing Differences
- 6.6 Key Input, Energy, Labor and Logistics Costs
- 6.7 Contract Pricing and Purchasing Models
- 6.8 Pricing Sensitivity and Competitive Positioning
- 6.9 Price, Margin and Profitability Implications
Chapter 7 India Overseas Education Consulting Market Dynamics
- 7.1 Market Growth Drivers
- 7.1.1 Demand-Side Drivers
- 7.1.2 Technology and Innovation Drivers
- 7.1.3 Infrastructure and Investment Drivers
- 7.1.4 Regulatory and Policy Drivers
- 7.2 Market Restraints
- 7.2.1 Cost and Affordability Constraints
- 7.2.2 Technology and Adoption Barriers
- 7.2.3 Supply Chain and Operational Constraints
- 7.3 Market Challenges
- 7.3.1 Competitive Pressure and Margin Erosion
- 7.3.2 Skills, Infrastructure and Implementation Gaps
- 7.4 Emerging Market Opportunities
- 7.5 Market Dynamics Impact and Time-Horizon Assessment
Chapter 8 India Overseas Education Consulting Value Chain Analysis
- 8.1 Industry Value Chain Overview
- 8.2 Upstream Suppliers and Critical Inputs
- 8.3 Technology and Component Providers
- 8.4 Manufacturing or Service Delivery
- 8.5 Distribution, Channel Partners and Integrators
- 8.6 Downstream Applications and End Users
- 8.7 Value Addition and Profit Pools
- 8.8 Vertical Integration and Outsourcing
- 8.9 Supplier Concentration and Risk
- 8.10 Supply Chain Localization and Resilience
Chapter 9 India Overseas Education Consulting Market Regulations and Policies
- 9.1 Relevant Laws, Standards and Compliance Frameworks
- 9.2 Product, Service, Safety and Quality Requirements
- 9.3 Government Policies, Incentives and Subsidies
- 9.4 Imports, Exports and Trade Barriers
- 9.5 Public Procurement and Local Content Requirements
- 9.6 Data Protection, AI and Cybersecurity Compliance
- 9.7 Upcoming Policy Changes and Market Implications
Chapter 10 India Overseas Education Consulting Market Hotspots and Opportunities
- 10.1 Market Opportunity Mapping and Growth Hotspots
- 10.2 High-Growth Applications and Customer Groups
- 10.3 Underserved Markets and White-Space Opportunities
- 10.4 Emerging Technology and Product Opportunities
- 10.5 New Capacity and Investment Hotspots
- 10.6 Market Entry and Expansion Opportunities
- 10.7 Distribution and Partnership Opportunities
- 10.8 Near-Term and Long-Term Commercial Potential
- 10.9 Opportunity Attractiveness and Execution Risks
Chapter 11 India Overseas Education Consulting Market Outlook, 2025-2035
- 11.1 Market Size and Analysis
- 11.1.1 Revenue (Market Measurement: 2025: USD 537.7 million → 2035: USD 963.0 million)
- 11.1.2 Historical Market Size, 2018-2025
- 11.1.3 Base-Year Market Size, 2025
- 11.2 Market Forecast, 2025-2035
- 11.2.1 Revenue Forecast to 2035
- 11.2.2 CAGR and Year-on-Year Growth
- 11.2.3 Incremental Revenue Opportunity
- 11.3 Forecast Assumptions and Scenario Analysis
- 11.3.1 Base-Case Forecast
- 11.3.2 Optimistic and Conservative Scenarios
- 11.3.3 Technology, Pricing and Policy Sensitivities
- 11.4 Market Attractiveness and Growth Outlook
Chapter 12 India Overseas Education Consulting Market Segmentation and Outlook
- 12.1 Segmentation Summary and Market Shares, 2025
- 12.2 Largest and Fastest-Growing Segments
- 12.3 By Destination - Market Size and Forecast, 2025-2035
- 12.3.1 Segment Definition and Scope
- 12.3.2 Historical Market Size, 2018-2025
- 12.3.3 Revenue Forecast, 2025-2035
- 12.3.4 Base-Year Market Share, 2025
- 12.3.5 Segment CAGR and Growth Drivers
- 12.3.6 Subsegment Market Size and Forecast
- 12.3.6.1 UK
- 12.3.6.2 US
- 12.3.6.3 Australia
- 12.3.6.4 Canada
- 12.3.6.5 Germany
- 12.3.6.6 Others
- 12.3.7 Subsegment Pricing and Adoption Trends
- 12.3.8 Leading Suppliers and Competition
- 12.3.9 Regional Demand and Opportunities
- 12.4 By Revenue - Market Size and Forecast, 2025-2035
- 12.4.1 Segment Definition and Scope
- 12.4.2 Historical Market Size, 2018-2025
- 12.4.3 Revenue Forecast, 2025-2035
- 12.4.4 Base-Year Market Share, 2025
- 12.4.5 Segment CAGR and Growth Drivers
- 12.4.6 Subsegment Market Size and Forecast
- 12.4.6.1 University Commissions
- 12.4.6.2 Student Fees
- 12.4.6.3 Loans/Visa Add-Ons
- 12.4.7 Subsegment Pricing and Adoption Trends
- 12.4.8 Leading Suppliers and Competition
- 12.4.9 Regional Demand and Opportunities
- 12.5 By Channel - Market Size and Forecast, 2025-2035
- 12.5.1 Segment Definition and Scope
- 12.5.2 Historical Market Size, 2018-2025
- 12.5.3 Revenue Forecast, 2025-2035
- 12.5.4 Base-Year Market Share, 2025
- 12.5.5 Segment CAGR and Growth Drivers
- 12.5.6 Subsegment Market Size and Forecast
- 12.5.6.1 Offline Agents
- 12.5.6.2 Online Platforms
- 12.5.7 Subsegment Pricing and Adoption Trends
- 12.5.8 Leading Suppliers and Competition
- 12.5.9 Regional Demand and Opportunities
- 12.6 Segment Growth Comparison
- 12.7 Segment Attractiveness and Priority Matrix
Chapter 13 India Overseas Education Consulting Geographic Market Outlook, 2025-2035
- 13.1 Domestic Market Distribution and Demand Clusters
- 13.2 State- or Province-Wise Market Size and Forecast, 2025-2035
- 13.3 City and Metropolitan Market Outlook
- 13.4 Industrial, Manufacturing and Commercial Clusters
- 13.5 Geographic Concentration of Key End Users
- 13.6 Local Pricing and Purchasing Differences
- 13.7 Domestic Production Facilities and Capacity Map
- 13.8 Local Infrastructure and Project Pipeline
- 13.9 State-Level Policy and Incentive Differences
- 13.10 Subnational Investment Hotspots and Opportunities
- 13.11 Distribution and Logistics Networks
- 13.12 Domestic Competitive Footprint
Chapter 14 India Overseas Education Consulting Technology, Innovation and Sustainability Outlook
- 14.1 Technology Landscape and Maturity
- 14.2 Product, Process and Service Innovation
- 14.3 AI, Automation and Digital Tools in the Industry
- 14.4 Technology Adoption and Performance Benchmarking
- 14.5 Innovation Pipeline and R&D Investment
- 14.6 Energy Efficiency and Resource Management
- 14.7 Sustainability, Recycling and Circularity
- 14.8 Technology Roadmap, 2025-2035
- 14.9 Risks of Obsolescence and Technology Substitution
Chapter 15 India Overseas Education Consulting Market Key Strategic Imperatives
- 15.1 Growth and Market Entry Priorities
- 15.2 High-Return Products and Segments
- 15.3 Pricing, Profitability and Cost Optimization
- 15.4 Technology Investment and Product Differentiation
- 15.5 Supply Chain Localization and Resilience
- 15.6 Distribution and Customer Acquisition
- 15.7 Partnership, Acquisition and Capacity Strategy
- 15.8 Regional Expansion Priorities
- 15.9 Short-, Medium- and Long-Term Actions
Chapter 16 Competition Outlook
- 16.1 Industry Competition Characteristics
- 16.2 Market Structure and Concentration
- 16.3 Market Share and Competitive Positioning, 2025
- 16.4 Company-Wise Revenue and Product Benchmarking
- 16.5 Production and Service Capacity Benchmarking
- 16.6 Technology, Pricing and Differentiation
- 16.7 Regional Footprint and Distribution Strength
- 16.8 Mergers, Acquisitions and Strategic Alliances
- 16.9 New Entrants and Competitive Threats
- 16.10 Porter's Five Forces and Industry Attractiveness
- 16.11 Competitive Outlook, 2025-2035
Chapter 17 Company Profiles
- 17.1 Company Coverage and Selection Criteria
- 17.2 IDP Education
- 17.2.1 Business Description
- 17.2.2 Company Ownership and Geographic Presence
- 17.2.3 Product and Service Portfolio
- 17.2.4 Manufacturing and Operating Footprint
- 17.2.5 Financial Performance and Investment
- 17.2.6 Market Share and Competitive Position
- 17.2.7 Technology and Innovation Capabilities
- 17.2.8 Strategic Alliances or Partnerships
- 17.2.9 Recent Developments
- 17.2.10 Growth Strategy and Outlook
- 17.3 Leverage Edu
- 17.4 upGrad Abroad
- 17.5 Yocket
- 17.6 AECC
- 17.7 Crizac
- 17.8 Global Reach
- 17.9 Intra Overseas Education
- 17.10 Other Relevant Market Participants
Note: Every listed company is profiled on the structure shown under the first company. The company list is preliminary and may change based on research findings, market developments, data availability and client requirements.
Chapter 18 Disclaimer
- 18.1 Research and Forecast Disclaimer
- 18.2 Data Source and Estimation Limitations
Note: The depth of individual sections depends on data availability for this market. Volume, capacity, trade and other unit-based metrics are included where applicable.