
Water costs and metering rules shape farm software buying
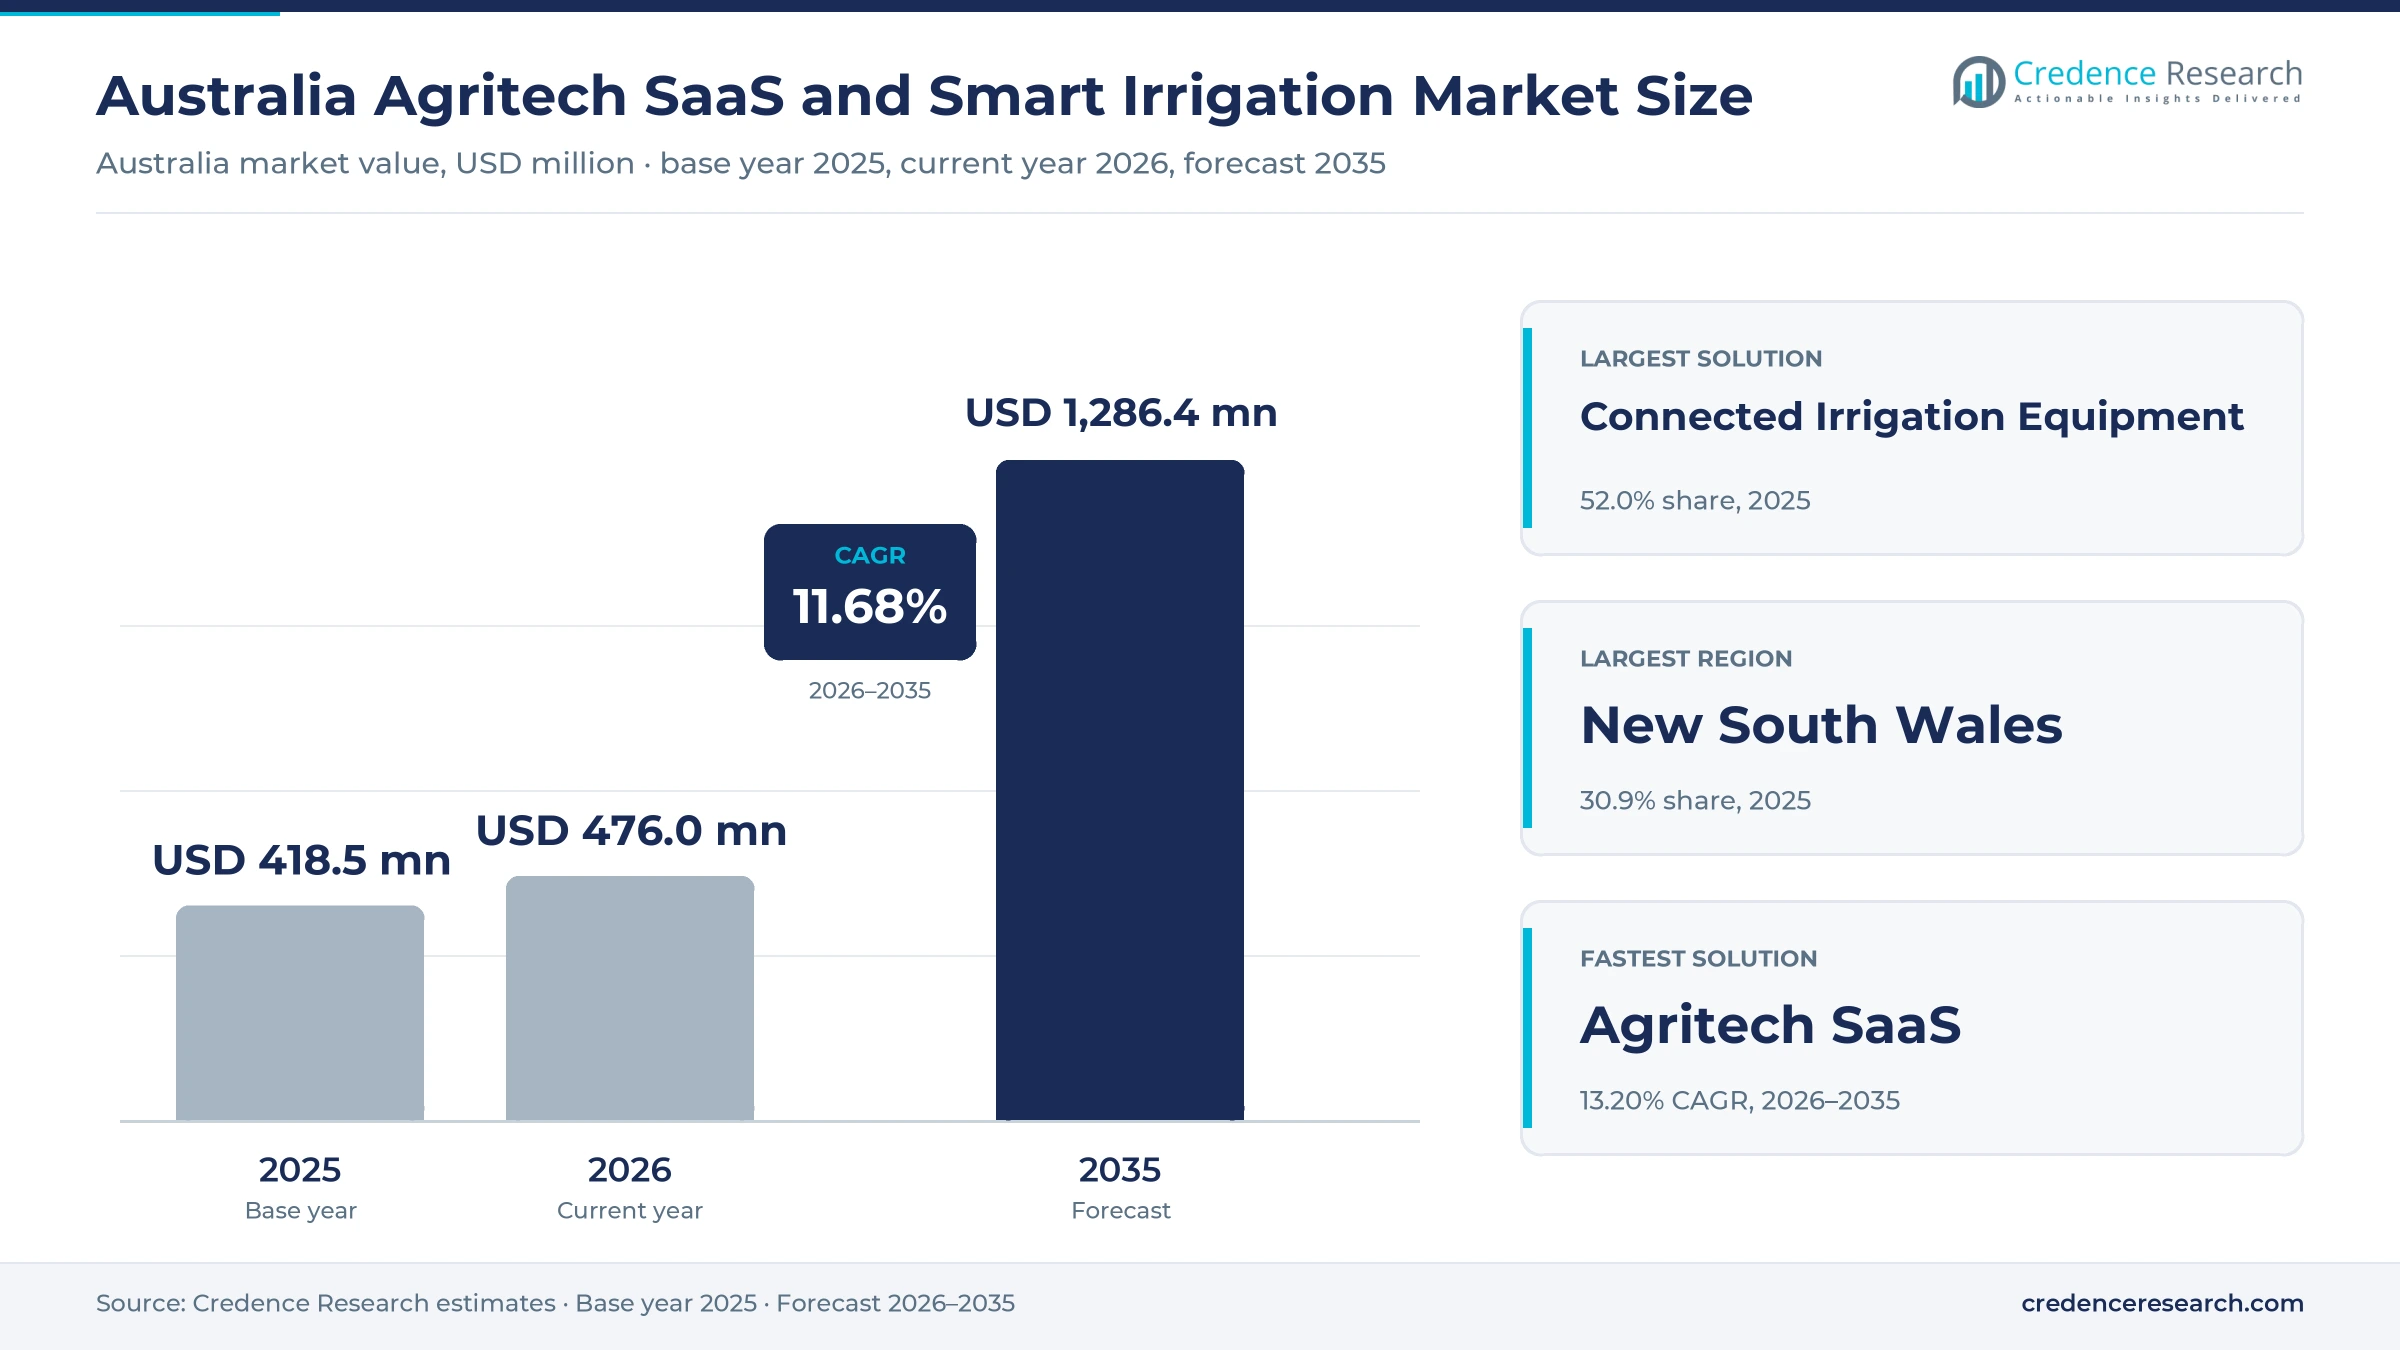
The Australia agritech SaaS and smart irrigation market was valued at USD 418.5 million in 2025 and is projected to increase from USD 476.0 million in 2026 to USD 1.29 billion by 2035, registering a CAGR of 11.68% during 2026–2035. Spending is concentrated among irrigators who treat water as a priced input, and among livestock producers who must now record individual animal movements. New South Wales held the largest regional share, 30.9% in 2025, because it consumes the most agricultural water of any state and is also rolling out mandatory telemetry on licensed works. Western and Southern Territories is the fastest-growing region at 12.07% a year, supported by new irrigation schemes in Tasmania and on-farm upgrade grants in Western Australia. Federal connectivity rebates have also lowered the entry cost of sensors, gateways and pump controllers for many mid-sized producers. The buying decision has therefore moved from standalone hardware toward connected systems that combine field equipment, cloud software and compliance records.
What does the Australian farm software and connected watering market include?
The market counts farm management subscriptions, connected irrigation hardware, scheduling software and related services sold to Australian producers, turf managers and irrigation operators. Buyers usually purchase through local dealers, approved suppliers or direct software contracts, often combining a capital purchase with a recurring data plan.
Conventional pipe, pumps and manual timers without remote connection are excluded, as are general telecommunications services and farm machinery that has no water or record-keeping function. The value chain runs from sensor and controller manufacturers through dealers and integrators to the producers, councils and sports grounds that operate the systems.
Australia Agritech SaaS and Smart Irrigation Market Insights
- The market moves from USD 418.5 million in 2025 to USD 1.29 billion by 2035, an 11.68% annual pace built on metering rules, water costs and recurring software contracts.
- New South Wales held 30.9% of 2025 value, reflecting the largest agricultural water use in the country and a statewide telemetry program.
- Connected Irrigation Equipment led with 52.0% of 2025 value, because valves, controllers and sensors remain the entry point for most irrigators.
- Mandatory sheep and goat electronic identification began on Jan. 1, 2025, which turned individual animal records into a compliance requirement for many livestock producers.
- Competition splits between water specialists and farm software platforms, and dealer reach matters because Netafim alone sells through more than 400 Australian dealers.
Connected equipment leads while subscriptions gain fastest
Why connected equipment still outsells cloud subscriptions
Based on solution type, the market is categorized into Agritech SaaS, Connected Irrigation Equipment and Irrigation Software and Services. Connected Irrigation Equipment led with 52.0% of 2025 value because rebate programs pay for hardware first, and Round 2 federal connectivity guidelines listed valve, pump and irrigation controllers while capping subscriptions at a tenth of the equipment price. Agritech SaaS grows fastest at 13.20% a year as record duties expand, since sheep and goats born from Jan. 1, 2025 need electronic tags and movement records that AgriWebb and similar platforms now capture through a phone app.
How cropping, livestock and turf buyers differ in their needs
Based on end-use industry, the market is categorized into Cropping and Horticulture, Livestock and Dairy, and Managed Turf and Public Landscapes. Cropping and Horticulture led with 61.0% of 2025 value because irrigated crops carry the highest water bills, and the Smarter Irrigation for Profit program reported 10% to 20% water productivity gains for cotton, dairy, rice and sugar irrigators. Livestock and Dairy grows fastest at 12.65% a year as the ABARES count of about 56,500 broadacre and dairy farms is 62% livestock, and many now face electronic tagging duties alongside tools for dairy herd management.
Scheduling remains the core task as record keeping accelerates
Based on application, the market is categorized into Water Scheduling and Control, Production Decision Support and Records and Traceability. Water Scheduling and Control led with 58.0% of 2025 value because water is priced and metered, and the Greater Dandenong council reported in June 2026 that web-based controllers on more than 30 sports reserves save about 30% over timers. Records and Traceability grows fastest at 12.98% a year as New South Wales requires electronic identification for all sheep and goats leaving any property from Jan. 1, 2027, regardless of age, according to the New South Wales Department of Primary Industries, which also supports wider food provenance systems.
Capital purchases dominate while recurring contracts gain ground
Based on pricing model, the market is categorized into Subscription Contracts, Capital Purchase Contracts and Managed-Service Contracts. Capital Purchase Contracts led with 54.0% of 2025 value because government support is thin and farms fund most equipment themselves, with the OECD agricultural policy review estimating producer support at 2.7% of gross farm receipts in 2022-24. Subscription Contracts grows fastest at 12.83% a year as controllers ship with data plans, and Netafim's GrowSphere FLEX launched on Aug. 13, 2026 with built-in cellular links and cloud management.
| Segment Group | Leading Sub-segment | Share, 2025 | Fastest-growing Sub-segment | CAGR, 2026–2035 |
|---|---|---|---|---|
| By Solution Type | Connected Irrigation Equipment | 52.0% | Agritech SaaS | 13.20% |
| By End-Use Industry | Cropping and Horticulture | 61.0% | Livestock and Dairy | 12.65% |
| By Application | Water Scheduling and Control | 58.0% | Records and Traceability | 12.98% |
| By Pricing Model | Capital Purchase Contracts | 54.0% | Subscription Contracts | 12.83% |
Request a Free Sample
Fill in your details and we'll send you a free sample report.
- Sample data tables & charts
- Research methodology
Water prices and rebates are pulling purchases forward
Water productivity economics reward measured irrigation
Higher water prices make every saved megaliter easier to value, and that arithmetic now justifies smart irrigation sensors and automated scheduling on many farms. The 2025 Ricardo water markets report, released on Aug. 6, 2025, showed allocation prices in major southern Basin zones ending 2024-25 between 89% and 159% higher, with a volume-weighted average of A$153 per megaliter. Entitlements were valued at an estimated A$31.9 billion in the same report, so water is a major balance-sheet asset for these farms. The Smarter Irrigation for Profit program, run across 19 farmer-managed learning sites, reported water productivity and profit gains of 10% to 20%. As a result, Water Scheduling and Control held 58.0% of 2025 value.
Connectivity-supported procurement lowers the entry cost
Federal rebates have made connected equipment affordable for producers that previously lacked a working network across the farm. The On Farm Connectivity Program paid A$13.8 million to more than 1,500 producers in Round 1 and over A$16 million to more than 1,300 producers in Round 2, according to the federal infrastructure department in June 2025. Round 2 offered a 50% rebate of up to A$30,000 per producer, and its guidelines covered soil moisture monitors, gateways, pump controllers and irrigation controllers. Farm Weekly reported in November 2024 that the A$18 million pool was exhausted within about a week, with more than 300 suppliers signed up. That response shows how much purchasing had been waiting for support.
Integrated farm software adoption follows compliance duties
Record-keeping duties are pulling producers from spreadsheets toward integrated platforms, because several rules now need the same data. Integrity Systems Company states that sheep and farmed goats born on or after Jan. 1, 2025 must carry an approved electronic device before leaving their property of birth. AgriWebb responded with app-based tag scanning and movement records that sync with the national livestock database, within the two days allowed after arrival. Global AgInvesting reported in October 2022 that AgriWebb served 16,000 farmers worldwide, which gives the platform scale for local development. PTx Trimble Ag Software, sold in South Australia with WSB Distributors, also combines data across mixed machinery fleets. These purchases sit beside broader farm management software spending by mixed farming businesses.
Public channel modernization extends automation to the farm gate
Government-funded channel upgrades have created a base of automated delivery that farm-level controllers can then connect to. Victoria's water department reports that the A$177.5 million Goulburn-Murray Water Efficiency Project recovered 15.9 gigaliters a year, upgraded or rationalized more than 1,000 outlets and modernized or decommissioned over 250 kilometers of channels. Rubicon Water, founded in Shepparton in 1995, built its Total Channel Control system on this type of network, and the Shepparton Adviser credited the technology with distribution efficiency above 90%. A National Water Grid status report dated Oct. 31, 2023 listed the A$62.6 million Macalister Irrigation District Modernisation Phase 2 and the A$22 million Werribee stages under construction, which extends the same approach across Victoria. Demand in the state therefore starts from a network where over 1,000 outlets have already been upgraded or rationalized.
Telemetry mandates and new schemes open fresh demand
Shift to satellite-based national water accounting
National water measurement has moved from farmer surveys to satellite estimates, which raises the value of accurate on-farm records as a comparison point. The Australian Bureau of Statistics water account, released on Dec. 11, 2025, put agriculture, forestry and fishing consumption at 11,760 gigaliters for 2023-24, up 14.6% on the prior year, and flagged the figures as experimental. Its companion paper explains that the Agricultural Survey and Census ended after 2021-22, and that a CSIRO method now produces monthly estimates at 100-meter resolution. The agency reports that the method typically differs from older survey data by less than 5%. Irrigators with their own meter and sensor logs can therefore test those estimates, and that comparison strengthens the case for smart irrigation records in every state.
Rise of cloud controllers sold with advisory software
Smart irrigation suppliers are bundling controllers with cloud advice, which shifts part of the sale from one-off hardware to recurring software. Good Fruit & Vegetables reported on July 1, 2025 that Netafim had brought its GrowSphere Crop Advisor to Australia, using an algorithm to recommend irrigation and fertilizer timing. Netafim then released GrowSphere FLEX on Aug. 13, 2026 with cellular links, remote fertigation control and alerts, aimed at smaller and mid-sized growers. Public turf managers are moving the same way, as Greater Dandenong now runs web-programmed controllers with flow monitoring and sensors on more than 30 reserves. As a result, Subscription Contracts is growing at 12.83% a year.
Opportunity in the New South Wales telemetry rollout
The New South Wales metering program offers suppliers a defined installation base and firm deadlines, which is rare in farm technology. Inside Water reported in 2025 that about 8,500 metered sites will receive tamper-evident telemetry, and that A$10.5 million in Commonwealth funding will cover devices and installation at more than 2,500 sites over two years. The Natural Resources Access Regulator requires coastal works with 100 megaliters or more of entitlements to comply by Dec. 1, 2026, while works holding 15 to 100 megaliters must comply by Dec. 1, 2027 or at approval renewal. Meter owners then face validation after 10 years and every five years after that. Vendors can sell scheduling and water management software onto this new data stream.
Opportunity in on-farm fit-outs for new irrigation schemes
New public schemes create customers who need connected equipment from the first season, so suppliers can win accounts before any older system is installed. Tasmanian Irrigation's May 2025 briefing valued Tranche 3 at an estimated A$1.3 billion across nine schemes, with Northern Midlands expected to deliver water in October 2026. Western Australia awarded A$4.28 million to 69 Manjimup-Pemberton horticulture businesses in November 2024 for upgrades including automation, software, probes and meters, according to FreshPlaza. Appadene Park alone received A$40,000 for drip lines on 1,500 avocado trees. These awards show how public money can seed smart irrigation demand before a scheme is fully running.
Funding limits and data trust slow wider rollouts
Rebate funding is smaller, later and quickly used
Support for connected equipment has become less predictable, and that makes farm budgeting harder for smaller producers. Round 2 funds ran out within about a week in November 2024, and Farmonline reported on Jan. 23, 2026 that Round 3 had slipped to mid-2026. Business.gov.au lists Round 3 at A$10 million with rebates capped at A$20,000, below the earlier A$30,000 cap, and now says the program has closed. Suppliers can respond with finance plans, staged installations and lower-cost entry packages for producers that miss a funding window.
Procurement delays hold back large water projects
Large water authorities buy slowly, so automation vendors can wait many months between a preferred tender and a signed contract. Kalkine Media reported on July 3, 2026 that Rubicon Water's priority tenders worth over A$30 million had not reached award, and that the company blamed customer evaluation processes rather than weak demand. These delays affect installers and subcontractors as well as the supplier itself. Vendors can reduce the exposure by building more farm-level and service income between major awards.
Farm data trust remains an unfinished issue
Many producers hesitate to load commercial records into cloud platforms when they cannot see how that data is shared or sold. The National Farmers' Federation launched its Farm Data Code in 2020, yet Hortidaily reported in April 2024 that only six software providers had certified against it. Most farms have no IT department, so they depend on these checks and on vendor assurances. Vendors that certify early and publish audit reports can turn this concern into a useful selling point.
Basin policy uncertainty clouds long-term investment
Irrigators hesitate over long-lived equipment when their future water access remains under review by governments. Cotton Australia reported that the Murray-Darling Basin Authority released its Basin Plan Review discussion paper on Feb. 5, 2026, assuming full recovery of 450 gigaliters and flagging a likely shortfall of about 300 gigaliters that markets may supply. Northern Basin growers also face proposed changes to their water access rules. Suppliers can respond with modular systems that can be moved, resized or redeployed if water holdings change.
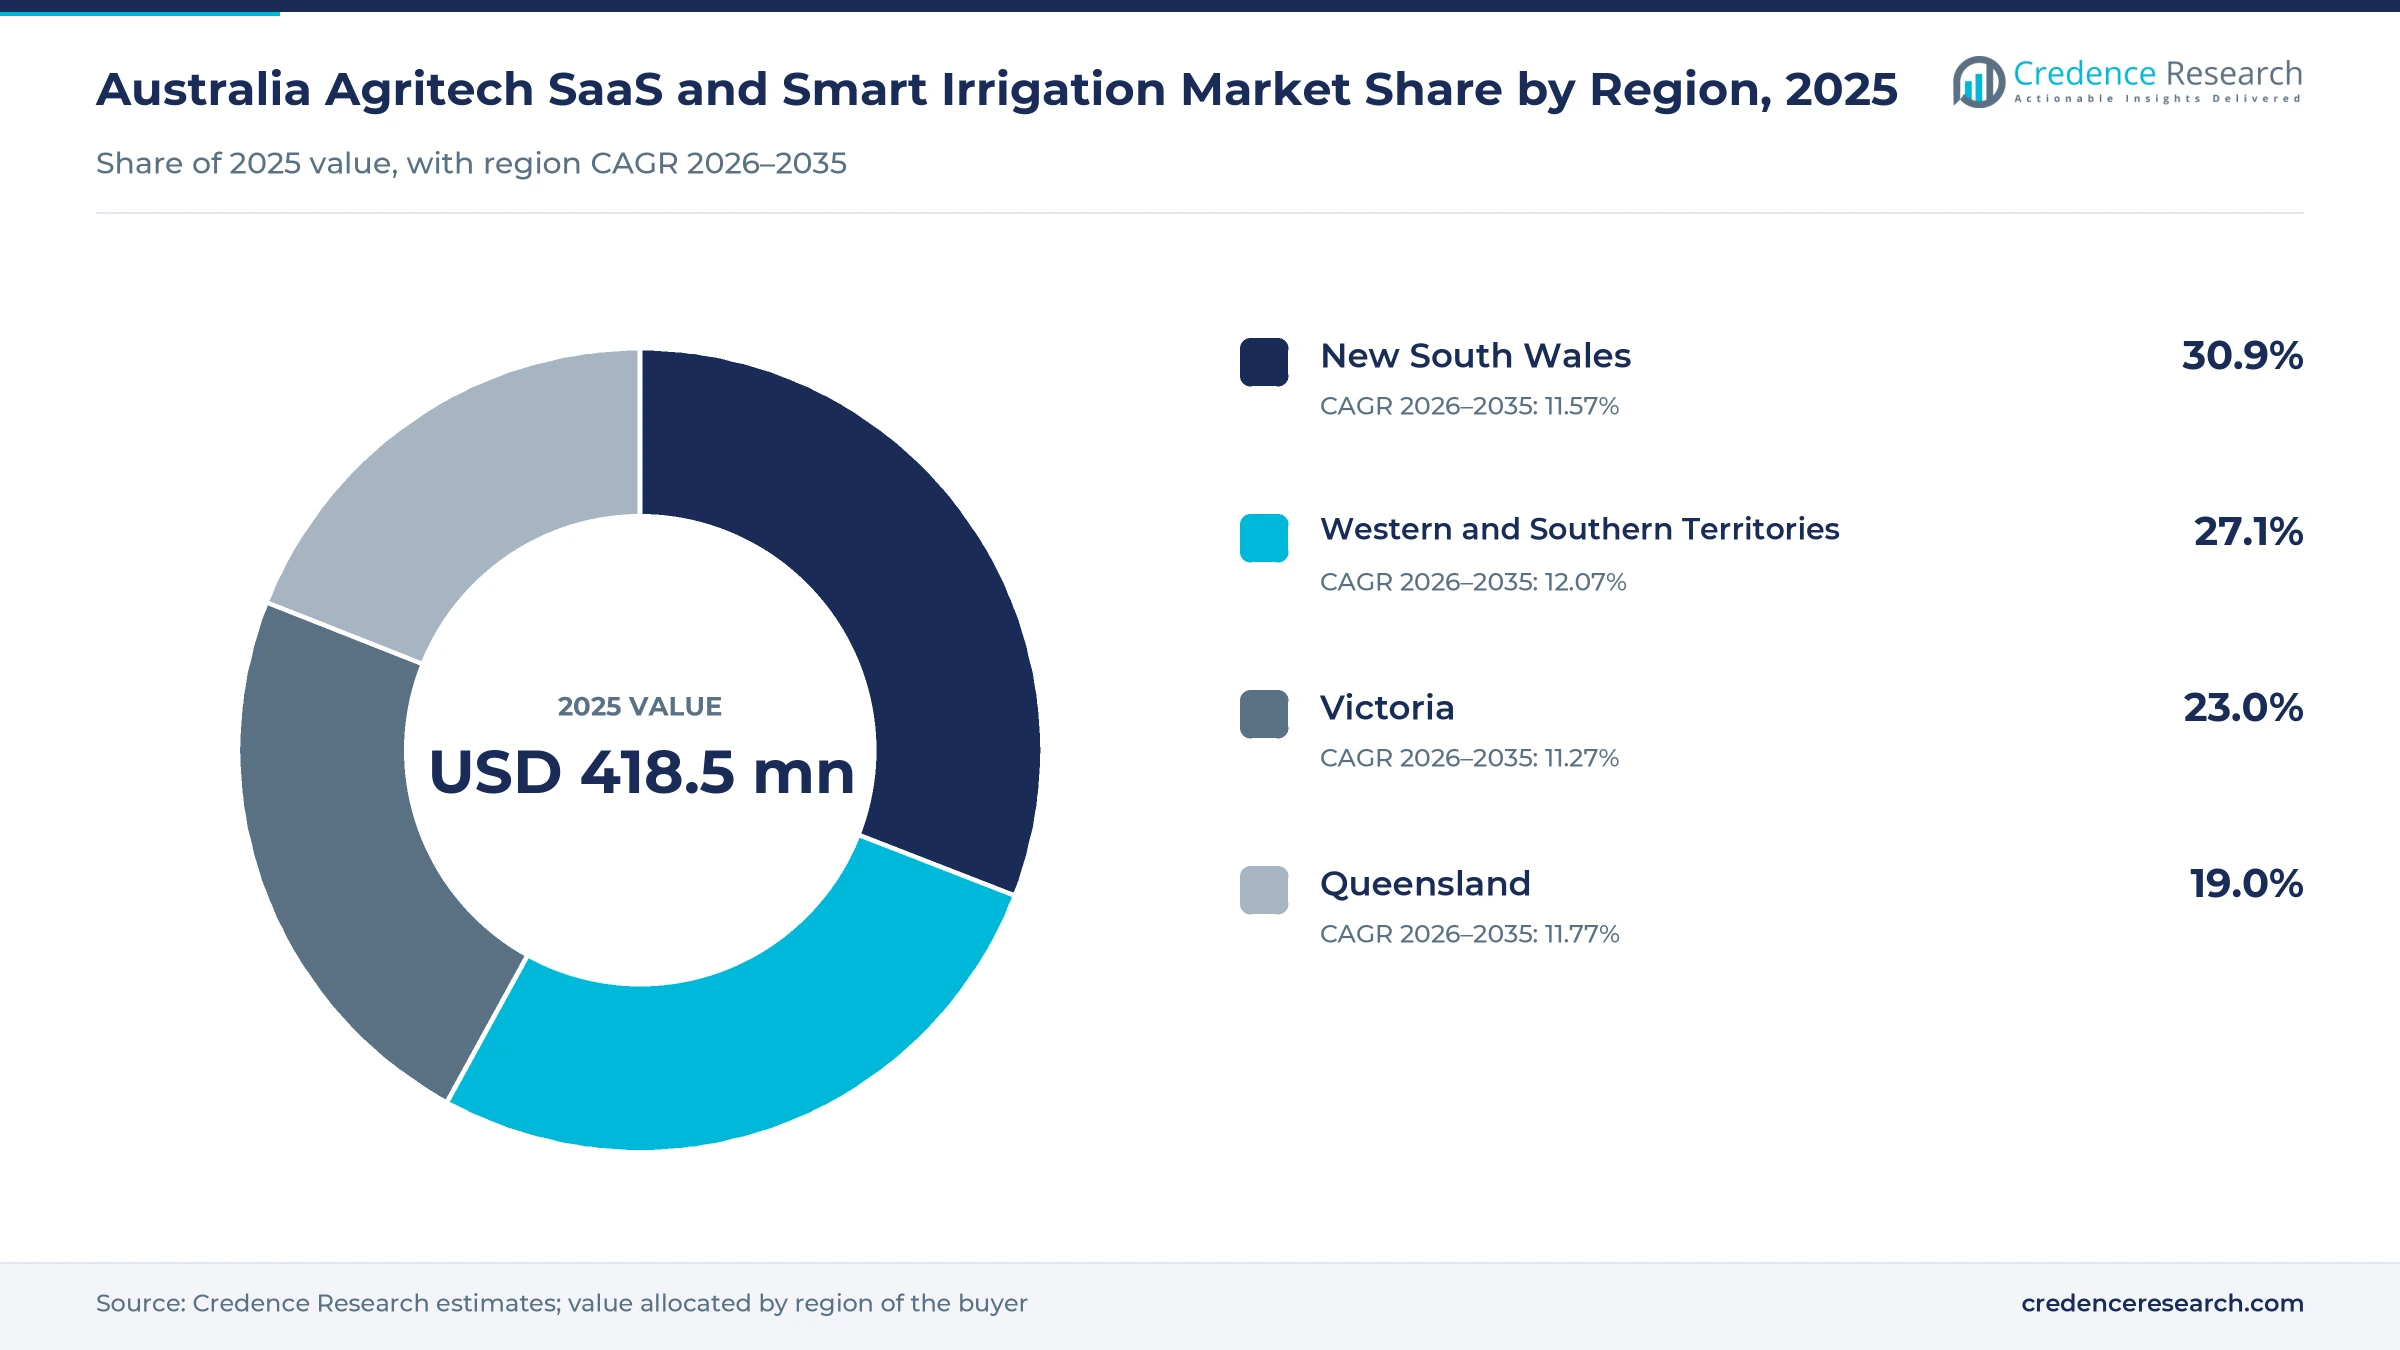
New South Wales leads on water volume and metering
| Region | Value, 2025 (USD million) | Share, 2025 | CAGR, 2026–2035 |
|---|---|---|---|
| New South Wales | 129.3 | 30.9% | 11.57% |
| Western and Southern Territories | 113.4 | 27.1% | 12.07% |
| Victoria | 96.3 | 23.0% | 11.27% |
| Queensland | 79.5 | 19.0% | 11.77% |
New South Wales pairs the largest water use with telemetry rules
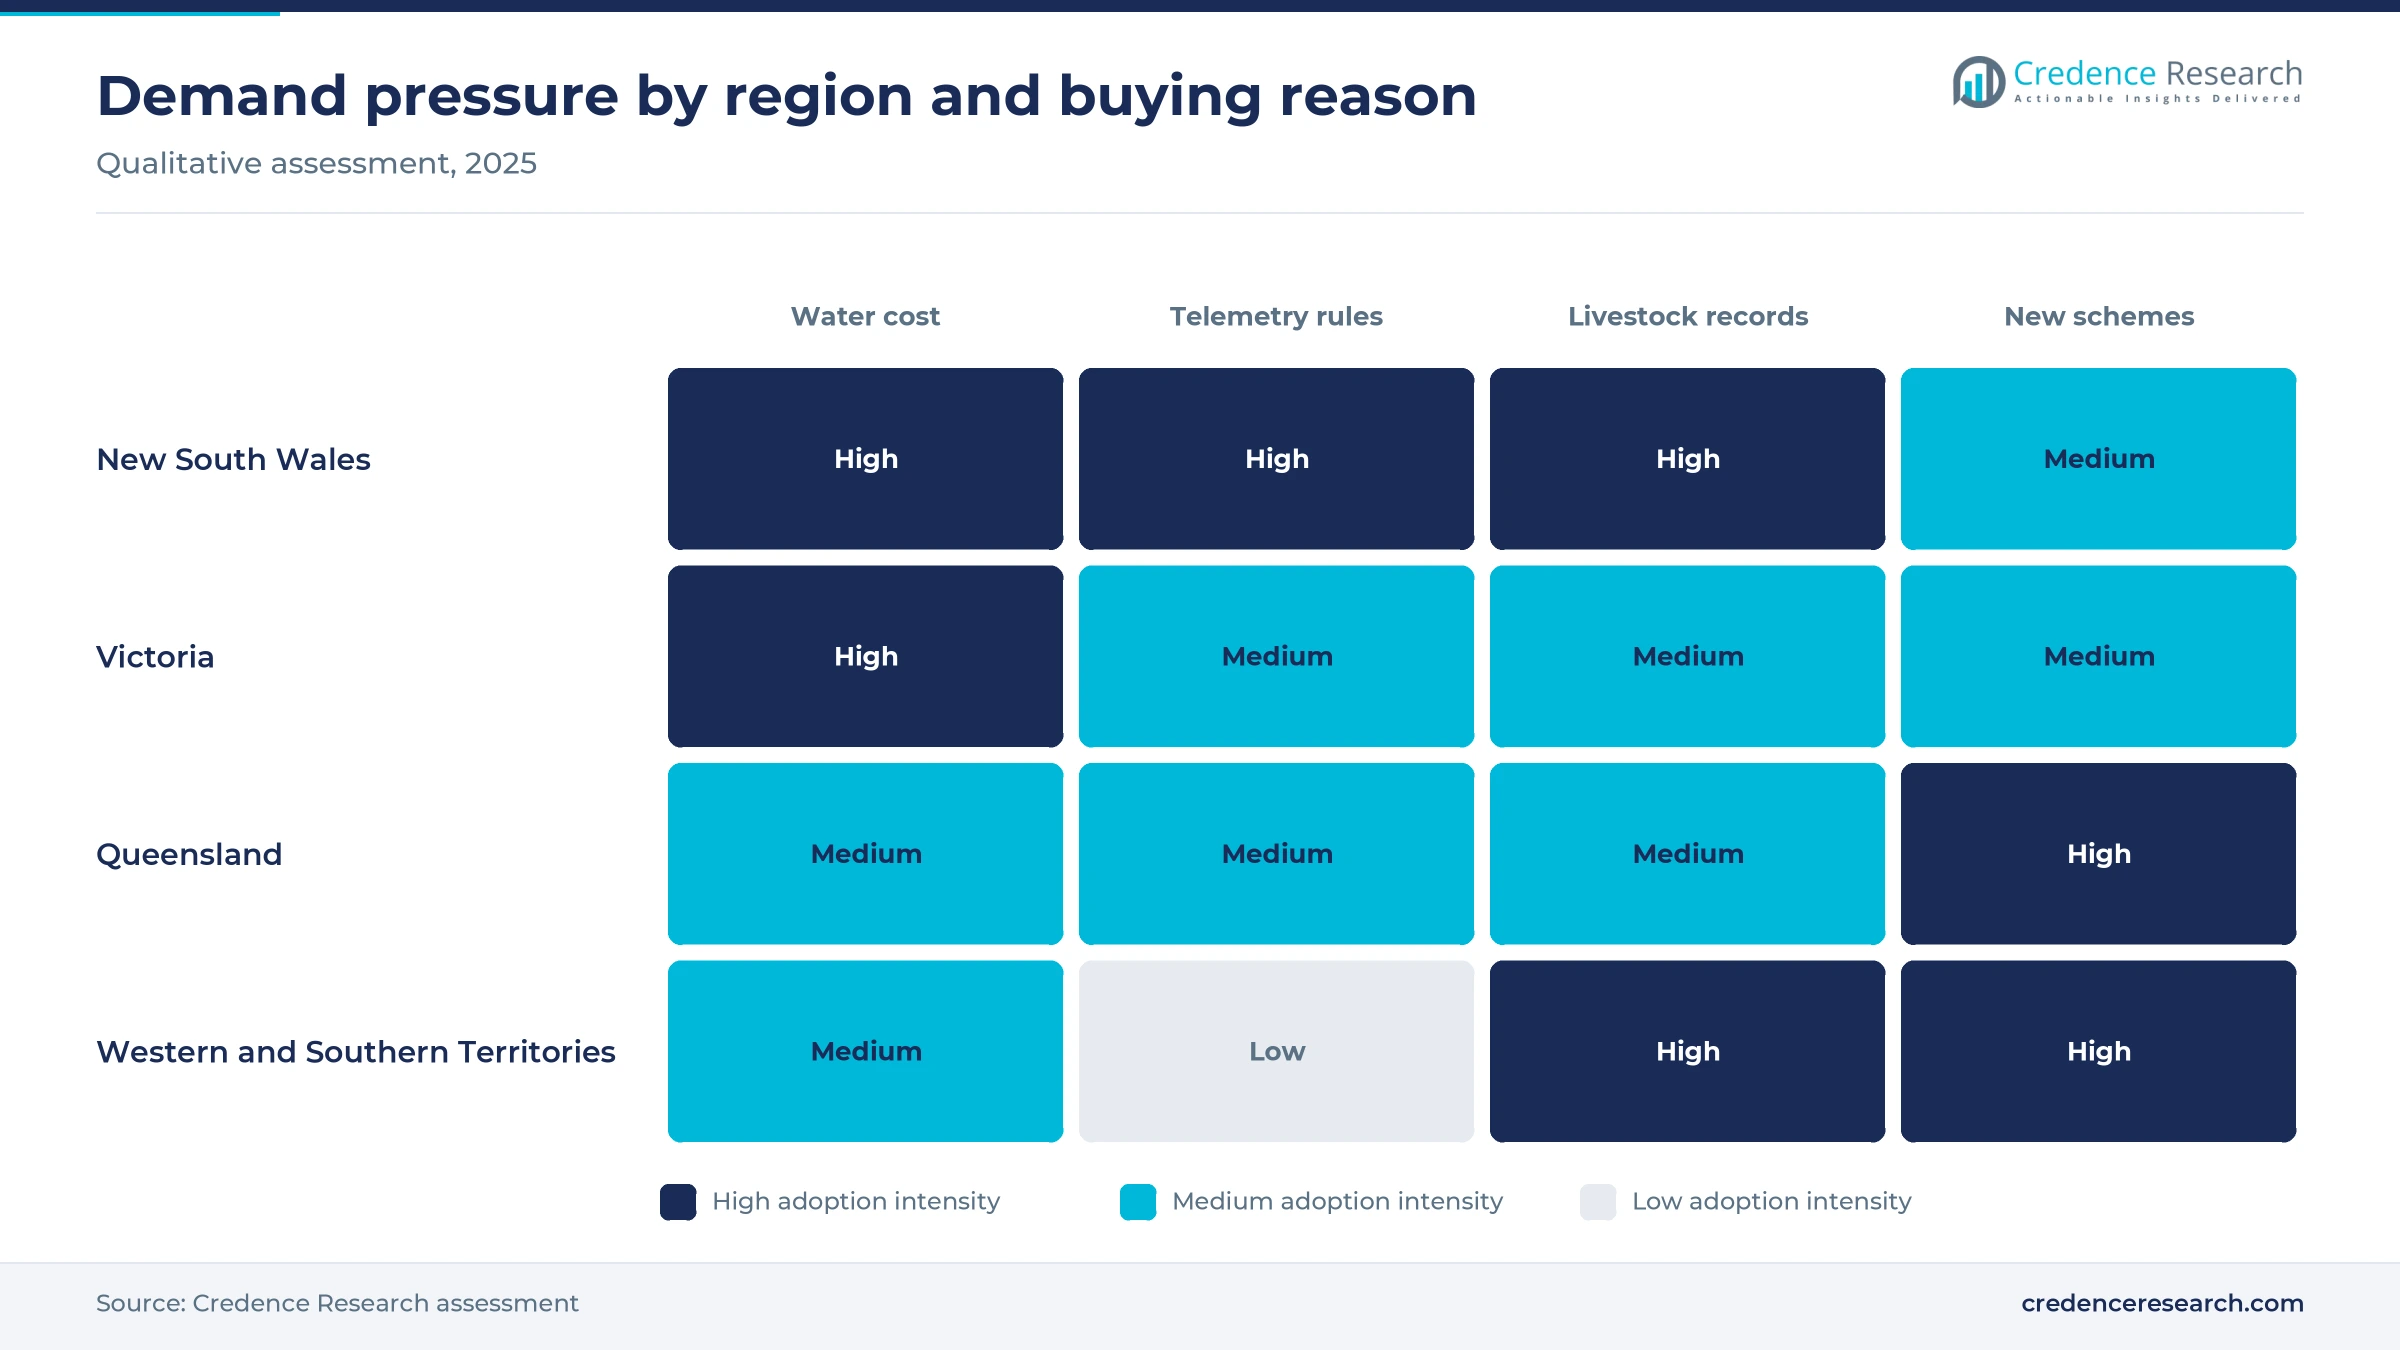
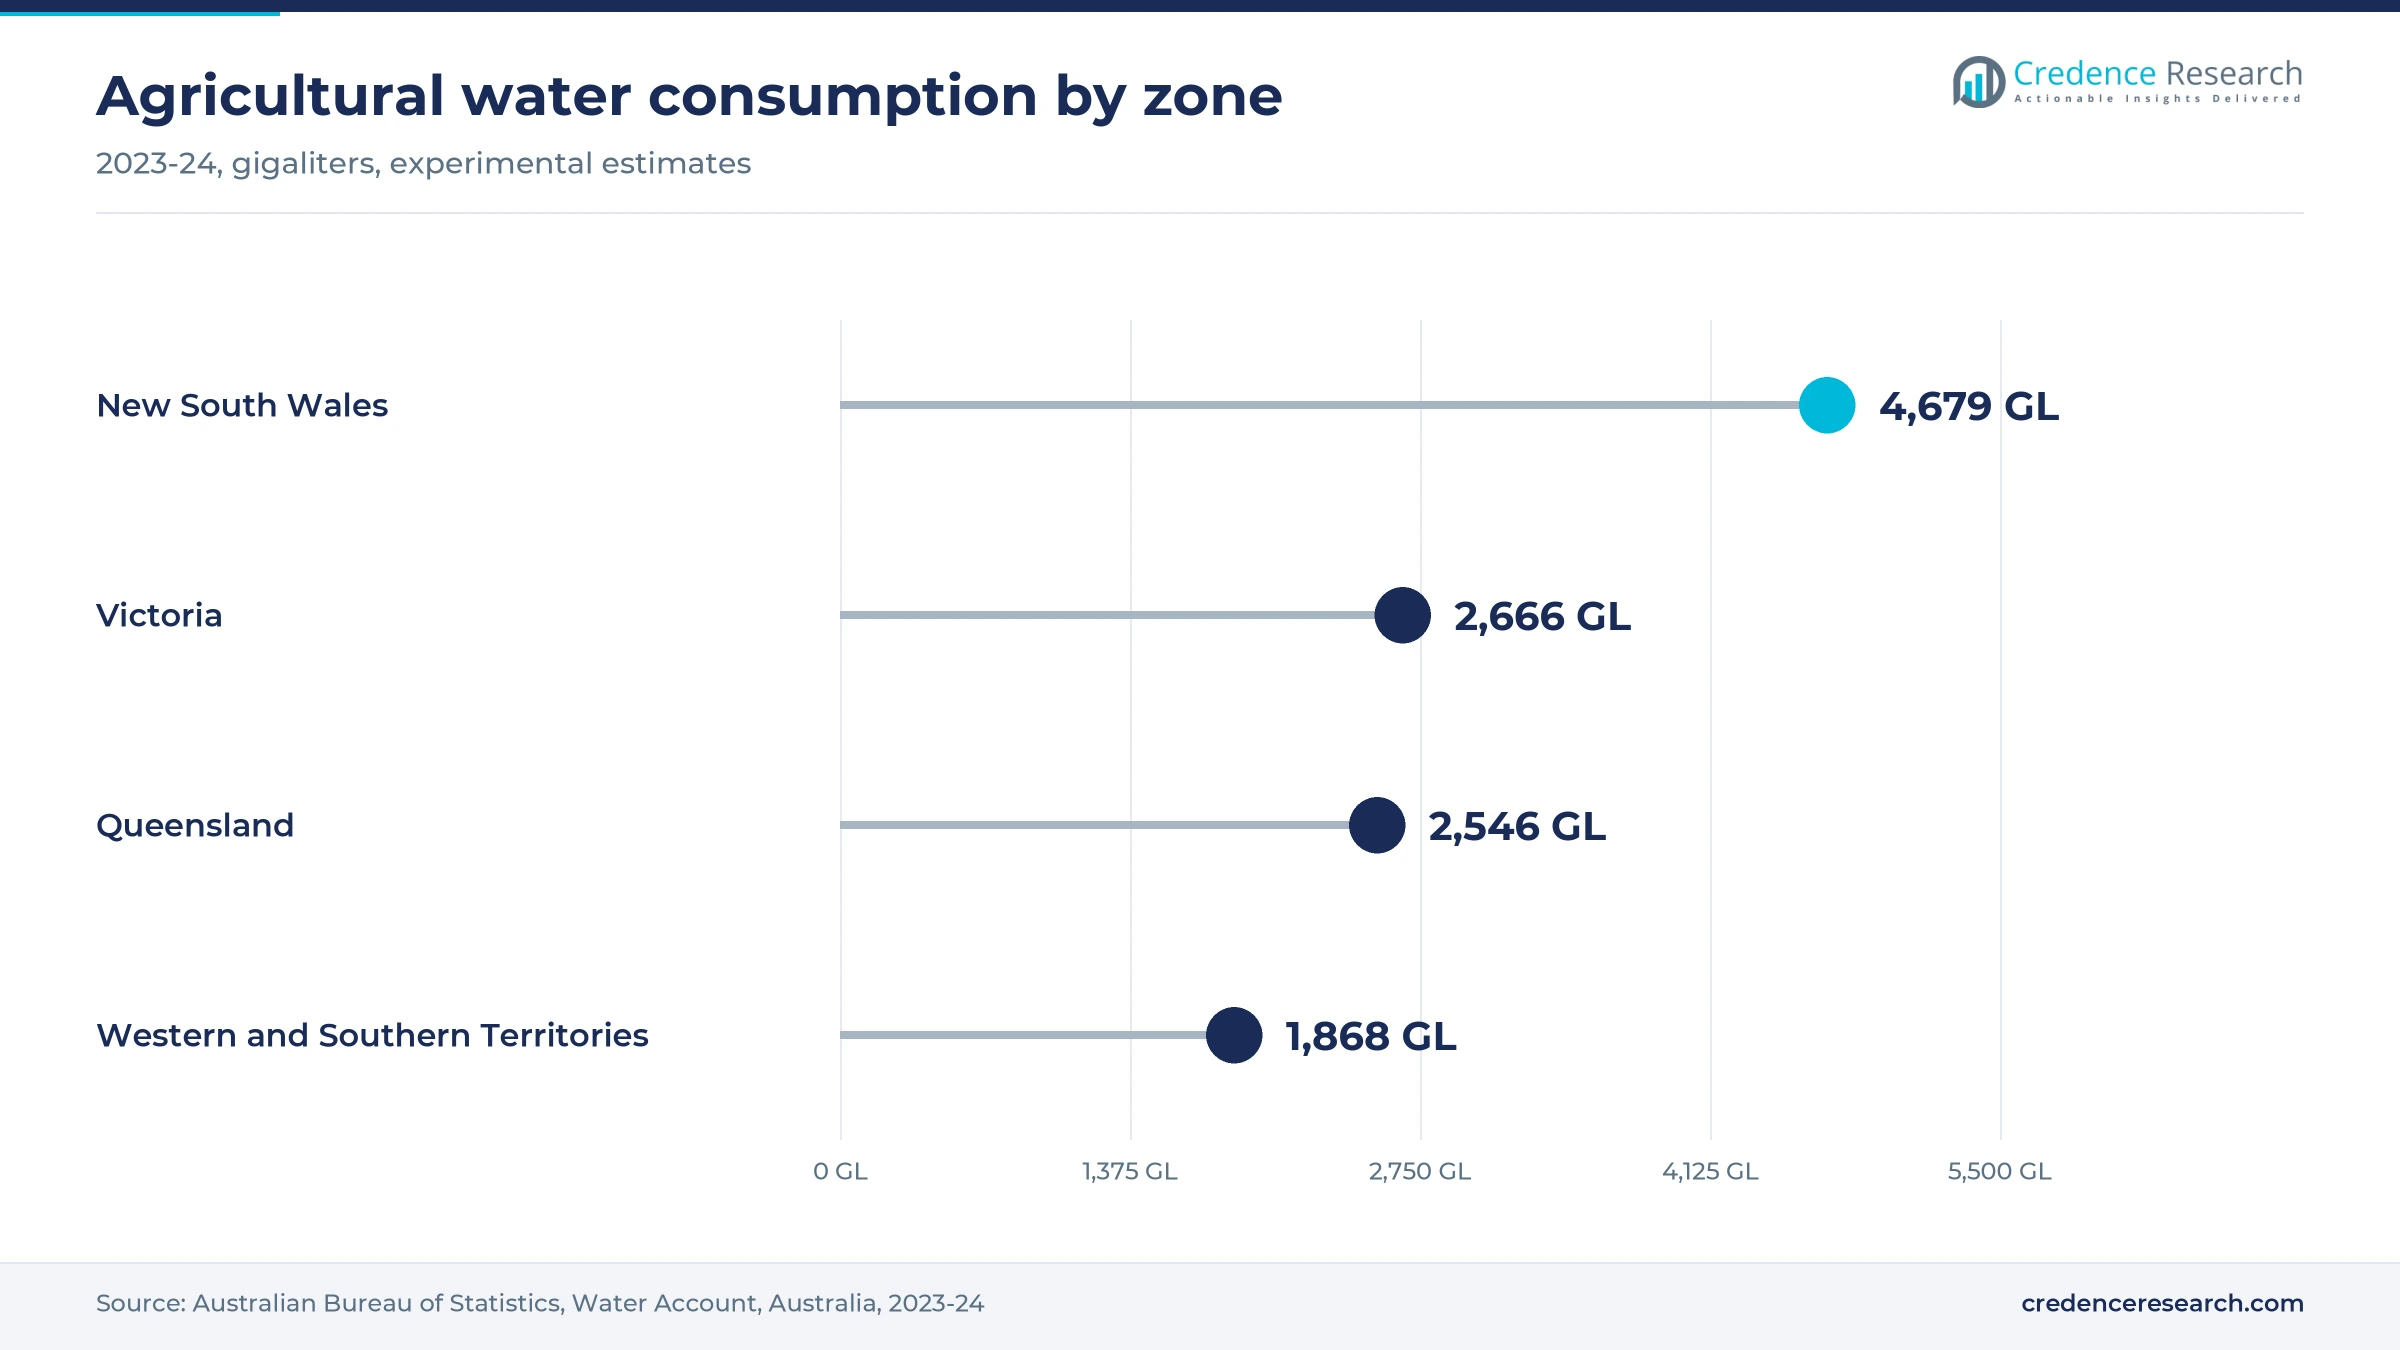
New South Wales held 30.9% of 2025 value and grows at 11.57% a year. Its demand base is the largest in the country, with agricultural water consumption of 4,679 gigaliters in 2023-24. Its telemetry rollout across about 8,500 sites adds a compliance reason to buy connected equipment. Electronic tagging for all sheep and goats leaving any property from Jan. 1, 2027 also supports livestock software demand, particularly among the mixed cropping and grazing operations found across the state's inland regions.
Western and Southern Territories gain from new schemes
Western and Southern Territories held 27.1% of 2025 value and grow fastest at 12.07% a year. The zone combines South Australia, Western Australia, Tasmania and the Northern Territory, which together used about 1,868 gigaliters in 2023-24. Tasmanian consumption jumped 78.2% that year, and the A$155.6 million Northern Adelaide Irrigation Scheme was under construction in the National Water Grid report of October 2023. Grants in Manjimup-Pemberton add further horticulture demand across the southern part of the zone.
Victoria builds on its modernized channel networks
Victoria held 23.0% of 2025 value and grows at 11.27% a year. That slower pace reflects channel automation that is already largely complete. Agricultural consumption reached 2,666 gigaliters in 2023-24, up 29.3%, which kept attention on scheduling tools. Rubicon Water was founded in Shepparton, and Netafim runs its main Australian warehouse and manufacturing site in Laverton, so local service access is strong. Greater Dandenong's council program shows that turf buyers in the state are also investing.
Queensland demand centers on cane and water storage projects
Queensland held 19.0% of 2025 value and grows at 11.77% a year. Its demand rests on 2,546 gigaliters of agricultural water consumption in 2023-24. Large storage projects give irrigators a longer planning horizon, and the National Water Grid report listed Rookwood Weir at A$367.2 million and the Paradise Dam improvement at A$1.2 billion in October 2023. The state also has a long record of water efficiency programs for dairy, horticulture and sugarcane, which gives vendors an established extension network to work through.
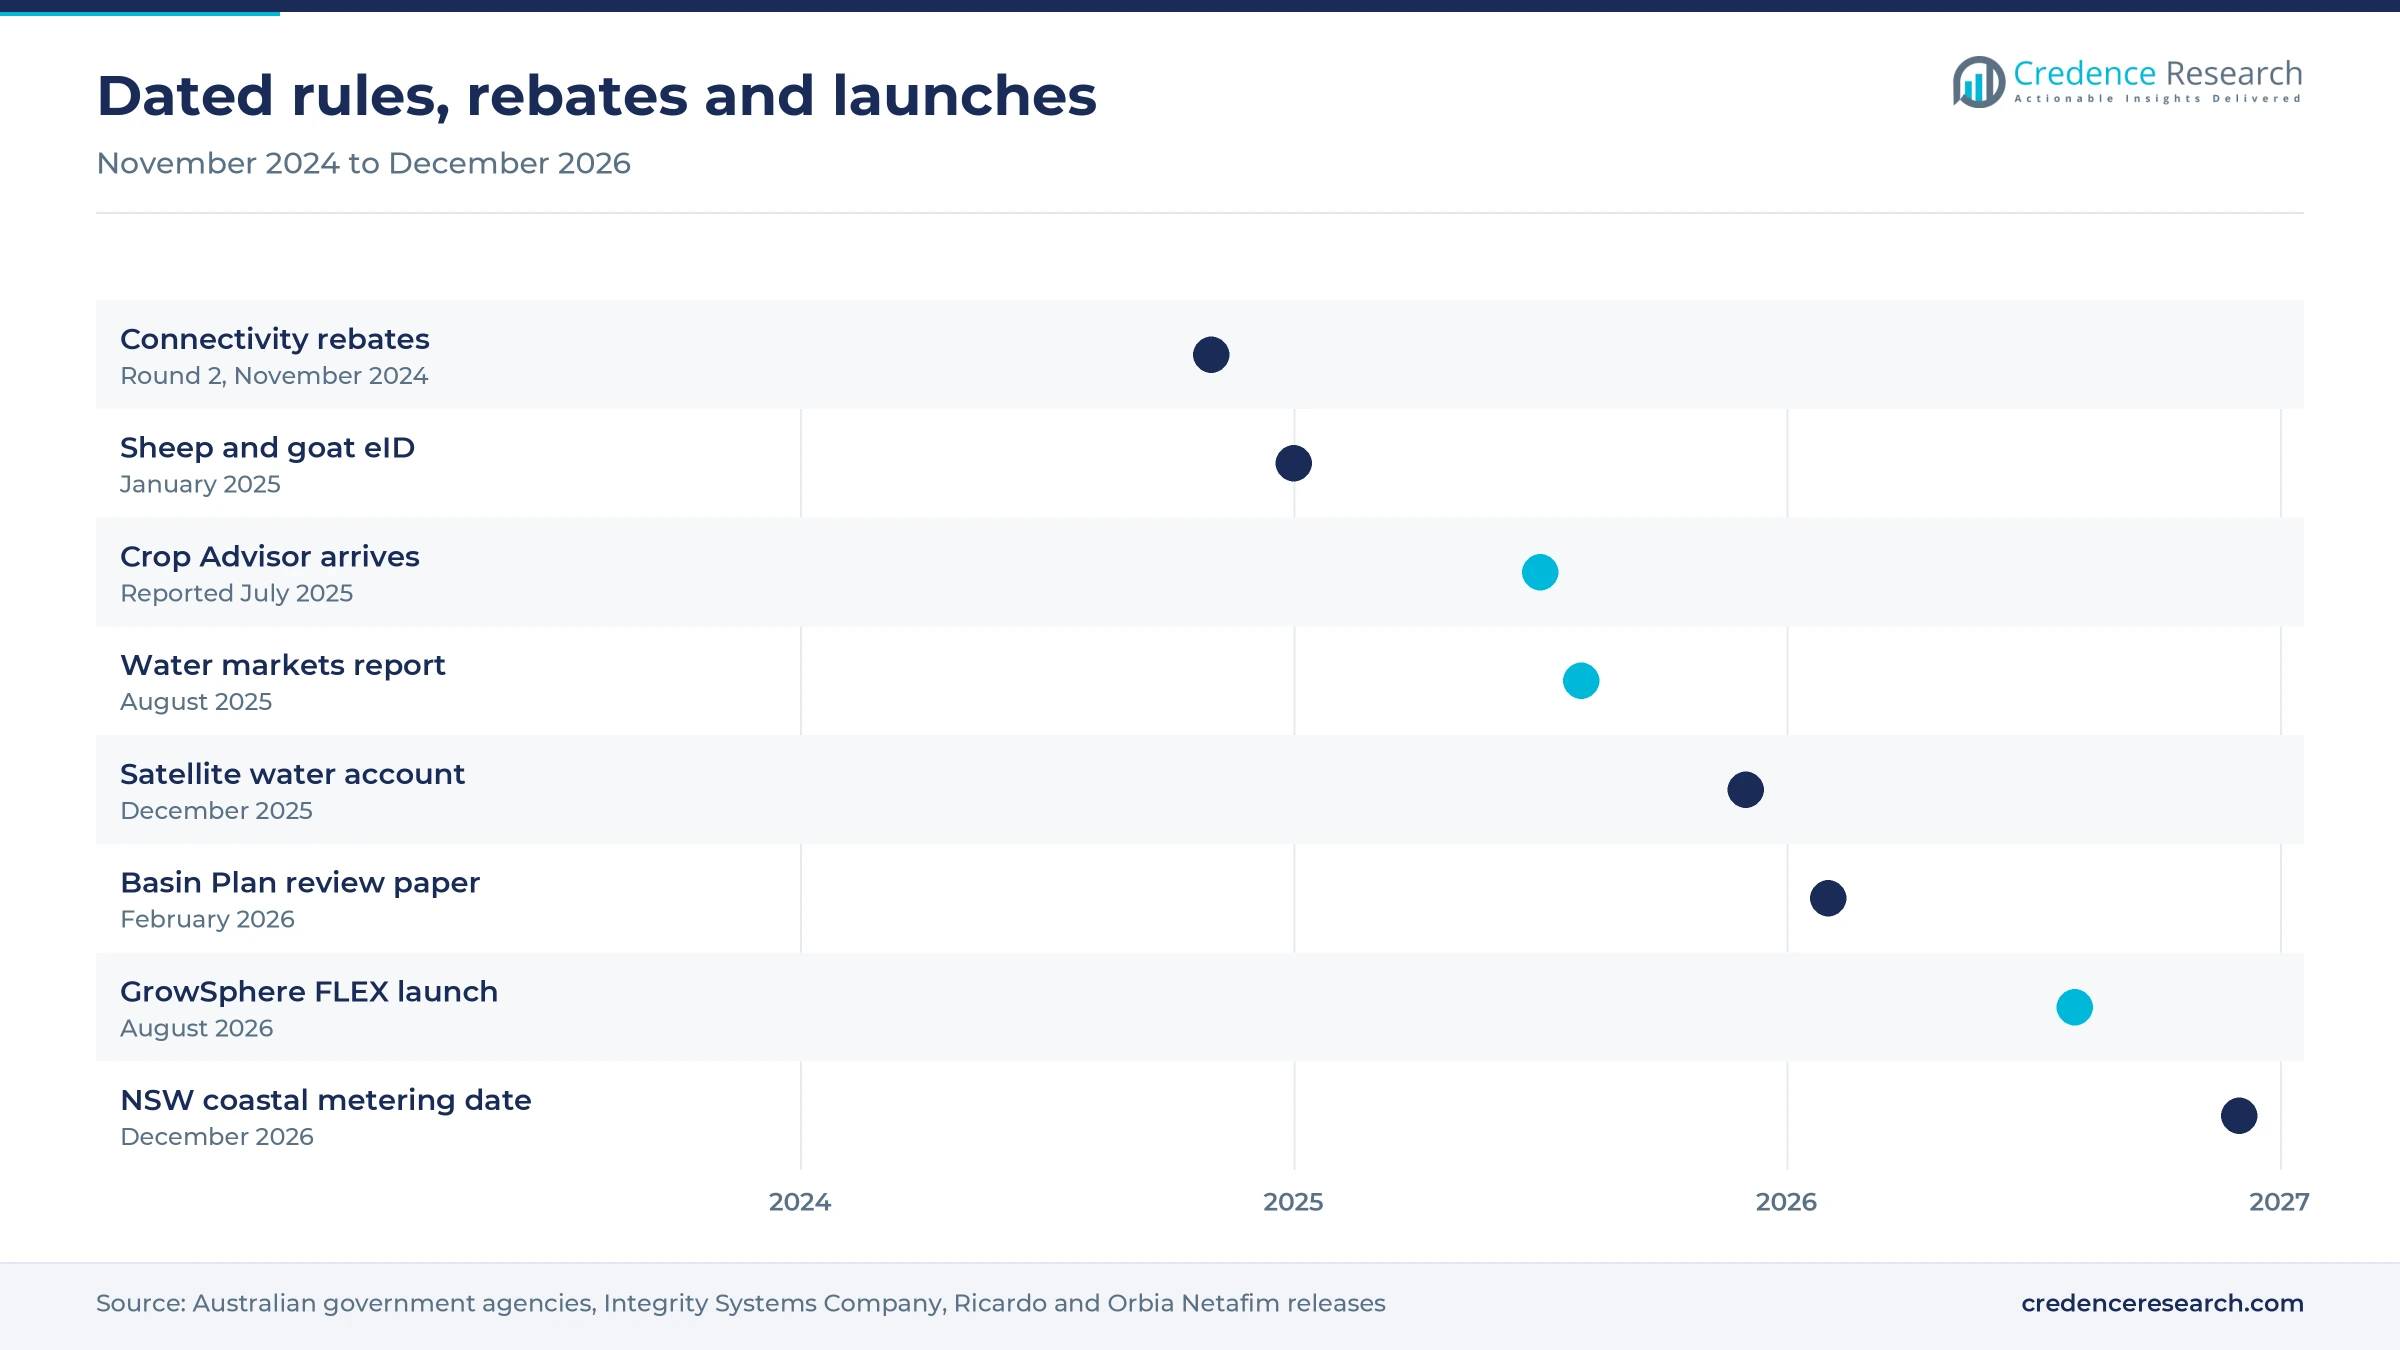
Rebates, eID and metering deadlines set the 2024–2026 pace
| Development | Status and market relevance |
|---|---|
| In November 2024, Round 2 of the On Farm Connectivity Program opened with A$18 million and ran out within about a week, according to Farm Weekly | Closed, with more than 1,300 producers supported |
| In January 2025, electronic identification became mandatory for sheep and farmed goats born from Jan. 1, according to Integrity Systems Company | In force, and New South Wales extends it to all ages in January 2027 |
| In July 2025, Good Fruit & Vegetables reported the Australian arrival of the Netafim GrowSphere Crop Advisor | On sale through more than 400 Australian dealers |
| In December 2025, the Australian Bureau of Statistics moved its irrigation water estimates to a satellite-based method | Published as experimental data for 2022-23 and 2023-24 |
| In August 2026, Orbia Netafim launched the GrowSphere FLEX controller for smaller and mid-sized growers | Global launch, relevant to Australian horticulture growers |
Remote control, soil sensing and eID form the core stack
- Remote valve and pump control lets one operator run scattered blocks from a phone, and Round 2 rebate guidelines listed these controllers as eligible equipment.
- Soil moisture sensing gives irrigators field evidence for timing decisions, and Wagga Wagga City Council paired Toro Sentinel controllers with soil probes on its sports grounds in 2020.
- Electronic livestock identification links each animal tag to movement records, which AgriWebb syncs with the national database through its mobile scanning app.
- Automated channel control manages gates, flow meters and communications together, which is the approach behind the Rubicon Water system developed with the University of Melbourne around 1998.
Need a Custom Version of This Report?
Tailor the scope, geography, or segments to your exact requirements.
- Custom geography or segment scope
- Direct access to our analyst team
Channel specialists and platforms compete across farm types
Smart irrigation competition divides into water specialists, precision agriculture suppliers and farm software platforms, and few companies span all three groups. Rubicon Water sells automated channel systems to water authorities, so its sales cycle depends on public tenders rather than individual farm budgets. Netafim Australia competes through drip systems, cloud controllers and a dealer network of more than 400 outlets, which gives it strong horticulture reach. PTx Trimble approaches irrigators from the machinery side, selling WM-FieldForm land forming and farm software through WSB Distributors in South Australia. Toro Australia is strongest in sports turf and public open space, with Lynx central control at the Fremantle Dockers training ground and Sentinel controllers on New South Wales council sports grounds. AgriWebb focuses on livestock records, where eID rules have widened its audience. Dealer coverage, service response and data certification are the main points of difference for buyers.
Companies profiled and their roles in this market
| Company | Type | Role in the market |
|---|---|---|
| Rubicon Water | Automation specialist | Shepparton-founded supplier of automated channel gates, flow meters and control software for irrigation networks |
| Netafim Australia | Irrigation equipment and software | Sells drip systems and GrowSphere controllers through more than 400 dealers, with a main site in Laverton, Victoria |
| PTx Trimble | Precision agriculture supplier | Offers WM-FieldForm and farm software in South Australia through WSB Distributors |
| Toro Australia | Turf and landscape irrigation | Supplies Lynx central control and Sentinel controllers with soil probes to sports grounds and councils |
| AgriWebb | Livestock software platform | Provides app-based tag scanning, movement records and compliance reports linked to the national livestock database |
Compliance and water cost will drive software spending
Credence Research's view is that compliance will prove a steadier source of demand than farm income, because rules keep applying in low-price years. Metering dates in New South Wales and electronic tagging extend to 2027, while water prices depend on seasons and storage levels. The main assumption in this forecast is that subscriptions keep rising as data plans ship with controllers. Demand also assumes that telemetry measures 95% of licensed inland New South Wales river water on the stated timetable. Vendors should therefore pair hardware with certified data handling, and buyers should test whether records can move between platforms before signing long contracts.
How the Credence Research estimates were built
The report uses 2025 as the base year and forecasts values through 2035. Market values come from the Credence Research model, while regional and segment splits are Credence Research estimates. Source types used include the Australian Bureau of Statistics, ABARES, federal and state water and communications agencies, OECD policy reviews, industry bodies, trade press and company announcements. Regional shares follow the Credence Research regional model and agricultural water consumption by state is shown for context, which does not map one-to-one to those shares. No primary interviews or surveys were conducted for this edition.
Recurring contracts gain share through 2035
The market is forecast to reach USD 1.29 billion by 2035 at an 11.68% annual rate, with most of the added value coming from recurring software and service contracts rather than hardware alone. Telemetry and electronic tagging will be largely installed by the late 2020s, so growth should then depend on decision support and data sharing between platforms. Tasmanian and Western Australian schemes should add new irrigated customers over the same period. Water prices will still shape each season's purchases, and dry years are likely to bring stronger interest in smart irrigation scheduling.
Frequently Asked Questions
How big is the Australia agritech SaaS and smart irrigation market?
Which region leads the market?
Which solution type is largest?
What is driving software purchases on livestock farms?
How do water prices affect demand?
What support is available for connected farm equipment?
Which companies are active in this market?
What are the main challenges for buyers?
Table of Content
Chapter 1 Market Segmentation
- 1.1 Segmentation Framework
- 1.1.1 Product and Service Classification
- 1.1.2 Application and End-Use Classification
- 1.1.3 Technology and Solution Classification
- 1.1.4 Customer and Distribution Channel Classification
- 1.1.5 Geographic Segmentation
- 1.1.6 Market Segment Definitions and Boundaries
- 1.2 By Solution Type
- 1.2.1 Connected Irrigation Equipment
- 1.2.2 Agritech SaaS
- 1.2.3 Irrigation Software and Services
- 1.3 By End-Use Industry
- 1.3.1 Cropping and Horticulture
- 1.3.2 Livestock and Dairy
- 1.3.3 Managed Turf and Public Landscapes
- 1.4 By Application
- 1.4.1 Water Scheduling and Control
- 1.4.2 Production Decision Support
- 1.4.3 Records and Traceability
- 1.5 By Pricing Model
- 1.5.1 Capital Purchase Contracts
- 1.5.2 Subscription Contracts
- 1.5.3 Managed-Service Contracts
Chapter 2 Introduction
- 2.1 Report Objectives and Scope
- 2.2 Product Definition and Industry Terminology
- 2.3 Market Inclusions and Exclusions
- 2.4 Research Process
- 2.4.1 Primary Research and Expert Interviews
- 2.4.2 Secondary Research and Source Review
- 2.4.3 Top-Down and Bottom-Up Estimation
- 2.4.4 Data Triangulation and Verification
- 2.5 Market Size Measurement Basis
- 2.5.1 2025: USD 418.5 million → 2035: USD 1.29 billion
- 2.6 Historical and Forecast Reference Periods
- 2.6.1 Historical Period: 2018-2025
- 2.6.2 Base Year: 2025
- 2.6.3 Forecast Period: 2025-2035
- 2.7 Research Assumptions and Limitations
Chapter 3 Executive Summary
- 3.1 Market Snapshot and Key Findings
- 3.2 Base-Year Market Size, 2025
- 3.3 Forecast Market Size, 2035
- 3.4 Revenue and Volume Growth Outlook
- 3.5 Key Demand and Supply Indicators
- 3.6 Leading Market Segments
- 3.7 Fastest-Growing Market Opportunities
- 3.8 Regional Performance Highlights
- 3.9 Technology and Industry Transformation
- 3.10 Competitive Landscape Summary
- 3.11 Analyst View and Strategic Implications
Chapter 4 Australia Agritech SaaS and Smart Irrigation Market Trends and Developments
- 4.1 Historical Industry Development, 2018-2025
- 4.2 Recent Market Trends and Developments
- 4.3 Demand and Customer Behavior Trends
- 4.4 Technology and Product Innovation
- 4.5 Artificial Intelligence, Automation and Digitalization
- 4.6 Local Manufacturing and Supply Chain Realignment
- 4.7 Industry Partnerships, Mergers and Acquisitions
- 4.8 Sustainability and Circular Economy Developments
- 4.9 Government and Private Sector Investment Trends
- 4.10 Emerging Business Models and Commercialization
- 4.11 Industry Developments and Announcements
Chapter 5 Australia Agritech SaaS and Smart Irrigation Market Supply and Demand Analysis
- 5.1 Demand Trend and Consumption Analysis, 2018-2025
- 5.2 Demand Forecast, 2025-2035
- 5.3 Supply Chain Structure and Procurement Trends
- 5.4 Supply-Demand Gap and Bottlenecks
- 5.5 Import Dependence and Sourcing Structure
- 5.6 Regional Supply and Demand Concentration
Chapter 6 Australia Agritech SaaS and Smart Irrigation Market Pricing Analysis
- 6.1 Pricing Structure and Measurement
- 6.2 Historical Pricing Trends, 2018-2025
- 6.3 Pricing Outlook, 2025-2035
- 6.4 Pricing by Product and Market Segment
- 6.5 Geographic Pricing Differences
- 6.6 Key Input, Energy, Labor and Logistics Costs
- 6.7 Contract Pricing and Purchasing Models
- 6.8 Pricing Sensitivity and Competitive Positioning
- 6.9 Price, Margin and Profitability Implications
Chapter 7 Australia Agritech SaaS and Smart Irrigation Market Dynamics
- 7.1 Market Growth Drivers
- 7.1.1 Demand-Side Drivers
- 7.1.2 Technology and Innovation Drivers
- 7.1.3 Infrastructure and Investment Drivers
- 7.1.4 Regulatory and Policy Drivers
- 7.2 Market Restraints
- 7.2.1 Cost and Affordability Constraints
- 7.2.2 Technology and Adoption Barriers
- 7.2.3 Supply Chain and Operational Constraints
- 7.3 Market Challenges
- 7.3.1 Competitive Pressure and Margin Erosion
- 7.3.2 Skills, Infrastructure and Implementation Gaps
- 7.4 Emerging Market Opportunities
- 7.5 Market Dynamics Impact and Time-Horizon Assessment
Chapter 8 Australia Agritech SaaS and Smart Irrigation Value Chain Analysis
- 8.1 Industry Value Chain Overview
- 8.2 Upstream Suppliers and Critical Inputs
- 8.3 Technology and Component Providers
- 8.4 Manufacturing or Service Delivery
- 8.5 Distribution, Channel Partners and Integrators
- 8.6 Downstream Applications and End Users
- 8.7 Value Addition and Profit Pools
- 8.8 Vertical Integration and Outsourcing
- 8.9 Supplier Concentration and Risk
- 8.10 Supply Chain Localization and Resilience
Chapter 9 Australia Agritech SaaS and Smart Irrigation Market Regulations and Policies
- 9.1 Relevant Laws, Standards and Compliance Frameworks
- 9.2 Product, Service, Safety and Quality Requirements
- 9.3 Government Policies, Incentives and Subsidies
- 9.4 Imports, Exports and Trade Barriers
- 9.5 Public Procurement and Local Content Requirements
- 9.6 Data Protection, AI and Cybersecurity Compliance
- 9.7 Upcoming Policy Changes and Market Implications
Chapter 10 Australia Agritech SaaS and Smart Irrigation Market Hotspots and Opportunities
- 10.1 Market Opportunity Mapping and Growth Hotspots
- 10.2 High-Growth Applications and Customer Groups
- 10.3 Underserved Markets and White-Space Opportunities
- 10.4 Emerging Technology and Product Opportunities
- 10.5 New Capacity and Investment Hotspots
- 10.6 Market Entry and Expansion Opportunities
- 10.7 Distribution and Partnership Opportunities
- 10.8 Near-Term and Long-Term Commercial Potential
- 10.9 Opportunity Attractiveness and Execution Risks
Chapter 11 Australia Agritech SaaS and Smart Irrigation Market Outlook, 2025-2035
- 11.1 Market Size and Analysis
- 11.1.1 Revenue (Market Measurement: 2025: USD 418.5 million → 2035: USD 1.29 billion)
- 11.1.2 Historical Market Size, 2018-2025
- 11.1.3 Base-Year Market Size, 2025
- 11.2 Market Forecast, 2025-2035
- 11.2.1 Revenue Forecast to 2035
- 11.2.2 CAGR and Year-on-Year Growth
- 11.2.3 Incremental Revenue Opportunity
- 11.3 Forecast Assumptions and Scenario Analysis
- 11.3.1 Base-Case Forecast
- 11.3.2 Optimistic and Conservative Scenarios
- 11.3.3 Technology, Pricing and Policy Sensitivities
- 11.4 Market Attractiveness and Growth Outlook
Chapter 12 Australia Agritech SaaS and Smart Irrigation Market Segmentation and Outlook
- 12.1 Segmentation Summary and Market Shares, 2025
- 12.2 Largest and Fastest-Growing Segments
- 12.3 By Solution Type - Market Size and Forecast, 2025-2035
- 12.3.1 Segment Definition and Scope
- 12.3.2 Historical Market Size, 2018-2025
- 12.3.3 Revenue Forecast, 2025-2035
- 12.3.4 Base-Year Market Share, 2025
- 12.3.5 Segment CAGR and Growth Drivers
- 12.3.6 Subsegment Market Size and Forecast
- 12.3.6.1 Connected Irrigation Equipment
- 12.3.6.2 Agritech SaaS
- 12.3.6.3 Irrigation Software and Services
- 12.3.7 Subsegment Pricing and Adoption Trends
- 12.3.8 Leading Suppliers and Competition
- 12.3.9 Regional Demand and Opportunities
- 12.4 By End-Use Industry - Market Size and Forecast, 2025-2035
- 12.4.1 Segment Definition and Scope
- 12.4.2 Historical Market Size, 2018-2025
- 12.4.3 Revenue Forecast, 2025-2035
- 12.4.4 Base-Year Market Share, 2025
- 12.4.5 Segment CAGR and Growth Drivers
- 12.4.6 Subsegment Market Size and Forecast
- 12.4.6.1 Cropping and Horticulture
- 12.4.6.2 Livestock and Dairy
- 12.4.6.3 Managed Turf and Public Landscapes
- 12.4.7 Subsegment Pricing and Adoption Trends
- 12.4.8 Leading Suppliers and Competition
- 12.4.9 Regional Demand and Opportunities
- 12.5 By Application - Market Size and Forecast, 2025-2035
- 12.5.1 Segment Definition and Scope
- 12.5.2 Historical Market Size, 2018-2025
- 12.5.3 Revenue Forecast, 2025-2035
- 12.5.4 Base-Year Market Share, 2025
- 12.5.5 Segment CAGR and Growth Drivers
- 12.5.6 Subsegment Market Size and Forecast
- 12.5.6.1 Water Scheduling and Control
- 12.5.6.2 Production Decision Support
- 12.5.6.3 Records and Traceability
- 12.5.7 Subsegment Pricing and Adoption Trends
- 12.5.8 Leading Suppliers and Competition
- 12.5.9 Regional Demand and Opportunities
- 12.6 By Pricing Model - Market Size and Forecast, 2025-2035
- 12.6.1 Segment Definition and Scope
- 12.6.2 Historical Market Size, 2018-2025
- 12.6.3 Revenue Forecast, 2025-2035
- 12.6.4 Base-Year Market Share, 2025
- 12.6.5 Segment CAGR and Growth Drivers
- 12.6.6 Subsegment Market Size and Forecast
- 12.6.6.1 Capital Purchase Contracts
- 12.6.6.2 Subscription Contracts
- 12.6.6.3 Managed-Service Contracts
- 12.6.7 Subsegment Pricing and Adoption Trends
- 12.6.8 Leading Suppliers and Competition
- 12.6.9 Regional Demand and Opportunities
- 12.7 Segment Growth Comparison
- 12.8 Segment Attractiveness and Priority Matrix
Chapter 13 Australia Agritech SaaS and Smart Irrigation End-Use and Application Market Outlook
- 13.1 End-Use Industry and Customer Demand Structure
- 13.2 Leading Applications and Customer Groups
- 13.3 End-Use Market Size, Share and Forecast
- 13.4 Major End-Use Industry Deep Dives
- 13.4.1 Customer Requirements and Use Cases
- 13.4.2 Demand and Replacement Cycles
- 13.4.3 Technical and Regulatory Considerations
- 13.4.4 Purchasing and Procurement Models
- 13.4.5 Leading Vendors and Distribution Channels
- 13.4.6 Forecast and Commercial Opportunities
- 13.5 Emerging Applications and Cross-Segment Demand
- 13.6 End-Use Industry Investment Priorities
Chapter 14 Australia Agritech SaaS and Smart Irrigation Geographic Market Outlook, 2025-2035
- 14.1 Domestic Market Distribution and Demand Clusters
- 14.2 State- or Province-Wise Market Size and Forecast, 2025-2035
- 14.3 City and Metropolitan Market Outlook
- 14.4 Industrial, Manufacturing and Commercial Clusters
- 14.5 Geographic Concentration of Key End Users
- 14.6 Local Pricing and Purchasing Differences
- 14.7 Domestic Production Facilities and Capacity Map
- 14.8 Local Infrastructure and Project Pipeline
- 14.9 State-Level Policy and Incentive Differences
- 14.10 Subnational Investment Hotspots and Opportunities
- 14.11 Distribution and Logistics Networks
- 14.12 Domestic Competitive Footprint
Chapter 15 Australia Agritech SaaS and Smart Irrigation Technology, Innovation and Sustainability Outlook
- 15.1 Technology Landscape and Maturity
- 15.2 Product, Process and Service Innovation
- 15.3 AI, Automation and Digital Tools in the Industry
- 15.4 Technology Adoption and Performance Benchmarking
- 15.5 Innovation Pipeline and R&D Investment
- 15.6 Patent and Intellectual Property Trends
- 15.7 Energy Efficiency and Resource Management
- 15.8 Sustainability, Recycling and Circularity
- 15.9 Technology Roadmap, 2025-2035
- 15.10 Risks of Obsolescence and Technology Substitution
Chapter 16 Australia Agritech SaaS and Smart Irrigation Market Key Strategic Imperatives
- 16.1 Growth and Market Entry Priorities
- 16.2 High-Return Products and Segments
- 16.3 Pricing, Profitability and Cost Optimization
- 16.4 Technology Investment and Product Differentiation
- 16.5 Supply Chain Localization and Resilience
- 16.6 Distribution and Customer Acquisition
- 16.7 Partnership, Acquisition and Capacity Strategy
- 16.8 Regional Expansion Priorities
- 16.9 Short-, Medium- and Long-Term Actions
Chapter 17 Competition Outlook
- 17.1 Industry Competition Characteristics
- 17.2 Market Structure and Concentration
- 17.3 Market Share and Competitive Positioning, 2025
- 17.4 Company-Wise Revenue and Product Benchmarking
- 17.5 Production and Service Capacity Benchmarking
- 17.6 Technology, Pricing and Differentiation
- 17.7 Regional Footprint and Distribution Strength
- 17.8 Mergers, Acquisitions and Strategic Alliances
- 17.9 New Entrants and Competitive Threats
- 17.10 Porter's Five Forces and Industry Attractiveness
- 17.11 Competitive Outlook, 2025-2035
Chapter 18 Company Profiles
- 18.1 Company Coverage and Selection Criteria
- 18.2 Rubicon Water
- 18.2.1 Business Description
- 18.2.2 Company Ownership and Geographic Presence
- 18.2.3 Product and Service Portfolio
- 18.2.4 Manufacturing and Operating Footprint
- 18.2.5 Financial Performance and Investment
- 18.2.6 Market Share and Competitive Position
- 18.2.7 Technology and Innovation Capabilities
- 18.2.8 Strategic Alliances or Partnerships
- 18.2.9 Recent Developments
- 18.2.10 Growth Strategy and Outlook
- 18.3 Netafim Australia
- 18.4 PTx Trimble
- 18.5 Toro Australia
- 18.6 AgriWebb
- 18.7 Other Relevant Market Participants
Note: Every listed company is profiled on the structure shown under the first company. The company list is preliminary and may change based on research findings, market developments, data availability and client requirements.
Chapter 19 Disclaimer
- 19.1 Research and Forecast Disclaimer
- 19.2 Data Source and Estimation Limitations
Note: The depth of individual sections depends on data availability for this market. Volume, capacity, trade and other unit-based metrics are included where applicable.

