
Hire purchase and leases fund Australian farm machinery
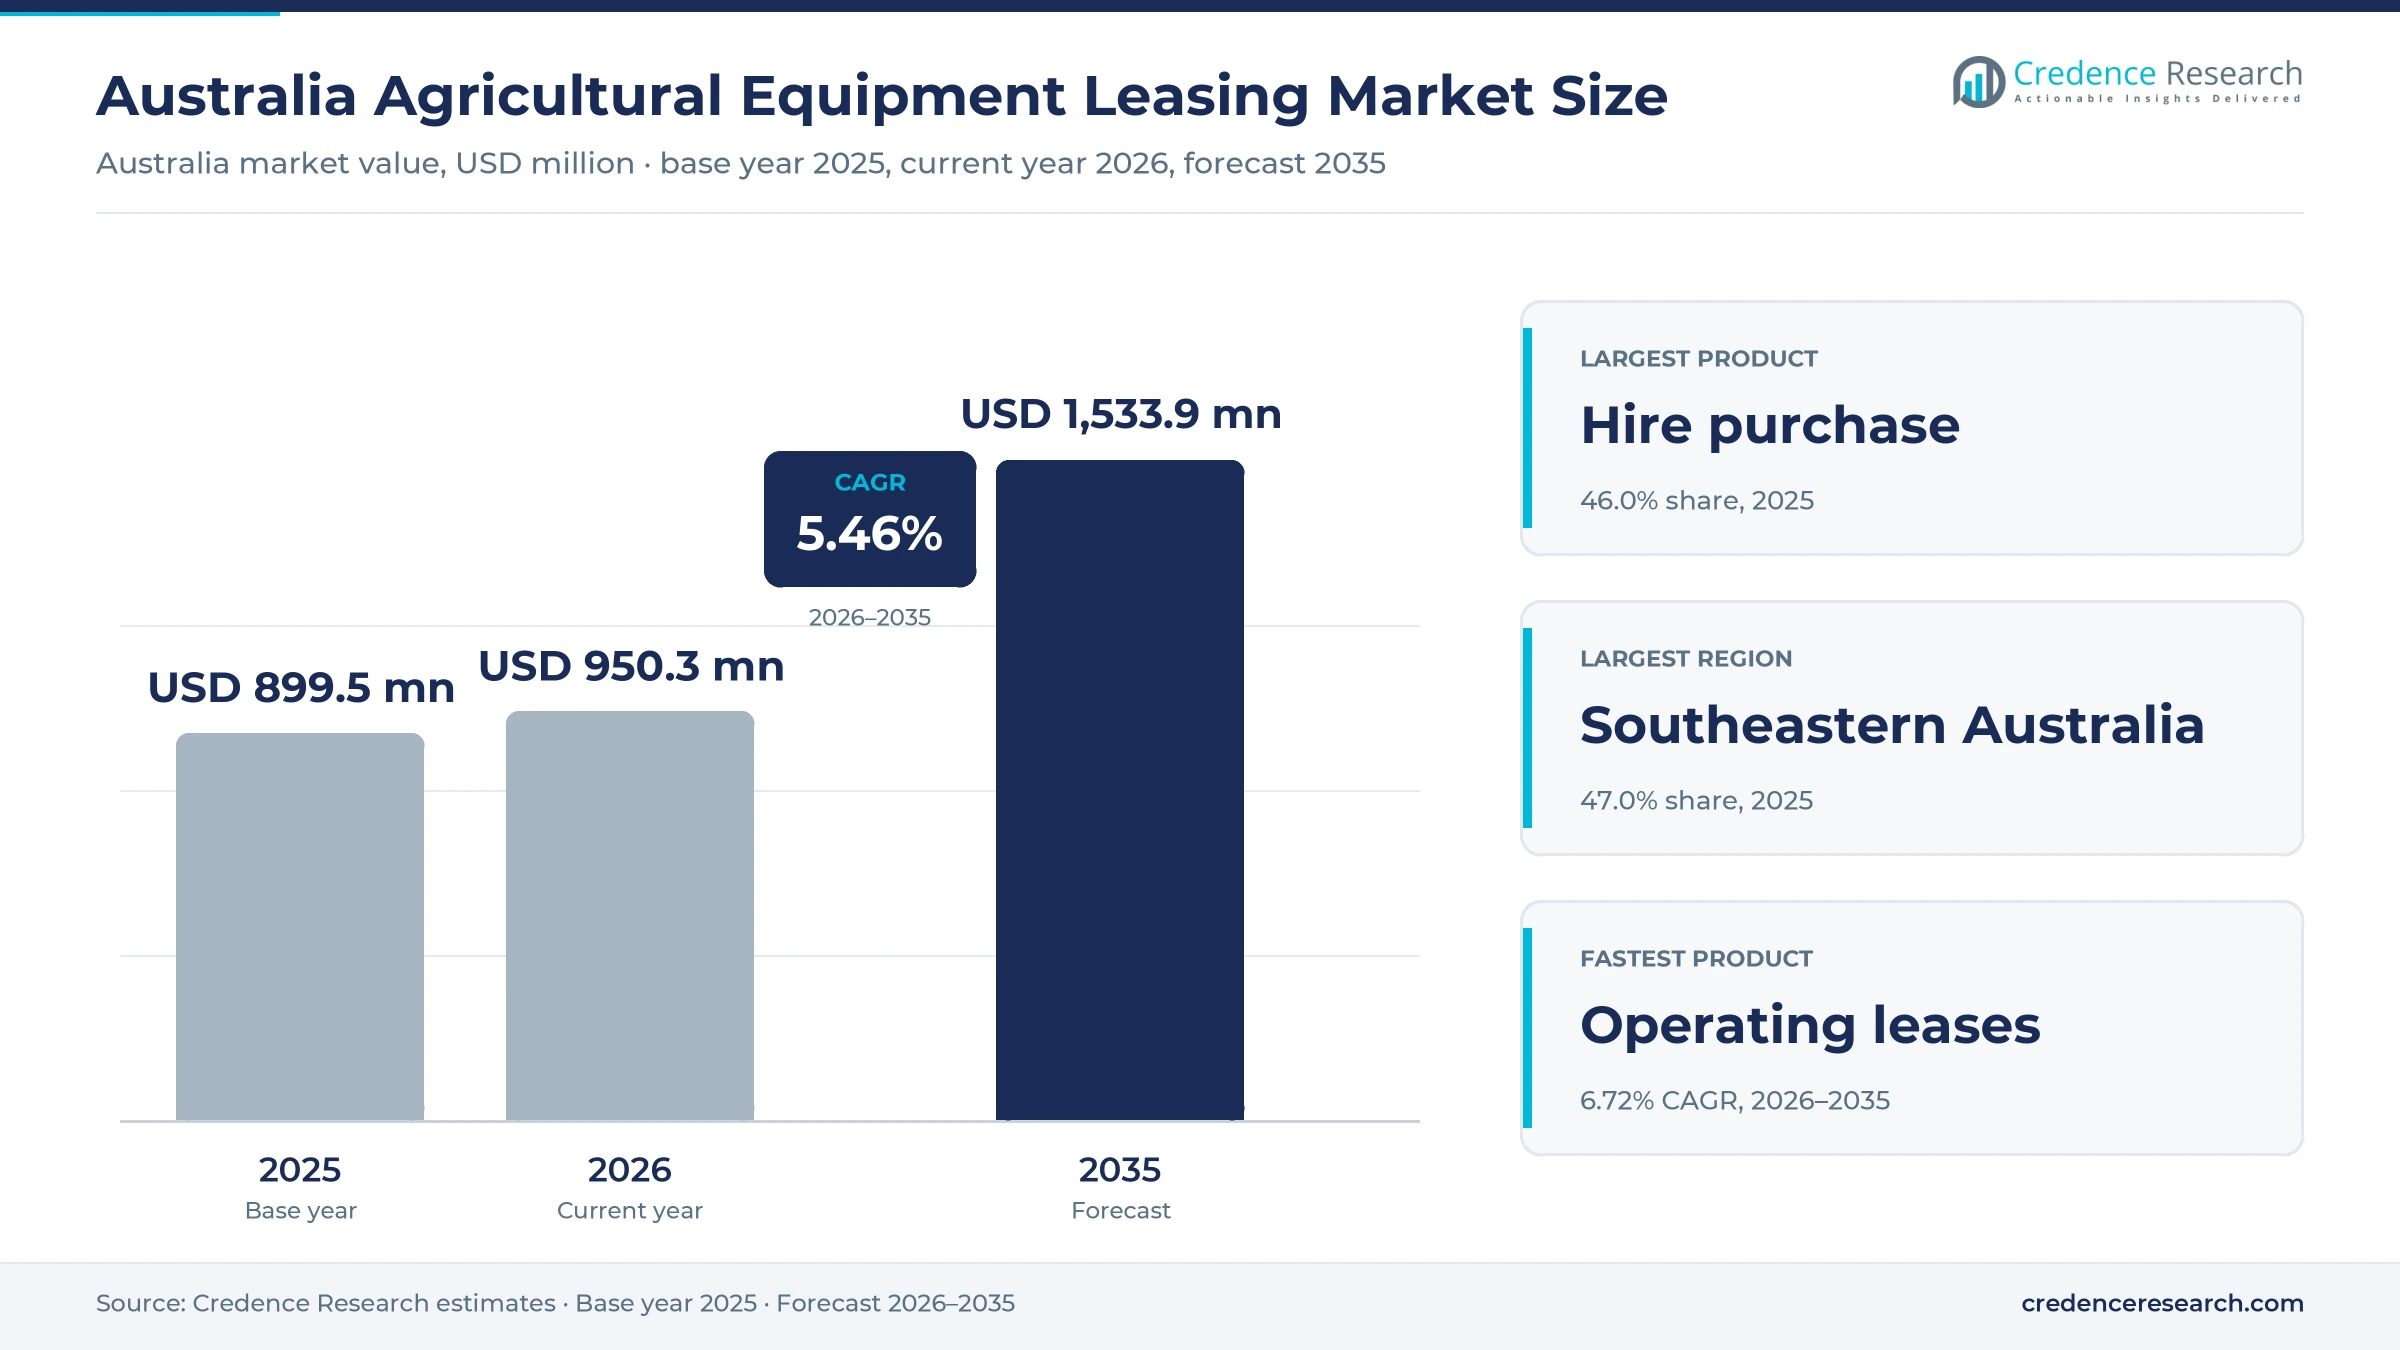
The Australia agricultural equipment leasing market was valued at USD 899.5 million in 2025 and is projected to increase from USD 950.3 million in 2026 to USD 1.53 billion by 2035, registering a CAGR of 5.46% during 2026–2035. The figures count principal written each year under finance leases, operating leases and hire purchase contracts on tractors, combines, sprayers and implements. Broadacre grain enterprises anchor demand because headers and high-horsepower tractors carry the largest contract values, while seasonal repayment terms fit income that arrives after harvest. Southeastern Australia held the largest regional share, 47.0% in 2025, and Western Australia is the fastest-growing region at 5.92% a year. A commercial change is also reshaping pricing, because manufacturer finance arms now publish separate subsidized rates for each machine class and term, which moves buyers toward captive contracts during end-of-year sales campaigns.
What does this market count, and how do Australian farmers buy?
The market counts the original principal financed during each year when farmers and contractors acquire machinery under a finance lease, an operating lease or a hire purchase contract. Buyers usually arrange these contracts at a machinery dealer, directly with a bank or through an asset finance broker, and they often match payment dates to harvest or livestock sales.
The equipment leasing estimate excludes chattel mortgages, outstanding portfolio balances, interest income and short-term machinery hire. This boundary matters because many Australian farm machines are also funded with secured loans, so the figures describe one part of machinery finance rather than all farm borrowing. The value chain runs from manufacturers and dealers through captive financiers, banks and independent lenders to the operating farm business.
Australia Agricultural Equipment Leasing Market Insights
- Written principal rises from USD 899.5 million in 2025 to USD 1.53 billion by 2035, a 5.46% CAGR across 2026–2035, supported by machine renewal after weak 2025 tractor sales.
- Southeastern Australia held 47.0% of 2025 principal, reflecting the dense New South Wales and Victorian cropping and dairy districts in the Credence Research regional estimate.
- Hire purchase led products with 46.0% of 2025 value, as an upfront goods and services tax credit suits owner-minded growers.
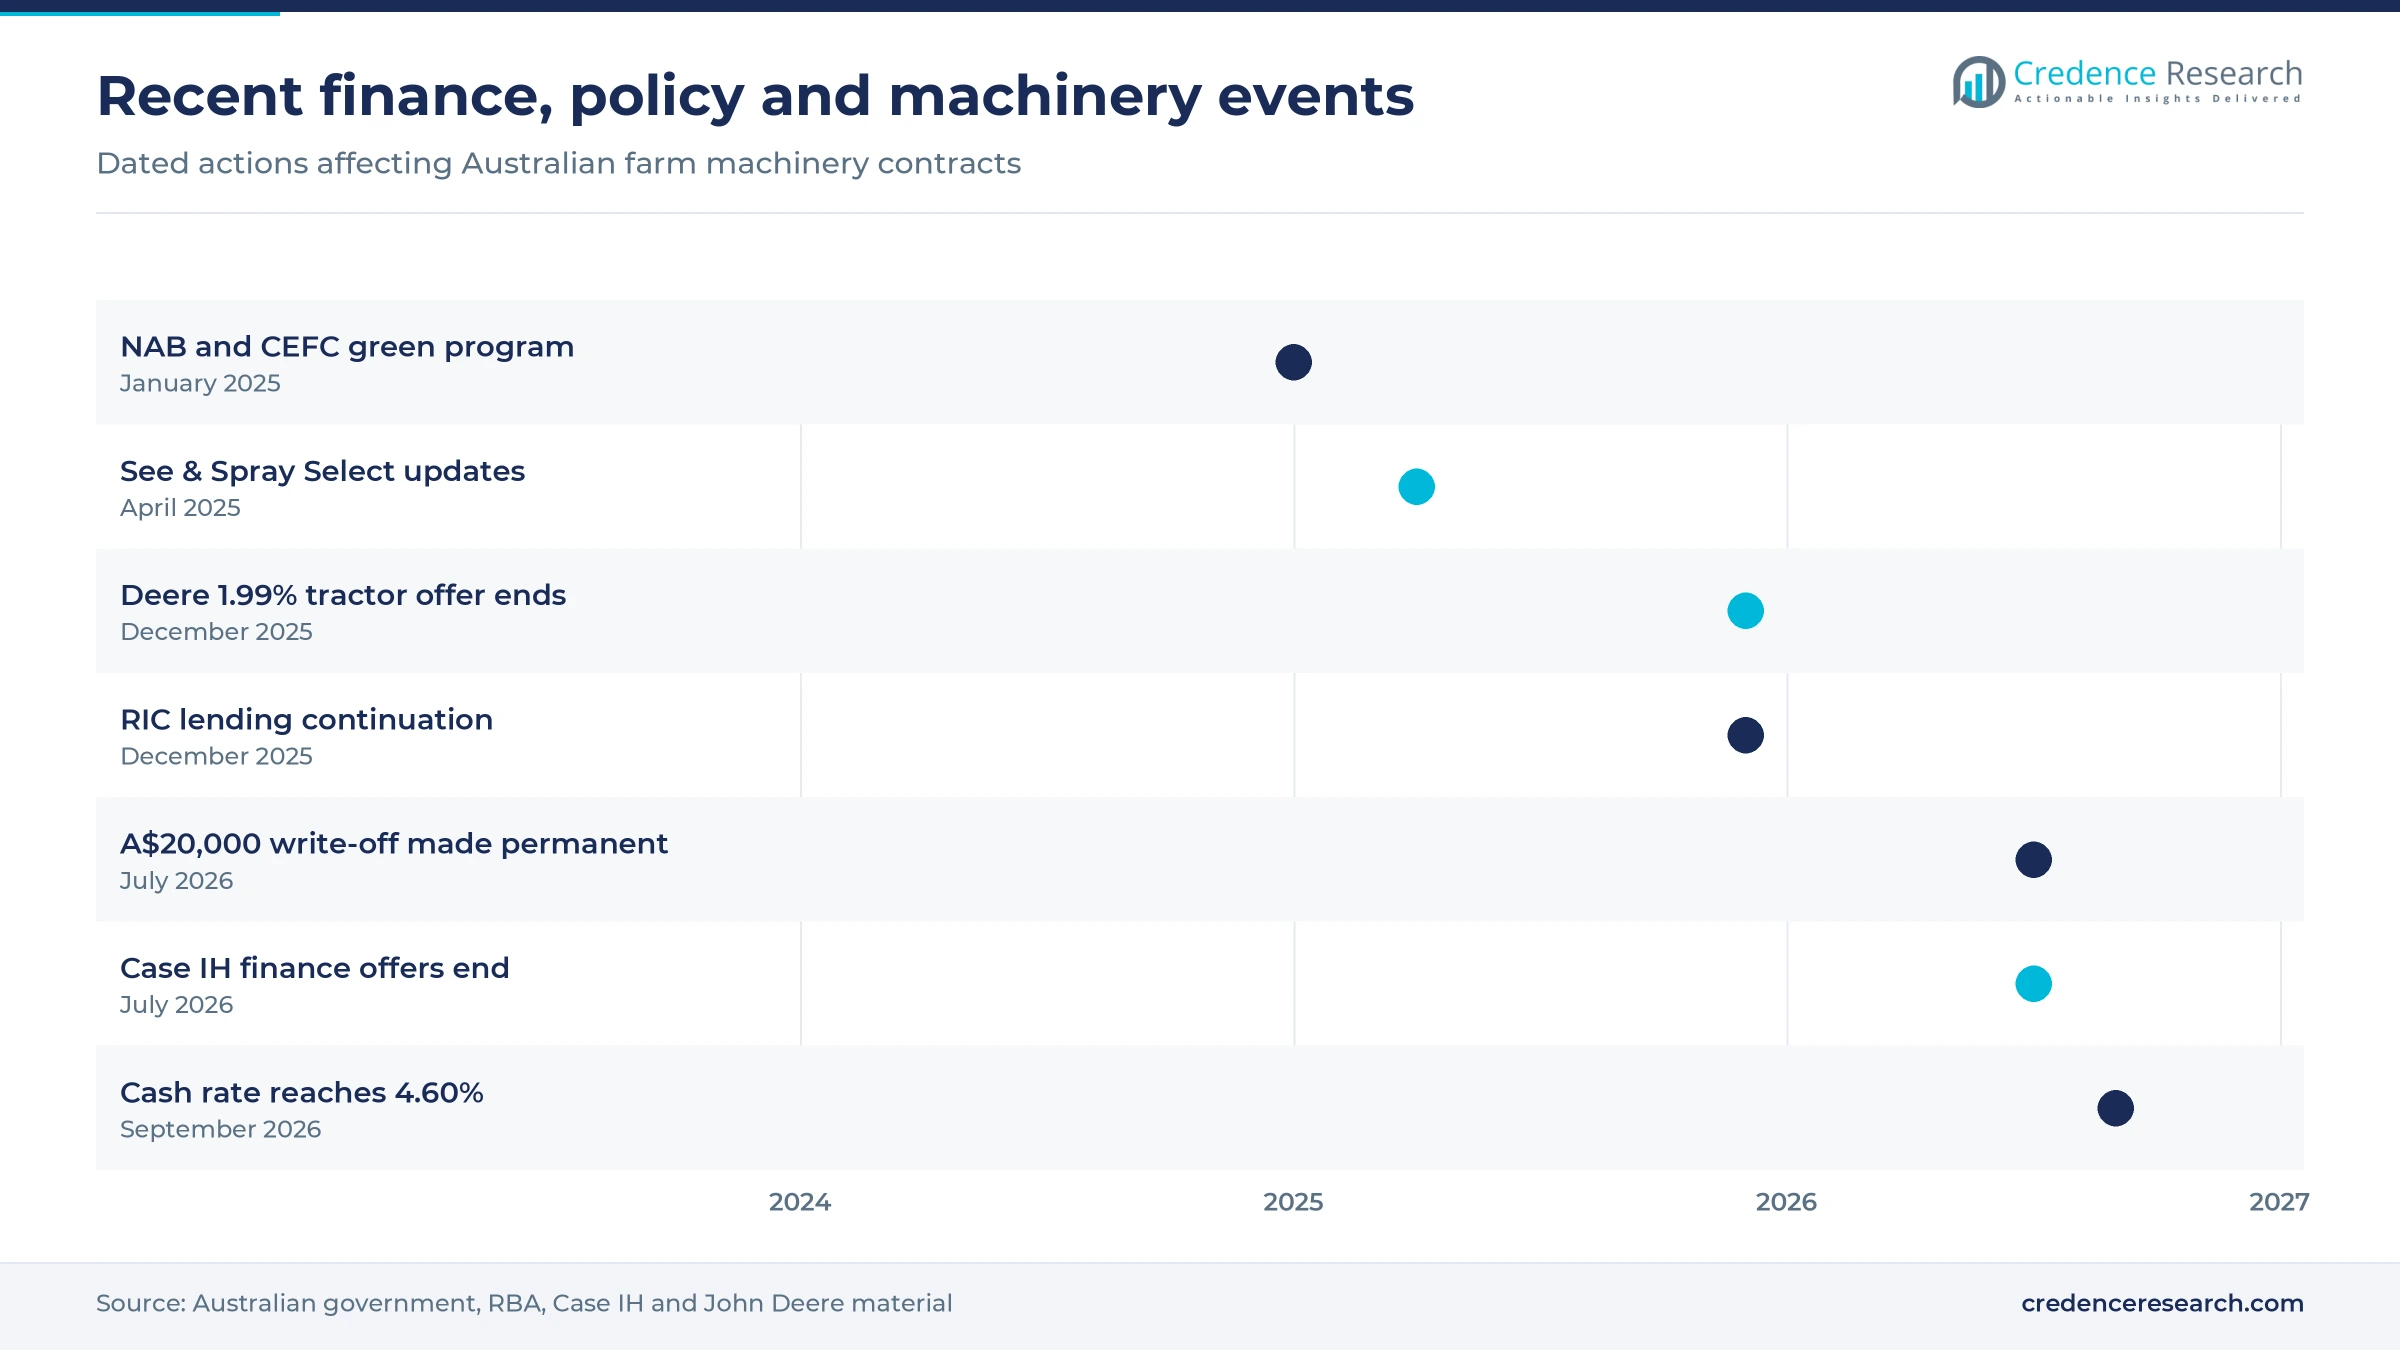
- The Reserve Bank of Australia lifted its cash rate to 4.60% on Sept. 30, 2026, which makes subsidized fixed-rate manufacturer offers more valuable to farm buyers.
- John Deere Financial, CNH Capital, Commonwealth Bank and National Australia Bank compete on rate, repayment structure and minimum contract size rather than on machinery brand alone.
Hire purchase, broadacre and dealers hold the leading shares
Why does hire purchase lead and operating leasing grow fastest?
Based on product type, the market is categorized into finance leases, operating leases and hire purchase. Hire purchase led with 46.0% of 2025 value because the Australian Taxation Office lets a non-cash basis buyer claim the full goods and services tax credit in one period on agreements made since July 1, 2012, whereas lease credits follow each payment. Operating leases grow fastest at 6.72% a year as bundled offers remove ownership risk. Trade Farm Machinery describes three-year Brandt leases on new John Deere equipment that include warranty and full maintenance, with return, purchase or refinance options at maturity.
Which farm businesses sign the largest contracts?
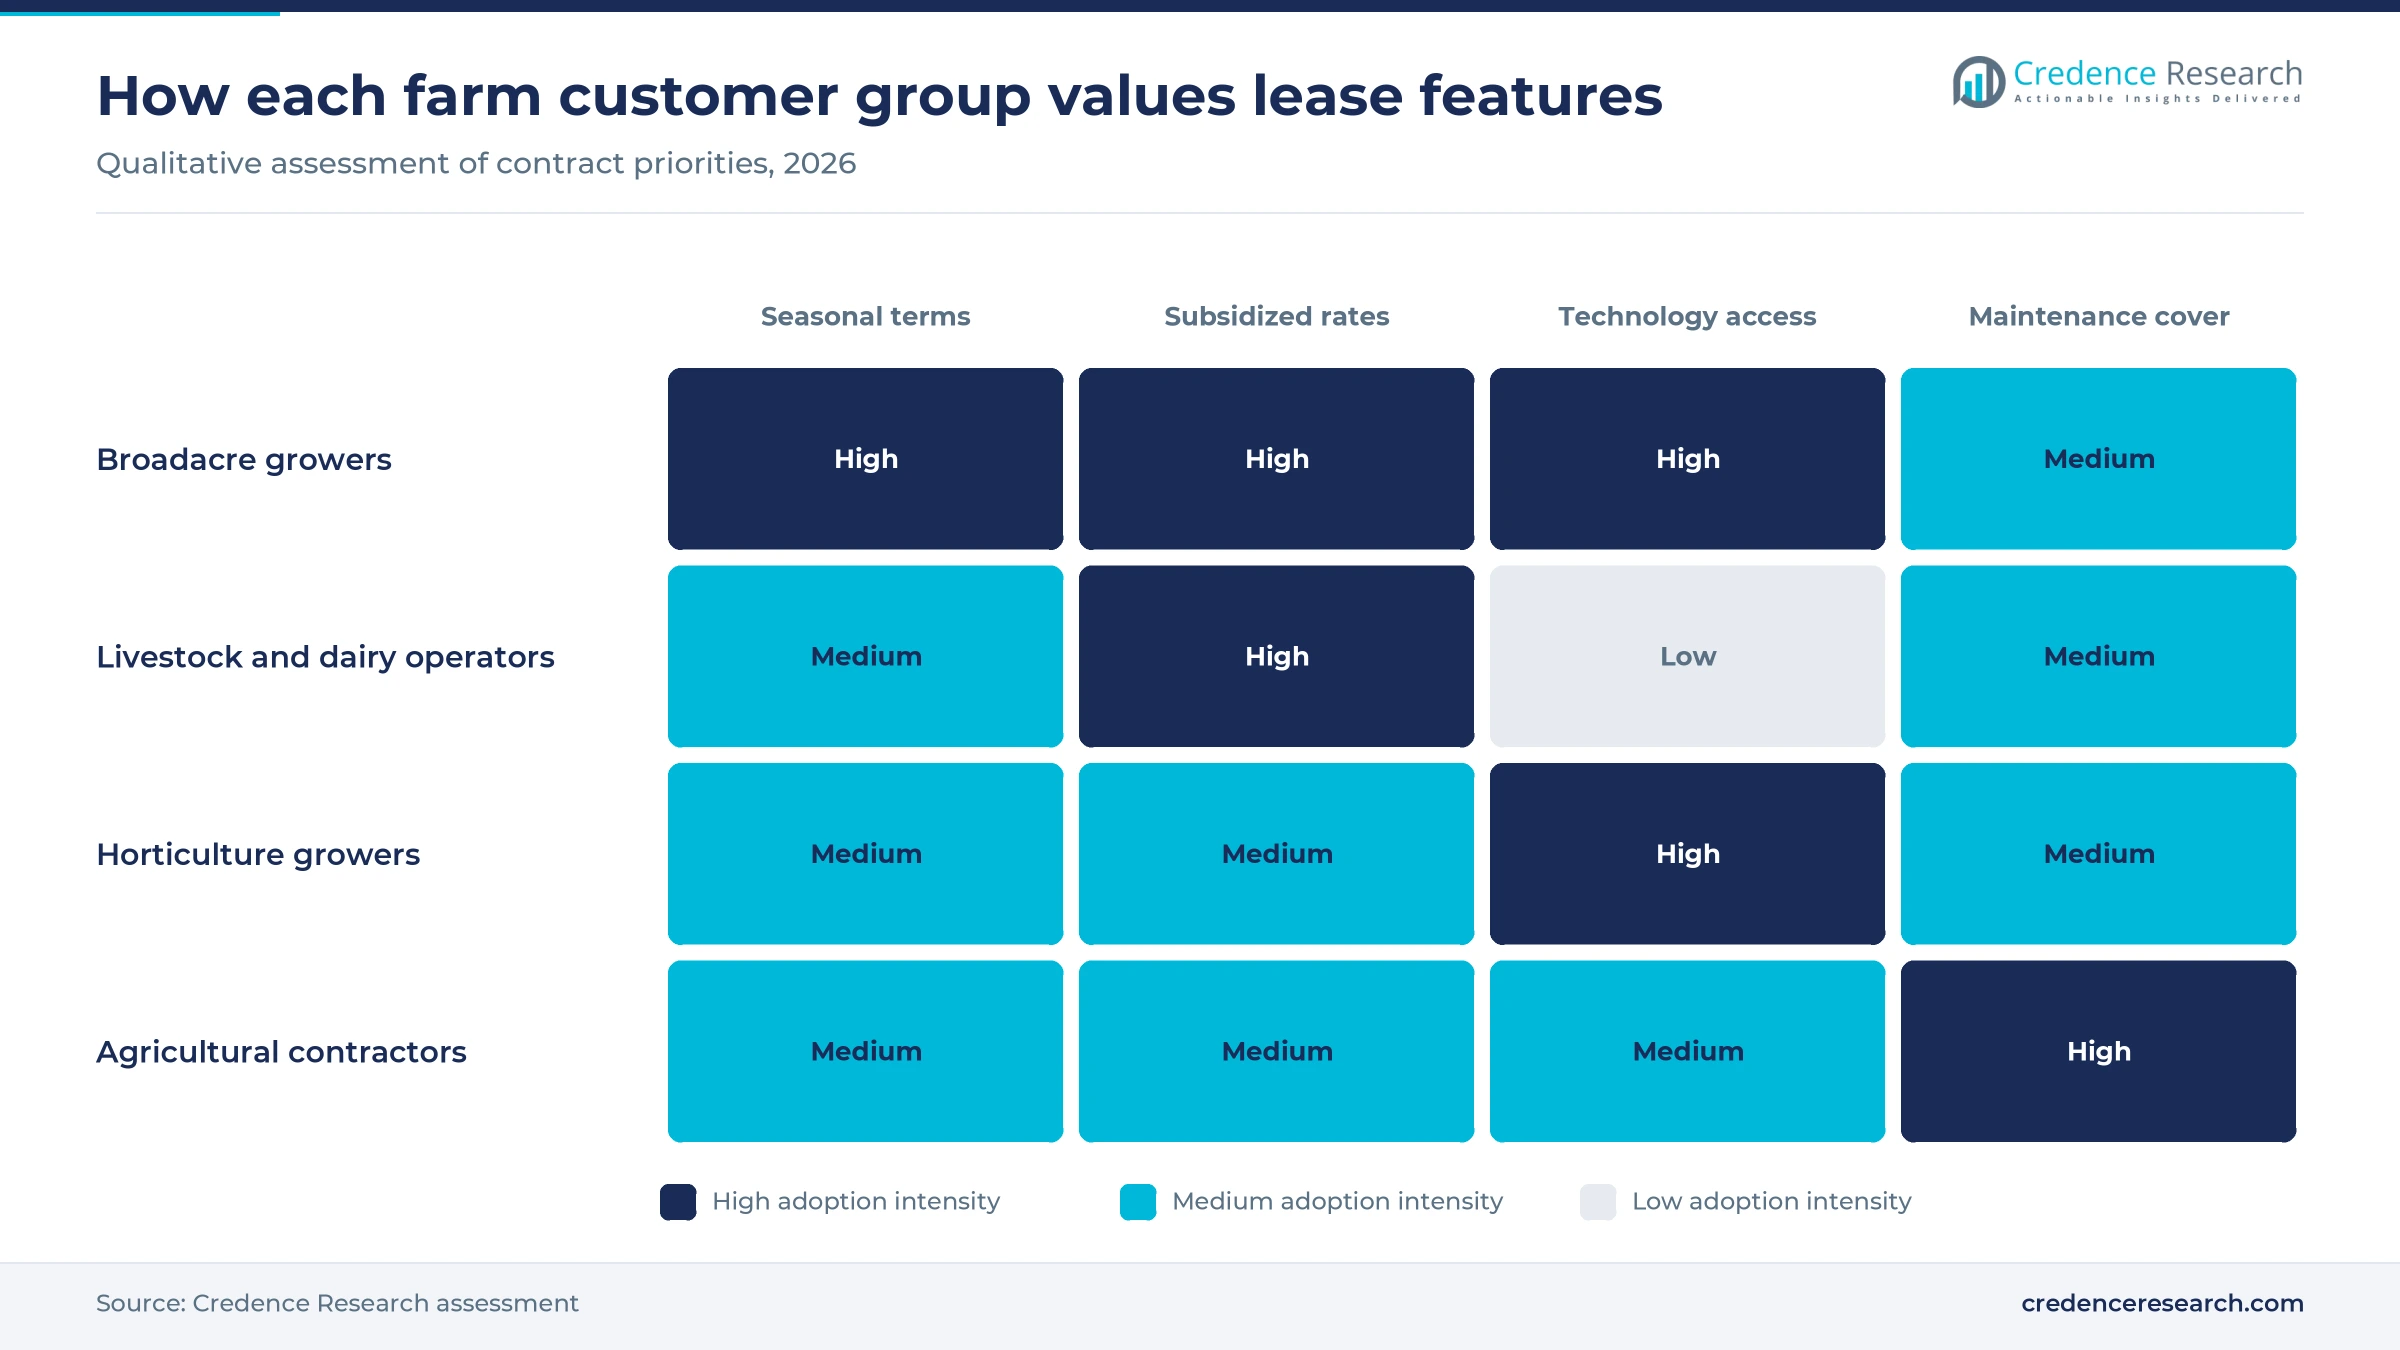
Based on customer segment, the market is categorized into broadacre growers, livestock and dairy operators, horticulture growers and agricultural contractors. Broadacre growers led with 54.0% of 2025 value because grain enterprises held about A$56 billion of farm loans and leases in 2024-25, almost 40% of farm debt, according to The Land. Horticulture growers grow fastest at 6.43% a year as nut and fruit lending averaged almost 10% annual growth over a decade. ABARES also found that about 40% of horticulture farms used machines such as fruit pickers to reduce labor needs in 2022-23.
Where do farmers actually arrange machinery finance?
Based on distribution channel, the market is categorized into dealer-arranged, bank-direct and broker-arranged contracts. Dealer-arranged contracts led with 52.0% of 2025 value because subsidized offers are sold at the point of purchase, such as the 0.99% CNH Capital rate on Case IH Farmall, Puma and Maxxum tractors that ended June 30, 2026, according to Farm Machinery Sales. Broker-arranged contracts grow fastest at 6.33% a year as used machines and non-subsidized assets need lender comparison. NAB said in July 2022 that it offers brokers rate lock-in options and advice on second-hand equipment policies.
Do captive financiers or banks hold the stronger position?
Based on institution type, the market is categorized into OEM captive financiers, deposit-taking banks and independent asset financiers. OEM captive financiers led with 44.0% of 2025 value because they can fund manufacturer subsidies, as John Deere Financial did with a 1.99% tractor offer that expired Dec. 31, 2025. Deposit-taking banks grow fastest at 5.75% a year as their retail reach widens. Commonwealth Bank reported agricultural machinery lending up 116% in December 2025 from a year earlier, and it temporarily cut its minimum finance amount from A$20,000 to A$10,000 for eligible customers.
| Segment Group | Leading Sub-segment | Share, 2025 | Fastest-growing Sub-segment | CAGR, 2026–2035 |
|---|---|---|---|---|
| By Product Type | Hire purchase | 46.0% | Operating leases | 6.72% |
| By Customer Segment | Broadacre growers | 54.0% | Horticulture growers | 6.43% |
| By Distribution Channel | Dealer-arranged | 52.0% | Broker-arranged | 6.33% |
| By Institution Type | OEM captive financiers | 44.0% | Deposit-taking banks | 5.75% |
Request a Free Sample
Fill in your details and we'll send you a free sample report.
- Sample data tables & charts
- Research methodology
Harvest timing and machine renewal pull finance forward
How does seasonal repayment alignment protect farm cash flow?
Contracts that defer or reshape payments win because farm income arrives in a few large receipts rather than monthly. John Deere Financial advertised a 36-month tractor contract through RDO Equipment with a 30% deposit and first repayments six months after settlement, an offer that expired Dec. 31, 2025. A 2024 New Holland campaign through CNH Industrial Capital similarly set the first payment in month four. AGCO Finance, on the Fendt Australia site, offers similar timing on chattel mortgages, a product outside this count, with instalments falling at the seasonal income peak. Demand for this structure grows when profits swing, because ABARES forecast average broadacre farm profit at A$133,000 for 2026-27, down 39%. Lenders therefore compete on repayment shape as well as rate.
Why do replacement cycles and technology access lift contract values?
A deferred replacement cycle is building because recent purchases fell well below normal levels. The Tractor and Machinery Association reported 9,521 tractor sales for 2025, down 7% on 2024 and 29.9% below the five-year average, which points to deferred demand. Kynetec client success lead Melinda Haley told the association in July 2025 that the sector remained in a correction phase. Machines also cost more to replace, as ABARES estimated tractor prices rose about 12% a year since 2016-17, according to The Land. That price pressure pushes growers of high-horsepower tractors toward financing, and the 200hp-plus class was up 2.6% in 2026 through April.
How do financing affordability and efficiency programs change the sums?
Discounted green rates and tax settings reduce the effective cost of eligible machinery, which brings smaller investments forward. The Clean Energy Finance Corporation committed A$300 million with National Australia Bank, announced Jan. 31, 2025, offering rate discounts of up to 1.15% on vehicles and heavy equipment. Commonwealth Bank launched green equipment finance in April 2023 with up to 0.5% off its standard rate for other eligible green assets. The Australian Taxation Office confirms a permanent A$20,000 instant asset write-off from July 1, 2026, enacted during 2026 and limited to businesses under A$10 million in turnover. These settings particularly suit horticulture growers and livestock operators buying modest-sized machines.
What does record farm output do for machinery investment?
Strong farm receipts give lenders and buyers confidence to commit to new contracts, even after a weak sales year. ABARES valued 2025-26 agricultural production at a record A$104.6 billion, even as tractor sales stayed weak that year. Lenders also see an efficiency case for newer machines, since the OECD reports Australian farm productivity growth slowing from 1.2% a year in 1991-2000 to -0.6% in 2013-2022. New machinery sales reached A$4.6 billion in 2025 according to the Tractor and Machinery Association, including A$816 million of combine harvesters. That pool of machines sets the ceiling for leasing activity, because lease and hire purchase principal follows new and used sales. Commonwealth Bank also reported a 20% rise in its overall business vehicle and equipment financing during December 2025.
Tiered subsidies and bank competition reshape pricing
Why is subsidized pricing shifting to tiers by machine class?
Manufacturers now price finance by machine class, and this shift concentrates the deepest subsidies on stock they most want to move. Farm Machinery Sales listed Case IH rates in its 2026 end-of-year guide at 0.99% on Farmall, Puma, Maxxum and Optum tractors, 3.45% over 36 months on Steiger and Magnum models, and 4.65% over four years on Axial-Flow combines. New Holland showed the same pattern, with 1.99% on selected compact to T7 models and 4.39% on CR combines. Massey Ferguson advertised rates from 0.48% on selected run-out high-horsepower models through June 30, 2026. Larger machines therefore carry higher rates and longer terms, which raises the value of standard bank pricing as an alternative for headers.
How is the rise in the cash rate changing bank competition?
Rate rises during 2026 are widening the gap between subsidized and standard contracts, so banks are competing harder on access. Reserve Bank of Australia records show the cash rate moving from 3.60% in December 2025 to 4.60% on Sept. 30, 2026, after four quarter-point increases. Commonwealth Bank temporarily reduced its minimum finance amount to A$10,000 to support smaller upgrades under the instant asset write-off. National Australia Bank had earlier expanded its Energy Efficient Bonus program to A$300 million with a 0.7 per cent discount on its standard equipment finance rate. Banks therefore use smaller tickets and green discounts to win farm customers that captive offers do not reach.
Where is the opening in maintenance-inclusive operating leases?
Operating leases offer an opening for financiers that can carry residual value risk, because many farms hold heavy capital in machines they use seasonally. A GRDC grower survey found average machinery investment of A$1.85 million and combined machinery-related costs of A$686 per hectare. Trade Farm Machinery describes three-year Brandt leases that include full maintenance, which turns repair costs into a known payment. James Oxenham, chief executive of the Hire and Rental Industry Association, argued in October 2025 that peak-season access can avoid ownership depreciation on harvesters. Sales of self-propelled sprayers fell 36% in 2025 according to Farm Machinery Sales, so lenders could use leases to revive demand in that class. Residual value data would be the main requirement for scale.
Why do horticulture and contractor fleets offer an opening?
Horticulture and contracting offer room for specialist lenders, because both groups depend on expensive machines and carry labor or utilization risk. ABARES reported in November 2024 that 64% of contract horticulture workers came through labor hire firms in 2022-23, up from 52% in 2019-20, which strengthens the case for mechanical harvesting. Parilla Potatoes in South Australia installed a variable-rate center pivot that cut energy use about 15%, according to National Australia Bank. Contract fleets involve far larger tickets, as NAB described A$1.4 million cotton pickers bought by Moree contractor BMC Partnership. GRDC data also show growers spending A$48,246 a year on contractors on average, which gives lenders measurable income to underwrite.
Arrears and a higher cash rate tighten farm credit
How serious is the rise in farm loan arrears?
Credit quality is now the sharpest constraint on lease approvals across farm districts. Farm loans more than 90 days overdue reached about A$2.1 billion by June 2025, up from almost A$1.2 billion a year earlier, while foreclosures doubled to 122, according to The Land citing APRA and ABARES data. Grain and beef borrowers carry the largest balances, so lenders are likely to ask for larger deposits on big machines. Seasonally adjusted credit scoring and farm-level cash flow reviews offer the most practical mitigation.
What does a higher cash rate do to standard contracts?
Higher funding costs reduce the appeal of unsubsidized contracts and shorten affordable terms. The Reserve Bank of Australia raised its cash rate four times between February and September 2026, taking it to 4.60%, as its published record shows. Used machinery and independent financiers feel this most, because they rarely carry manufacturer support on rates. The concessional alternative also matters, as Regional Investment Corporation loans carried a 5.18% variable rate in March 2026. Fixed-rate quotes and shorter terms can limit the damage for borrowers.
How does a softer 2026-27 season affect machinery buying?
Lower expected earnings can delay signing even when machines are due for renewal. ABARES forecast 2026-27 production at A$99.4 billion, down 5%, and winter crop volume at 61 million metric tons, down 12%. The Tractor and Machinery Association also reported 2026 tractor sales 8.5% below 2025 through April, with April volume down 10%, which points to softer near-term demand. Dealers and captive financiers therefore face thin farm machinery order books in weaker districts. Deferred first payments and stock-specific subsidies remain their main tools for keeping contract flow moving through a softer season.
Why do registration and tax rules add friction for lessors?
Compliance adds cost because the legal form of each contract changes both security and tax treatment. RSM Australia notes that leases of farm machinery for two years or more fall under the Personal Property Securities Act, in effect since Jan. 30, 2012, so lessors must register interests on the national register. The Australian Taxation Office also treats hire purchase and lease payments differently for goods and services tax credits. Smaller independent lessors bear this burden most heavily, and standardized documents help reduce errors.
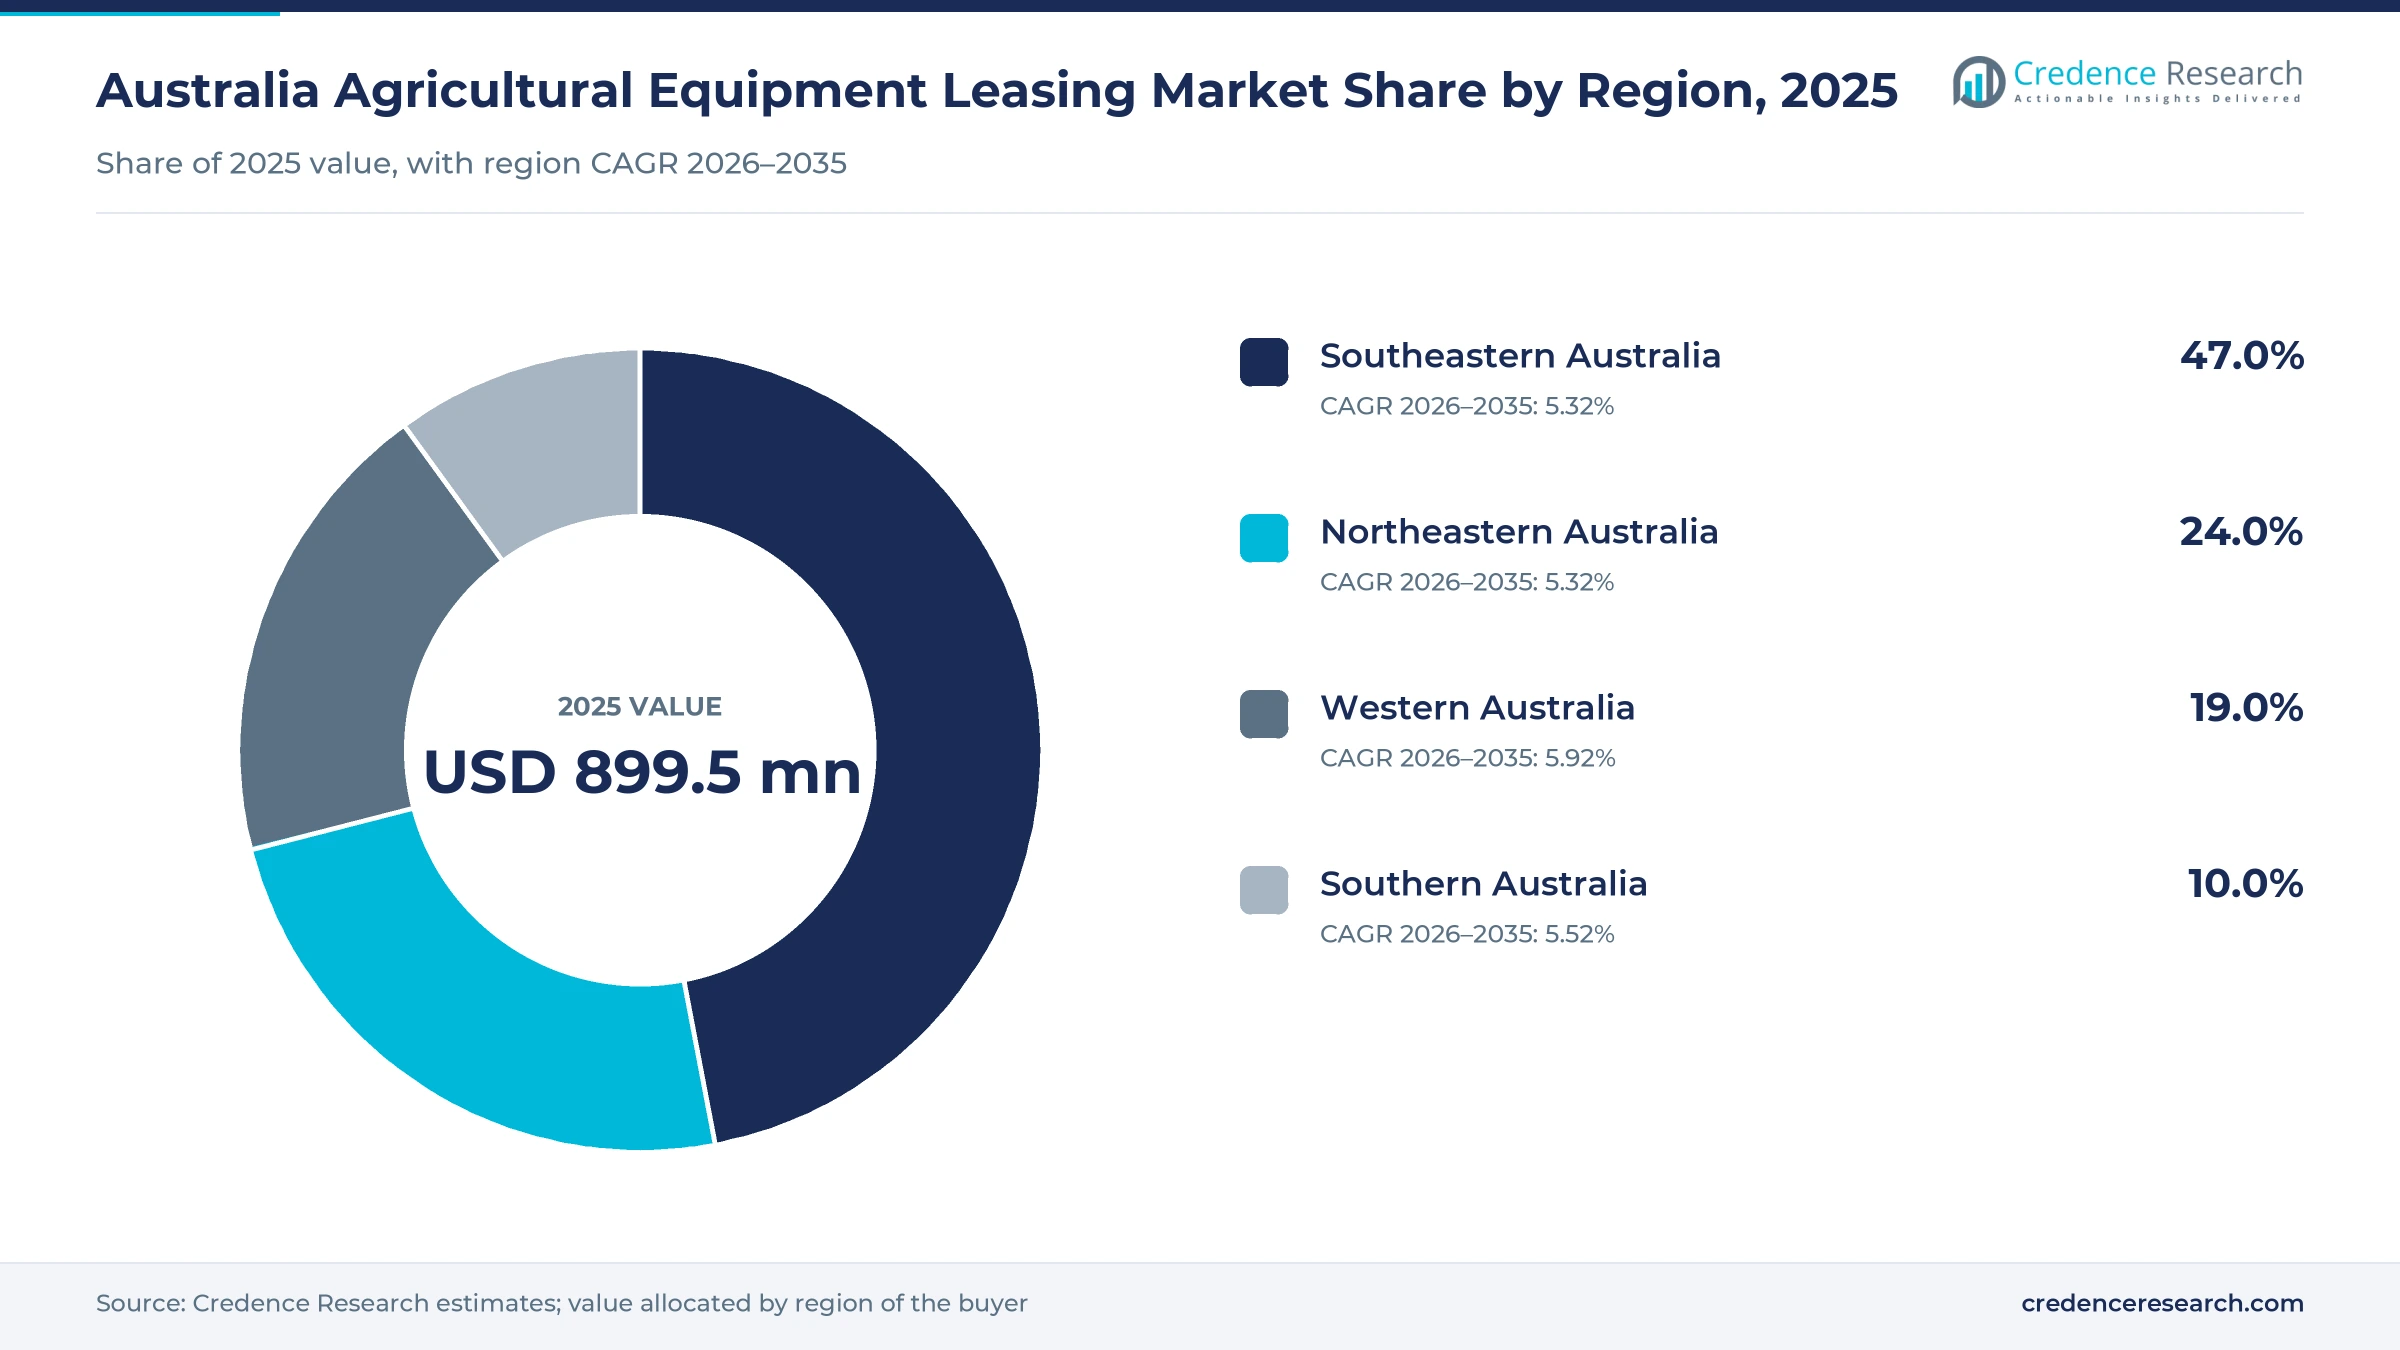
Southeast leads by volume while the West grows fastest
| Region | Value, 2025 (USD million) | Share, 2025 | CAGR, 2026–2035 |
|---|---|---|---|
| Southeastern Australia | 422.8 | 47.0% | 5.32% |
| Northeastern Australia | 215.9 | 24.0% | 5.32% |
| Western Australia | 170.9 | 19.0% | 5.92% |
| Southern Australia | 90.0 | 10.0% | 5.52% |
Southeastern Australia keeps the largest contract base
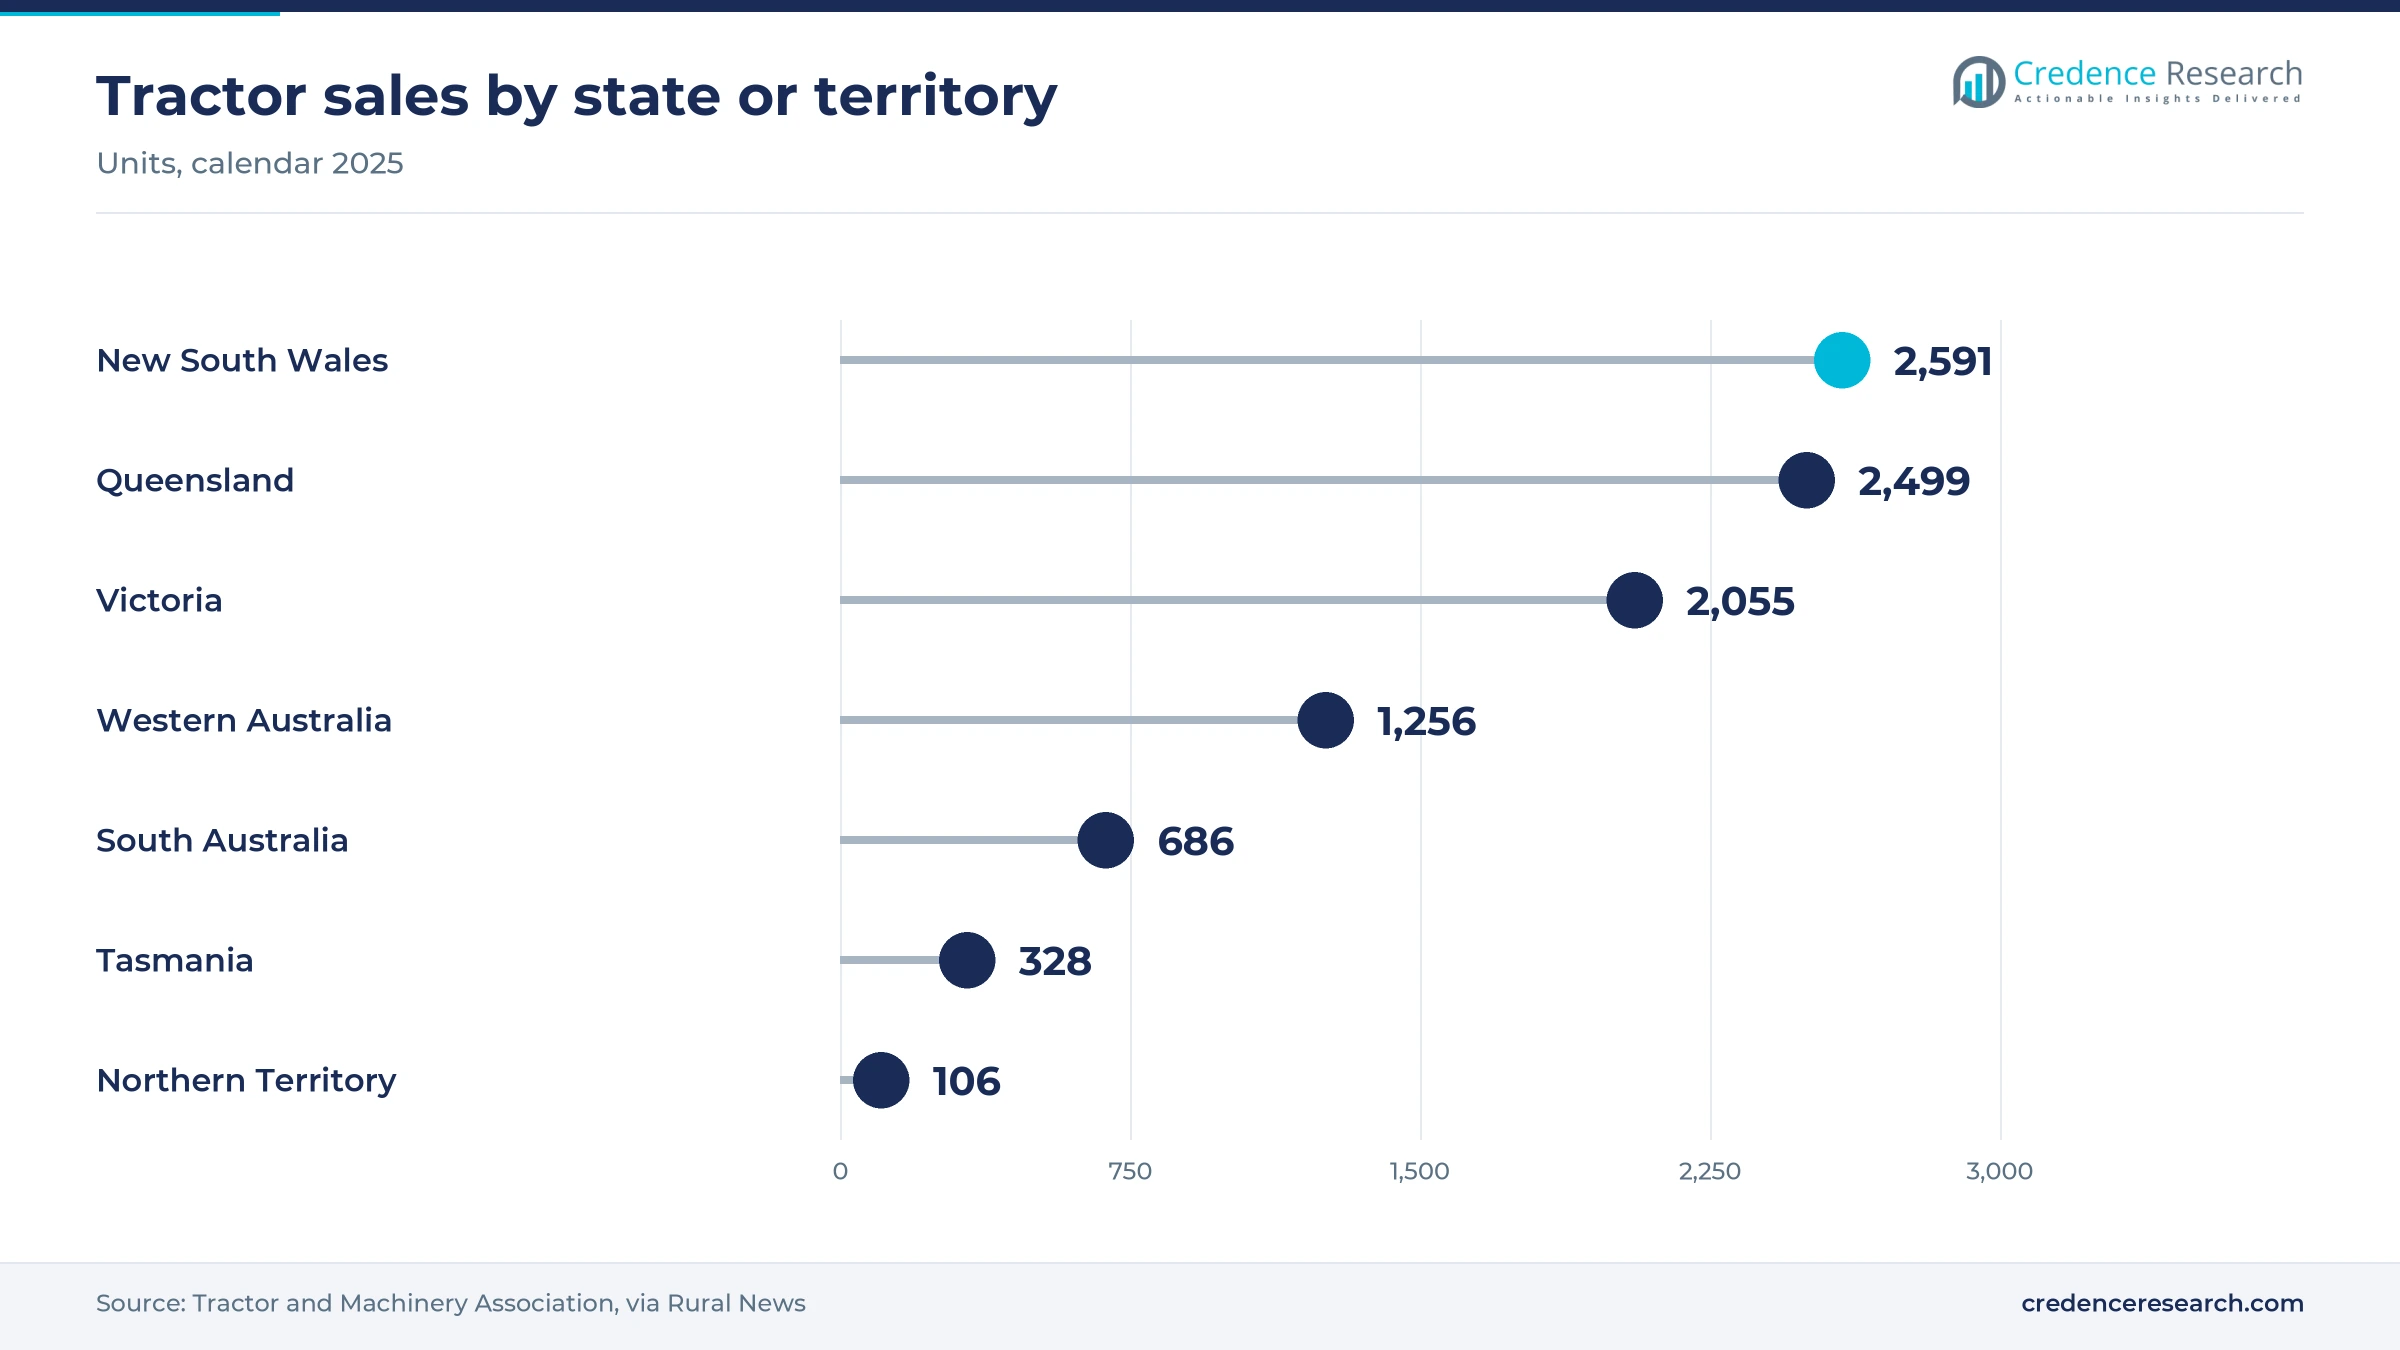
Southeastern Australia held 47.0% of 2025 value and grows at 5.32% a year. The zone recorded 2,591 tractor sales in New South Wales, 2,055 in Victoria and 328 in Tasmania during 2025, according to the Tractor and Machinery Association, the largest combined base in the country. Victorian sales fell 16%, a decline Stock & Land linked to drought in the state. ABARES expects favorable 2026-27 conditions in Victoria and southern New South Wales, which should steady approvals for cropping and dairy contracts.
Northeastern Australia relies on cattle, cane and cotton
Northeastern Australia held 24.0% of 2025 value and grows at 5.32% a year. Queensland recorded 2,499 tractor sales in 2025, down 2.5%, and the Northern Territory recorded 106, up 9.3%, according to the Tractor and Machinery Association. The Australian Bureau of Statistics found that about 96% of Australian sugarcane is grown in Queensland, which supports specialized harvester contracts. ABARES expects poor 2026-27 winter crop conditions in Queensland, so near-term approvals could lag the national rate.
Western Australia gains from broadacre scale
Western Australia held 19.0% of 2025 value and grows fastest at 5.92% a year. The state grew 35.6% of national wheat and 45.6% of canola in 2022-23, according to the Australian Bureau of Statistics, which favors large machines with larger contract values. Farm lending there grew 8.2% in 2024-25, while tractor demand rose 1.6% in 2025 to 1,256 units. GRDC survey data show the largest average cropped area in the West, at 3,767 hectares.
Southern Australia rebuilds after drought
Southern Australia held 10.0% of 2025 value and grows at 5.52% a year. South Australian tractor sales fell 9% to 686 units in 2025 after drought, according to the Tractor and Machinery Association, while Kynetec data showed sprayer sales down 65% in the 12 months to June 2025. Farm lending demand still grew 7.5% in 2024-25, according to The Land. ABARES expects favorable winter crop conditions there in 2026-27, which should support a contract recovery from this low base.
Recent rate, program and machinery finance actions
| Development | Status and market relevance |
|---|---|
| In January 2025, the Clean Energy Finance Corporation and National Australia Bank announced a A$300 million green asset finance program with discounts of up to 1.15%. | Active; covers vehicles and heavy equipment. |
| In April 2025, John Deere extended See & Spray Select variable-rate updates to Australia after grower testing in Western Australia, New South Wales and Victoria. | Available; factory-fit on model year 2026 sprayers. |
| In December 2025, the Australian government said Regional Investment Corporation lending will continue beyond June 2026, with more than A$5 billion committed. | Continuing; loans can fund machinery. |
| In May 2026, the Australian government announced a permanent A$20,000 instant asset write-off from July 1, 2026, for small businesses under A$10 million in turnover. | Now law; assessed per eligible asset. |
| In May 2026, the Tractor and Machinery Association reported A$4.6 billion of 2025 machinery sales and 2026 tractor sales 8.5% lower through April. | Published; shows the current sales trough. |
Vision spraying and efficient pivots shift asset choice
- See & Spray Select is available from the factory on model year 2026 John Deere 400 and 600 Series sprayers with steel booms, which raises the value of a new-machine contract, according to Rural Business Magazine.
- Precision upgrade kits add the camera system to older John Deere sprayers, so a grower can finance a smaller upgrade rather than a full replacement machine.
- Variable-rate center pivots cut water and fertilizer use by about 20% at Parilla Potatoes in South Australia, an example cited by National Australia Bank under its energy efficiency program.
- Electric and hydrogen machinery can qualify for Commonwealth Bank green finance, which covers up to 100% of the purchase price, according to The Adviser in April 2023.
Need a Custom Version of This Report?
Tailor the scope, geography, or segments to your exact requirements.
- Custom geography or segment scope
- Direct access to our analyst team
Manufacturer captives compete with two major banks
Competition splits between manufacturer finance arms, which use subsidies to support machinery sales, and banks, which compete on relationships, broad asset coverage and green discounts. John Deere Financial sells through dealers such as RDO Equipment and Emmetts, CNH Capital backs Case IH and New Holland campaigns, and AGCO Finance is named on Fendt Australia as the partner for lease and chattel mortgage plans. National Australia Bank and Commonwealth Bank approach the same buyers through agribusiness bankers and asset finance teams. In equipment leasing, captives usually win where a single brand and new stock are involved, while banks win mixed fleets and used machines. Credence Research expects independents to stay smaller because they lack both subsidy funding and deposit funding.
Companies profiled and their roles in this market
| Company | Type | Role in the market |
|---|---|---|
| John Deere Financial Limited | OEM captive financier | Funds John Deere machinery offers through dealers, including deferred tractor contracts |
| CNH Capital Australia Pty Limited | OEM captive financier | Backs Case IH and New Holland subsidized campaigns by machine class |
| AGCO Finance Pty Limited | OEM captive financier | Named on Fendt Australia for lease and chattel mortgage plans |
| National Australia Bank Limited | Deposit-taking bank | Runs green equipment finance with the Clean Energy Finance Corporation |
| Commonwealth Bank of Australia | Deposit-taking bank | Reports agricultural machinery lending and offers green asset finance |
Subsidized rates matter more than headline demand
Credence Research's view is that subsidized rates will decide more contracts than headline machinery demand during the next three years. With the cash rate up a full percentage point during 2026, a subsidized tractor offer delivers a benefit that buyers can calculate immediately, so captives should hold their position in new tractors. Banks have a clearer market share path in headers, mixed fleets and used machines, where the gap between captive and standard rates narrows. Equipment leasing lenders that price seasonal risk by district will also avoid much of the arrears pressure now visible in farm lending.
How Credence Research built the principal estimate
The report uses 2025 as the base year and 2035 as the final forecast year, with market values from the Credence Research model. The equipment leasing value measures principal financed during the year, and it was tested against Tractor and Machinery Association machinery sales and APRA farm lending data. Product, customer, channel, institution and regional splits are Credence Research estimates, with regional shares starting from state tractor sales and adjusted for cropping scale, while farm lending informed regional growth rates. Sources include ABARES, the Australian Bureau of Statistics, the Reserve Bank of Australia, the Australian Taxation Office, OECD policy monitoring, lender releases and trade press. No interviews or surveys were conducted by Credence Research for this report.
Machine renewal should outlast a softer 2026-27 season
Equipment leasing principal should rise steadily through 2035, although 2026-27 looks softer as ABARES expects lower production and profit. The renewal case remains intact because 2025 tractor sales sat 29.9% below their five-year average, leaving replacement demand deferred. Operating leases and broker-arranged contracts should gain share from small bases, while hire purchase stays the largest product. Western Australia should keep the fastest growth on large cropping machines. Rate direction is the main variable, since a sustained high cash rate would favor captives over standard bank contracts for years.
Frequently Asked Questions
How big is the Australia agricultural equipment leasing market?
What does this market exclude?
Which product type leads the market?
Which customer segment is largest?
Which region leads, and which grows fastest?
How do seasonal repayments work on these contracts?
How did interest rates affect leasing in 2026?
Which companies are active in this market?
Table of Content
Chapter 1 Market Segmentation
- 1.1 Segmentation Framework
- 1.1.1 Product and Service Classification
- 1.1.2 Application and End-Use Classification
- 1.1.3 Technology and Solution Classification
- 1.1.4 Customer and Distribution Channel Classification
- 1.1.5 Geographic Segmentation
- 1.1.6 Market Segment Definitions and Boundaries
- 1.2 By Product Type
- 1.2.1 Hire purchase
- 1.2.2 Finance leases
- 1.2.3 Operating leases
- 1.3 By Customer Segment
- 1.3.1 Broadacre growers
- 1.3.2 Livestock and dairy operators
- 1.3.3 Horticulture growers
- 1.3.4 Agricultural contractors
- 1.4 By Institution Type
- 1.4.1 OEM captive financiers
- 1.4.2 Deposit-taking banks
- 1.4.3 Independent asset financiers
Chapter 2 Introduction
- 2.1 Report Objectives and Scope
- 2.2 Product Definition and Industry Terminology
- 2.3 Market Inclusions and Exclusions
- 2.4 Research Process
- 2.4.1 Primary Research and Expert Interviews
- 2.4.2 Secondary Research and Source Review
- 2.4.3 Top-Down and Bottom-Up Estimation
- 2.4.4 Data Triangulation and Verification
- 2.5 Market Size Measurement Basis
- 2.5.1 2025: USD 899.5 million → 2035: USD 1.53 billion
- 2.6 Historical and Forecast Reference Periods
- 2.6.1 Historical Period: 2018-2025
- 2.6.2 Base Year: 2025
- 2.6.3 Forecast Period: 2025-2035
- 2.7 Research Assumptions and Limitations
Chapter 3 Executive Summary
- 3.1 Market Snapshot and Key Findings
- 3.2 Base-Year Market Size, 2025
- 3.3 Forecast Market Size, 2035
- 3.4 Revenue and Volume Growth Outlook
- 3.5 Key Demand and Supply Indicators
- 3.6 Leading Market Segments
- 3.7 Fastest-Growing Market Opportunities
- 3.8 Regional Performance Highlights
- 3.9 Technology and Industry Transformation
- 3.10 Competitive Landscape Summary
- 3.11 Analyst View and Strategic Implications
Chapter 4 Australia Agricultural Equipment Leasing Market Trends and Developments
- 4.1 Historical Industry Development, 2018-2025
- 4.2 Recent Market Trends and Developments
- 4.3 Demand and Customer Behavior Trends
- 4.4 Technology and Product Innovation
- 4.5 Artificial Intelligence, Automation and Digitalization
- 4.6 Local Manufacturing and Supply Chain Realignment
- 4.7 Industry Partnerships, Mergers and Acquisitions
- 4.8 Sustainability and Circular Economy Developments
- 4.9 Government and Private Sector Investment Trends
- 4.10 Emerging Business Models and Commercialization
- 4.11 Industry Developments and Announcements
Chapter 5 Australia Agricultural Equipment Leasing Market Production, Supply and Demand Analysis
- 5.1 Demand Trend and Consumption Analysis, 2018-2025
- 5.2 Demand Forecast, 2025-2035
- 5.3 Production and Output Trend, 2018-2025
- 5.4 Production and Output Forecast, 2025-2035
- 5.5 Installed Capacity and Capacity Utilization
- 5.6 Company-Wise Production Plants and Statistics
- 5.6.1 Installed Production Capacity
- 5.6.2 Actual Production
- 5.6.3 Planned Capacity and Expansion Targets
- 5.7 Supply Chain Structure and Procurement Trends
- 5.8 Supply-Demand Gap and Bottlenecks
- 5.9 Import Dependence and Sourcing Structure
- 5.10 Contract Manufacturing and Outsourcing
- 5.11 Regional Supply and Demand Concentration
Chapter 6 Australia Agricultural Equipment Leasing Market Pricing Analysis
- 6.1 Pricing Structure and Measurement
- 6.2 Historical Pricing Trends, 2018-2025
- 6.3 Pricing Outlook, 2025-2035
- 6.4 Average Selling Price and Unit Economics
- 6.5 Pricing by Product and Market Segment
- 6.6 Geographic Pricing Differences
- 6.7 Key Input, Energy, Labor and Logistics Costs
- 6.8 Contract Pricing and Purchasing Models
- 6.9 Pricing Sensitivity and Competitive Positioning
- 6.10 Price, Margin and Profitability Implications
Chapter 7 Australia Agricultural Equipment Leasing Market Dynamics
- 7.1 Market Growth Drivers
- 7.1.1 Demand-Side Drivers
- 7.1.2 Technology and Innovation Drivers
- 7.1.3 Infrastructure and Investment Drivers
- 7.1.4 Regulatory and Policy Drivers
- 7.2 Market Restraints
- 7.2.1 Cost and Affordability Constraints
- 7.2.2 Technology and Adoption Barriers
- 7.2.3 Supply Chain and Operational Constraints
- 7.3 Market Challenges
- 7.3.1 Competitive Pressure and Margin Erosion
- 7.3.2 Skills, Infrastructure and Implementation Gaps
- 7.4 Emerging Market Opportunities
- 7.5 Market Dynamics Impact and Time-Horizon Assessment
Chapter 8 Australia Agricultural Equipment Leasing Value Chain Analysis
- 8.1 Industry Value Chain Overview
- 8.2 Upstream Suppliers and Critical Inputs
- 8.3 Technology and Component Providers
- 8.4 Manufacturing or Service Delivery
- 8.5 Distribution, Channel Partners and Integrators
- 8.6 Downstream Applications and End Users
- 8.7 Value Addition and Profit Pools
- 8.8 Vertical Integration and Outsourcing
- 8.9 Supplier Concentration and Risk
- 8.10 Supply Chain Localization and Resilience
Chapter 9 Australia Agricultural Equipment Leasing Market Regulations and Policies
- 9.1 Relevant Laws, Standards and Compliance Frameworks
- 9.2 Product, Service, Safety and Quality Requirements
- 9.3 Government Policies, Incentives and Subsidies
- 9.4 Imports, Exports and Trade Barriers
- 9.5 Public Procurement and Local Content Requirements
- 9.6 Environmental and Sustainability Compliance
- 9.7 Upcoming Policy Changes and Market Implications
Chapter 10 Australia Agricultural Equipment Leasing Market Hotspots and Opportunities
- 10.1 Market Opportunity Mapping and Growth Hotspots
- 10.2 High-Growth Applications and Customer Groups
- 10.3 Underserved Markets and White-Space Opportunities
- 10.4 Emerging Technology and Product Opportunities
- 10.5 New Capacity and Investment Hotspots
- 10.6 Market Entry and Expansion Opportunities
- 10.7 Distribution and Partnership Opportunities
- 10.8 Near-Term and Long-Term Commercial Potential
- 10.9 Opportunity Attractiveness and Execution Risks
Chapter 11 Australia Agricultural Equipment Leasing Market Outlook, 2025-2035
- 11.1 Market Size and Analysis
- 11.1.1 Revenue (Market Measurement: 2025: USD 899.5 million → 2035: USD 1.53 billion)
- 11.1.2 Market Volume and Quantity Sold
- 11.1.3 Historical Market Size, 2018-2025
- 11.1.4 Base-Year Market Size, 2025
- 11.2 Market Forecast, 2025-2035
- 11.2.1 Revenue Forecast to 2035
- 11.2.2 Volume Forecast to 2035
- 11.2.3 CAGR and Year-on-Year Growth
- 11.2.4 Incremental Revenue Opportunity
- 11.3 Forecast Assumptions and Scenario Analysis
- 11.3.1 Base-Case Forecast
- 11.3.2 Optimistic and Conservative Scenarios
- 11.3.3 Technology, Pricing and Policy Sensitivities
- 11.4 Market Attractiveness and Growth Outlook
Chapter 12 Australia Agricultural Equipment Leasing Market Segmentation and Outlook
- 12.1 Segmentation Summary and Market Shares, 2025
- 12.2 Largest and Fastest-Growing Segments
- 12.3 By Product Type - Market Size and Forecast, 2025-2035
- 12.3.1 Segment Definition and Scope
- 12.3.2 Historical Market Size, 2018-2025
- 12.3.3 Revenue Forecast, 2025-2035
- 12.3.4 Volume Forecast, 2025-2035
- 12.3.5 Base-Year Market Share, 2025
- 12.3.6 Segment CAGR and Growth Drivers
- 12.3.7 Subsegment Market Size and Forecast
- 12.3.7.1 Hire purchase
- 12.3.7.2 Finance leases
- 12.3.7.3 Operating leases
- 12.3.8 Subsegment Pricing and Adoption Trends
- 12.3.9 Leading Suppliers and Competition
- 12.3.10 Regional Demand and Opportunities
- 12.4 By Customer Segment - Market Size and Forecast, 2025-2035
- 12.4.1 Segment Definition and Scope
- 12.4.2 Historical Market Size, 2018-2025
- 12.4.3 Revenue Forecast, 2025-2035
- 12.4.4 Volume Forecast, 2025-2035
- 12.4.5 Base-Year Market Share, 2025
- 12.4.6 Segment CAGR and Growth Drivers
- 12.4.7 Subsegment Market Size and Forecast
- 12.4.7.1 Broadacre growers
- 12.4.7.2 Livestock and dairy operators
- 12.4.7.3 Horticulture growers
- 12.4.7.4 Agricultural contractors
- 12.4.8 Subsegment Pricing and Adoption Trends
- 12.4.9 Leading Suppliers and Competition
- 12.4.10 Regional Demand and Opportunities
- 12.5 By Institution Type - Market Size and Forecast, 2025-2035
- 12.5.1 Segment Definition and Scope
- 12.5.2 Historical Market Size, 2018-2025
- 12.5.3 Revenue Forecast, 2025-2035
- 12.5.4 Volume Forecast, 2025-2035
- 12.5.5 Base-Year Market Share, 2025
- 12.5.6 Segment CAGR and Growth Drivers
- 12.5.7 Subsegment Market Size and Forecast
- 12.5.7.1 OEM captive financiers
- 12.5.7.2 Deposit-taking banks
- 12.5.7.3 Independent asset financiers
- 12.5.8 Subsegment Pricing and Adoption Trends
- 12.5.9 Leading Suppliers and Competition
- 12.5.10 Regional Demand and Opportunities
- 12.6 Segment Growth Comparison
- 12.7 Segment Attractiveness and Priority Matrix
Chapter 13 Australia Agricultural Equipment Leasing End-Use and Application Market Outlook
- 13.1 End-Use Industry and Customer Demand Structure
- 13.2 Leading Applications and Customer Groups
- 13.3 End-Use Market Size, Share and Forecast
- 13.4 Major End-Use Industry Deep Dives
- 13.4.1 Customer Requirements and Use Cases
- 13.4.2 Demand and Replacement Cycles
- 13.4.3 Technical and Regulatory Considerations
- 13.4.4 Purchasing and Procurement Models
- 13.4.5 Leading Vendors and Distribution Channels
- 13.4.6 Forecast and Commercial Opportunities
- 13.5 Emerging Applications and Cross-Segment Demand
- 13.6 End-Use Industry Investment Priorities
Chapter 14 Australia Agricultural Equipment Leasing Geographic Market Outlook, 2025-2035
- 14.1 Domestic Market Distribution and Demand Clusters
- 14.2 State- or Province-Wise Market Size and Forecast, 2025-2035
- 14.3 City and Metropolitan Market Outlook
- 14.4 Industrial, Manufacturing and Commercial Clusters
- 14.5 Geographic Concentration of Key End Users
- 14.6 Local Pricing and Purchasing Differences
- 14.7 Domestic Production Facilities and Capacity Map
- 14.8 Local Infrastructure and Project Pipeline
- 14.9 State-Level Policy and Incentive Differences
- 14.10 Subnational Investment Hotspots and Opportunities
- 14.11 Distribution and Logistics Networks
- 14.12 Domestic Competitive Footprint
Chapter 15 Australia Agricultural Equipment Leasing Technology, Innovation and Sustainability Outlook
- 15.1 Technology Landscape and Maturity
- 15.2 Product, Process and Service Innovation
- 15.3 AI, Automation and Digital Tools in the Industry
- 15.4 Technology Adoption and Performance Benchmarking
- 15.5 Innovation Pipeline and R&D Investment
- 15.6 Patent and Intellectual Property Trends
- 15.7 Energy Efficiency and Resource Management
- 15.8 Sustainability, Recycling and Circularity
- 15.9 Technology Roadmap, 2025-2035
- 15.10 Risks of Obsolescence and Technology Substitution
Chapter 16 Australia Agricultural Equipment Leasing Market Key Strategic Imperatives
- 16.1 Growth and Market Entry Priorities
- 16.2 High-Return Products and Segments
- 16.3 Pricing, Profitability and Cost Optimization
- 16.4 Technology Investment and Product Differentiation
- 16.5 Supply Chain Localization and Resilience
- 16.6 Distribution and Customer Acquisition
- 16.7 Partnership, Acquisition and Capacity Strategy
- 16.8 Regional Expansion Priorities
- 16.9 Short-, Medium- and Long-Term Actions
Chapter 17 Competition Outlook
- 17.1 Industry Competition Characteristics
- 17.2 Market Structure and Concentration
- 17.3 Market Share and Competitive Positioning, 2025
- 17.4 Company-Wise Revenue and Product Benchmarking
- 17.5 Production and Service Capacity Benchmarking
- 17.6 Technology, Pricing and Differentiation
- 17.7 Regional Footprint and Distribution Strength
- 17.8 Mergers, Acquisitions and Strategic Alliances
- 17.9 New Entrants and Competitive Threats
- 17.10 Porter's Five Forces and Industry Attractiveness
- 17.11 Competitive Outlook, 2025-2035
Chapter 18 Company Profiles
- 18.1 Company Coverage and Selection Criteria
- 18.2 John Deere Financial Limited
- 18.2.1 Business Description
- 18.2.2 Company Ownership and Geographic Presence
- 18.2.3 Product and Service Portfolio
- 18.2.4 Manufacturing and Operating Footprint
- 18.2.5 Production Capacity and Expansion Plans
- 18.2.6 Financial Performance and Investment
- 18.2.7 Market Share and Competitive Position
- 18.2.8 Technology and Innovation Capabilities
- 18.2.9 Strategic Alliances or Partnerships
- 18.2.10 Recent Developments
- 18.2.11 Growth Strategy and Outlook
- 18.3 National Australia Bank Limited
- 18.4 Commonwealth Bank of Australia
- 18.5 CNH Capital Australia Pty Limited
- 18.6 AGCO Finance Pty Limited
- 18.7 Other Relevant Market Participants
Note: Every listed company is profiled on the structure shown under the first company. The company list is preliminary and may change based on research findings, market developments, data availability and client requirements.
Chapter 19 Disclaimer
- 19.1 Research and Forecast Disclaimer
- 19.2 Data Source and Estimation Limitations
Note: The depth of individual sections depends on data availability for this market. Volume, capacity, trade and other unit-based metrics are included where applicable.

