
Camera spraying and spore alerts turn farm data into savings
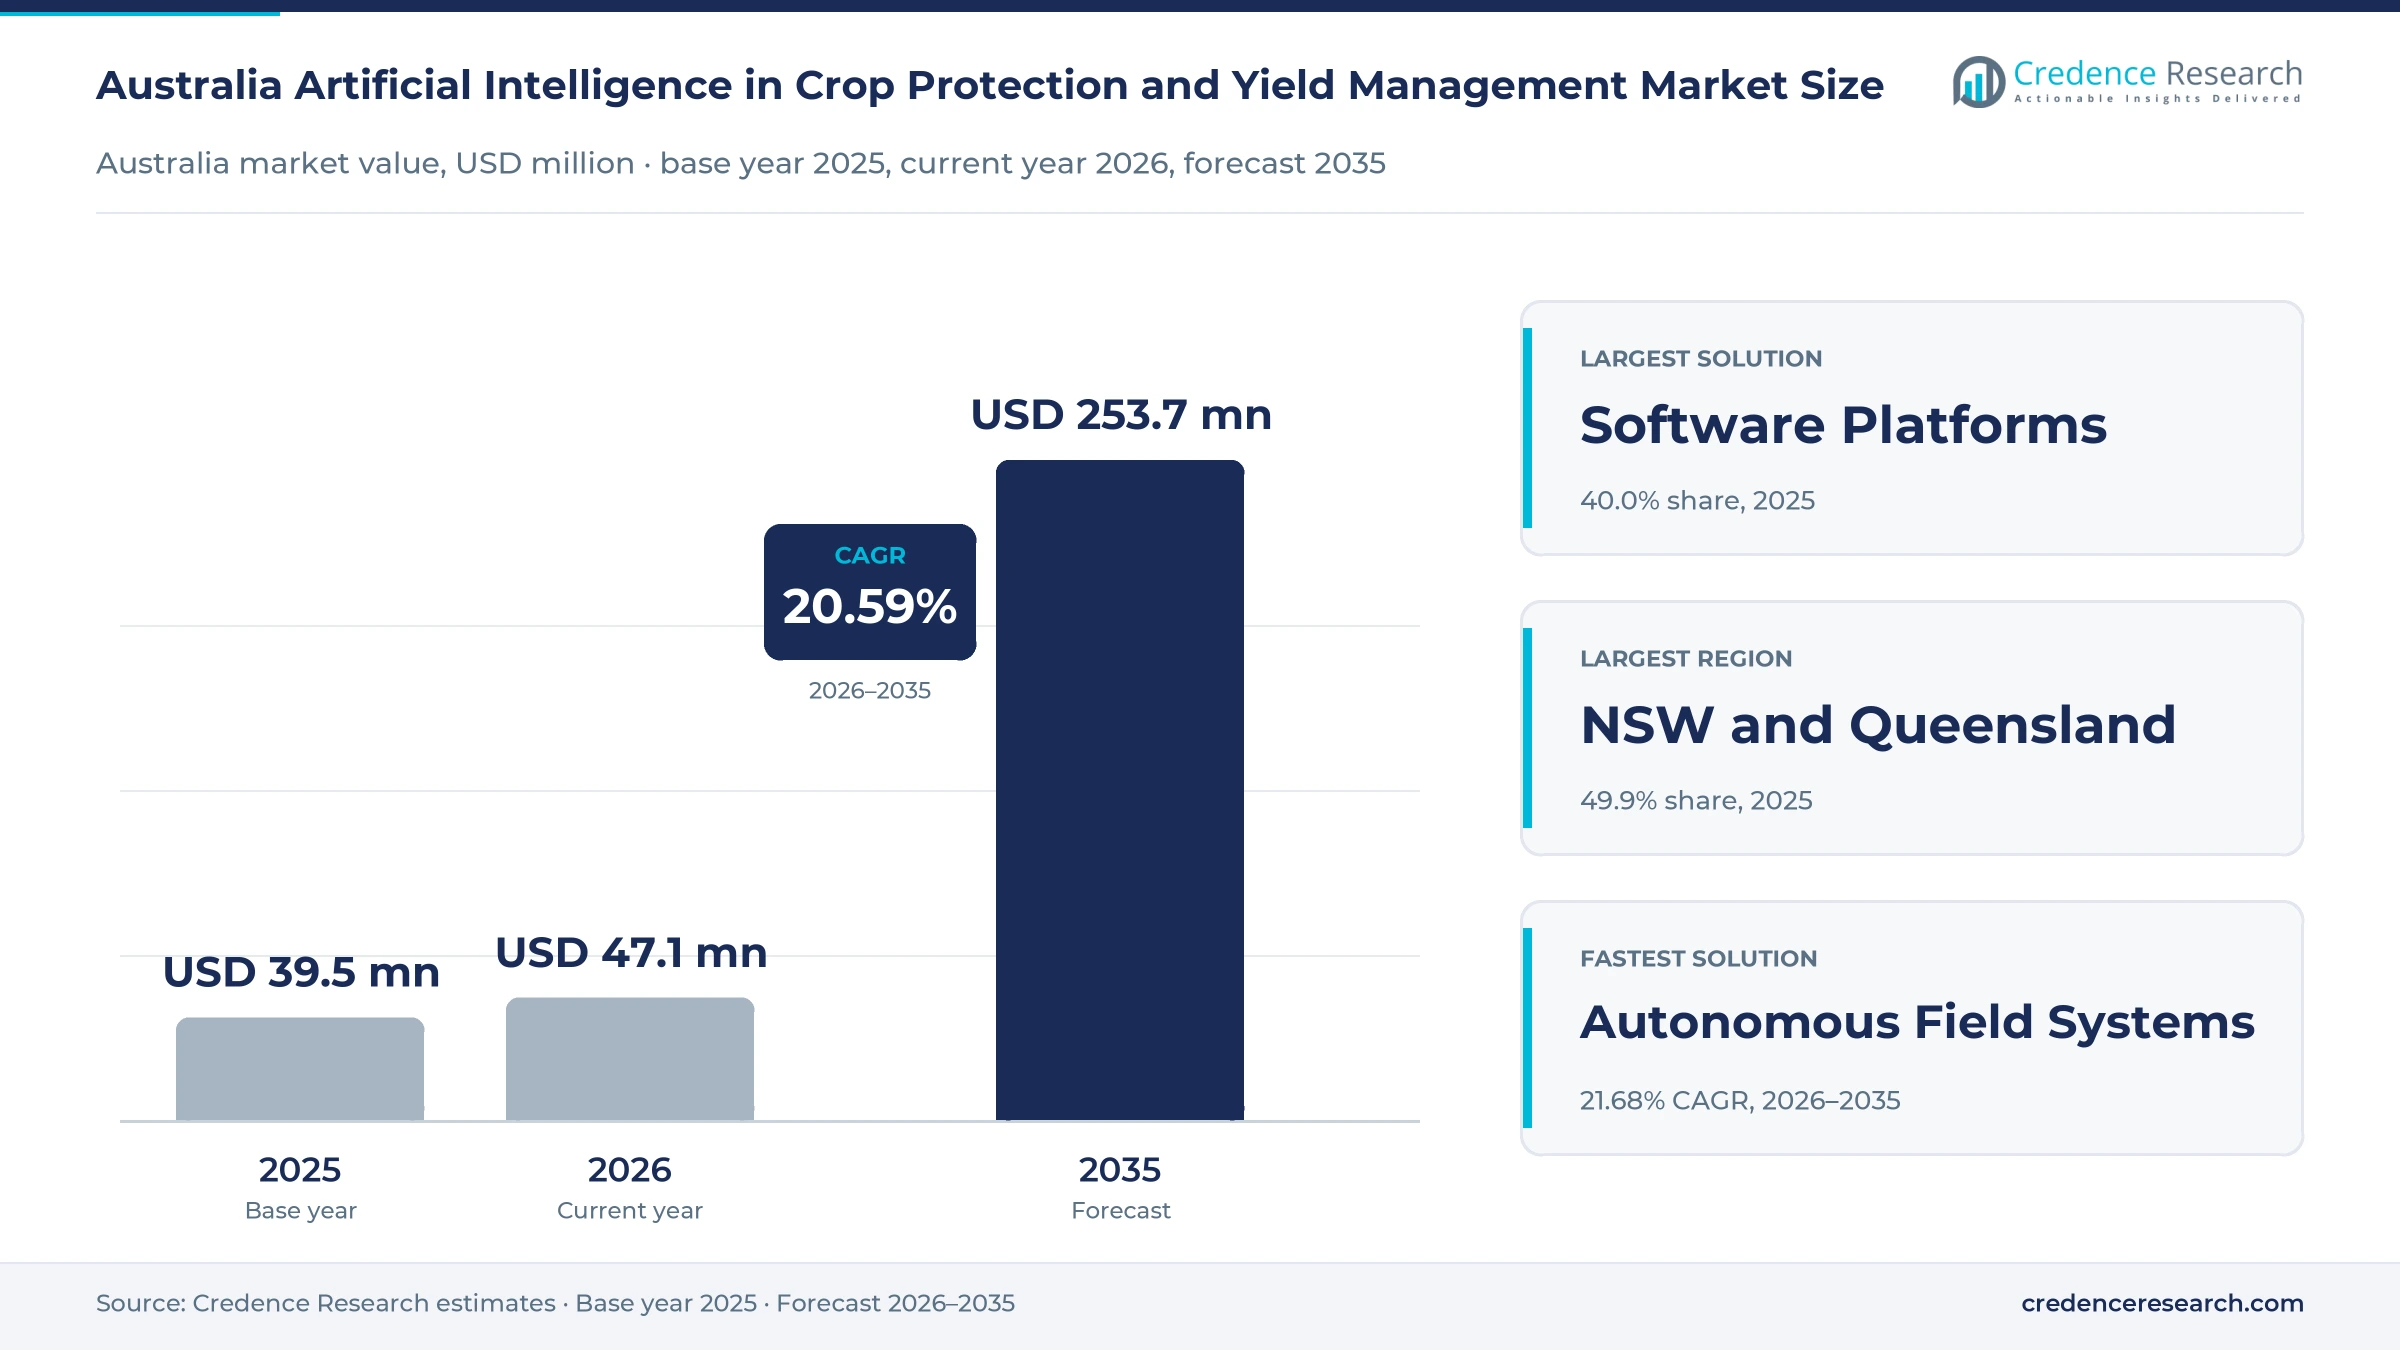
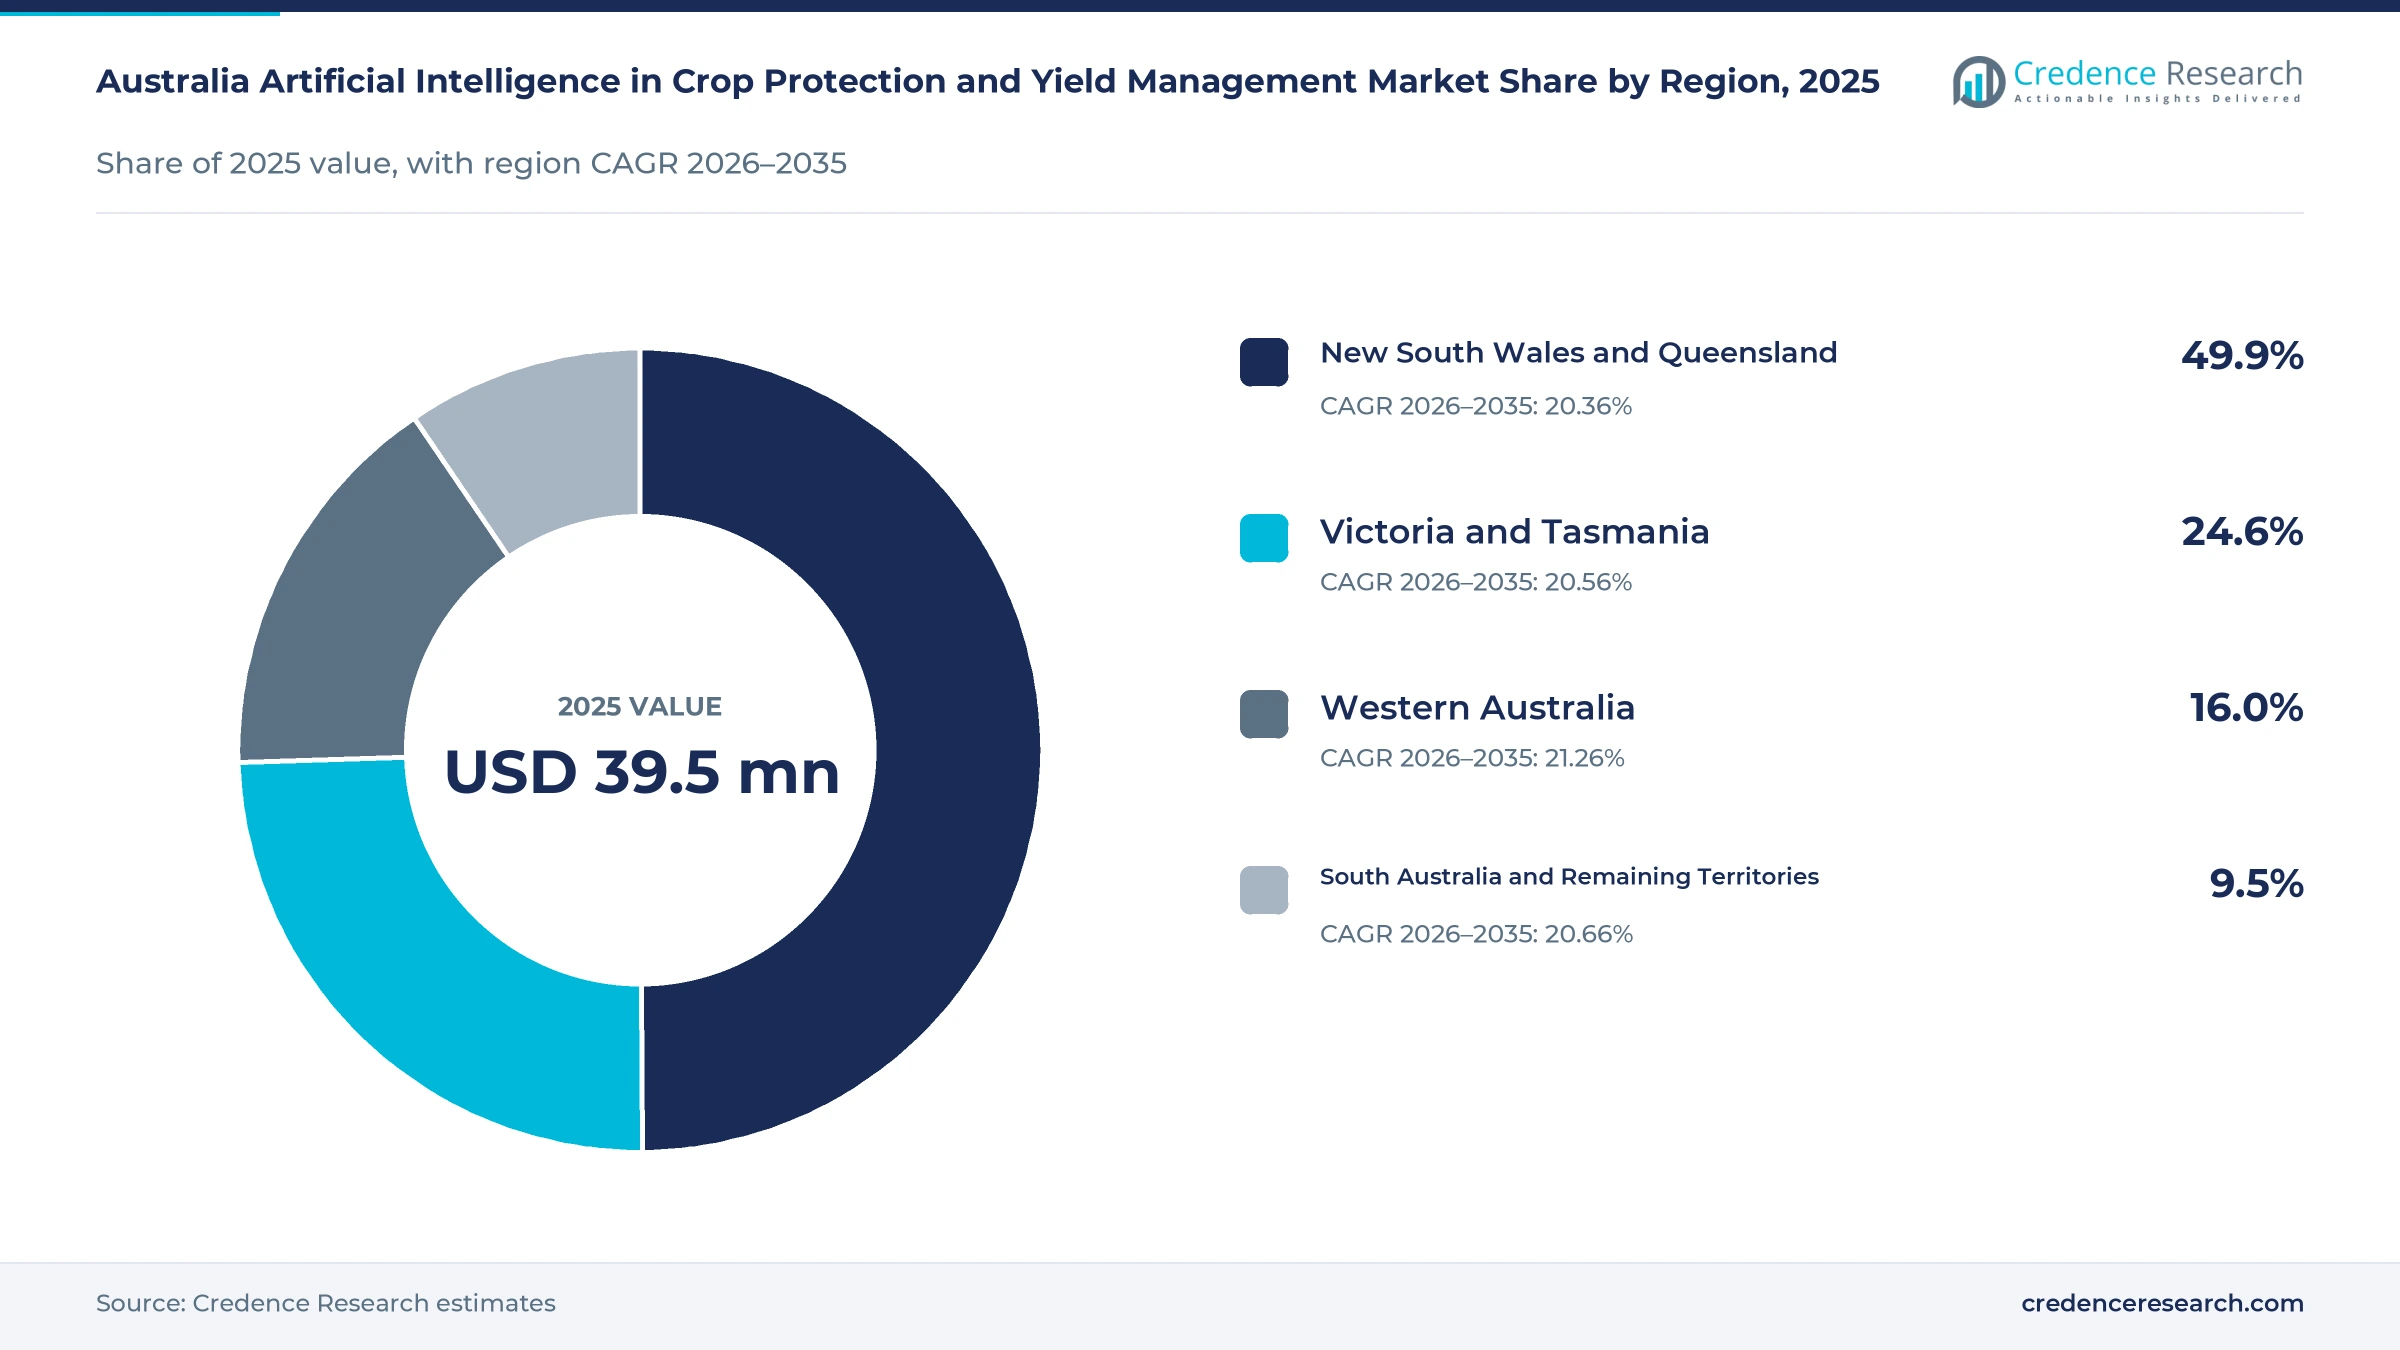
The Australia artificial intelligence in crop protection and yield management market was valued at USD 39.5 million in 2025 and is projected to increase from USD 47.1 million in 2026 to USD 253.7 million by 2035, registering a CAGR of 20.59% during 2026–2035. Demand comes from grain growers cutting herbicide bills, horticulture producers tracking pests and fruit counts, and agribusinesses planning harvest labor and sales. New South Wales and Queensland held the largest regional share, 49.9% in 2025, because those states combine large grain areas with almost all of the national cotton and sugarcane crop. Western Australia is the fastest-growing region at 21.26% a year, helped by its large cropping programs. John Deere reported in August 2026 that Australian growers had treated more than 10 million acres with camera-guided spraying, while a second generation with in-crop weed detection reached 2027 model sprayers. That change moves targeted spraying from summer fallow into the growing season, when most yield is decided.
What does Australian crop AI spending actually cover?
The market counts software platforms, autonomous field systems, disease surveillance systems and pest surveillance systems that use machine learning or computer vision to guide crop protection and yield decisions in Australia. Buyers pay through machine purchases, upgrade kits, subscriptions and service fees, usually through vendors, dealers or agronomy partners.
The estimate excludes chemicals, conventional sprayers without detection, livestock monitoring and irrigation control that has no crop protection or yield function. The value chain runs from sensor and model developers through machinery dealers and advisers to the growers who act on each recommendation.
Australia Artificial Intelligence in Crop Protection and Yield Management Market Insights
- Spending rises from USD 39.5 million in 2025 to USD 253.7 million by 2035, a 20.59% CAGR from 2026–2035, as savings from targeted spraying pay for further software and machines.
- New South Wales and Queensland led with 49.9% of value in 2025, reflecting grain, cotton and sugarcane areas that give vendors several crop systems within one sales region.
- Software Platforms held 40.0% of 2025 value, because analytics sit behind most paid decisions on spraying, scouting, harvest timing and crop sales.
- BioScout raised A$6.75 million in August 2026 and plans 1,000 disease sensors by 2029, showing how spore alerts are moving from research funding toward commercial networks.
- SwarmFarm Robotics has deployed 200 robots across Australia, and its October 2025 Series B funds further scale, placing farm-built autonomy against global machinery brands.
Software leads as field robots gain the fastest
Why do software platforms lead while field robots gain fastest?
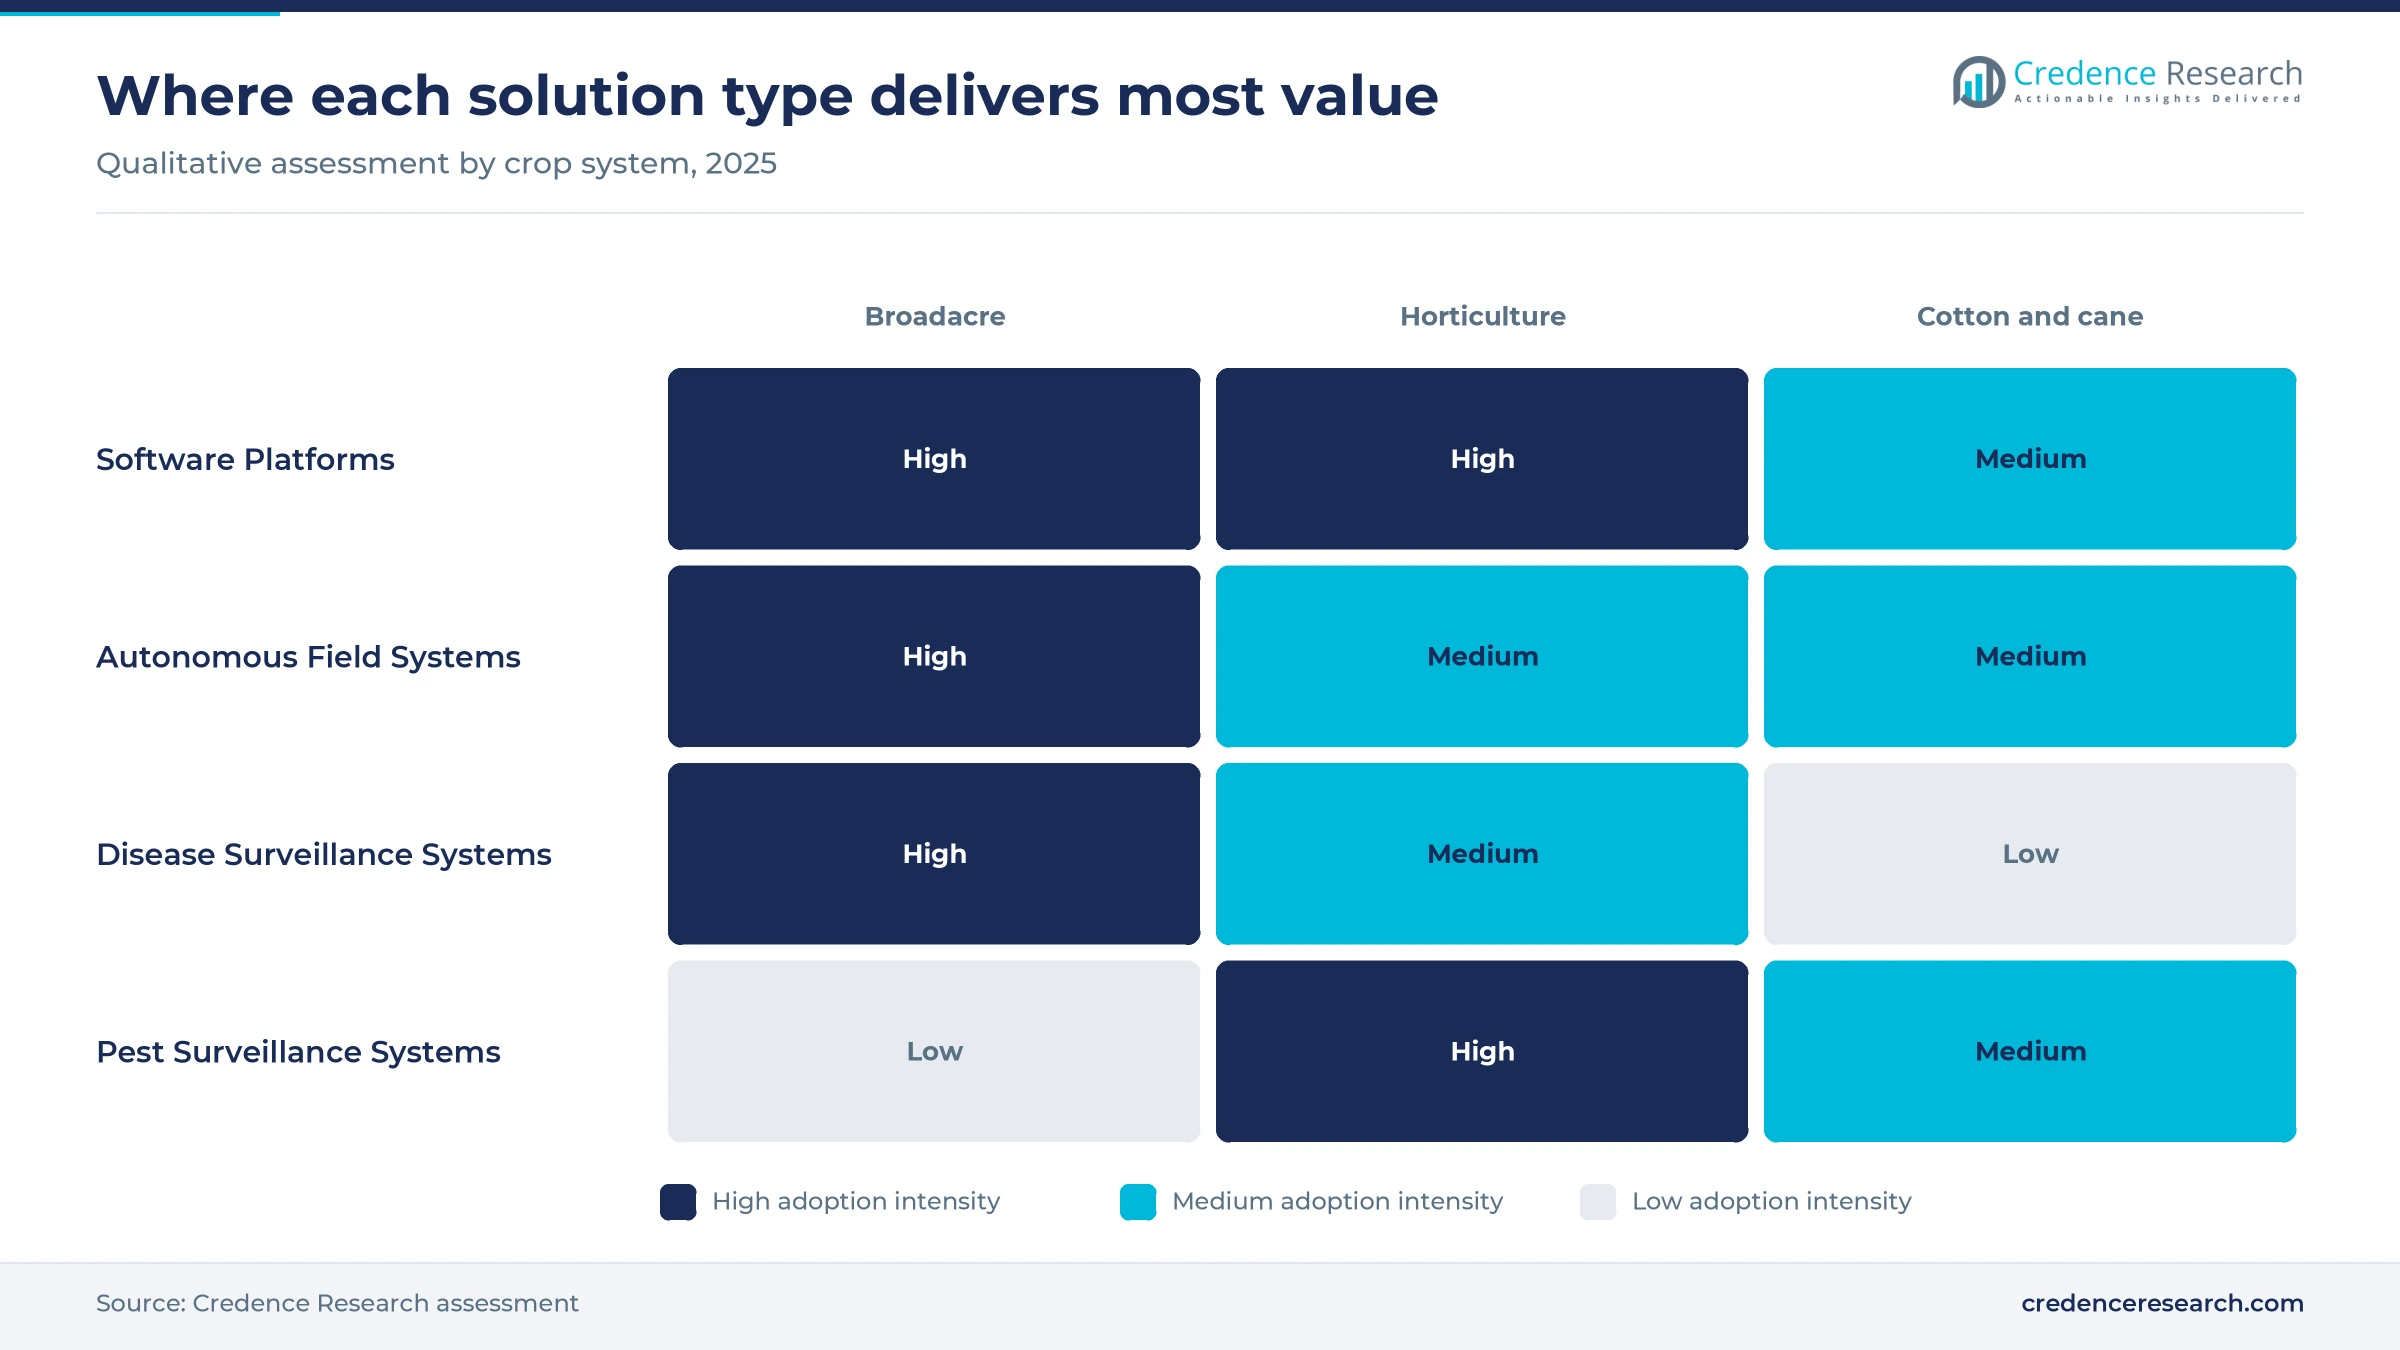
Based on solution type, the market is categorized into software platforms, autonomous field systems, disease surveillance systems and pest surveillance systems. Software Platforms led with 40.0% of 2025 value because analytics sit behind most paid decisions, and Yamaha Agriculture bought Australian yield-analytics firm The Yield to secure that layer, according to IT Brief Australia. Autonomous Field Systems grow fastest at 21.68% a year as SwarmFarm Robotics has deployed 200 robots across Australia, according to an October 2025 Clean Energy Finance Corporation release, and raised Series B money for further scale from its Queensland base.
Why does broadacre lead while horticulture and viticulture gain fastest?
Based on crop type, the market is categorized into broadacre grains and pulses, horticulture and viticulture, and cotton and sugarcane. Broadacre Grains and Pulses led with 58.0% of 2025 value because area decides software and spray-hardware demand, and the Australian Bureau of Statistics counted 12.7 million hectares of wheat and 19,435 wheat businesses in 2024-25. Horticulture and Viticulture grows fastest at 21.67% a year as Croplands began a controlled Australian release of the Kilter AX-1 in November 2025, according to Stock & Land, with a Hort Innovation grant funding more testing. Higher crop value per hectare also helps vegetable and fruit growers justify the outlay.
Why do farm operators pay most while agronomy providers gain share?
Based on customer type, the market is categorized into farm operators, agronomy service providers and agribusiness program operators. Farm Operators led with 62.0% of 2025 value because growers buy machinery that returns cash quickly, as Derek and Rhonda Young of Kulin, Western Australia, recovered a sensor-sprayer outlay of about A$115,000 in two years, according to GRDC Groundcover. Agronomy Service Providers grow fastest at 21.50% a year as Elders Rural Services joined the A$3.6 million GRDC-funded BioScout project, whose 60 SporeScout units add regional disease signals to routine crop advice.
Why does crop protection lead while yield planning gains fastest?
Based on application, the market is categorized into crop protection, yield prediction and harvest planning, and crop health monitoring. Crop Protection led with 55.0% of 2025 value because chemical savings are easy to count, and John Deere reports a 74% average herbicide saving across more than 10 million acres of Australian See & Spray Select use, according to HeavyQuip Magazine in August 2026. Yield Prediction and Harvest Planning grows fastest at 21.79% a year as Green Atlas scanned about 15,000 hectares of almonds in one season, roughly a third of the national crop, according to The Farmer magazine, and growers plan labor and packing around those counts.
| Segment Group | Leading Sub-segment | Share, 2025 | Fastest-growing Sub-segment | CAGR, 2026–2035 |
|---|---|---|---|---|
| By Solution Type | Software Platforms | 40.0% | Autonomous Field Systems | 21.68% |
| By Crop Type | Broadacre Grains and Pulses | 58.0% | Horticulture and Viticulture | 21.67% |
| By Customer Type | Farm Operators | 62.0% | Agronomy Service Providers | 21.50% |
| By Application | Crop Protection | 55.0% | Yield Prediction and Harvest Planning | 21.79% |
Request a Free Sample
Fill in your details and we'll send you a free sample report.
- Sample data tables & charts
- Research methodology
Chemical savings and earlier alerts fund grower spending
How do targeted intervention economics pay for camera spraying?
Herbicide is a recurring cost that a camera can cut on every pass, so the savings repeat each season. John Deere reports a 74% average herbicide saving across more than 10 million acres treated with See & Spray Select in Australia, according to HeavyQuip Magazine in August 2026. SwarmFarm Robotics claims herbicide cuts of as much as 95%, figures published by the Clean Energy Finance Corporation when it invested A$7 million in October 2025. Farm Weekly reported from a March 2025 GRDC update that spraying-system running costs can differ by up to A$300,000 a year on a 3,000-hectare program. Those sums explain why the Crop Protection segment held 55.0% of 2025 market value, and why growers review tractor and sprayer replacement plans around detection features.
How do earlier disease and pest decisions change spray timing?
Growers can time fungicide and insecticide to the actual threat instead of a calendar date once alerts arrive sooner. GRDC funds a three-year, A$3.6 million project that runs 60 BioScout SporeScout units across Western Australia, South Australia, New South Wales, Victoria and Queensland. BioScout says acting on early signals can halve spray costs, according to Grain Central in August 2026, and its network now exceeds 250 sensors worldwide, with a target of 1,000 by 2029. In horticulture, CSIRO puts fruit fly losses at more than A$300 million a year and estimates that RapidAIM sensing can cut outbreak management costs by 35%. This evidence gives surveillance vendors a budget line that growers already recognize, since these costs recur every season.
How does commercial crop-planning integration widen the buyer base?
Yield management data now feeds commercial decisions beyond the paddock, including labor, packing and sales. Yamaha Agriculture bought The Yield and targets wine grapes and apples with AI models for yield prediction and farm operations, according to World Agritech. Bitwise Agronomy in Tasmania uses GoPro cameras and ripening datasets so berry growers can share forecasts one to four weeks ahead with fruit sellers, according to Good Fruit & Vegetables in September 2025. Batlow Fruit Company, whose apples make up about 45% of the New South Wales crop, scans twice a season, at flowering and in December, to plan pickers, packers and boxes, according to The Farmer magazine, which also reports more than 27,000 hectares of Green Atlas scans. As a result, Yield Prediction and Harvest Planning grows 21.79% a year.
How is levy funding lowering adoption risk for grain growers?
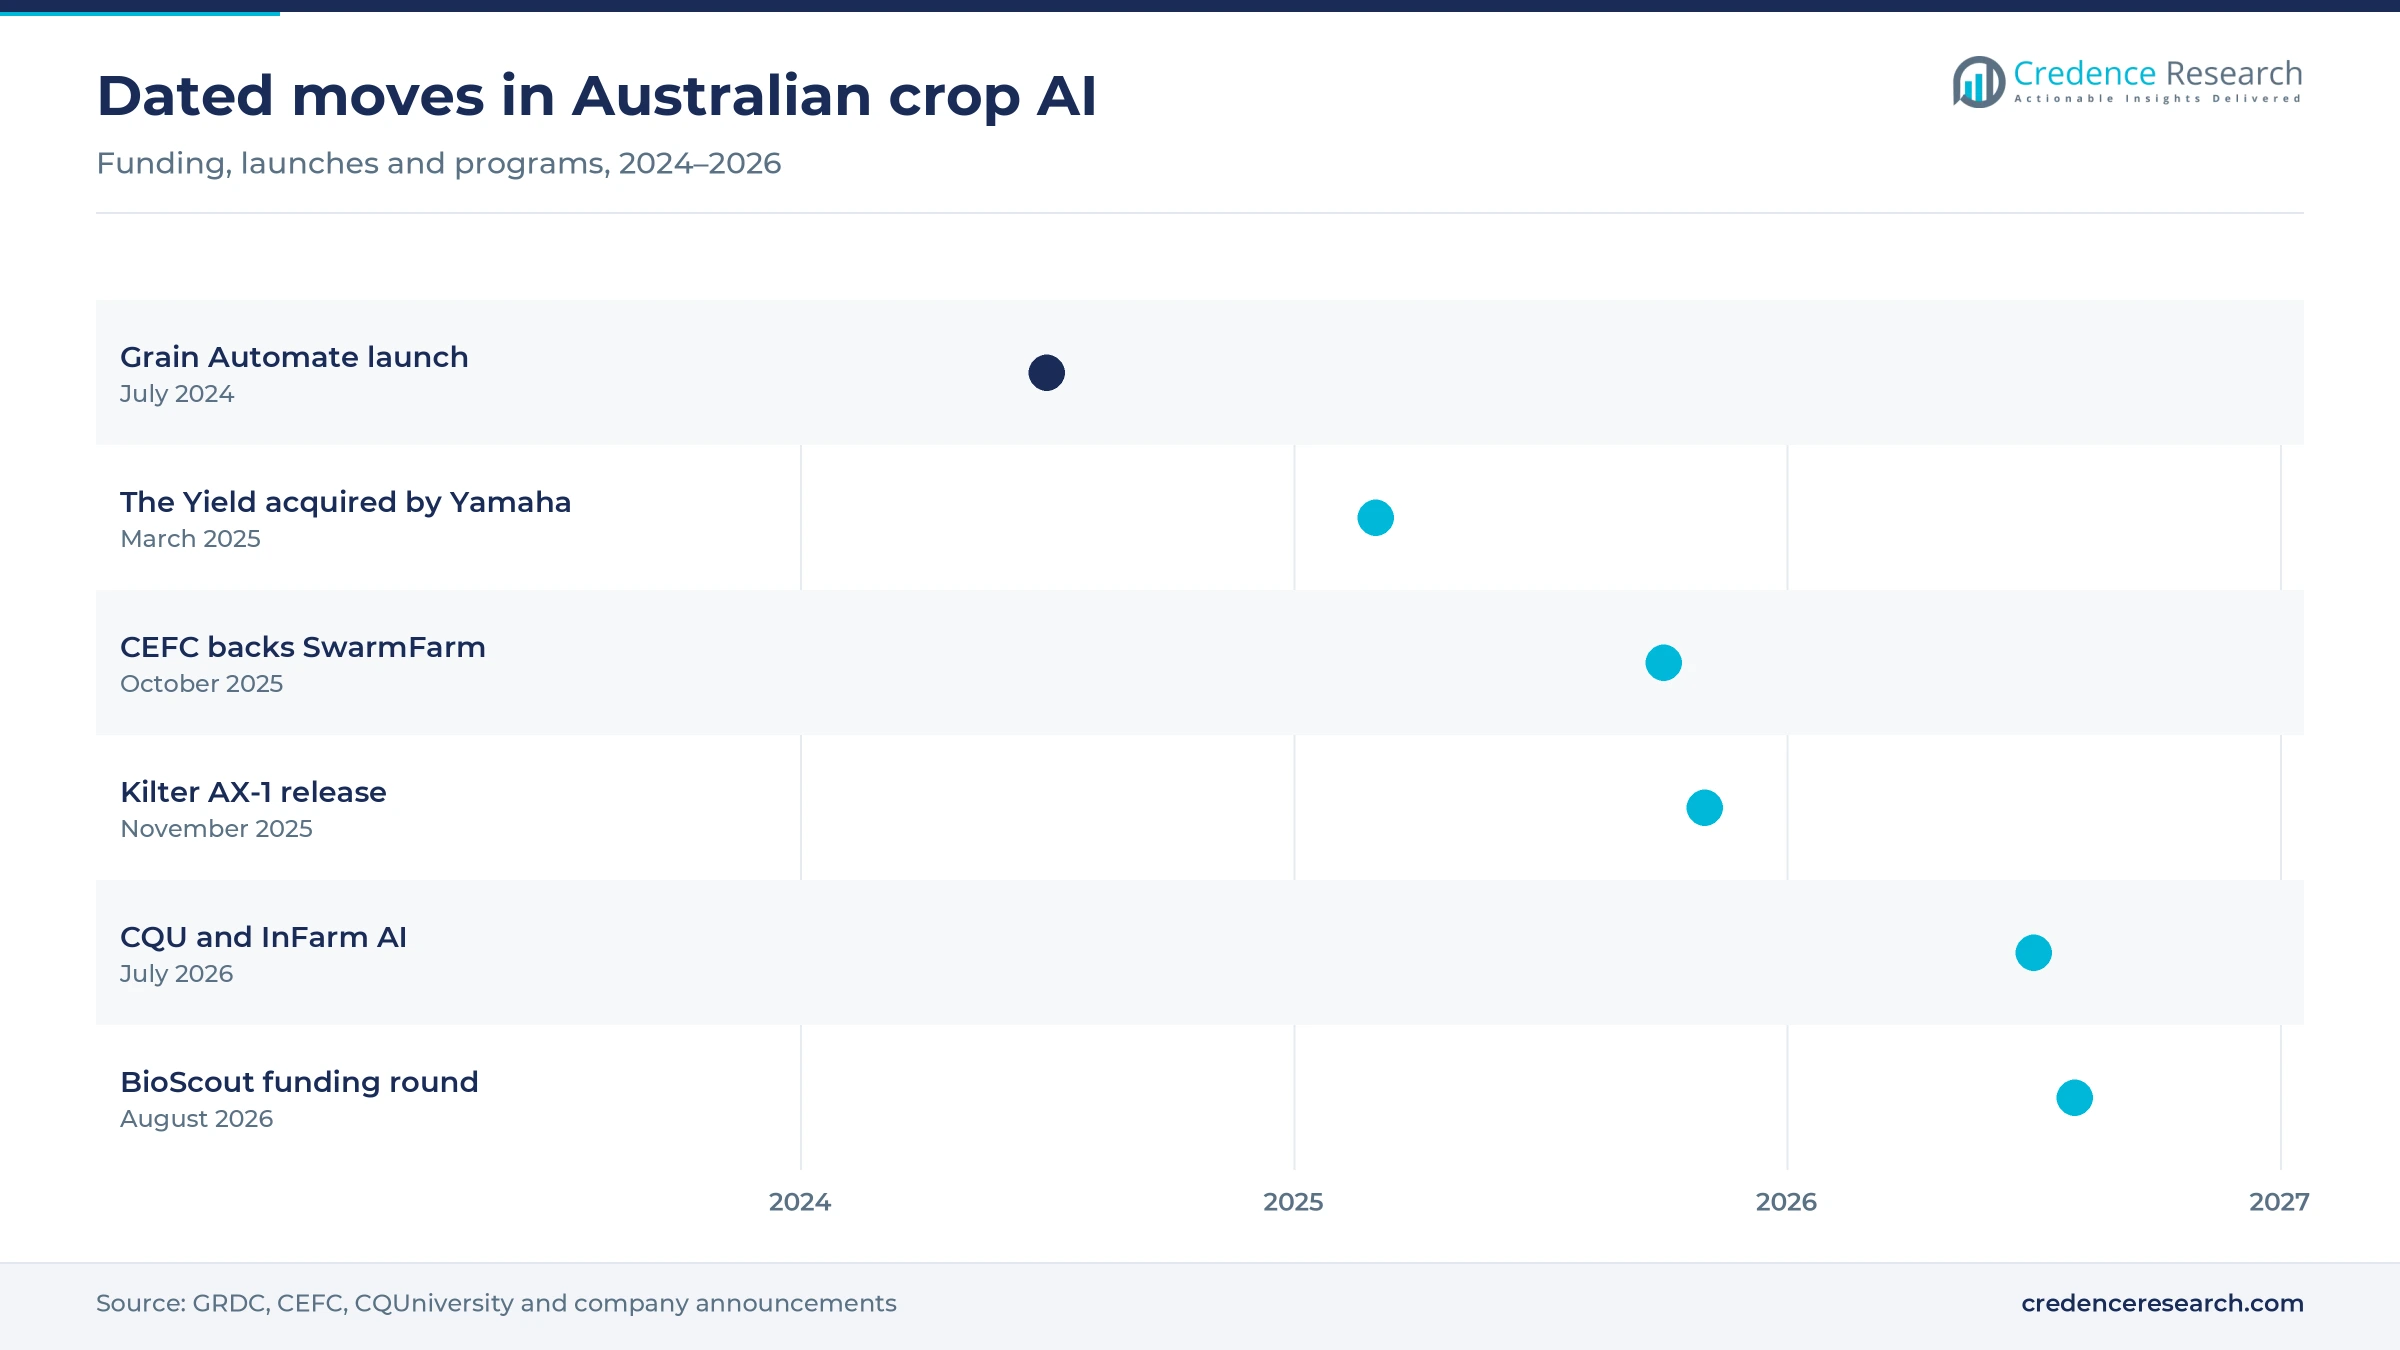
Yield management and crop protection tools carry less adoption risk when grower levies fund the early testing. GRDC launched Grain Automate in July 2024 with A$35 million over five years and up to 30 investments, while the Society of Precision Agriculture Australia leads analytics-driven extension, according to GRDC Groundcover. Farm Weekly reported 24 projects under way by March 2025, along with a GRDC estimate of about A$1.6 billion a year in grower benefits. CSIRO has also built a calculator covering more than 100 broadacre spraying systems, which helps a buyer test a quote before signing. That support matters across 31.3 million hectares of arable land in World Bank data for 2024, because even modest per-hectare fees reach useful scale at that area.
In-crop detection and open robots reshape the offer
Why is the shift to in-crop weed detection gathering pace?
Detection is moving from weeds on bare fallow to weeds inside growing crops, which widens the usable season. John Deere launched See & Spray Select in 2021, took it past 10 million acres, then released See & Spray Gen 2 with green-on-green detection on model-year 2027 sprayers earlier in 2026, according to HeavyQuip Magazine. The company also added in-season variable rate capability on sprayers with booms of 27.4 to 36.6 meters after testing in Western Australia, New South Wales and Victoria, as rbmagazine.com.au reported in April 2025. Nufarm is working with GRDC and the Australian Pesticides and Veterinary Medicines Authority on trial protocols for site-specific uses, according to WeedSmart in June 2026. In turn, software, cameras and product labels are starting to be sold as one decision.
Why is the rise of open robot platforms changing who sells autonomy?
Specialist developers can now reach growers without building a whole machine, which changes the sales model. SwarmFarm Robotics lets independent developers offer apps and attachments through SwarmConnect, according to Farming Ahead. Its robots have logged more than 220,000 operating hours across two million hectares, Robotics and Automation News reported in October 2025, and founder Andrew Bate said some partners have quadrupled sales through the platform. The same report described an A$30 million Series B led by Edaphon to scale from its Toowoomba manufacturing base and enter North America. The approach differs from vertically integrated mechatronics suppliers, and Autonomous Field Systems grow 21.68% a year as a result.
Where is the opening for vegetable and specialty crop robots?
High value per hectare can support expensive precision machines in vegetable and fruit systems. Croplands priced the Kilter AX-1 at about A$250,000 to A$300,000 after a year of tests in South Australia, Victoria and Queensland, Stock & Land reported in November 2025, and the robot runs AI models for 21 vegetables in Europe. ABARES forecasts total crop value of A$51.9 billion in 2026-27, which gives even a small technology share real scale. The innov8.ag website lists the Green Atlas Cartographer for more than 15 crops, with fruit counts typically within 5%. Vendors that adapt these models to local varieties can win early contracts.
What opening do cotton and sugarcane offer northern vendors?
Northern irrigated crops concentrate in districts where environmental and chemical pressures are visible to growers and regulators. The Australian Bureau of Statistics recorded 324,000 hectares of sugarcane in 2024-25, with Queensland producing 27.3 million of 28.8 million metric tons. James Cook University reported in September 2023 that the AutoWeed sprayer cut herbicide use by up to 65% across 30 hectares in the Burdekin and lowered chemical concentration in run-off by an average of 46%, an outcome that matters near sensitive waterways. ABARES forecast 461,000 hectares of cotton in 2025-26, mostly in New South Wales. These results support vendors selling alongside herbicide and fertilizer suppliers into these northern systems.
Thin margins, patchy coverage and label rules slow uptake
How do tighter farm margins delay machine purchases?
ABARES forecast average broadacre farm business profit falling 39% to A$133,000 in 2026-27, still 6% above the 10-year average, according to its September 2026 outlook, which can delay large purchases. Specialty robots remain costly as well, with the Kilter AX-1 priced at about A$250,000 to A$300,000, according to Stock & Land. Smaller operators therefore struggle to justify ownership in weaker seasons. Vendors can respond through contractor models, upgrade kits and per-hectare service pricing, which spread the outlay across several seasons for growers.
Why does patchy paddock coverage limit real-time services?
Cloud alerts and remote machine supervision fail where mobile signal is unreliable on a property. The 2024 Regional Telecommunications Review drew a record number of submissions and made 14 recommendations on mobile coverage and affordability, Grain Producers SA chief executive Brad Perry wrote in Stock Journal in October 2025. Buyers in remote districts therefore risk paying for services that stall in the paddock. CQUniversity and InFarm reported in July 2026 on AI built for limited internet, an approach other vendors will need to match.
How do label rules cap chemical savings from in-crop spraying?
On current labels, growers can apply herbicides through green-on-green systems at broadcast rates, while uses unsuitable for broadcast application still await new protocols, according to WeedSmart in June 2026. New use patterns must also stay under maximum residue limits, and some uses, such as resistant broadleaf weeds in lentils, need fresh registrations. Chemical makers and growers therefore wait for new protocols before changing practice. Nufarm is leading two GRDC projects on this framework, although the article gives no completion date.
Why does a thin local market slow model development?
A February 2024 GRDC paper described Australia as a relatively small market for digital agronomic analytics, which limits private investment in local models. The same paper noted that many funded projects needed four to six years of applied work before reaching prototypes. Data trust adds friction, since the Australian Farm Data Code from the National Farmers' Federation remains voluntary. Smaller software vendors are the most exposed, so partnerships with levy bodies and dealers remain the practical route to enough local data.
Eastern cropping belts lead as the west grows fastest
| Region | Value, 2025 (USD million) | Share, 2025 | CAGR, 2026–2035 |
|---|---|---|---|
| New South Wales and Queensland | 19.7 | 49.9% | 20.36% |
| Victoria and Tasmania | 9.7 | 24.6% | 20.56% |
| Western Australia | 6.3 | 16.0% | 21.26% |
| South Australia and Remaining Territories | 3.8 | 9.5% | 20.66% |
Why do New South Wales and Queensland hold the largest share?
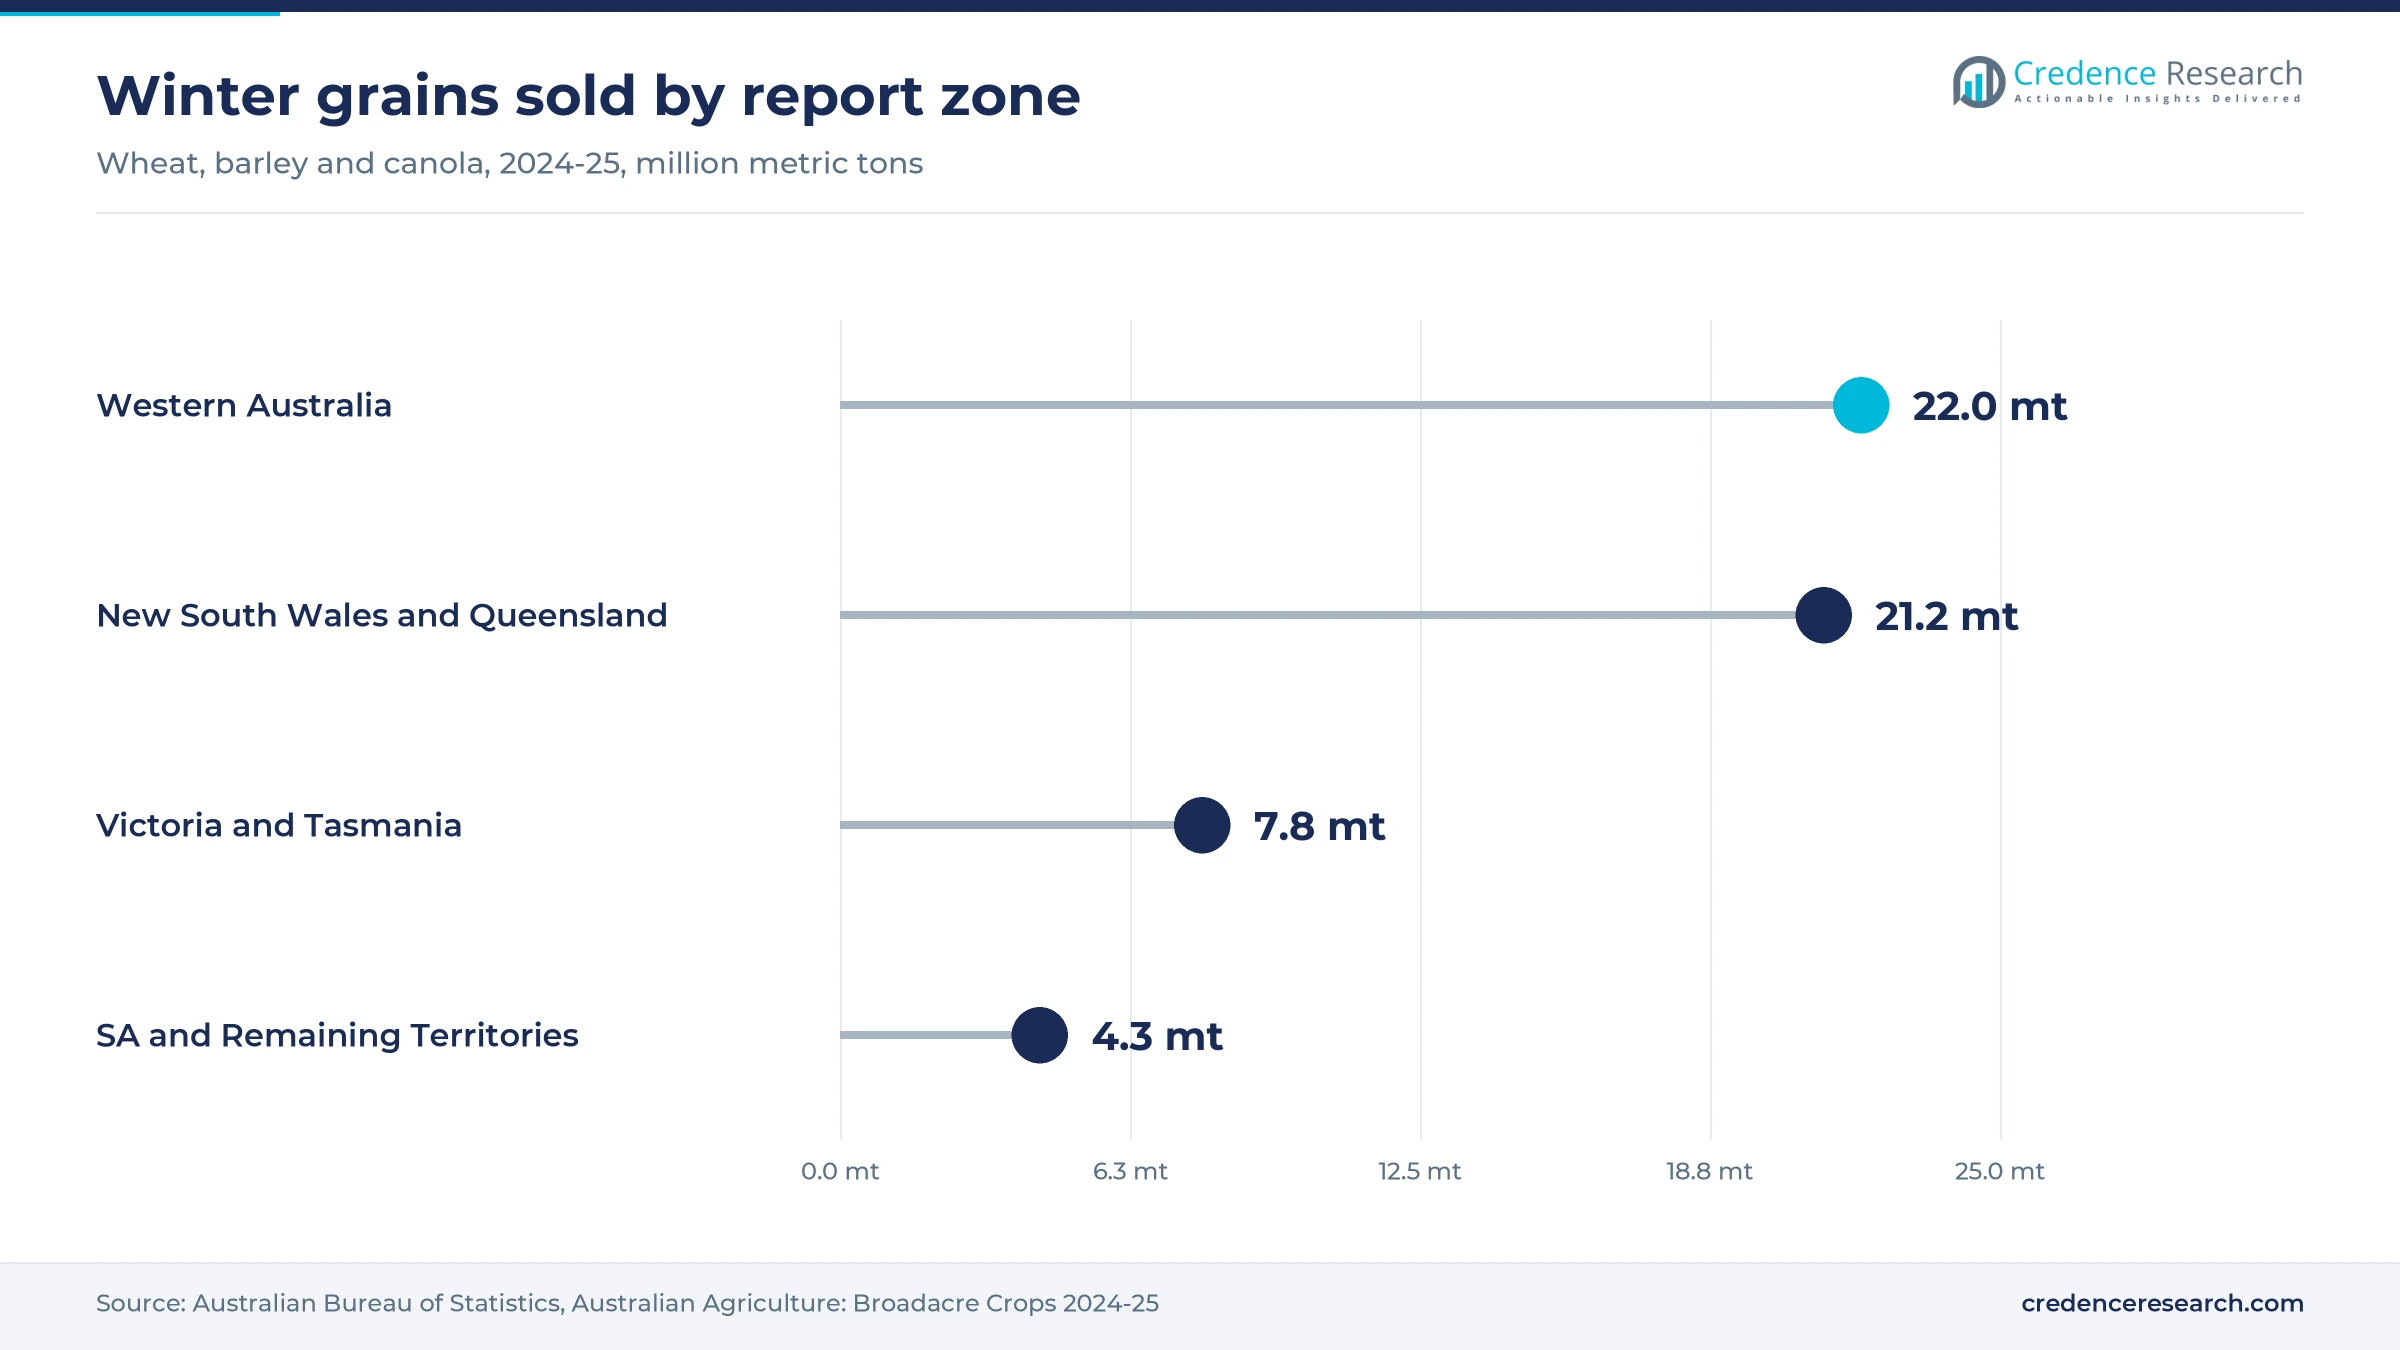
New South Wales and Queensland held 49.9% of 2025 value and grow at 20.36% a year. ABARES put winter crop area at 6.9 million hectares in New South Wales and 1.6 million in Queensland for 2025-26, while the two states also grow nearly all national cotton and sugarcane. Local vendors reinforce that lead, since SwarmFarm builds robots in Toowoomba and InFarm develops drone-guided weed control in Queensland. Buyers here can apply one yield management platform across several crops, which lifts spending per grower.
What keeps Victoria and Tasmania ahead of the western grain belt?
Victoria and Tasmania held 24.6% of 2025 value and grow at 20.56% a year. Victoria planted about 3.7 million hectares of winter crops for 2025-26, according to ABARES, yet horticulture explains much of the zone's spending. RapidAIM runs a surveillance service across a 200-square-kilometer Yarra Valley area, CSIRO reports, while Bitwise Agronomy works from Relbia in Tasmania. Agriculture Victoria's Tatura SmartFarm also validated Green Atlas fruit counts, according to innov8.ag, which gives orchard buyers local evidence.
Why is Western Australia the fastest-growing zone?
Western Australia held 16.0% of 2025 value and grows fastest at 21.26% a year. ABARES forecast just over 9 million hectares and 23.9 million metric tons of winter crops for 2025-26, the largest figures of any state. Spot-spray economics are already familiar in the zone, as the 2,903-hectare Young family farm at Kulin cut summer weed chemical costs by up to 93% in some years. Lower current software spending from a large area base leaves room for catch-up, especially with in-crop detection.
How do South Australia and remaining territories contribute?
South Australia and Remaining Territories held 9.5% of 2025 value and grow at 20.66% a year. South Australia planted about 3.9 million hectares of winter crops for 2025-26, according to ABARES, and produced 7.9 million metric tons. Vendor presence is stronger than the share suggests, since Adelaide hosts Croplands and Green Brain, which CropX bought in December 2023. The South Australian Research and Development Institute also partners in the BioScout project, while the territories add little cropping value.
Robot funding, spore networks and sprayer launches
| Development | Status and market relevance |
|---|---|
| In July 2024, GRDC launched Grain Automate with A$35 million over five years and up to 30 research and extension investments. | Active; 24 projects were reported by March 2025 |
| In October 2025, the Clean Energy Finance Corporation invested A$7 million in SwarmFarm Robotics within a Series B led by Edaphon. | Completed; funds scale from 200 deployed robots |
| In November 2025, Croplands began a controlled Australian release of the Kilter AX-1 weed robot at about A$250,000 to A$300,000. | Rolling out; further trials funded by Hort Innovation |
| In July 2026, CQUniversity and InFarm reported AI weed detection designed for limited internet, with herbicide cuts of up to 95%. | Completed research; extending to grazing systems |
| In August 2026, BioScout raised A$6.75 million in a round co-led by Demea Sustainable Investment and Astanor. | Completed; supports a target of 1,000 sensors by 2029 |
Vision, spore sensing, LiDAR and smart traps do the work
- Computer vision spot spraying detects weeds from boom cameras and opens only the matching nozzle, and it now extends to in-crop use on 2027 model John Deere sprayers.
- Airborne spore sensing samples the air for fungal threats, and each BioScout sensor monitors more than 40 airborne threats according to Grain Central.
- LiDAR orchard mapping builds tree models and fruit counts from vehicle-mounted sensors, and Green Atlas mapping covered more than 27,000 hectares in its first two seasons according to The Farmer magazine.
- Insect-detecting smart traps lure pests such as fruit flies into enclosed sensors and send phone alerts, a method CSIRO researchers took to market through RapidAIM in January 2020.
Need a Custom Version of This Report?
Tailor the scope, geography, or segments to your exact requirements.
- Custom geography or segment scope
- Direct access to our analyst team
Farm-born startups meet global machinery brands
Competition divides into farm-born robot makers, surveillance specialists, orchard analytics firms and global machinery brands. John Deere holds the strongest dealer route, because camera spraying reaches growers through existing sprayers and upgrade kits. SwarmFarm Robotics competes through an open platform and Queensland manufacturing, while InFarm pairs drone images with equipment that growers already own. Kilter reaches Australia through Croplands, a Nufarm offshoot that also sells spot-spray gear. BioScout and RapidAIM compete on early warning rather than machinery, and both rely on research and grower networks for credibility. Yamaha Agriculture, CropX Technologies, Bitwise Agronomy and Green Atlas focus on specialty crops, irrigated systems and crop counts. Buyers of crop protection and yield management tools usually judge vendors on proven chemical savings, forecast accuracy, local support and whether data can move between platforms. Consolidation is likely to continue, since Yamaha and CropX both added Australian firms by acquisition.
Companies profiled and their roles in this market
| Company | Type | Role in the market |
|---|---|---|
| SwarmFarm Robotics | Autonomous robot maker | 200 robots deployed in Australia; SwarmConnect platform; Toowoomba manufacturing |
| Yamaha Agriculture Australia | Specialty crop autonomy and analytics | Acquired The Yield for yield prediction in wine grapes and apples |
| CropX Technologies | Farm management software | Entered Australia through Green Brain of Adelaide in December 2023 |
| John Deere | Machinery and vision spraying | See & Spray Select across more than 10 million Australian acres; Gen 2 adds in-crop detection |
| BioScout | Disease surveillance network | Runs 60 GRDC-backed units in Australia and more than 250 sensors worldwide |
| RapidAIM | Pest surveillance | CSIRO spin-out; sensor traps for fruit fly, with government and grower customers |
| Bitwise Agronomy | Crop forecasting software | Tasmanian firm; GreenView AI gives berry forecasts one to four weeks ahead |
| Green Atlas | Orchard mapping | NSW-founded Cartographer system; scanned about a third of the national almond crop in one season |
| InFarm | Drone-guided weed control | Queensland firm; AI built with CQUniversity for limited internet areas |
| Kilter | Vegetable weed robot | AX-1 sold in Australia through Croplands from November 2025 |
Credence Research sees proof of savings setting the pace
Credence Research's view is that verified savings, not model sophistication, will set the pace of AI-based yield management in this market through 2030. Growers already accept camera spraying because a tank bill shows the result within a season. The market's 20.59% annual growth assumes autonomous machines and in-crop detection reach most large cropping programs by 2035. Disease alerts and yield forecasts must now reach the same standard, with results that buyers can audit paddock by paddock. Vendors that connect detection to wider connected farm systems should keep customers longer. Label reform remains the largest swing factor, since it decides how much of the in-crop saving growers can legally capture.
Crop statistics and vendor evidence anchor the estimates
The report uses 2025 as the base year and forecasts values through 2035 from the Credence Research market model. Segment and regional splits are Credence Research estimates informed by public crop areas, production statistics, machine prices and vendor disclosures. Sources include the Australian Bureau of Statistics, ABARES, the World Bank, GRDC, CSIRO, the Clean Energy Finance Corporation, company announcements and named agricultural publications. No interviews or surveys were conducted for this edition of the report.
Autonomy and forecasts move from pilots to routine by 2035
Through 2035, crop protection and yield management spending should move from pilots and fallow spraying toward routine in-crop decisions across large cropping programs and high-value orchards. Autonomous machines gain share as manufacturing scale improves and contractors offer them by the hectare. Disease surveillance demand in this market should deepen if BioScout reaches its target of 1,000 sensors by 2029, giving regional forecasts more value. Connections with farm software and water scheduling tools should also strengthen. Seasonal income will still cause uneven buying, so vendors with service pricing should prove more resilient than those relying on outright machine sales.
Frequently Asked Questions
How big is the Australia AI crop protection and yield market?
Which solution type leads the market?
Which solution type is growing fastest?
Which region holds the largest share?
Which region is growing fastest?
How much herbicide can camera spraying save?
What is the main constraint on adoption?
Who are the main companies in the market?
Table of Content
Chapter 1 Market Segmentation
- 1.1 Segmentation Framework
- 1.1.1 Product and Service Classification
- 1.1.2 Application and End-Use Classification
- 1.1.3 Technology and Solution Classification
- 1.1.4 Customer and Distribution Channel Classification
- 1.1.5 Geographic Segmentation
- 1.1.6 Market Segment Definitions and Boundaries
- 1.2 By Solution Type
- 1.2.1 Software Platforms
- 1.2.2 Autonomous Field Systems
- 1.2.3 Disease Surveillance Systems
- 1.2.4 Pest Surveillance Systems
- 1.3 By Crop Type
- 1.3.1 Broadacre Grains and Pulses
- 1.3.2 Horticulture and Viticulture
- 1.3.3 Cotton and Sugarcane
- 1.4 By Customer Type
- 1.4.1 Farm Operators
- 1.4.2 Agronomy Service Providers
- 1.4.3 Agribusiness Program Operators
- 1.5 By Application
- 1.5.1 Crop Protection
- 1.5.2 Yield Prediction and Harvest Planning
- 1.5.3 Crop Health Monitoring
Chapter 2 Introduction
- 2.1 Report Objectives and Scope
- 2.2 Product Definition and Industry Terminology
- 2.3 Market Inclusions and Exclusions
- 2.4 Research Process
- 2.4.1 Primary Research and Expert Interviews
- 2.4.2 Secondary Research and Source Review
- 2.4.3 Top-Down and Bottom-Up Estimation
- 2.4.4 Data Triangulation and Verification
- 2.5 Market Size Measurement Basis
- 2.5.1 2025: USD 39.5 million → 2035: USD 253.7 million
- 2.6 Historical and Forecast Reference Periods
- 2.6.1 Historical Period: 2018-2025
- 2.6.2 Base Year: 2025
- 2.6.3 Forecast Period: 2025-2035
- 2.7 Research Assumptions and Limitations
Chapter 3 Executive Summary
- 3.1 Market Snapshot and Key Findings
- 3.2 Base-Year Market Size, 2025
- 3.3 Forecast Market Size, 2035
- 3.4 Revenue and Volume Growth Outlook
- 3.5 Key Demand and Supply Indicators
- 3.6 Leading Market Segments
- 3.7 Fastest-Growing Market Opportunities
- 3.8 Regional Performance Highlights
- 3.9 Technology and Industry Transformation
- 3.10 Competitive Landscape Summary
- 3.11 Analyst View and Strategic Implications
Chapter 4 Australia Artificial Intelligence in Crop Protection and Yield Management Market Trends and Developments
- 4.1 Historical Industry Development, 2018-2025
- 4.2 Recent Market Trends and Developments
- 4.3 Demand and Customer Behavior Trends
- 4.4 Technology and Product Innovation
- 4.5 Artificial Intelligence, Automation and Digitalization
- 4.6 Local Manufacturing and Supply Chain Realignment
- 4.7 Industry Partnerships, Mergers and Acquisitions
- 4.8 Sustainability and Circular Economy Developments
- 4.9 Government and Private Sector Investment Trends
- 4.10 Emerging Business Models and Commercialization
- 4.11 Industry Developments and Announcements
Chapter 5 Australia Artificial Intelligence in Crop Protection and Yield Management Market Production, Supply and Demand Analysis
- 5.1 Demand Trend and Consumption Analysis, 2018-2025
- 5.2 Demand Forecast, 2025-2035
- 5.3 Production and Output Trend, 2018-2025
- 5.4 Production and Output Forecast, 2025-2035
- 5.5 Installed Capacity and Capacity Utilization
- 5.6 Company-Wise Production Plants and Statistics
- 5.6.1 Installed Production Capacity
- 5.6.2 Actual Production
- 5.6.3 Planned Capacity and Expansion Targets
- 5.7 Supply Chain Structure and Procurement Trends
- 5.8 Supply-Demand Gap and Bottlenecks
- 5.9 Import Dependence and Sourcing Structure
- 5.10 Contract Manufacturing and Outsourcing
- 5.11 Regional Supply and Demand Concentration
Chapter 6 Australia Artificial Intelligence in Crop Protection and Yield Management Market Pricing Analysis
- 6.1 Pricing Structure and Measurement
- 6.2 Historical Pricing Trends, 2018-2025
- 6.3 Pricing Outlook, 2025-2035
- 6.4 Average Selling Price and Unit Economics
- 6.5 Pricing by Product and Market Segment
- 6.6 Geographic Pricing Differences
- 6.7 Key Input, Energy, Labor and Logistics Costs
- 6.8 Contract Pricing and Purchasing Models
- 6.9 Pricing Sensitivity and Competitive Positioning
- 6.10 Price, Margin and Profitability Implications
Chapter 7 Australia Artificial Intelligence in Crop Protection and Yield Management Market Dynamics
- 7.1 Market Growth Drivers
- 7.1.1 Demand-Side Drivers
- 7.1.2 Technology and Innovation Drivers
- 7.1.3 Infrastructure and Investment Drivers
- 7.1.4 Regulatory and Policy Drivers
- 7.2 Market Restraints
- 7.2.1 Cost and Affordability Constraints
- 7.2.2 Technology and Adoption Barriers
- 7.2.3 Supply Chain and Operational Constraints
- 7.3 Market Challenges
- 7.3.1 Competitive Pressure and Margin Erosion
- 7.3.2 Skills, Infrastructure and Implementation Gaps
- 7.4 Emerging Market Opportunities
- 7.5 Market Dynamics Impact and Time-Horizon Assessment
Chapter 8 Australia Artificial Intelligence in Crop Protection and Yield Management Value Chain Analysis
- 8.1 Industry Value Chain Overview
- 8.2 Upstream Suppliers and Critical Inputs
- 8.3 Technology and Component Providers
- 8.4 Manufacturing or Service Delivery
- 8.5 Distribution, Channel Partners and Integrators
- 8.6 Downstream Applications and End Users
- 8.7 Value Addition and Profit Pools
- 8.8 Vertical Integration and Outsourcing
- 8.9 Supplier Concentration and Risk
- 8.10 Supply Chain Localization and Resilience
Chapter 9 Australia Artificial Intelligence in Crop Protection and Yield Management Market Regulations and Policies
- 9.1 Relevant Laws, Standards and Compliance Frameworks
- 9.2 Product, Service, Safety and Quality Requirements
- 9.3 Government Policies, Incentives and Subsidies
- 9.4 Imports, Exports and Trade Barriers
- 9.5 Public Procurement and Local Content Requirements
- 9.6 Environmental and Sustainability Compliance
- 9.7 Upcoming Policy Changes and Market Implications
Chapter 10 Australia Artificial Intelligence in Crop Protection and Yield Management Market Hotspots and Opportunities
- 10.1 Market Opportunity Mapping and Growth Hotspots
- 10.2 High-Growth Applications and Customer Groups
- 10.3 Underserved Markets and White-Space Opportunities
- 10.4 Emerging Technology and Product Opportunities
- 10.5 New Capacity and Investment Hotspots
- 10.6 Market Entry and Expansion Opportunities
- 10.7 Distribution and Partnership Opportunities
- 10.8 Near-Term and Long-Term Commercial Potential
- 10.9 Opportunity Attractiveness and Execution Risks
Chapter 11 Australia Artificial Intelligence in Crop Protection and Yield Management Market Outlook, 2025-2035
- 11.1 Market Size and Analysis
- 11.1.1 Revenue (Market Measurement: 2025: USD 39.5 million → 2035: USD 253.7 million)
- 11.1.2 Market Volume and Quantity Sold
- 11.1.3 Historical Market Size, 2018-2025
- 11.1.4 Base-Year Market Size, 2025
- 11.2 Market Forecast, 2025-2035
- 11.2.1 Revenue Forecast to 2035
- 11.2.2 Volume Forecast to 2035
- 11.2.3 CAGR and Year-on-Year Growth
- 11.2.4 Incremental Revenue Opportunity
- 11.3 Forecast Assumptions and Scenario Analysis
- 11.3.1 Base-Case Forecast
- 11.3.2 Optimistic and Conservative Scenarios
- 11.3.3 Technology, Pricing and Policy Sensitivities
- 11.4 Market Attractiveness and Growth Outlook
Chapter 12 Australia Artificial Intelligence in Crop Protection and Yield Management Market Segmentation and Outlook
- 12.1 Segmentation Summary and Market Shares, 2025
- 12.2 Largest and Fastest-Growing Segments
- 12.3 By Solution Type - Market Size and Forecast, 2025-2035
- 12.3.1 Segment Definition and Scope
- 12.3.2 Historical Market Size, 2018-2025
- 12.3.3 Revenue Forecast, 2025-2035
- 12.3.4 Volume Forecast, 2025-2035
- 12.3.5 Base-Year Market Share, 2025
- 12.3.6 Segment CAGR and Growth Drivers
- 12.3.7 Subsegment Market Size and Forecast
- 12.3.7.1 Software Platforms
- 12.3.7.2 Autonomous Field Systems
- 12.3.7.3 Disease Surveillance Systems
- 12.3.7.4 Pest Surveillance Systems
- 12.3.8 Subsegment Pricing and Adoption Trends
- 12.3.9 Leading Suppliers and Competition
- 12.3.10 Regional Demand and Opportunities
- 12.4 By Crop Type - Market Size and Forecast, 2025-2035
- 12.4.1 Segment Definition and Scope
- 12.4.2 Historical Market Size, 2018-2025
- 12.4.3 Revenue Forecast, 2025-2035
- 12.4.4 Volume Forecast, 2025-2035
- 12.4.5 Base-Year Market Share, 2025
- 12.4.6 Segment CAGR and Growth Drivers
- 12.4.7 Subsegment Market Size and Forecast
- 12.4.7.1 Broadacre Grains and Pulses
- 12.4.7.2 Horticulture and Viticulture
- 12.4.7.3 Cotton and Sugarcane
- 12.4.8 Subsegment Pricing and Adoption Trends
- 12.4.9 Leading Suppliers and Competition
- 12.4.10 Regional Demand and Opportunities
- 12.5 By Customer Type - Market Size and Forecast, 2025-2035
- 12.5.1 Segment Definition and Scope
- 12.5.2 Historical Market Size, 2018-2025
- 12.5.3 Revenue Forecast, 2025-2035
- 12.5.4 Volume Forecast, 2025-2035
- 12.5.5 Base-Year Market Share, 2025
- 12.5.6 Segment CAGR and Growth Drivers
- 12.5.7 Subsegment Market Size and Forecast
- 12.5.7.1 Farm Operators
- 12.5.7.2 Agronomy Service Providers
- 12.5.7.3 Agribusiness Program Operators
- 12.5.8 Subsegment Pricing and Adoption Trends
- 12.5.9 Leading Suppliers and Competition
- 12.5.10 Regional Demand and Opportunities
- 12.6 By Application - Market Size and Forecast, 2025-2035
- 12.6.1 Segment Definition and Scope
- 12.6.2 Historical Market Size, 2018-2025
- 12.6.3 Revenue Forecast, 2025-2035
- 12.6.4 Volume Forecast, 2025-2035
- 12.6.5 Base-Year Market Share, 2025
- 12.6.6 Segment CAGR and Growth Drivers
- 12.6.7 Subsegment Market Size and Forecast
- 12.6.7.1 Crop Protection
- 12.6.7.2 Yield Prediction and Harvest Planning
- 12.6.7.3 Crop Health Monitoring
- 12.6.8 Subsegment Pricing and Adoption Trends
- 12.6.9 Leading Suppliers and Competition
- 12.6.10 Regional Demand and Opportunities
- 12.7 Segment Growth Comparison
- 12.8 Segment Attractiveness and Priority Matrix
Chapter 13 Australia Artificial Intelligence in Crop Protection and Yield Management End-Use and Application Market Outlook
- 13.1 End-Use Industry and Customer Demand Structure
- 13.2 Leading Applications and Customer Groups
- 13.3 End-Use Market Size, Share and Forecast
- 13.4 Major End-Use Industry Deep Dives
- 13.4.1 Customer Requirements and Use Cases
- 13.4.2 Demand and Replacement Cycles
- 13.4.3 Technical and Regulatory Considerations
- 13.4.4 Purchasing and Procurement Models
- 13.4.5 Leading Vendors and Distribution Channels
- 13.4.6 Forecast and Commercial Opportunities
- 13.5 Emerging Applications and Cross-Segment Demand
- 13.6 End-Use Industry Investment Priorities
Chapter 14 Australia Artificial Intelligence in Crop Protection and Yield Management Geographic Market Outlook, 2025-2035
- 14.1 Domestic Market Distribution and Demand Clusters
- 14.2 State- or Province-Wise Market Size and Forecast, 2025-2035
- 14.3 City and Metropolitan Market Outlook
- 14.4 Industrial, Manufacturing and Commercial Clusters
- 14.5 Geographic Concentration of Key End Users
- 14.6 Local Pricing and Purchasing Differences
- 14.7 Domestic Production Facilities and Capacity Map
- 14.8 Local Infrastructure and Project Pipeline
- 14.9 State-Level Policy and Incentive Differences
- 14.10 Subnational Investment Hotspots and Opportunities
- 14.11 Distribution and Logistics Networks
- 14.12 Domestic Competitive Footprint
Chapter 15 Australia Artificial Intelligence in Crop Protection and Yield Management Technology, Innovation and Sustainability Outlook
- 15.1 Technology Landscape and Maturity
- 15.2 Product, Process and Service Innovation
- 15.3 AI, Automation and Digital Tools in the Industry
- 15.4 Technology Adoption and Performance Benchmarking
- 15.5 Innovation Pipeline and R&D Investment
- 15.6 Patent and Intellectual Property Trends
- 15.7 Energy Efficiency and Resource Management
- 15.8 Sustainability, Recycling and Circularity
- 15.9 Technology Roadmap, 2025-2035
- 15.10 Risks of Obsolescence and Technology Substitution
Chapter 16 Australia Artificial Intelligence in Crop Protection and Yield Management Market Key Strategic Imperatives
- 16.1 Growth and Market Entry Priorities
- 16.2 High-Return Products and Segments
- 16.3 Pricing, Profitability and Cost Optimization
- 16.4 Technology Investment and Product Differentiation
- 16.5 Supply Chain Localization and Resilience
- 16.6 Distribution and Customer Acquisition
- 16.7 Partnership, Acquisition and Capacity Strategy
- 16.8 Regional Expansion Priorities
- 16.9 Short-, Medium- and Long-Term Actions
Chapter 17 Competition Outlook
- 17.1 Industry Competition Characteristics
- 17.2 Market Structure and Concentration
- 17.3 Market Share and Competitive Positioning, 2025
- 17.4 Company-Wise Revenue and Product Benchmarking
- 17.5 Production and Service Capacity Benchmarking
- 17.6 Technology, Pricing and Differentiation
- 17.7 Regional Footprint and Distribution Strength
- 17.8 Mergers, Acquisitions and Strategic Alliances
- 17.9 New Entrants and Competitive Threats
- 17.10 Porter's Five Forces and Industry Attractiveness
- 17.11 Competitive Outlook, 2025-2035
Chapter 18 Company Profiles
- 18.1 Company Coverage and Selection Criteria
- 18.2 SwarmFarm Robotics
- 18.2.1 Business Description
- 18.2.2 Company Ownership and Geographic Presence
- 18.2.3 Product and Service Portfolio
- 18.2.4 Manufacturing and Operating Footprint
- 18.2.5 Production Capacity and Expansion Plans
- 18.2.6 Financial Performance and Investment
- 18.2.7 Market Share and Competitive Position
- 18.2.8 Technology and Innovation Capabilities
- 18.2.9 Strategic Alliances or Partnerships
- 18.2.10 Recent Developments
- 18.2.11 Growth Strategy and Outlook
- 18.3 Yamaha Agriculture Australia
- 18.4 CropX Technologies
- 18.5 John Deere
- 18.6 BioScout
- 18.7 RapidAIM
- 18.8 Bitwise Agronomy
- 18.9 Green Atlas
- 18.10 InFarm
- 18.11 Kilter
- 18.12 Other Relevant Market Participants
Note: Every listed company is profiled on the structure shown under the first company. The company list is preliminary and may change based on research findings, market developments, data availability and client requirements.
Chapter 19 Disclaimer
- 19.1 Research and Forecast Disclaimer
- 19.2 Data Source and Estimation Limitations
Note: The depth of individual sections depends on data availability for this market. Volume, capacity, trade and other unit-based metrics are included where applicable.

