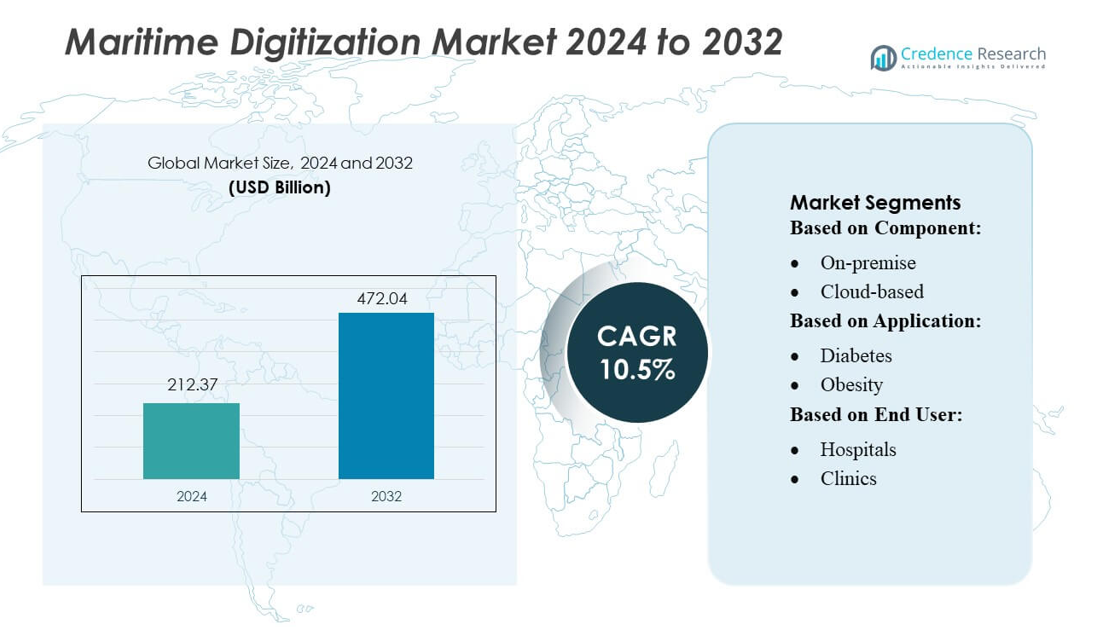
Home » Information and Communications Technology » Maritime Digitization Market

Maritime Digitization Market By Technology (IoT, Blockchain, AI, Others) By Application (Fleet Management, Vessel Management, Energy Management, Inventory Management) – Growth, Future Prospects & Competitive Analysis, 2016 – 2030

Price: $4999

Published: | Report ID: 18312 | Report Format : PDF

Key Highlights of the Report

The global Maritime Digitization market is segmented by technology, application, end-user, and region.  The ports and terminals category was the largest contributor to the global maritime digitization market in 2022, accounting for about half of the market. Asia is the largest maritime region in the globe, accounting for more than half of global shipping trade. The region also contains some of the world’s busiest ports, including Singapore, Shanghai, and Hong Kong. Consequently, Asia is a significant driver of maritime digitization.

The expansion of the maritime digitalization market can be traced back to the rising need for economy and effectiveness. In the maritime industry, digitization can boost efficiency and cost savings by automating processes and data analysis. Better coordination and communication between shipping firms, ports, and logistics providers is another way digitization can improve the marine industry and save operational costs.

However, the global Maritime Digitization market in Asia and the Pacific is one of the fastest-growing markets for digitalization. The region is expected to experience a digital transformation in the maritime industry due to rising consumer disposable income, the proliferation of mobile networks, and the importance of online shopping platforms.

Market Overview

The global Maritime Digitization market has witnessed steady growth in recent years and is anticipated to continue growing at a CAGR of 9.50% between 2023 and 2030. The market was valued at USD 158.1 Billion in 2022 and is expected to reach USD 298.42 Billion in 2030.

What Are The Main Drivers Of The Global Maritime Digitization Market?

The desire for efficiency and cost-cutting is increasing. The marine industry is becoming more digitalized due to the increased importance of customer happiness, and new technologies like AI and ML are being developed. These factors are what are driving the worldwide maritime digitization market. Additionally, AI is being applied in the maritime sector to automate tasks like cargo loading and route planning and to analyze vast volumes of data to enhance decision-making. Additionally, the usage of cutting-edge sensors like LIDAR, RADAR, ultrasonic, and cameras is expanding in the maritime sector.

What Are The Major Challenges Faced By The Global Maritime Digitization Market?

Market fragmentation in the maritime sector makes standardizing digital systems and procedures difficult. This may make it challenging for businesses to implement digital solutions and cause system compatibility problems. Lack of uniformity can result in inefficiencies and increased costs for businesses since they may be forced to invest in multiple digital systems to satisfy various clients and business partners.

Design Element 2

Access crucial information at unmatched prices!

Request your free sample report today & start making informed decisions powered by Credence Research!

Download Free Sample
CTA Design Element 3

What Are The Growth Opportunities In The Global Maritime Digitization Market?

Investors, transporters, and regulators are paying more attention to the marine sector as it pursues decarbonization and ESG score reports in the interest of a sustainable future. To meet regulatory requirements, draw investors, and implement maritime digitalization for a more environmentally friendly future, ESG reporting is thus increasing traction in the maritime industry.

Executive Summary

Overview of the Global Maritime Digitization Market

Digitalization and recent AI, blockchain, IoT, and automation advancements are becoming increasingly important for maritime transportation. They aid in streamlining current procedures, developing new commercial chances, and altering trade geography and supply chains. Additionally, they are being used to drive the industry’s decarbonization so that there won’t be any emissions from global shipping. Utilizing data streams from gadgets like sensors and other information sources can help with control, monitoring, quality assurance, and verification.

Market Definition

Marine digitalization uses digital technology in the marine sector to enhance operations, boost efficiency, and cut costs. Using technologies like the Internet of Things (IoT), big data analytics, artificial intelligence (AI), blockchain, and cloud computing are all part of this. The purpose of marine digitalization is to develop a maritime sector that is more intelligent, connected, and secure. Digital technology adoption in the maritime sector can also increase operational effectiveness, improved security, and cost savings. Additionally, it can lessen the negative effects of shipping operations on the environment.

Market Insights

  • The global demand for Maritime Digitization was valued at USD 158.1 Billion in 2022 and is expected to reach USD 298.42 Billion in 2030, growing at a CAGR of 9.50% between 2023 and 2030.
  • In 2022, the IoT category accounted for over two-thirds of the market for maritime digitalization, holding the biggest share. However, the AI sector is anticipated to dominate the market during the anticipated period.
  • In 2022, the fleet management sector held the largest market share, accounting for over one-third of the global maritime digitization market. This segment is predicted to continue to dominate the market in terms of profits over the forecast period.
  • Regarding revenue, the ports and terminals category was the largest contributor to the global maritime digitization market in 2022, accounting for about half of the market.
  • In 2022, North America accounted for about 46% of the global marine digitalization market, holding the highest share. By 2030, the Asia-Pacific area is anticipated to take control, nevertheless. The region is also anticipated to exhibit the quickest CAGR, at 10.8%, between 2023 and 2030.
  • The demand for efficiency and cost-cutting is increasing. The marine industry is becoming more digitalized due to the increased importance of customer satisfaction, and new technologies such as artificial intelligence and machine learning are being developed.

Segmentation by Technology

  • The Internet of Things (IoT) is the major segment by technology and held over 41% share in 2022.
  • The AI segment will probably exhibit the highest CAGR during the predicted period.
  • The blockchain segment is anticipated to hold a lower market share than IoT and AI.

Segmentation by Application

  • In 2022, the market for marine digitization had the biggest revenue share earned by the fleet management category.
  • The maritime business requires fleet management because maritime transit is one of the world’s most important modes of commerce and transportation.
  •  From 2023 to 2030, the predictive maintenance market will exhibit the greatest CAGR.

Segmentation by End User

  • In terms of revenue, the ports and terminals sector was responsible for the largest part of the global maritime digitization market in 2022, accounting for 47.3%.
  • During the projected period, the market for Maritime Freight Forwarders is anticipated to increase at the highest CAGR.

Segmentation by Region

  • In 2022 North America accounted for about two-fifths of the worldwide marine digitalization market, holding the highest share.
  • By 2030, the Asia-Pacific area is anticipated to take control, nevertheless. Additionally, from 2022 to 2031, the region is anticipated to exhibit the fastest CAGR.

In the coming years, the adoption of blockchain technology is anticipated to pick up, which will help maritime digitalization progress even further. Blockchain offers safe, transparent, and unchangeable records of transactions, agreements, and supply chain procedures in the maritime sector. Due to the availability of cutting-edge platforms and solutions that facilitate connection, interoperability, and partnership among various stakeholders in the maritime ecosystem, the global market for maritime digitization is predicted to expand rapidly over the coming years.

In 2022, the United States dominated North America. Data centers and other cutting-edge telecommunications infrastructure, for example, make it possible to adopt digitalization and security in the region’s maritime transportation industry quickly and effectively.

 In 2022, the UK had a sizable portion of the maritime digitalization market. The industry benefits from using technologies including advanced analytics, IoT, surveillance, asset management, and vessel tracking to growing public awareness of the benefits of digitalization in the maritime sector. This helps the industry operate more efficiently in the modern technology environment to meet UK customers’ demands.

The maritime digitalization industry is not only one of the world’s earliest industries, but also one of the most traditional. However, the industry is undergoing a digital transformation as shipping companies implement digital technologies to enhance operations, boost efficiency, and reduce costs.

Due to the need to upgrade existing infrastructure and systems, the implementation of digital technologies in the maritime sector can be expensive. This can be a hindrance for small businesses that lack the financial resources to engage in digitalization. In addition, the maritime industry faces a lack of skilled employees who can implement and utilize digital technologies. This can make it challenging for businesses to implement digitalization, as they may lack the necessary internal expertise.

Growing Importance of the Marine Sector

Due to increased corporate competition and a challenging economic environment, the importance of customer satisfaction is increasing in the marine sector. As a result, businesses are always looking for ways to increase consumer happiness and maintain competitiveness. Factors like cargo tracking, dependability, and overall service quality may also impact customer satisfaction. Digitization can help to improve these factors by enabling improved coordination and communication amongst players in the maritime industry, such as shipping companies, ports, and logistics providers. In turn, this will fuel the market’s expansion.

Rising Focus on Sustainability

Commercial vessels, which transport over 80% of all commerce volume, move close to 11 billion tons of packages yearly. As a result, 3% of all greenhouse gas emissions (GHG) are generated globally. As a result, as the maritime industry promotes ESG scores and decarbonization declarations in the interest of a sustainable environment, shippers, investors, and regulators are giving more attention to it. ESG reporting is gaining hold in the shipping sector to satisfy regulatory obligations, attract investors, and implement maritime digitization for a sustainable future. As a result, sustainability and decarbonization are anticipated to drive the marine digitization market during the projection period.

High Cost of Applications

The pricey software provides cutting-edge functionality and applications. Unfortunately, some customers may find this price prohibitive, making obtaining the maritime digitalization they require difficult. Many websites, however, provide cutting-edge features at astronomical prices for maritime digitization technologies. Therefore, the high initial cost of maritime digitalization approaches is a significant obstacle to adoption. Many of these programs are also susceptible to malware assaults and information leaks.

Growing Market Competition

Market fragmentation in the maritime sector makes standardizing digital systems and procedures difficult. This may make it challenging for businesses to implement digital solutions and cause system compatibility problems. Lack of uniformity can result in inefficiencies and increased costs for businesses since they may be forced to invest in multiple digital systems to satisfy various clients and business partners. In the maritime business, there is also a shortage of skilled employees with the requisite abilities to implement and maintain digital systems, which may be a barrier to adoption. Additionally, there aren’t enough educational and training options for maritime industry professionals to acquire the skills necessary to operate digital systems. Thus, it is anticipated that these issues will restrain the growth of the marine digitization market.

Rising Investments

To increase productivity, security, and safety in ports, governments worldwide are making noteworthy investments in smart port infrastructure. Smart ports use digital technologies to streamline port operations and enhance cargo flow, including the Internet of Things (IoT), Artificial Intelligence (AI), and Big Data. Globally, governments are making significant investments in the infrastructure of smart ports. For instance, to increase the effectiveness and sustainability of its operations, the Port of Rotterdam Authority declared in 2019 that it would invest €233 billion over the following five years. Similarly, the Sagarmala Program, initiated by the Indian government, intends to modernize and automate the nation’s ports and port-led infrastructure.

Growing Adoption of New Technologies

The maritime sector is progressively adopting cloud-based technologies like software as a Service (SaaS) and Platform as a Service (PaaS). Cloud-based options can lower infrastructure expenses while enhancing data accessibility and teamwork. The maritime industry is embracing cloud-based technology more and more as a result of its affordability and scalability. During the projection period of 2023 to 2030, the maritime industry’s worldwide cloud computing market is anticipated to expand at a CAGR.

Maritime Digitization Market.png

Growing Adoption in Europe

Due to the presence of some of the busiest ports in the world there, Europe is one of the biggest markets for marine digitization. The region’s market is expanding due to the demand for effective and secure port operations. The UK, Germany, and the Netherlands are the main drivers of the European market’s expansion. The region’s adoption of digital technologies like AI, IoT, and Big Data, as well as rising investments in smart port infrastructure, are key propellants.

Competitive Landscape

Key Players

The marine digitalization market is very fragmented in competition, with many competitors there. Some of the major players control the market:

  • Lockheed Martin Corporation
  • ORBCOMM
  • Perle
  • Windward Ltd.
  • MariApps Marine Solutions
  • Spire Global, Inc.
  • Iridium Communications Inc.
  • SparkCognition
  • xyzt.ai
  • Inmarsat Global Limited
  • Others

These firms are concentrating on methods like alliances, partnerships, mergers, and acquisitions to increase their market share and provide cutting-edge solutions to their clients.

Leading suppliers are making R&D investments to launch cutting-edge computing and IoT solutions that can satisfy the expanding maritime digitalization market need. These service providers utilize the most recent developments in the maritime digitization sector to seize new chances and keep ahead of the competition.

Wärtsilä and DNV joined together in May 2023 to provide connectivity between Wärtsilä’s Fleet Optimisation Solution (FOS) and Veracity, which will aid ship management business Anglo-Eastern in streamlining emissions compliance reporting. By streamlining and increasing the effectiveness of their operations, managers could move one step closer to achieving end-to-end optimization.

The collaboration between Campbell Shipping and Inmarsat Global Limited for fleet Xpress was expanded, and fleet care and fleet secure endpoint services were added. Campbell Shipping would receive 12 vessel solutions from Inmarsat.

Shape Your Report to Specific Countries or Regions & Enjoy 30% Off!

Summary of Key Findings

  • In the marine sector, autonomous vessel development and usage are growing. These vessels use robotics, AI, cameras, and cutting-edge sensors to navigate and run autonomously.
  • Market segmented by Technology, Application, End User, and region.
  • The real-time vessel tracking and fuel management solutions market is expected to grow significantly by 2022, favoring the fleet management segment.
  • Due to rising commercial activity and the presence of a few of the busiest ports in the world in the region, the Asia-Pacific marine digitalization market is predicted to expand at the fastest rate.
  • As new firms continue to enter the market and incumbent businesses continue to invest in cutting-edge technology and solutions, the competitive environment in the marine digitalization sector is likely to remain fragmented in the years to come.

Future Outlook

  • The industry for maritime digitization is expanding quickly and has much potential.
  • The major industry players are investing significantly in innovative technologies and solutions to keep ahead of the competition.
  • The desire for more effective and secure shipping operations is anticipated to fuel market expansion in the upcoming years.

Segmentation

  • By Technology
    • IoT
    • Blockchain
    • AI
    • Others
  • By Application
    • Fleet Management
    • Vessel Management
    • Energy Management
    • Inventory Management
    • Predictive Maintenance
  • By End User
    • Ports and Terminals
    • Shipping Companies
    • Maritime Freight Forwarders
  • By Region
  • North America
    • US
    • Canada
    • Mexico
  • Europe
    • Germany
    • France
    • UK.
    • Italy
    • Spain
    • Rest of Europe
  • Asia Pacific
    • China
    • Japan
    • India
    • South Korea
    • South-east Asia
    • Rest of Asia Pacific
  • Latin America
    • Brazil
    • Argentina
    • Rest of Latin America
  • Middle East & Africa
    • GCC Countries
    • South Africa
    • Rest of Middle East and Africa

1. Preface
1.1. Report Description
1.1.1. Purpose of the Report
1.1.2. Target Audience
1.1.3. USP and Key Offerings
1.2. Research Scope
1.3. Research Methodology
1.3.1. Phase I – Secondary Research
1.3.2. Phase II – Data Modelling
1.3.2.1. Company Share Analysis Model
1.3.2.2. Revenue-Based Modelling
1.3.3. Phase III – Primary Research
1.3.4. Research Limitations
1.3.5. Assumptions
1.4. Market Introduction
1.5. Market Research Scope

2. Executive Summary
2.1. Market Snapshot: Global Maritime Digitization Market
2.2. Global Maritime Digitization Market, By Technology
2.3. Global Maritime Digitization Market, By Application
2.4. Global Maritime Digitization Market, By End User
2.5. Global Maritime Digitization Market, By Region

3. Market Dynamics & Factors Analysis
3.1. Introduction
3.1.1. Global Maritime Digitization Market Value, 2017-2030, (US$ Bn)
3.1.2. Y-o-Y Growth Trend Analysis
3.2. Market Dynamics
3.2.1. Market Drivers
3.2.1.1. Driver 1
3.2.1.2. Driver 2
3.2.1.3. Driver 3
3.2.2. Market Restraints
3.2.2.1. Restraint 1
3.2.2.2. Restraint 2
3.2.3. Market Opportunities
3.2.3.1. Opportunity 1
3.2.3.2. Opportunity 2
3.2.4. Major Industry Challenges
3.2.4.1. Challenge 1
3.2.4.2. Challenge 2
3.3. Growth and Development Patterns
3.4. Investment Feasibility Analysis
3.5. Market Opportunity Analysis
3.5.1. Technology
3.5.2. Application
3.5.3. End User
3.5.4. Geography

4. Premium Insights
4.1. STAR (Situation, Task, Action, Results) Analysis
4.2. Porter’s Five Forces Analysis
4.2.1. Threat of New Entrants
4.2.2. Bargaining Power of Buyers/Consumers
4.2.3. Bargaining Power of Suppliers
4.2.4. Threat of Substitute Types
4.2.5. Intensity of Competitive Rivalry
4.3. Key Market Trends
4.3.1. Demand Side Trends
4.3.2. Supply Side Trends
4.4. Value Chain Analysis
4.5. Technology Analysis
4.6. Analysis and Recommendations
4.7. Marketing Strategy Analysis
4.7.1. Direct Marketing
4.7.2. Indirect Marketing
4.7.3. Marketing Channel Development Trend

5. Market Positioning of Key Players, 2022
5.1. Company market share of key players, 2022
5.2. Competitive Benchmarking
5.3. Market Positioning of Key Vendors
5.4. Geographical Presence Analysis
5.5. Major Strategies Adopted by Key Players
5.5.1. Key Strategies Analysis
5.5.2. Mergers and Acquisitions
5.5.3. Partnerships
5.5.4. Product Launch
5.5.5. Geographical Expansion
5.5.6. Others

6. Economic Impact Analysis
6.1. Recession Impact
6.1.1. North America
6.1.2. Europe
6.1.3. Asia Pacific
6.1.4. Latin America
6.1.5. Middle East and Africa
6.2. Ukraine-Russia War Impact
6.2.1. North America
6.2.2. Europe
6.2.3. Asia Pacific
6.2.4. Latin America
6.2.5. Middle East and Africa
6.3. COVID-19 Impact Analysis
6.3.1. North America
6.3.2. Europe
6.3.3. Asia Pacific
6.3.4. Latin America
6.3.5. Middle East and Africa

7. Global Maritime Digitization Market, By Technology
7.1. Global Maritime Digitization Market Overview, by Technology
7.1.1. Global Maritime Digitization Market Revenue Share, By Technology, 2022 Vs 2030 (in %)
7.2. IoT
7.2.1. Global Maritime Digitization Market, By Region, 2017-2030 (US$ Bn)
7.3. Blockchain
7.3.1. Global Maritime Digitization Market, By Region, 2017-2030 (US$ Bn)
7.4. AI
7.4.1. Global Maritime Digitization Market, By Region, 2017-2030 (US$ Bn)
7.5. Others
7.5.1. Global Maritime Digitization Market, By Region, 2017-2030 (US$ Bn)

8. Global Maritime Digitization Market, By Application
8.1. Global Maritime Digitization Market Overview, by Application
8.1.1. Global Maritime Digitization Market, By Application, 2022 vs 2030 (in %)
8.2. Fleet Management
8.2.1. Global Maritime Digitization Market, By Region, 2017-2030 (US$ Bn)
8.3. Vessel Management
8.3.1. Global Maritime Digitization Market, By Region, 2017-2030 (US$ Bn)
8.4. Energy Management
8.4.1. Global Maritime Digitization Market, By Region, 2017-2030 (US$ Bn)
8.5. Inventory Management
8.5.1. Global Maritime Digitization Market, By Region, 2017-2030 (US$ Bn)
8.6. Predictive Maintenance
8.6.1. Global Maritime Digitization Market, By Region, 2017-2030 (US$ Bn)

9. Global Maritime Digitization Market, by End User, 2017-2030 (US$ Bn)
9.1. Global Maritime Digitization Market Overview, by End User
9.1.1. Global Maritime Digitization Market, By End User, 2022 vs 2030 (in%)
9.2. Ports and Terminals
9.2.1. Global Maritime Digitization Market, By Region, 2017-2030 (US$ Bn)
9.3. Shipping Companies
9.3.1. Global Maritime Digitization Market, By Region, 2017-2030 (US$ Bn)
9.4. Maritime Freight Forwarders
9.4.1. Global Maritime Digitization Market, By Region, 2017-2030 (US$ Bn)

10. Global Maritime Digitization Market, By Region
10.1. Global Maritime Digitization Market Overview, by Region
10.1.1. Global Maritime Digitization Market, By Region, 2022 vs 2030 (in%)
10.2. Technology
10.2.1. Global Maritime Digitization Market, By Technology, 2017-2030 (US$ Bn)
10.3. Application
10.3.1. Global Maritime Digitization Market, By Application, 2017-2030 (US$ Bn)
10.4. End User
10.4.1. Global Maritime Digitization Market, By End User, 2017-2030 (US$ Bn)

11. North America Maritime Digitization Market Analysis
11.1. North America Maritime Digitization Market, by Technology, 2017-2030(US$ Bn)
11.1.1. Overview
11.1.2. SRC Analysis
11.2. North America Maritime Digitization Market, by Application, 2017-2030(US$ Bn)
11.2.1. Overview
11.2.2. SRC Analysis
11.3. North America Maritime Digitization Market, by End User, 2017-2030(US$ Bn)
11.3.1. Overview
11.3.2. SRC Analysis
11.4. North America Maritime Digitization Market, by Country, 2017-2030 (US$ Bn)
11.4.1. North America Maritime Digitization Market, by Country, 2022 Vs 2030 (in%)
11.4.2. U.S.
11.4.2.1. U.S. Maritime Digitization Market Estimates and Forecast, 2017-2030 (US$ Bn)
11.4.2.2. U.S. Maritime Digitization, By Technology, 2017-2030 (US$ Bn)
11.4.2.3. U.S. Maritime Digitization, By Application, 2017-2030 (US$ Bn)
11.4.2.4. U.S. Maritime Digitization, By End User, 2017-2030 (US$ Bn)
11.4.3. Canada
11.4.3.1. Canada Maritime Digitization Market Estimates and Forecast, 2017-2030 (US$ Bn)
11.4.3.2. Canada Maritime Digitization, By Technology, 2017-2030 (US$ Bn)
11.4.3.3. Canada Maritime Digitization, By Application, 2017-2030 (US$ Bn)
11.4.3.4. Canada Maritime Digitization, By End User, 2017-2030 (US$ Bn)
11.4.4. Mexico
11.4.4.1. Mexico Maritime Digitization Market Estimates and Forecast, 2017-2030 (US$ Bn)
11.4.4.2. Mexico Maritime Digitization, By Technology, 2017-2030 (US$ Bn)
11.4.4.3. Mexico Maritime Digitization, By Application, 2017-2030 (US$ Bn)
11.4.4.4. Mexico Maritime Digitization, By End User, 2017-2030 (US$ Bn)

12. Europe Maritime Digitization Market Analysis
12.1. Europe Maritime Digitization Market, by Technology, 2017-2030(US$ Bn)
12.1.1. Overview
12.1.2. SRC Analysis
12.2. Europe Maritime Digitization Market, by Application, 2017-2030(US$ Bn)
12.2.1. Overview
12.2.2. SRC Analysis
12.3. Europe Maritime Digitization Market, by End User, 2017-2030(US$ Bn)
12.3.1. Overview
12.3.2. SRC Analysis
12.4. Europe Maritime Digitization Market, by Country, 2017-2030 (US$ Bn)
12.4.1. Europe Maritime Digitization Market, by Country, 2022 Vs 2030 (in%)
12.4.2. Germany
12.4.2.1. Germany Maritime Digitization Market Estimates and Forecast, 2017-2030 (US$ Bn)
12.4.2.2. Germany Maritime Digitization, By Technology, 2017-2030 (US$ Bn)
12.4.2.3. Germany Maritime Digitization, By Application, 2017-2030 (US$ Bn)
12.4.2.4. Germany Maritime Digitization, By End User, 2017-2030 (US$ Bn)
12.4.3. France
12.4.3.1. France Maritime Digitization Market Estimates and Forecast, 2017-2030 (US$ Bn)
12.4.3.2. France Maritime Digitization, By Technology, 2017-2030 (US$ Bn)
12.4.3.3. France Maritime Digitization, By Application, 2017-2030 (US$ Bn)
12.4.3.4. France Maritime Digitization, By End User, 2017-2030 (US$ Bn)
12.4.4. UK
12.4.4.1. UK Maritime Digitization Market Estimates and Forecast, 2017-2030 (US$ Bn)
12.4.4.2. UK Maritime Digitization, By Technology, 2017-2030 (US$ Bn)
12.4.4.3. UK Maritime Digitization, By Application, 2017-2030 (US$ Bn)
12.4.4.4. UK Maritime Digitization, By End User, 2017-2030 (US$ Bn)
12.4.5. Italy
12.4.5.1. Italy Maritime Digitization Market Estimates and Forecast, 2017-2030 (US$ Bn)
12.4.5.2. Italy Maritime Digitization, By Technology, 2017-2030 (US$ Bn)
12.4.5.3. Italy Maritime Digitization, By Application, 2017-2030 (US$ Bn)
12.4.5.4. Italy Maritime Digitization, By End User, 2017-2030 (US$ Bn)
12.4.6. Spain
12.4.6.1. Spain Maritime Digitization Market Estimates and Forecast, 2017-2030 (US$ Bn)
12.4.6.2. Spain Maritime Digitization, By Technology, 2017-2030 (US$ Bn)
12.4.6.3. Spain Maritime Digitization, By Application, 2017-2030 (US$ Bn)
12.4.6.4. Spain Maritime Digitization, By End User, 2017-2030 (US$ Bn)
12.4.7. Rest of Europe
12.4.7.1. Rest of Europe Maritime Digitization Market Estimates and Forecast, 2017-2030 (US$ Bn)
12.4.7.2. Rest of Europe Maritime Digitization, By Technology, 2017-2030 (US$ Bn)
12.4.7.3. Rest of Europe Maritime Digitization, By Application, 2017-2030 (US$ Bn)
12.4.7.4. Rest of Europe Maritime Digitization, By End User, 2017-2030 (US$ Bn)

13. Asia Pacific Maritime Digitization Market Analysis
13.1. Asia Pacific Maritime Digitization Market, by Technology, 2017-2030(US$ Bn)
13.1.1. Overview
13.1.2. SRC Analysis
13.2. Asia Pacific Maritime Digitization Market, by Application, 2017-2030(US$ Bn)
13.2.1. Overview
13.2.2. SRC Analysis
13.3. Asia Pacific Maritime Digitization Market, by End User, 2017-2030(US$ Bn)
13.3.1. Overview
13.3.2. SRC Analysis
13.4. Asia Pacific Maritime Digitization Market, by Country, 2017-2030 (US$ Bn)
13.4.1. Asia Pacific Maritime Digitization Market, by Country, 2022 Vs 2030 (in%)
13.4.2. China
13.4.2.1. China Maritime Digitization Market Estimates and Forecast, 2017-2030 (US$ Bn)
13.4.2.2. China Maritime Digitization, By Technology, 2017-2030 (US$ Bn)
13.4.2.3. China Maritime Digitization, By Application, 2017-2030 (US$ Bn)
13.4.2.4. China Maritime Digitization, By End User, 2017-2030 (US$ Bn)
13.4.3. Japan
13.4.3.1. Japan Maritime Digitization Market Estimates and Forecast, 2017-2030 (US$ Bn)
13.4.3.2. Japan Maritime Digitization, By Technology, 2017-2030 (US$ Bn)
13.4.3.3. Japan Maritime Digitization, By Application, 2017-2030 (US$ Bn)
13.4.3.4. Japan Maritime Digitization, By End User, 2017-2030 (US$ Bn)
13.4.4. India
13.4.4.1. India Maritime Digitization Market Estimates and Forecast, 2017-2030 (US$ Bn)
13.4.4.2. India Maritime Digitization, By Technology, 2017-2030 (US$ Bn)
13.4.4.3. India Maritime Digitization, By Application, 2017-2030 (US$ Bn)
13.4.4.4. India Maritime Digitization, By End User, 2017-2030 (US$ Bn)
13.4.5. South Korea
13.4.5.1. South Korea Maritime Digitization Market Estimates and Forecast, 2017-2030 (US$ Bn)
13.4.5.2. South Korea Maritime Digitization, By Technology, 2017-2030 (US$ Bn)
13.4.5.3. South Korea Maritime Digitization, By Application, 2017-2030 (US$ Bn)
13.4.5.4. South Korea Maritime Digitization, By End User, 2017-2030 (US$ Bn)
13.4.6. South-East Asia
13.4.6.1. South-East Asia Maritime Digitization Market Estimates and Forecast, 2017-2030 (US$ Bn)
13.4.6.2. South-East Asia Maritime Digitization, By Technology, 2017-2030 (US$ Bn)
13.4.6.3. South-East Asia Maritime Digitization, By Application, 2017-2030 (US$ Bn)
13.4.6.4. South-East Asia Maritime Digitization, By End User, 2017-2030 (US$ Bn)
13.4.7. Rest of Asia Pacific
13.4.7.1. Rest of Asia Pacific Maritime Digitization Market Estimates and Forecast, 2017-2030 (US$ Bn)
13.4.7.2. Rest of Asia Pacific Maritime Digitization, By Technology, 2017-2030 (US$ Bn)
13.4.7.3. Rest of Asia Pacific Maritime Digitization, By Application, 2017-2030 (US$ Bn)
13.4.7.4. Rest of Asia Pacific Maritime Digitization, By End User, 2017-2030 (US$ Bn)

14. Latin America Maritime Digitization Market Analysis
14.1. Latin America Maritime Digitization Market, by Technology, 2017-2030(US$ Bn)
14.1.1. Overview
14.1.2. SRC Analysis
14.2. Latin America Maritime Digitization Market, by Application, 2017-2030(US$ Bn)
14.2.1. Overview
14.2.2. SRC Analysis
14.3. Latin America Maritime Digitization Market, by End User, 2017-2030(US$ Bn)
14.3.1. Overview
14.3.2. SRC Analysis
14.4. Latin America Maritime Digitization Market, by Country, 2017-2030 (US$ Bn)
14.4.1. Latin America Maritime Digitization Market, by Country, 2022 Vs 2030 (in%)
14.4.2. Brazil
14.4.2.1. Brazil Maritime Digitization Market Estimates and Forecast, 2017-2030 (US$ Bn)
14.4.2.2. Brazil Maritime Digitization, By Technology, 2017-2030 (US$ Bn)
14.4.2.3. Brazil Maritime Digitization, By Application, 2017-2030 (US$ Bn)
14.4.2.4. Brazil Maritime Digitization, By End User, 2017-2030 (US$ Bn)
14.4.3. Argentina
14.4.3.1. Argentina Maritime Digitization Market Estimates and Forecast, 2017-2030 (US$ Bn)
14.4.3.2. Argentina Maritime Digitization, By Technology, 2017-2030 (US$ Bn)
14.4.3.3. Argentina Maritime Digitization, By Application, 2017-2030 (US$ Bn)
14.4.3.4. Argentina Maritime Digitization, By End User, 2017-2030 (US$ Bn)
14.4.4. Rest of Latin America
14.4.4.1. Rest of Latin America Maritime Digitization Market Estimates and Forecast, 2017-2030 (US$ Bn)
14.4.4.2. Rest of Latin America Maritime Digitization, By Technology, 2017-2030 (US$ Bn)
14.4.4.3. Rest of Latin America Maritime Digitization, By Application, 2017-2030 (US$ Bn)
14.4.4.4. Rest of Latin America Maritime Digitization, By End User, 2017-2030 (US$ Bn)

15. Middle East and Africa Maritime Digitization Market Analysis
15.1. Middle East and Africa Maritime Digitization Market, by Technology, 2017-2030(US$ Bn)
15.1.1. Overview
15.1.2. SRC Analysis
15.2. Middle East and Africa Maritime Digitization Market, by Application, 2017-2030(US$ Bn)
15.2.1. Overview
15.2.2. SRC Analysis
15.3. Middle East and Africa Maritime Digitization Market, by End User, 2017-2030(US$ Bn)
15.3.1. Overview
15.3.2. SRC Analysis
15.4. Middle East and Africa Maritime Digitization Market, by Country, 2017-2030 (US$ Bn)
15.4.1. Middle East and Africa Maritime Digitization Market, by Country, 2022 Vs 2030 (in%)
15.4.2. GCC Countries
15.4.2.1. GCC Countries Maritime Digitization Market Estimates and Forecast, 2017-2030 (US$ Bn)
15.4.2.2. GCC Countries Maritime Digitization, By Technology, 2017-2030 (US$ Bn)
15.4.2.3. GCC Countries Maritime Digitization, By Application, 2017-2030 (US$ Bn)
15.4.2.4. GCC Countries Maritime Digitization, By End User, 2017-2030 (US$ Bn)
15.4.3. South Africa
15.4.3.1. South Africa Maritime Digitization Market Estimates and Forecast, 2017-2030 (US$ Bn)
15.4.3.2. South Africa Maritime Digitization, By Technology, 2017-2030 (US$ Bn)
15.4.3.3. South Africa Maritime Digitization, By Application, 2017-2030 (US$ Bn)
15.4.3.4. South Africa Maritime Digitization, By End User, 2017-2030 (US$ Bn)
15.4.4. Rest of Middle East and Africa
15.4.4.1. Rest of Middle East and Africa Maritime Digitization Market Estimates and Forecast, 2017-2030 (US$ Bn)
15.4.4.2. Rest of Middle East and Africa Maritime Digitization, By Technology, 2017-2030 (US$ Bn)
15.4.4.3. Rest of Middle East and Africa Maritime Digitization, By Application, 2017-2030 (US$ Bn)
15.4.4.4. Rest of Middle East and Africa Maritime Digitization, By End User, 2017-2030 (US$ Bn)

16. Company Profiles
16.1. Lockheed Martin Corporation.
16.1.1. Company Overview
16.1.2. Products/Services Portfolio
16.1.3. Geographical Presence
16.1.4. Financial Summary
16.1.4.1. Market Revenue and Net Profit (2019-2022)
16.1.4.2. Business Segment Revenue Analysis
16.1.4.3. Geographical Revenue Analysis
16.2. ORBCOMM
16.3. Perle
16.4. Windward Ltd.
16.5. MariApps Marine Solutions
16.6. Spire Global, Inc.
16.7. Iridium Communications Inc.
16.8. SparkCognition
16.9. xyzt.ai
16.10. Inmarsat Global Limited

List of Figures
FIG. 1 Global Maritime Digitization Market: Research Methodology
FIG. 2 Market Size Estimation – Top Down & Bottom up Approach
FIG. 3 Global Maritime Digitization Market Segmentation
FIG. 4 Global Maritime Digitization Market, by Technology, 2022 (US$ Bn)
FIG. 5 Global Maritime Digitization Market, by Application, 2022 (US$ Bn)
FIG. 6 Global Maritime Digitization Market, by End User, 2022 (US$ Bn)
FIG. 7 Global Maritime Digitization Market, by Geography, 2022 (US$ Bn)
FIG. 8 Attractive Investment Proposition, by Technology, 2022
FIG. 9 Attractive Investment Proposition, by Application, 2022
FIG. 10 Attractive Investment Proposition, by End User, 2022
FIG. 11 Attractive Investment Proposition, by Geography, 2022
FIG. 12 Global Market Share Analysis of Key Maritime Digitization Market Manufacturers, 2022
FIG. 13 Global Market Positioning of Key Maritime Digitization Market Manufacturers, 2022
FIG. 14 Global Maritime Digitization Market Value Contribution, By Technology, 2022 & 2030 (Value %)
FIG. 15 Global Maritime Digitization Market, by IoT, Value, 2017-2030 (US$ Bn)
FIG. 16 Global Maritime Digitization Market, by Blockchain, Value, 2017-2030 (US$ Bn)
FIG. 17 Global Maritime Digitization Market, by AI, Value, 2017-2030 (US$ Bn)
FIG. 18 Global Maritime Digitization Market, by Others, Value, 2017-2030 (US$ Bn)
FIG. 19 Global Maritime Digitization Market Value Contribution, By Application, 2022 & 2030 (Value %)
FIG. 20 Global Maritime Digitization Market, by Fleet Management, Value, 2017-2030 (US$ Bn)
FIG. 21 Global Maritime Digitization Market, by Vessel Management, 2017-2030 (US$ Bn)
FIG. 22 Global Maritime Digitization Market, by Energy Management, 2017-2030 (US$ Bn)
FIG. 23 Global Maritime Digitization Market, by Inventory Management, 2017-2030 (US$ Bn)
FIG. 24 Global Maritime Digitization Market, by Predictive Maintenance, 2017-2030 (US$ Bn)
FIG. 25 Global Maritime Digitization Market Value Contribution, By End User, 2022 & 2030 (Value %)
FIG. 26 Global Maritime Digitization Market, by Ports and Terminals, Value, 2017-2030 (US$ Bn)
FIG. 27 Global Maritime Digitization Market, by Shipping Companies, 2017-2030 (US$ Bn)
FIG. 28 Global Maritime Digitization Market, by Maritime Freight Forwarders, 2017-2030 (US$ Bn)
FIG. 29 North America Maritime Digitization Market, 2017-2030 (US$ Bn)
FIG. 30 U.S. Maritime Digitization Market, 2017-2030 (US$ Bn)
FIG. 31 Canada Maritime Digitization Market, 2017-2030 (US$ Bn)
FIG. 32 Europe Maritime Digitization Market, 2017-2030 (US$ Bn)
FIG. 33 Germany Maritime Digitization Market, 2017-2030 (US$ Bn)
FIG. 34 France Maritime Digitization Market, 2017-2030 (US$ Bn)
FIG. 35 U.K. Maritime Digitization Market, 2017-2030 (US$ Bn)
FIG. 36 Italy Maritime Digitization Market, 2017-2030 (US$ Bn)
FIG. 37 Spain Maritime Digitization Market, 2017-2030 (US$ Bn)
FIG. 38 Rest of Europe Maritime Digitization Market, 2017-2030 (US$ Bn)
FIG. 39 Asia Pacific Maritime Digitization Market, 2017-2030 (US$ Bn)
FIG. 40 China Maritime Digitization Market, 2017-2030 (US$ Bn)
FIG. 41 Japan Maritime Digitization Market, 2017-2030 (US$ Bn)
FIG. 42 India Maritime Digitization Market, 2017-2030 (US$ Bn)
FIG. 43 South Korea Maritime Digitization Market, 2017-2030 (US$ Bn)
FIG. 44 South-East Asia Maritime Digitization Market, 2017-2030 (US$ Bn)
FIG. 45 Rest of Asia Pacific Maritime Digitization Market, 2017-2030 (US$ Bn)
FIG. 46 Latin America Maritime Digitization Market, 2017-2030 (US$ Bn)
FIG. 47 Brazil Maritime Digitization Market, 2017-2030 (US$ Bn)
FIG. 48 Mexico Maritime Digitization Market, 2017-2030 (US$ Bn)
FIG. 49 Rest of Latin America Maritime Digitization Market, 2017-2030 (US$ Bn)
FIG. 50 Middle East & Africa Maritime Digitization Market, 2017-2030 (US$ Bn)
FIG. 51 GCC Countries Maritime Digitization Market, 2017-2030 (US$ Bn)
FIG. 52 South Africa Maritime Digitization Market, 2017-2030 (US$ Bn)
FIG. 53 Rest of Middle East and Africa Maritime Digitization Market, 2017-2030 (US$ Bn)

List of Tables
TABLE 1 Market Snapshot: Global Maritime Digitization Market
TABLE 2 Global Maritime Digitization Market: Market Drivers Impact Analysis
TABLE 3 Global Maritime Digitization Market: Market Restraints Impact Analysis
TABLE 4 Global Maritime Digitization Market, by Competitive Benchmarking, 2022
TABLE 5 Global Maritime Digitization Market, by Geographical Presence Analysis, 2022
TABLE 6 Global Maritime Digitization Market, by Key Strategies Analysis, 2022
TABLE 7 Global Maritime Digitization Market, by IoT, By Region, 2017-2022 (US$ Bn)
TABLE 8 Global Maritime Digitization Market, by IoT, By Region, 2023-2030 (US$ Bn)
TABLE 9 Global Maritime Digitization Market, by Blockchain, By Region, 2017-2022 (US$ Bn)
TABLE 10 Global Maritime Digitization Market, by Blockchain, By Region, 2023-2030 (US$ Bn)
TABLE 11 Global Maritime Digitization Market, by AI, By Region, 2017-2022 (US$ Bn)
TABLE 12 Global Maritime Digitization Market, by AI, By Region, 2023-2030 (US$ Bn)
TABLE 13 Global Maritime Digitization Market, by Others, By Region, 2017-2022 (US$ Bn)
TABLE 14 Global Maritime Digitization Market, by Others, By Region, 2023-2030 (US$ Bn)
TABLE 15 Global Maritime Digitization Market, by Fleet Management, By Region, 2017-2022 (US$ Bn)
TABLE 16 Global Maritime Digitization Market, by Fleet Management, By Region, 2023-2030 (US$ Bn)
TABLE 17 Global Maritime Digitization Market, by Vessel Management, By Region, 2017-2022 (US$ Bn)
TABLE 18 Global Maritime Digitization Market, by Vessel Management, By Region, 2023-2030 (US$ Bn)
TABLE 19 Global Maritime Digitization Market, by Energy Management, By Region, 2017-2022 (US$ Bn)
TABLE 20 Global Maritime Digitization Market, by Energy Management, By Region, 2023-2030 (US$ Bn)
TABLE 21 Global Maritime Digitization Market, by Inventory Management, By Region, 2017-2022 (US$ Bn)
TABLE 22 Global Maritime Digitization Market, by Inventory Management, By Region, 2023-2030 (US$ Bn)
TABLE 23 Global Maritime Digitization Market, by Predictive Maintenance, By Region, 2017-2022 (US$ Bn)
TABLE 24 Global Maritime Digitization Market, by Predictive Maintenance, By Region, 2023-2030 (US$ Bn)
TABLE 25 Global Maritime Digitization Market, by Ports and Terminals, By Region, 2017-2022 (US$ Bn)
TABLE 26 Global Maritime Digitization Market, by Ports and Terminals, By Region, 2023-2030 (US$ Bn)
TABLE 27 Global Maritime Digitization Market, by Shipping Companies, By Region, 2017-2022 (US$ Bn)
TABLE 28 Global Maritime Digitization Market, by Shipping Companies, By Region, 2023-2030 (US$ Bn)
TABLE 29 Global Maritime Digitization Market, by Maritime Freight Forwarders, By Region, 2017-2022 (US$ Bn)
TABLE 30 Global Maritime Digitization Market, by Maritime Freight Forwarders, By Region, 2023-2030 (US$ Bn)
TABLE 31 Global Maritime Digitization Market, by Technology, 2017-2022 (US$ Bn)
TABLE 32 Global Maritime Digitization Market, by Technology, 2023-2030 (US$ Bn)
TABLE 33 Global Maritime Digitization Market, by Modes of Sales, 2017-2022 (US$ Bn)
TABLE 34 Global Maritime Digitization Market, by Modes of Sales, 2023-2030 (US$ Bn)
TABLE 35 Global Maritime Digitization Market, by End User, 2017-2022 (US$ Bn)
TABLE 36 Global Maritime Digitization Market, by End User, 2023-2030 (US$ Bn)
TABLE 37 Global Maritime Digitization Market, by Region, 2017-2022 (US$ Bn)
TABLE 38 Global Maritime Digitization Market, by Region, 2023-2030 (US$ Bn)
TABLE 39 North America Maritime Digitization Market, by Technology, 2017-2022 (US$ Bn)
TABLE 40 North America Maritime Digitization Market, by Technology, 2023-2030 (US$ Bn)
TABLE 41 North America Maritime Digitization Market, by Modes of Sales, 2017-2022 (US$ Bn)
TABLE 42 North America Maritime Digitization Market, by Modes of Sales, 2023-2030 (US$ Bn)
TABLE 43 North America Maritime Digitization Market, by End User, 2017-2022 (US$ Bn)
TABLE 44 North America Maritime Digitization Market, by End User, 2023-2030 (US$ Bn)
TABLE 45 North America Maritime Digitization Market, by Country, 2017-2022 (US$ Bn)
TABLE 46 North America Maritime Digitization Market, by Country, 2023-2030 (US$ Bn)
TABLE 47 United States Maritime Digitization Market, by Technology, 2017-2022 (US$ Bn)
TABLE 48 United States Maritime Digitization Market, by Technology, 2023-2030 (US$ Bn)
TABLE 49 United States Maritime Digitization Market, by Modes of Sales, 2017-2022 (US$ Bn)
TABLE 50 United States Maritime Digitization Market, by Modes of Sales, 2023-2030 (US$ Bn)
TABLE 51 United States Maritime Digitization Market, by End User, 2017-2022 (US$ Bn)
TABLE 52 United States Maritime Digitization Market, by End User, 2023-2030 (US$ Bn)
TABLE 53 Canada Maritime Digitization Market, by Technology, 2017-2022 (US$ Bn)
TABLE 54 Canada Maritime Digitization Market, by Technology, 2023-2030 (US$ Bn)
TABLE 55 Canada Maritime Digitization Market, by Modes of Sales, 2017-2022 (US$ Bn)
TABLE 56 Canada Maritime Digitization Market, by Modes of Sales, 2023-2030 (US$ Bn)
TABLE 57 Canada Maritime Digitization Market, by End User, 2017-2022 (US$ Bn)
TABLE 58 Canada Maritime Digitization Market, by End User, 2023-2030 (US$ Bn)
TABLE 59 Mexico Maritime Digitization Market, by Technology, 2017-2022 (US$ Bn)
TABLE 60 Mexico Maritime Digitization Market, by Technology, 2023-2030 (US$ Bn)
TABLE 61 Mexico Maritime Digitization Market, by Modes of Sales, 2017-2022 (US$ Bn)
TABLE 62 Mexico Maritime Digitization Market, by Modes of Sales, 2023-2030 (US$ Bn)
TABLE 63 Mexico Maritime Digitization Market, by End User, 2017-2022 (US$ Bn)
TABLE 64 Mexico Maritime Digitization Market, by End User, 2023-2030 (US$ Bn)
TABLE 65 Europe Maritime Digitization Market, by Technology, 2017-2022 (US$ Bn)
TABLE 66 Europe Maritime Digitization Market, by Technology, 2023-2030 (US$ Bn)
TABLE 67 Europe Maritime Digitization Market, by Modes of Sales, 2017-2022 (US$ Bn)
TABLE 68 Europe Maritime Digitization Market, by Modes of Sales, 2023-2030 (US$ Bn)
TABLE 69 Europe Maritime Digitization Market, by End User, 2017-2022 (US$ Bn)
TABLE 70 Europe Maritime Digitization Market, by End User, 2023-2030 (US$ Bn)
TABLE 71 Europe Maritime Digitization Market, by Country, 2017-2022 (US$ Bn)
TABLE 72 Europe Maritime Digitization Market, by Country, 2023-2030 (US$ Bn)
TABLE 73 Germany Maritime Digitization Market, by Technology, 2017-2022 (US$ Bn)
TABLE 74 Germany Maritime Digitization Market, by Technology, 2023-2030 (US$ Bn)
TABLE 75 Germany Maritime Digitization Market, by Modes of Sales, 2017-2022 (US$ Bn)
TABLE 76 Germany Maritime Digitization Market, by Modes of Sales, 2023-2030 (US$ Bn)
TABLE 77 Germany Maritime Digitization Market, by End User, 2017-2022 (US$ Bn)
TABLE 78 Germany Maritime Digitization Market, by End User, 2023-2030 (US$ Bn)
TABLE 79 France Maritime Digitization Market, by Technology, 2017-2022 (US$ Bn)
TABLE 80 France Maritime Digitization Market, by Technology, 2023-2030 (US$ Bn)
TABLE 81 France Maritime Digitization Market, by Modes of Sales, 2017-2022 (US$ Bn)
TABLE 82 France Maritime Digitization Market, by Modes of Sales, 2023-2030 (US$ Bn)
TABLE 83 France Maritime Digitization Market, by End User, 2017-2022 (US$ Bn)
TABLE 84 France Maritime Digitization Market, by End User, 2023-2030 (US$ Bn)
TABLE 85 United Kingdom Maritime Digitization Market, by Technology, 2017-2022 (US$ Bn)
TABLE 86 United Kingdom Maritime Digitization Market, by Technology, 2023-2030 (US$ Bn)
TABLE 87 United Kingdom Maritime Digitization Market, by Modes of Sales, 2017-2022 (US$ Bn)
TABLE 88 United Kingdom Maritime Digitization Market, by Modes of Sales, 2023-2030 (US$ Bn)
TABLE 89 United Kingdom Maritime Digitization Market, by End User, 2017-2022 (US$ Bn)
TABLE 90 United Kingdom Maritime Digitization Market, by End User, 2023-2030 (US$ Bn)
TABLE 91 Italy Maritime Digitization Market, by Technology, 2017-2022 (US$ Bn)
TABLE 92 Italy Maritime Digitization Market, by Technology, 2023-2030 (US$ Bn)
TABLE 93 Italy Maritime Digitization Market, by Modes of Sales, 2017-2022 (US$ Bn)
TABLE 94 Italy Maritime Digitization Market, by Modes of Sales, 2023-2030 (US$ Bn)
TABLE 95 Italy Maritime Digitization Market, by End User, 2017-2022 (US$ Bn)
TABLE 96 Italy Maritime Digitization Market, by End User, 2023-2030 (US$ Bn)
TABLE 97 Spain Maritime Digitization Market, by Technology, 2017-2022 (US$ Bn)
TABLE 98 Spain Maritime Digitization Market, by Technology, 2023-2030 (US$ Bn)
TABLE 99 Spain Maritime Digitization Market, by Modes of Sales, 2017-2022 (US$ Bn)
TABLE 100 Spain Maritime Digitization Market, by Modes of Sales, 2023-2030 (US$ Bn)
TABLE 101 Spain Maritime Digitization Market, by End User, 2017-2022 (US$ Bn)
TABLE 102 Spain Maritime Digitization Market, by End User, 2023-2030 (US$ Bn)
TABLE 103 Rest of Europe Maritime Digitization Market, by Technology, 2017-2022 (US$ Bn)
TABLE 104 Rest of Europe Maritime Digitization Market, by Technology, 2023-2030 (US$ Bn)
TABLE 105 Rest of Europe Maritime Digitization Market, by Modes of Sales, 2017-2022 (US$ Bn)
TABLE 106 Rest of Europe Maritime Digitization Market, by Modes of Sales, 2023-2030 (US$ Bn)
TABLE 107 Rest of Europe Maritime Digitization Market, by End User, 2017-2022 (US$ Bn)
TABLE 108 Rest of Europe Maritime Digitization Market, by End User, 2023-2030 (US$ Bn)
TABLE 109 Asia Pacific Maritime Digitization Market, by Technology, 2017-2022 (US$ Bn)
TABLE 110 Asia Pacific Maritime Digitization Market, by Technology, 2023-2030 (US$ Bn)
TABLE 111 Asia Pacific Maritime Digitization Market, by Modes of Sales, 2017-2022 (US$ Bn)
TABLE 112 Asia Pacific Maritime Digitization Market, by Modes of Sales, 2023-2030 (US$ Bn)
TABLE 113 Asia Pacific Maritime Digitization Market, by End User, 2017-2022 (US$ Bn)
TABLE 114 Asia Pacific Maritime Digitization Market, by End User, 2023-2030 (US$ Bn)
TABLE 115 China Maritime Digitization Market, by Technology, 2017-2022 (US$ Bn)
TABLE 116 China Maritime Digitization Market, by Technology, 2023-2030 (US$ Bn)
TABLE 117 China Maritime Digitization Market, by Modes of Sales, 2017-2022 (US$ Bn)
TABLE 118 China Maritime Digitization Market, by Modes of Sales, 2023-2030 (US$ Bn)
TABLE 119 China Maritime Digitization Market, by End User, 2017-2022 (US$ Bn)
TABLE 120 China Maritime Digitization Market, by End User, 2023-2030 (US$ Bn)
TABLE 121 Japan Maritime Digitization Market, by Technology, 2017-2022 (US$ Bn)
TABLE 122 Japan Maritime Digitization Market, by Technology, 2023-2030 (US$ Bn)
TABLE 123 Japan Maritime Digitization Market, by Modes of Sales, 2017-2022 (US$ Bn)
TABLE 124 Japan Maritime Digitization Market, by Modes of Sales, 2023-2030 (US$ Bn)
TABLE 125 Japan Maritime Digitization Market, by End User, 2017-2022 (US$ Bn)
TABLE 126 Japan Maritime Digitization Market, by End User, 2023-2030 (US$ Bn)
TABLE 127 India Maritime Digitization Market, by Technology, 2017-2022 (US$ Bn)
TABLE 128 India Maritime Digitization Market, by Technology, 2023-2030 (US$ Bn)
TABLE 129 India Maritime Digitization Market, by Modes of Sales, 2017-2022 (US$ Bn)
TABLE 130 India Maritime Digitization Market, by Modes of Sales, 2023-2030 (US$ Bn)
TABLE 131 India Maritime Digitization Market, by End User, 2017-2022 (US$ Bn)
TABLE 132 India Maritime Digitization Market, by End User, 2023-2030 (US$ Bn)
TABLE 133 South Korea Maritime Digitization Market, by Technology, 2017-2022 (US$ Bn)
TABLE 134 South Korea Maritime Digitization Market, by Technology, 2023-2030 (US$ Bn)
TABLE 135 South Korea Maritime Digitization Market, by Modes of Sales, 2017-2022 (US$ Bn)
TABLE 136 South Korea Maritime Digitization Market, by Modes of Sales, 2023-2030 (US$ Bn)
TABLE 137 South Korea Maritime Digitization Market, by End User, 2017-2022 (US$ Bn)
TABLE 138 South Korea Maritime Digitization Market, by End User, 2023-2030 (US$ Bn)
TABLE 139 South-East Asia Maritime Digitization Market, by Technology, 2017-2022 (US$ Bn)
TABLE 140 South-East Asia Maritime Digitization Market, by Technology, 2023-2030 (US$ Bn)
TABLE 141 South-East Asia Maritime Digitization Market, by Modes of Sales, 2017-2022 (US$ Bn)
TABLE 142 South-East Asia Maritime Digitization Market, by Modes of Sales, 2023-2030 (US$ Bn)
TABLE 143 South-East Asia Maritime Digitization Market, by End User, 2017-2022 (US$ Bn)
TABLE 144 South-East Asia Maritime Digitization Market, by End User, 2023-2030 (US$ Bn)
TABLE 145 Rest of Asia Pacific Maritime Digitization Market, by Technology, 2017-2022 (US$ Bn)
TABLE 146 Rest of Asia Pacific Maritime Digitization Market, by Technology, 2023-2030 (US$ Bn)
TABLE 147 Rest of Asia Pacific Maritime Digitization Market, by Modes of Sales, 2017-2022 (US$ Bn)
TABLE 148 Rest of Asia Pacific Maritime Digitization Market, by Modes of Sales, 2023-2030 (US$ Bn)
TABLE 149 Rest of Asia Pacific Maritime Digitization Market, by End User, 2017-2022 (US$ Bn)
TABLE 150 Rest of Asia Pacific Maritime Digitization Market, by End User, 2023-2030 (US$ Bn)
TABLE 151 Latin America Maritime Digitization Market, by Technology, 2017-2022 (US$ Bn)
TABLE 152 Latin America Maritime Digitization Market, by Technology, 2023-2030 (US$ Bn)
TABLE 153 Latin America Maritime Digitization Market, by Modes of Sales, 2017-2022 (US$ Bn)
TABLE 154 Latin America Maritime Digitization Market, by Modes of Sales, 2023-2030 (US$ Bn)
TABLE 155 Latin America Maritime Digitization Market, by End User, 2017-2022 (US$ Bn)
TABLE 156 Latin America Maritime Digitization Market, by End User, 2023-2030 (US$ Bn)
TABLE 157 Brazil Maritime Digitization Market, by Technology, 2017-2022 (US$ Bn)
TABLE 158 Brazil Maritime Digitization Market, by Technology, 2023-2030 (US$ Bn)
TABLE 159 Brazil Maritime Digitization Market, by Modes of Sales, 2017-2022 (US$ Bn)
TABLE 160 Brazil Maritime Digitization Market, by Modes of Sales, 2023-2030 (US$ Bn)
TABLE 161 Brazil Maritime Digitization Market, by End User, 2017-2022 (US$ Bn)
TABLE 162 Brazil Maritime Digitization Market, by End User, 2023-2030 (US$ Bn)
TABLE 163 Argentina Maritime Digitization Market, by Technology, 2017-2022 (US$ Bn)
TABLE 164 Argentina Maritime Digitization Market, by Technology, 2023-2030 (US$ Bn)
TABLE 165 Argentina Maritime Digitization Market, by Modes of Sales, 2017-2022 (US$ Bn)
TABLE 166 Argentina Maritime Digitization Market, by Modes of Sales, 2023-2030 (US$ Bn)
TABLE 167 Argentina Maritime Digitization Market, by End User, 2017-2022 (US$ Bn)
TABLE 168 Argentina Maritime Digitization Market, by End User, 2023-2030 (US$ Bn)
TABLE 169 Rest of Latin America Maritime Digitization Market, by Technology, 2017-2022 (US$ Bn)
TABLE 170 Rest of Latin America Maritime Digitization Market, by Technology, 2023-2030 (US$ Bn)
TABLE 171 Rest of Latin America Maritime Digitization Market, by Modes of Sales, 2017-2022 (US$ Bn)
TABLE 172 Rest of Latin America Maritime Digitization Market, by Modes of Sales, 2023-2030 (US$ Bn)
TABLE 173 Rest of Latin America Maritime Digitization Market, by End User, 2017-2022 (US$ Bn)
TABLE 174 Rest of Latin America Maritime Digitization Market, by End User, 2023-2030 (US$ Bn)
TABLE 175 Middle East and Africa Maritime Digitization Market, by Technology, 2017-2022 (US$ Bn)
TABLE 176 Middle East and Africa Maritime Digitization Market, by Technology, 2023-2030 (US$ Bn)
TABLE 177 Middle East and Africa Maritime Digitization Market, by Modes of Sales, 2017-2022 (US$ Bn)
TABLE 178 Middle East and Africa Maritime Digitization Market, by Modes of Sales, 2023-2030 (US$ Bn)
TABLE 179 Middle East and Africa Maritime Digitization Market, by End User, 2017-2022 (US$ Bn)
TABLE 180 Middle East and Africa Maritime Digitization Market, by End User, 2023-2030 (US$ Bn)
TABLE 181 GCC Countries Maritime Digitization Market, by Technology, 2017-2022 (US$ Bn)
TABLE 182 GCC Countries Maritime Digitization Market, by Technology, 2023-2030 (US$ Bn)
TABLE 183 GCC Countries Maritime Digitization Market, by Modes of Sales, 2017-2022 (US$ Bn)
TABLE 184 GCC Countries Maritime Digitization Market, by Modes of Sales, 2023-2030 (US$ Bn)
TABLE 185 GCC Countries Maritime Digitization Market, by End User, 2017-2022 (US$ Bn)
TABLE 186 GCC Countries Maritime Digitization Market, by End User, 2023-2030 (US$ Bn)
TABLE 187 South Africa Maritime Digitization Market, by Technology, 2017-2022 (US$ Bn)
TABLE 188 South Africa Maritime Digitization Market, by Technology, 2023-2030 (US$ Bn)
TABLE 189 South Africa Maritime Digitization Market, by Modes of Sales, 2017-2022 (US$ Bn)
TABLE 190 South Africa Maritime Digitization Market, by Modes of Sales, 2023-2030 (US$ Bn)
TABLE 191 South Africa Maritime Digitization Market, by End User, 2017-2022 (US$ Bn)
TABLE 192 South Africa Maritime Digitization Market, by End User, 2023-2030 (US$ Bn)
TABLE 193 Rest of Middle East and Africa Maritime Digitization Market, by Technology, 2017-2022 (US$ Bn)
TABLE 194 Rest of Middle East and Africa Maritime Digitization Market, by Technology, 2023-2030 (US$ Bn)
TABLE 195 Rest of Middle East and Africa Maritime Digitization Market, by Modes of Sales, 2017-2022 (US$ Bn)
TABLE 196 Rest of Middle East and Africa Maritime Digitization Market, by Modes of Sales, 2023-2030 (US$ Bn)
TABLE 197 Rest of Middle East and Africa Maritime Digitization Market, by End User, 2017-2022 (US$ Bn)
TABLE 198 Rest of Middle East and Africa Maritime Digitization Market, by End User, 2023-2030 (US$ Bn)

Frequently Asked Questions

What is the current size of the global Maritime Digitization market?

The global Maritime Digitization market was valued at USD 158.1 Billion in 2022.

What is the expected growth rate of the Maritime Digitization market between 2023 and 2030?

The Maritime Digitization market is expected to grow at a CAGR of 9.50% between 2023 and 2030, reaching USD 298.42 Billion in 2030.

Which segment is leading the market share in terms of technology?

IoT is the leading segment by technology, holding over 41% share in value in 2022.

Which application segment governs the demand for Maritime Digitization in the world?

The Fleet Management segment governs the demand for Maritime Digitization worldwide, holding a massive share in 2022.

Which segment is expected to post the highest CAGR during the forecast period?

The Maritime Freight Forwarders segment will post the highest CAGR during the projected period.

Which region is fuelling the growth of the Maritime Digitization industry?

North America is aiding the growth of the Maritime Digitization industry, with over two-fifths share in 2022.

Who are the major players in the global Maritime Digitization market?

The top players include Lockheed Martin Corporation, ORBCOMM, Perle, Windward Ltd., MariApps Marine Solutions, Spire Global, Inc., Iridium Communications Inc., SparkCognition, xyzt.ai, Inmarsat Global Limited.

What are the major market drivers of the Maritime Digitization industry?

The growing investments and rising adoption of new technologies are the key Maritime Digitization market drivers.

What are the major market restraints of the Maritime Digitization industry?

High cost and stringent regulations are the major market restraints.

What are the major market opportunities of the Maritime Digitization industry?

The growing adoption in Europe and technological advancements are creating potential opportunities to surge the market growth.

EDiscovery Market

Published:
Report ID: 4744

Simulation Software Market

Published:
Report ID: 36908

Bioinformatics Market

Published:
Report ID: 14530

Fish Hook Sensor Market

Published:
Report ID: 36774

Big Data Services Market

Published:
Report ID: 3020

Enterprise Asset Management Market

Published:
Report ID: 5338

South Korea Wifi Chipset Market

Published:
Report ID: 36535

Saudi Arabia Managed Security Services Market

Published:
Report ID: 36393

Microwave Oven Market

Published:
Report ID: 36314

Artificial Intelligence in Supply Chain Market

Published:
Report ID: 36184

China Wifi Chipset Market

Published:
Report ID: 35900

Purchase Options

$2999
Delivery Format: Excel.
$4999
Designed for the individual purchaser.
$6999
Users located at a single corporate site or regional office.
$7999
Allowed for unlimited sharing globally within one company.
Smallform of Sample request

Have a question?

User Profile

Don’t settle for less – trust Mitul to help you find the best solution.

Report delivery within 24 to 48 hours

– Other Info –

What people say?-

User Review

I am very impressed with the information in this report. The author clearly did their research when they came up with this product and it has already given me a lot of ideas.

Jana Schmidt
CEDAR CX Technologies

– Connect with us –

Phone

+91 6232 49 3207


support

24/7 Research Support


sales@credenceresearch.com

– Research Methodology –

Going beyond the basics: advanced techniques in research methodology

– Trusted By –

Pepshi, LG, Nestle
Motorola, Honeywell, Johnson and johnson
LG Chem, SIEMENS, Pfizer
Unilever, Samsonite, QIAGEN