
Market Overview
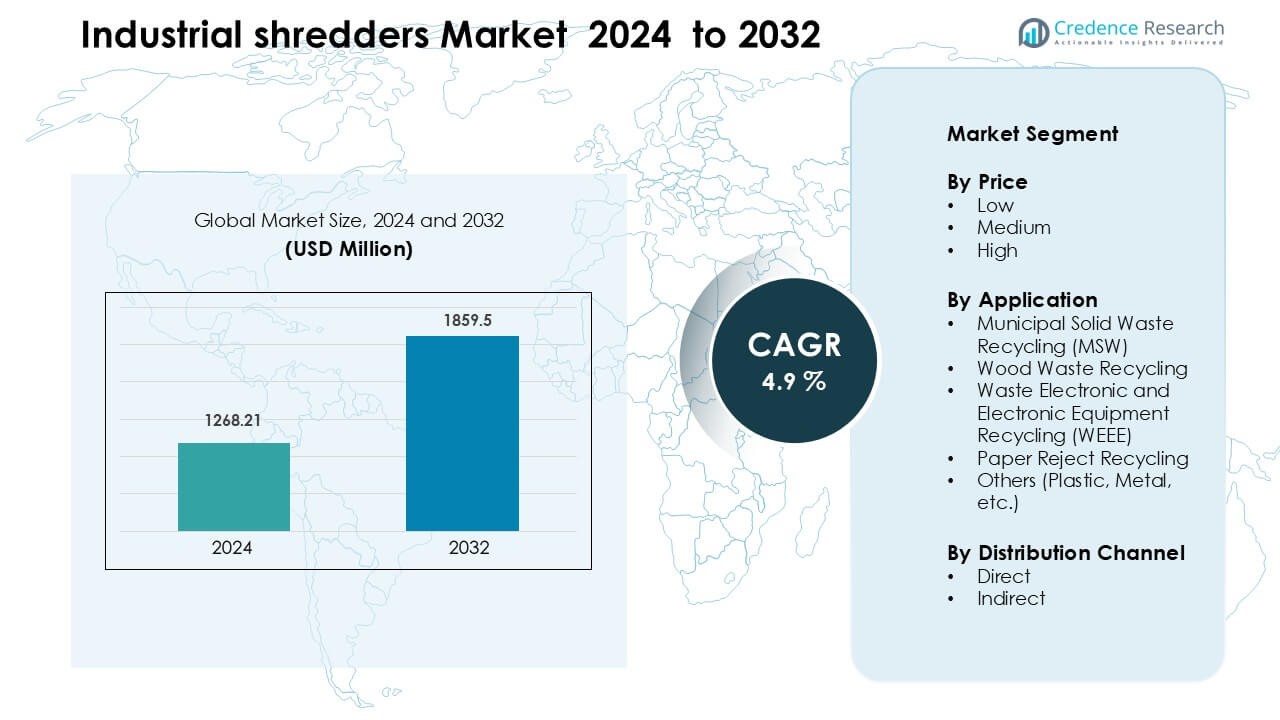
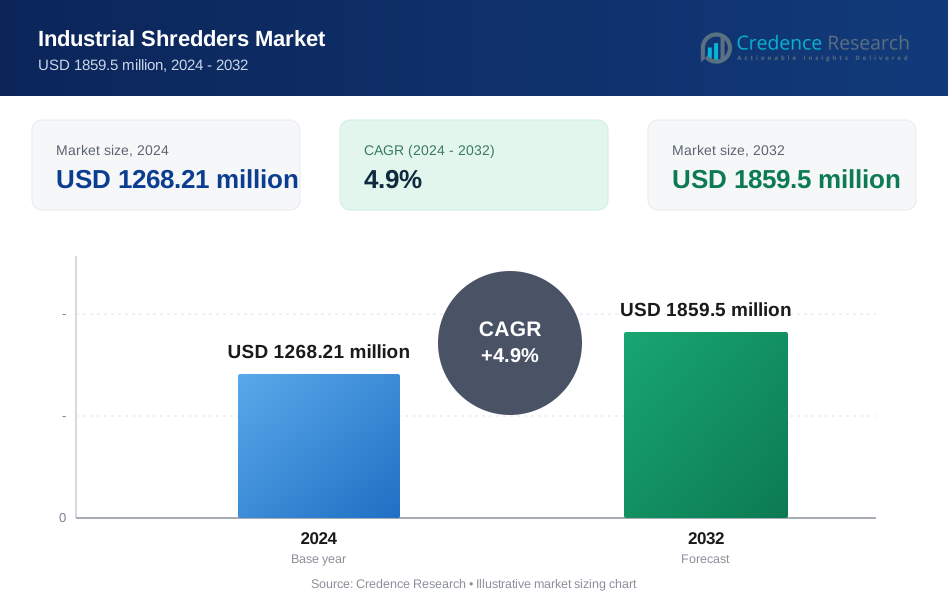
Industrial Shredders Market was valued at USD 1268.21 million in 2024 and is anticipated to reach USD 1859.5 million by 2032, growing at a CAGR of 4.9% during the forecast period.
| REPORT ATTRIBUTE | DETAILS |
|---|---|
| Historical Period | 2020-2023 |
| Base Year | 2024 |
| Forecast Period | 2025-2032 |
| Industrial Shredders Market Size 2024 | USD 1268.21 Million |
| Industrial Shredders Market, CAGR | 4.9% |
| Industrial Shredders Market Size 2032 | USD 1859.5 Million |
The Industrial Shredders Market is shaped by leading companies such as WEIMA Group GmbH & Co. KG, UNTHA shredding technology GmbH, Harden Machinery Ltd., Jordan Reduction Solutions, Vecoplan AG, Genox Recycling Tech Co., Ltd., Forrec SRL Recycling Systems, SSI Shredding Systems, Inc., Lindner-Recyclingtech GmbH, and Global Development and Global CG Group. These manufacturers compete by offering high-torque, multi-material shredders supported by automation, durable cutter systems, and advanced safety features. North America emerges as the leading region with a 34% market share in 2024, driven by strong recycling infrastructure, strict waste regulations, and steady industrial investment.
Market Insights
- The Industrial Shredders Market reached strong demand at USD 1268.21 million in 2024 and continues to grow steadily toward USD 1859.5 million by 2032 at a consistent CAGR of 4.9%. supported by rising waste processing needs and recycling expansion across major industries.
- Growth is driven by higher volumes of MSW, plastics, metals, and WEEE, which increases adoption of high-torque shredders in municipal waste facilities and industrial plants.
- Key trends include wider use of automated, low-speed shredders, integration of IoT monitoring, and rising investment in multi-material processing lines that improve recovery efficiency.
- The market remains competitive, with players such as WEIMA, UNTHA, Vecoplan, Genox, and SSI focusing on durable cutter systems, energy-efficient drives, and modular configurations, while pricing pressure and high maintenance needs act as key restraints.
- North America leads with 34% share in 2024, followed by Europe and Asia-Pacific, while the MSW segment holds the largest share among applications due to expanding city-level recycling infrastructure.
Market Segmentation Analysis:
By Price
Low-priced industrial shredders lead this segment with about 47% share in 2024. Buyers in small recycling units and local waste processors choose low-priced models because these machines offer basic throughput, lower maintenance needs, and simple installation. Demand grows as small firms expand material recovery capacity with limited budgets. Medium-priced shredders gain steady traction due to better durability and higher torque output. High-priced shredders serve heavy industries that need continuous duty cycles, advanced control panels, and multi-material shredding for higher operational efficiency.
- For instance, Namibind’s dual‑shaft plastic waste shredder (model PWS‑1000) can process up to 200 kg/hour of plastic with a 10 HP motor.
By Application
Municipal Solid Waste Recycling (MSW) dominates this segment with nearly 41% share in 2024. Cities adopt high-capacity shredders to manage rising waste volumes and support modern material recovery facilities. Growth rises as governments invest in smart waste management systems that require bulk waste preprocessing. Wood waste recycling expands with rising demand for biomass fuel and wood-based panels. WEEE recycling grows due to stricter rules on electronics disposal, while paper reject and other materials like plastic and metal gain momentum through stronger circular economy policies.
- For instance, MBA Polymers’ facility in Mauna (Germany) is designed to process 17,500 tonnes per year of WEEE to recover high-quality.
By Distribution Channel
Direct sales hold the leading position with about 56% share in 2024. Manufacturers prefer direct distribution because it allows customized machine configuration, faster service support, and stronger client relationships in heavy industries. Buyers choose direct procurement to ensure better warranty terms and access to specialized installation teams. Indirect channels, including dealers and equipment distributors, maintain demand among small and mid-scale recyclers that need quick delivery and standard models. Growth in indirect channels also improves as regional distributors strengthen after-sales networks.
Key Growth Drivers
Rising Waste Generation and Recycling Mandates
Global waste volumes rise each year due to rapid urban expansion, higher consumption, and industrial output. Governments enforce strict recycling rules to reduce landfill pressure and meet environmental targets, which pushes municipalities and private recyclers to adopt high-capacity shredders. Industrial shredders help convert municipal, electronic, plastic, and wood waste into uniform fractions that support material recovery, energy production, and safe disposal. Growing investment in smart waste infrastructure strengthens this momentum, as preprocessing becomes essential for automated sorting lines. Continuous upgrades in waste management policies across Asia, Europe, and North America further accelerate the demand for shredding systems.
- For instance, Komptech’s Terminator e‑mobile 5000 (electric model) can shred up to 60 t/h while running on a 200 kW motor and producing zero local exhaust emissions.
Expansion of Circular Economy and Resource Recovery Systems
Countries accelerate circular economy frameworks that promote material reuse in manufacturing, packaging, and construction. Shredders play a central role by breaking down waste streams into reusable forms that feed recycling plants, biomass facilities, and secondary metal processors. Rising demand for recycled plastics, reclaimed metals, and processed wood fuels adoption of multi-material shredders with higher torque output. Companies focus on lowering virgin material dependence, which increases the need for efficient size-reduction technologies. Industrial buyers also invest in shredders to meet ESG goals, reduce carbon footprints, and improve waste valorization rates across their production cycles.
- For instance, Vecoplan's VAZ 2500 single-shaft shredder (with a rotor length of 2,490 mm) can process up to a maximum of 25,000 kg/h of certain materials under ideal conditions.
Growth of Heavy Industrial Sectors and Automation Adoption
Industries such as automotive, metals, chemicals, and construction generate large volumes of scrap that require safe, continuous shredding. Manufacturers adopt automated shredding lines to improve workplace safety, reduce manual handling, and increase operational efficiency. High-capacity shredders support bulk processing of metals, composites, and production rejects, helping plants reduce disposal costs while recovering valuable materials. Rising industrial automation boosts demand for shredders with digital monitoring, overload protection, remote diagnostics, and optimized power usage. As factories modernize processing lines, integrated shredding modules become a standard component in large-scale recycling and scrap management systems.
Key Trends and Opportunities
Shift Toward High-Torque, Low-Speed Shredders
Industries increasingly prefer high-torque, low-speed machines because they offer stable performance, reduced noise, and higher material handling flexibility. These shredders process metals, electronics, plastic pallets, and bulky waste without causing excess wear or overheating. The trend creates strong opportunities for manufacturers offering dual-shaft and quad-shaft configurations with automated controls. Rising demand for equipment that handles mixed waste streams encourages adoption of modular shredders that allow quick rotor or cutter changes. By supporting heavy-duty tasks with lower energy use, these machines align with sustainability priorities and unlock new markets in WEEE, metal recycling, and construction debris processing.
- For instance, Komptech’s Terminator direct stationary shredder has a drum speed as low as 14 rpm, yet handles up to 75 t/h of mixed waste.
Automation, IoT Integration, and Smart Monitoring
Manufacturers introduce shredders with real-time diagnostics, predictive maintenance, and automated feed control. IoT sensors help operators optimize load distribution, avoid blockages, and reduce downtime, which appeals to large recycling plants seeking continuous operation. Opportunities grow for systems that integrate directly with sorting lines, conveyor belts, and balers to create end-to-end processing units. AI-enabled monitoring supports safer handling of hazardous materials and improves recovery yields. Smart shredding lines attract buyers in regions upgrading their waste infrastructure and create new revenue potential for companies offering subscription-based maintenance and remote monitoring services.
- For instance, Vecoplan’s VAZ single-shaft shredders (rotor lengths 1,300–2,100 mm) are equipped with VSC.control and cloud‑connectivity, enabling operators to continuously monitor parameters like power draw, rotor speed, and load via VSC.connect.
Rising Demand for Metal and Plastic Recycling Technologies
Global industries seek substitutes for virgin materials due to rising raw material costs and sustainability targets. This trend boosts investments in shredders capable of processing metal scrap, rigid plastics, and composite waste. Opportunities expand as recyclers upgrade to heavy-duty machines with reinforced cutters and intelligent power management. Growth in automotive dismantling, e-waste collection, and plastic pellet production encourages adoption of advanced shredders that deliver consistent particle size. Manufacturers offering versatile, multi-material solutions gain a competitive edge in markets where recycling rates remain low but policies strengthen rapidly.
Key Challenges
High Capital Costs and Maintenance Burden
Industrial shredders require strong build quality, heavy-duty cutters, and large drive systems, which raises upfront investment. Many small recyclers struggle to adopt high-capacity models because of limited budgets and long payback periods. Ongoing maintenance adds additional costs due to blade replacements, gearbox servicing, and downtime expenses. Harsh operating conditions accelerate wear, especially when processing metals or mixed waste. These factors slow adoption in price-sensitive markets and make financing a major hurdle. Manufacturers face pressure to offer modular, cost-efficient solutions that balance durability with affordability.
Handling Mixed and Hazardous Waste Streams
Shredding mixed waste streams poses safety, performance, and compliance challenges. Materials like lithium-ion batteries, pressurized cylinders, solvents, or electronics can ignite, corrode components, or damage cutting systems. Operators need proper screening systems and advanced safety controls, which raise system complexity and operational costs. Variability in incoming waste reduces processing efficiency and increases the risk of equipment overload. Meeting global safety regulations also requires robust enclosures, fire suppression systems, and explosion-proof designs. These challenges push manufacturers to redesign machines for safer operation while adding technical complexity for recyclers.
Regional Analysis
North America
North America leads the Industrial Shredders Market with about 34% share in 2024. Demand rises as recycling targets strengthen across the U.S. and Canada, driven by landfill reduction policies and high investment in material recovery facilities. Municipal waste processors and private recyclers expand capacity for MSW, WEEE, plastics, and metal scrap, supporting wider adoption of high-torque shredders. Strong industrial sectors such as automotive dismantling, construction, and packaging further boost equipment upgrades. Advanced automation, IoT monitoring systems, and stricter environmental compliance continue to push steady market growth across the region.
Europe
Europe holds nearly 29% share in the Industrial Shredders Market in 2024. Strict circular economy laws, high recycling quotas, and the EU’s focus on WEEE, plastic reduction, and metal recovery drive strong adoption. Germany, France, Italy, and the U.K. invest in advanced shredding systems to support closed-loop supply chains and meet carbon-neutral goals. Demand strengthens in biomass processing, construction debris management, and industrial scrap handling. Manufacturers benefit from strong incentives for energy-efficient machinery, while large waste management firms expand multi-material shredding lines to improve recovery quality.
Asia-Pacific
Asia-Pacific accounts for about 28% share in 2024 and remains the fastest-growing region. Rapid urbanization, rising solid waste volumes, and expanding manufacturing sectors in China, India, Japan, and Southeast Asia increase demand for high-capacity shredders. Governments promote modern recycling infrastructure under sustainability and waste-reduction programs, especially for plastics, metals, and e-waste. Industrial plants upgrade scrap management systems to reduce disposal costs and support resource recovery. Growth accelerates as regional recyclers adopt automated shredding lines with better throughput and durability to handle diverse and high-volume waste streams.
Latin America
Latin America holds nearly 6% share in the Industrial Shredders Market in 2024. Growth accelerates as countries like Brazil, Mexico, and Chile invest in upgrading municipal recycling systems and improving industrial waste processing. Rising construction activity, growing metal recycling networks, and increasing plastic recovery efforts support broader adoption. Budget constraints push demand for low and medium-priced shredders, while large recyclers begin integrating higher-torque models for mixed waste and electronics. Government programs promoting landfill diversion help improve market penetration across urban centers.
Middle East & Africa
Middle East & Africa capture about 3% share in 2024 but show steady long-term potential. GCC nations invest in waste-to-energy plants, recycling parks, and construction debris processing, creating opportunities for heavy-duty shredders. Industrial facilities in the UAE, Saudi Arabia, and South Africa adopt shredding systems to manage metal scrap, packaging waste, and production rejects. Expansion of smart city projects and sustainability initiatives boosts interest in automated machines. However, limited recycling infrastructure in several countries slows widespread adoption, keeping the region in an emerging but growing stage.
Market Segmentations
By Price
- Low
- Medium
- High
By Application
- Municipal Solid Waste Recycling (MSW)
- Wood Waste Recycling
- Waste Electronic and Electronic Equipment Recycling (WEEE)
- Paper Reject Recycling
- Others (Plastic, Metal, etc.)
By Distribution Channel
- Direct
- Indirect
By Geography
- North America
- U.S.
- Canada
- Mexico
- Europe
- Germany
- France
- U.K.
- Italy
- Spain
- Rest of Europe
- Asia Pacific
- China
- Japan
- India
- South Korea
- South-east Asia
- Rest of Asia Pacific
- Latin America
- Brazil
- Argentina
- Rest of Latin America
- Middle East & Africa
- GCC Countries
- South Africa
- Rest of the Middle East and Africa
Competitive Landscape
The Industrial Shredders Market features strong competition among global manufacturers such as WEIMA Group GmbH & Co. KG, UNTHA shredding technology GmbH, Harden Machinery Ltd., Jordan Reduction Solutions, Vecoplan AG, Genox Recycling Tech Co., Ltd., Forrec SRL Recycling Systems, SSI Shredding Systems, Inc., Lindner-Recyclingtech GmbH, and Global Development and Global CG Group. These companies expand their presence through advanced shredders designed for MSW, WEEE, plastics, wood, and metal scrap processing. Manufacturers focus on higher torque output, low-speed technology, improved cutter durability, and automation capabilities to meet rising demand for efficient waste reduction. Many players integrate IoT monitoring, predictive maintenance, and energy-efficient drives to strengthen product value. Strategic moves such as capacity expansions, dealership network growth, and partnerships with recycling plants help extend market reach. Competition intensifies as companies innovate modular shredding lines that offer flexibility, lower operating costs, and compatibility with modern material recovery systems.
Key Player Analysis
- WEIMA Group GmbH & Co. KG
- UNTHA shredding technology GmbH
- Harden Machinery Ltd.
- Jordan Reduction Solutions
- Vecoplan AG
- Genox Recycling Tech Co., Ltd.
- Forrec SRL Recycling Systems
- SSI Shredding Systems, Inc.
- Lindner-Recyclingtech GmbH
- Global Development and Global CG Group
Recent Developments
- In October 2025, UNTHA appointed Sun Earth Co., Ltd. (Japan) as its official regional sales and service partner, expanding its presence in the Japanese market for shredders and recycling solutions.
- In July 2025, WEIMA Group GmbH & Co. KG launched the new W5.22 single-shaft shredder for plastics plus the revised C.200 Duo dewatering press and introduced the WE.connect digital service platform.
Report Coverage
The research report offers an in-depth analysis based on Price, Application, Distribution Channel and Geography. It details leading market players, providing an overview of their business, product offerings, investments, revenue streams, and key applications. Additionally, the report includes insights into the competitive environment, SWOT analysis, current market trends, as well as the primary drivers and constraints. Furthermore, it discusses various factors that have driven market expansion in recent years. The report also explores market dynamics, regulatory scenarios, and technological advancements that are shaping the industry. It assesses the impact of external factors and global economic changes on market growth. Lastly, it provides strategic recommendations for new entrants and established companies to navigate the complexities of the market.
Future Outlook
- Industrial shredders will see faster adoption as waste volumes rise across cities and industries.
- Automation and IoT-enabled monitoring will become standard features in next-generation shredding systems.
- Demand for high-torque, low-speed shredders will increase as recyclers handle more mixed and bulky waste.
- Growth in WEEE recycling will push manufacturers to design safer and more precise shredding solutions.
- Energy-efficient drives and intelligent power control will shape future machine development.
- Modular shredding lines will gain traction as buyers seek flexible and scalable waste-processing setups.
- Metal, plastic, and wood recycling sectors will drive strong demand for heavy-duty shredders.
- Manufacturers will expand service networks and predictive maintenance programs to reduce operational downtime.
- Circular economy policies will strengthen investment in recycling infrastructure across developing regions.
- Partnerships between equipment makers and waste management firms will grow to support integrated processing systems.
Request a Free Sample
Fill in your details and we'll send you a free sample report.
- Sample data tables & charts
- Research methodology
Need a Custom Version of This Report?
Tailor the scope, geography, or segments to your exact requirements.
- Custom geography or segment scope
- Direct access to our analyst team
Frequently Asked Questions
What is the current market size for Industrial Shredders Market, and what is its projected size in 2032?
At what Compound Annual Growth Rate is Industrial Shredders Market projected to grow between 2025 and 2032?
Which Industrial Shredders Market segment held the largest share in 2024?
What are the primary factors fueling the growth of Industrial Shredders Market?
Who are the leading companies in Industrial Shredders Market?
Which region commanded the largest share of Industrial Shredders Market?
Table of Content
Chapter 1. Report Introduction
- 1.1 Report Description & Purpose
- 1.1.1 Report Title & Market Definition
- 1.1.2 Unique Selling Propositions (USP) & Key Differentiators
- 1.1.3 Value Proposition for Stakeholders
- 1.2 Research Objectives
- 1.2.1 Market Sizing Objectives (Volume & Revenue)
- 1.2.2 Segmentation Objectives
- 1.2.3 Competitive Intelligence Objectives
- 1.2.4 Forecast & Scenario Objectives
- 1.3 Report Scope
- 1.3.1 Industrial Shredders Scope – Types & Subtypes Covered
- 1.3.2 Geographic Scope – Regions & Countries Covered
- 1.3.3 Historical Period, Base Year & Forecast Period (2024; forecast to 2032)
- 1.3.4 Inclusions & Exclusions
- 1.4 HS Code & Classification Framework
- 1.5 Currency, Units & Pricing Basis
- 1.6 Target Stakeholders
- 1.7 Limitations & Assumptions
Chapter 2. Executive Summary
- 2.1 Global Industrial Shredders Market Snapshot
- 2.1.1 Market Size – Historical (2024) & Forecast (2024-2032) (2024: USD 1268.21 million → 2032: USD 1859.5 million)
- 2.1.2 Volume & Revenue – Global Totals
- 2.1.3 Key Market Highlights – Top Five Facts
- 2.2 Industrial Shredders Market Segmentation Snapshot
- 2.2.1 Market Split by Region – 2024 vs. 2032
- 2.3 Competitive Snapshot
- 2.3.1 Top 10 Players by Revenue Share – 2024
- 2.3.2 Top 10 Players by Volume Share – 2024
- 2.3.3 Recent Strategic Developments (18-Month Summary)
- 2.4 Key Investment Highlights & Strategic Conclusions
Chapter 3. Industrial Shredders Market Dynamics & Industry Analysis
- 3.1 Market Overview & Context
- 3.1.1 Industrial Shredders Market Position in the Broader Automotive Value Chain
- 3.1.2 OEM vs. Replacement Market Dynamics
- 3.1.3 Market Maturity & Development Stage by Region
- 3.2 Industrial Shredders Market Drivers
- 3.3 Industrial Shredders Market Restraints & Challenges
- 3.4 Industrial Shredders Market Opportunities
- 3.5 Porter's Five Forces Analysis
- 3.5.1 Threat of New Entrants
- 3.5.2 Bargaining Power of Suppliers
- 3.5.3 Bargaining Power of Buyers
- 3.5.4 Threat of Substitutes
- 3.5.5 Competitive Rivalry – Intensity Assessment
- 3.6 Industrial Shredders Value Chain Analysis
- 3.6.1 Upstream – Raw Material/Input Suppliers
- 3.6.1.1 Raw Material/Input 1
- 3.6.1.2 Raw Material/Input 2
- 3.6.1.3 Raw Material/Input 3
- 3.6.2 Midstream – Production/Manufacturing/Service Delivery
- 3.6.2.1 Production/Process Overview
- 3.6.2.2 Key Facility Locations & Capacity by Manufacturer
- 3.6.3 Downstream – Distribution & End Consumer
- 3.6.3.1 Primary Channel – B2B/OEM
- 3.6.3.2 Secondary Channels – Dealer, Retail, Online, Direct
- 3.6.4 Value Chain Profitability Analysis
- 3.6.1 Upstream – Raw Material/Input Suppliers
- 3.7 PESTEL Analysis
- 3.7.1 Political Factors
- 3.7.2 Economic Factors
- 3.7.3 Social Factors
- 3.7.4 Technological Factors
- 3.7.5 Environmental Factors
- 3.7.6 Legal Factors
- 3.8 Industrial Shredders Supply Chain Analysis
- 3.8.1 Raw Material/Input Supply Risk Assessment
- 3.8.2 Manufacturing Concentration Risk (Geographic Exposure)
- 3.8.3 Trade Disruption Impact Analysis
- 3.9 Regulatory & Policy Landscape
Note: The regulatory and policy landscape section covers regulations based on their applicability to the market, Industrial Shredders category, geography, and scope of the study. Only regulatory frameworks with a material impact on operations, compliance, trade, sustainability, or market access are analyzed in detail.
Chapter 4. Key Investment Pockets & Opportunity Analysis
- 4.1 Industrial Shredders Market Attractiveness Analysis
- 4.1.1 By Region – Investment Attractiveness Matrix (Volume × CAGR)
- 4.2 Absolute Revenue Growth Opportunity
- 4.2.1 By Region – Absolute USD Growth Through 2032
- 4.3 Incremental Volume Opportunity
- 4.3.1 By Region – Incremental Volume Through 2032
- 4.3.2 Segment – Incremental Volume
- 4.4 Emerging Submarket Opportunity Deep Dive (Subject to Applicability)
- 4.5 Emerging Market Opportunity Scorecards
- 4.5.1 United States
- 4.5.2 Europe
- 4.5.3 Asia
- 4.5.4 Middle East & Africa
Note: Emerging Market Opportunity Scorecards will be included based on relevance and strategic importance. Regions listed are indicative and may vary depending on data availability and market dynamics.
Chapter 5. Industrial Shredders Import-Export Analysis & Trade Flows
- 5.1 Global Trade Overview
- 5.1.1 Global Export Value by Country (2024)
- 5.1.2 Global Export Volume by Country (2024)
- 5.1.3 Global Import Value by Country (2024)
- 5.1.4 Global Import Volume by Country (2024)
- 5.1.5 Net Trade Balance by Country (2024)
- 5.2 Export Analysis – Segment
- 5.2.1 Type 1 (HS Code)
- 5.2.2 Type 2 (HS Code)
- 5.2.3 Type 3 (HS Code)
- 5.2.4 Type 4 (HS Code)
- 5.2.5 Type 5 (HS Code)
- 5.3 Import Analysis – Segment
- 5.3.1 Type 1 (HS Code)
- 5.3.2 Type 2 (HS Code)
- 5.3.3 Type 3 (HS Code)
- 5.3.4 Type 4 (HS Code)
- 5.3.5 Type 5 (HS Code)
- 5.4 Average Unit Trade Prices
- 5.4.1 Average Export Price – Segment & Country
- 5.4.2 Average Import Price – Segment & Source Country
- 5.4.3 Price Trends (2024)
- 5.5 Key Trade Route Analysis
- 5.5.1 Trade Route 1
- 5.5.2 Trade Route 2
- 5.5.3 Trade Route 3
- 5.5.4 Trade Route 4
- 5.5.5 Trade Route 5
- 5.6 Trade Policy Impact Assessment
- 5.6.1 US Anti-Dumping & Section 301 Tariffs
- 5.6.2 EU Customs Union Impact
- 5.6.3 Major Free Trade Agreements
- 5.6.4 USMCA Rules of Origin
Note: Trade policy analysis will be included only where relevant to the Industrial Shredders market.
Chapter 6. Competitive Landscape & Company Benchmarking
- 6.1 Industrial Shredders Market Concentration & Structure
- 6.1.1 Herfindahl-Hirschman Index (HHI) – vs. 2024
- 6.1.2 Tier 1, Tier 2 & Tier 3 Market Structure
- 6.1.3 Global, Regional & Local Player Dynamics
- 6.2 Industrial Shredders Market Share Analysis – 2024
- 6.2.1 Global Revenue Share by Company
- 6.2.2 Global Volume Share by Company
- 6.2.3 Regional Revenue Share
- 6.2.4 Market Share Evolution ( vs. 2024)
- 6.2.5 OEM Segment Share by Company
- 6.2.6 Replacement Segment Share by Company
- 6.3 Production/Delivery Capacity & Facility Analysis
- 6.3.1 Global Installed Capacity
- 6.3.2 Capacity Utilization Rates
- 6.3.3 Production/Output Volume
- 6.3.4 Facility Locations & Capacity Map
- 6.3.5 Planned Capacity Additions
- 6.4 Industrial Shredders Competitive Benchmarking Matrix
- 6.4.1 Revenue, Volume, CAGR & Profitability Comparison
- 6.4.2 Channel Revenue Mix
- 6.4.3 Geographic Revenue Exposure
- 6.4.4 R&D Intensity
- 6.4.5 Sustainability Maturity
- 6.5 Strategic Developments in Industrial Shredders (Last 24 Months)
- 6.5.1 Mergers, Acquisitions & Divestments
- 6.5.2 New Industrial Shredders Launches
- 6.5.3 Facility Expansions
- 6.5.4 Strategic Alliances, Joint Ventures & Partnerships
- 6.5.5 Distribution Expansion & Market Entry
- 6.5.6 Sustainability & ESG Initiatives
- 6.6 Competitive Strategy Mapping
- 6.6.1 Leader, Challenger, Follower & Niche Classification
- 6.6.2 Pricing Strategy Comparison
- 6.6.3 Channel Strategy Matrix
Note: Strategic developments are included based on their materiality and the availability of reliable information.
Chapter 7. Global Industrial Shredders Market – By Distribution Channel
- 7.1 Segment Overview
- 7.1.1 Volume & Revenue Split by Channel (2024 & 2032)
- 7.1.2 Channel Mix Evolution (2024-2032)
Chapter 8. Regional Market Analysis – Global Overview
- 8.1 Global Regional Overview
- 8.1.1 Regional Volume Share
- 8.1.2 Regional Revenue Share
- 8.1.3 Regional Volume by Region
- 8.1.4 Regional Revenue by Region
- 8.1.5 Regional Forecast Through 2032
- 8.2 Cross-Regional Segment Analysis
- 8.2.1 By Distribution Channel
- 8.2.2 By Brand/Price Tier
Chapter 9. North America Industrial Shredders Market
- 9.1 United States
- 9.2 Canada
- 9.3 Mexico
Chapter 10. Europe Industrial Shredders Market
- 10.1 Germany
- 10.2 France
- 10.3 Italy
- 10.4 United Kingdom
- 10.5 Spain
- 10.6 Poland
- 10.7 Russia
- 10.8 Netherlands
- 10.9 Belgium
- 10.10 Sweden
- 10.11 Denmark
- 10.12 Norway
- 10.13 Rest of Europe
Chapter 11. Asia Pacific Industrial Shredders Market
- 11.1 China
- 11.2 India
- 11.3 Japan
- 11.4 South Korea
- 11.5 Thailand
- 11.6 Indonesia
- 11.7 Vietnam
- 11.8 Malaysia
- 11.9 Australia
- 11.10 Rest of Asia Pacific
Chapter 12. Latin America Industrial Shredders Market
- 12.1 Brazil
- 12.2 Argentina
- 12.3 Colombia
- 12.4 Chile
- 12.5 Rest of Latin America
Chapter 13. Middle East Industrial Shredders Market
- 13.1 Saudi Arabia
- 13.2 United Arab Emirates
- 13.3 Turkey
- 13.4 Israel
- 13.5 Iran
- 13.6 Rest of the Middle East
Chapter 14. Africa Industrial Shredders Market
- 14.1 South Africa
- 14.2 Egypt
- 14.3 Nigeria
- 14.4 Morocco
- 14.5 Rest of Africa
Chapter 15. Industrial Shredders Company Profiles
- 15.1 [Company 01]
- 15.1.1 Company Overview
- 15.1.2 Key Management Personnel
- 15.1.3 Products & Services Portfolio
- 15.1.4 Financial Performance
- 15.1.5 Key Market Focus & Geographic Presence
- 15.1.6 Recent Developments & Strategic Initiatives
Note: The company profile list is preliminary and may change based on research findings, market developments, data availability, and client requirements.
Chapter 16. Appendices
- Appendix A – List of Abbreviations & Acronyms
- Appendix B – Industry Classification Code Reference – Full Series
- Appendix C – Production & Capacity Data Tables
- Appendix D – End-Use & Demand Base Tables
- Appendix E – Consumption & Replacement Rate Assumptions
- Appendix F – ASP Reference Tables
- Appendix G – Manufacturing & Facility Database
- Appendix H – Import-Export Data Tables
- Appendix I – Regulatory Summary Tables
- Appendix J – Primary Research Participant List (Anonymized)
- Appendix K – Primary Research Questionnaire Framework
- Appendix L – Data Sources & Bibliography
- Appendix M – Market Size Divergence & Source Comparison
Chapter 17. Research Methodology
- 17.1 Research Framework & Philosophy
- 17.2 Secondary Research – Sources, Hierarchy & Data Extraction
- 17.3 Data Modeling – Bottom-Up & Top-Down Market Sizing
- 17.4 Primary Research – Stakeholder Framework, LOI & Sample Sizes
- 17.5 Forecast Methodology – Regression, Scenario & Sensitivity Analysis
- 17.6 Quality Control – Four-Layer Validation Framework
- 17.7 Limitations & Standard Assumptions
- 17.8 Disclaimer
