
Market Overview
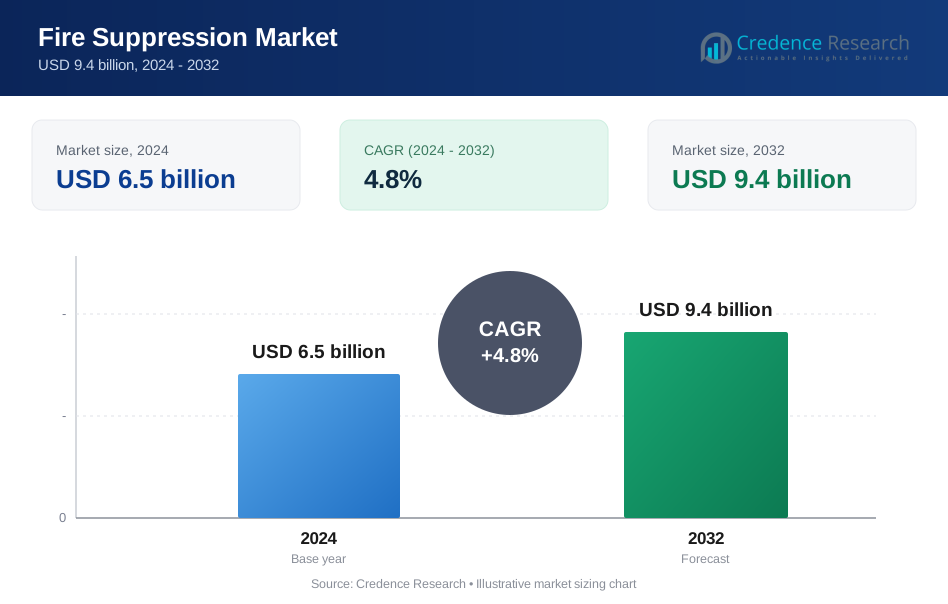
Fire Suppression Market size was valued at USD 6.5 billion in 2024 and is anticipated to reach USD 9.4 billion by 2032, at a CAGR of 4.8% during the forecast period.
| REPORT ATTRIBUTE | DETAILS |
|---|---|
| Historical Period | 2020-2023 |
| Base Year | 2024 |
| Forecast Period | 2025-2032 |
| Fire Suppression Market Size 2024 | USD 6.5 billion |
| Fire Suppression Market, CAGR | 4.8% |
| Fire Suppression Market Size 2032 | USD 9.4 billion |
The Fire Suppression market grows with strict regulatory enforcement, rising urban infrastructure, and increased awareness of fire safety. Industrial facilities, data centers, and commercial buildings demand advanced systems to protect assets and meet compliance. Smart suppression technologies with real-time monitoring gain popularity. Clean agent systems replace older methods in sensitive environments. Hybrid and modular systems support varied applications across sectors. These trends position the market for steady growth across developed and emerging regions.
North America leads the Fire Suppression market due to strict safety regulations and high infrastructure investment. Europe follows with strong adoption in industrial and public facilities, driven by regulatory standards. Asia-Pacific shows rapid growth, supported by urbanization and rising construction activity. Latin America and the Middle East & Africa expand steadily with ongoing infrastructure upgrades. Key players operating across these regions include Johnson Controls, Siemens AG, Honeywell International Inc., and NAFFCO, offering tailored solutions for commercial, industrial, and residential applications.

Market Insights
- The Fire Suppression market was valued at USD 6.5 billion in 2024 and is projected to reach USD 9.4 billion by 2032, growing at a CAGR of 4.8%.
- Regulatory pressure and increasing fire safety awareness across industries drive consistent adoption of suppression systems.
- Clean agent and hybrid systems gain traction in data centers, industrial zones, and energy facilities for targeted protection.
- Leading players focus on smart technologies, IoT integration, and long-term service contracts to secure competitive advantage.
- High installation and maintenance costs limit adoption across cost-sensitive sectors and low-budget infrastructure projects.
- North America leads with advanced installations, while Asia-Pacific grows through construction activity and new code enforcement.
- Market growth depends on regional compliance standards, industrial expansion, and the need for modular fire safety solutions.
Market Drivers
Rising Global Fire Safety Regulations and Compliance Requirements in Industrial and Commercial Spaces
Governments enforce stricter fire safety standards across manufacturing, oil & gas, power, and commercial sectors. Regulatory frameworks like NFPA codes and international building standards drive adoption of certified fire suppression systems. Insurers also demand compliance with these safety norms to minimize risk. Large facilities adopt advanced suppression technologies to meet audit requirements and reduce liability. Building managers focus on integrating detection and suppression to ensure rapid response. It leads to strong demand for system upgrades and retrofitting. The Fire Suppression market benefits from ongoing policy revisions in safety-critical sectors.
- For instance, Siemens completed its acquisition of Danfoss Fire Safety in December 2024, which enhanced its portfolio with high-pressure water-mist suppression technology. This technology is capable of operating at pressures of 100 bar or more and is suitable for various industrial applications, including protecting warehouses. Systems are designed to comply with standards such as NFPA 750 and are customized to specific fire hazards and building layouts
Growing Urbanization and Infrastructure Expansion in Emerging Economies
Rapid urban growth fuels construction of residential towers, malls, airports, and data centers. Governments invest in smart cities and critical infrastructure, all requiring robust fire protection systems. Real estate developers integrate fire suppression from the design phase to meet code mandates. High-rise structures and mixed-use buildings drive need for automated and scalable suppression systems. It accelerates demand for water-based sprinklers, gas-based systems, and hybrid solutions. Fire safety becomes a priority as population density increases in urban centers. The Fire Suppression market grows alongside construction activity in fast-developing regions.
- For instance, Honeywell provides clean-agent fire suppression systems, including FM-200 (HFC-227ea), for data centers and other critical infrastructure. These systems are designed to suppress fires quickly and effectively in sensitive environments by removing heat, without causing damage to electronic equipment or leaving a residue. The company customizes solutions for specific hazards and building layouts to ensure compliance with standards like ISO 14520 and NFPA 2001
Increased Awareness and Risk Mitigation Efforts in Industrial Environments
Manufacturers implement advanced fire control systems to protect expensive machinery and reduce downtime. Facilities handling flammable chemicals or combustible dust adopt targeted suppression methods like clean agents or foam. It helps limit business losses and supports business continuity planning. Training programs and audits raise awareness of fire hazards and response protocols. The trend favors suppression systems with fast activation and minimal residue. Customization based on risk profiles ensures optimal protection. The Fire Suppression market evolves with industry-specific safety strategies.
Technological Advancements in Detection and Suppression Equipment
Companies invest in intelligent systems that combine detection, alarm, and suppression in a unified platform. IoT-enabled solutions provide remote monitoring and automated activation based on sensor data. Smart nozzles, flame detectors, and dual-action valves improve response time and efficiency. It supports integration with building management systems for centralized control. New materials and gas types reduce environmental impact without compromising safety. Innovations expand use across heritage buildings, data centers, and sensitive equipment zones. The Fire Suppression market benefits from rapid product development and system upgrades.
Market Trends
Shift Toward Clean Agent and Environmentally Friendly Suppression Systems
Demand rises for non-toxic, residue-free suppression systems in areas with sensitive equipment. Clean agents like FK-5-1-12 and inert gases replace halons due to environmental concerns. Industries prioritize systems that meet global environmental protocols like SNAP and F-Gas regulations. It supports installations in server rooms, medical facilities, and museums. Users prefer clean agent systems that leave no residue and require minimal cleanup. Environmental focus encourages product innovation across manufacturers. The Fire Suppression market sees rising adoption of green-certified solutions in compliance-focused sectors.
- For instance, Lichfield Fire & Safety Equipment Co. Ltd. (LIFECO) supplies clean-agent fire suppression systems, including those using FK-5-1-12 (also known as LIFECO 5112), in compliance with standards such as NFPA 2001. These systems are designed for fire safety in sensitive areas like data centers and server rooms. They are available with cylinders pressurized to various levels, including 25 bar, and the required quantity of agent is determined by performing specific hydraulic flow calculations for each project based on the protected area's net volume and temperature.
Integration of Smart Fire Suppression Systems with Building Automation
Smart suppression systems now integrate with IoT and AI-based building management platforms. Real-time data helps detect heat, smoke, or gas levels and triggers precise response mechanisms. Smart controllers adjust suppression based on fire intensity and location. It improves resource efficiency while reducing false alarms. Remote diagnostics and cloud connectivity enable proactive system maintenance. Building owners gain full visibility and control from centralized dashboards. The Fire Suppression market responds to the need for connected, automated fire safety systems.
- For instance, Honeywell’s Connected Life Safety Services (CLSS) platform currently supports monitoring devices globally. Additionally, the platform was deployed in a 50,000 m² logistics center at East Midlands Airport, enabling real-time tracking of alarms, device health, and maintenance status—providing the facility team with a detailed bird’s-eye view of their system performance
Growing Use of Hybrid Systems in Multi-Zone Applications
Hybrid systems combine water mist, gas, and foam to offer broader coverage across fire types. Complex facilities such as airports, manufacturing hubs, and logistics centers install multi-agent systems for layered protection. Users choose hybrid solutions to manage electrical, chemical, and structural fire risks within one framework. It ensures flexible deployment based on zone-specific hazards. New installations demand modular and scalable hybrid platforms. Maintenance-friendly designs also support long-term reliability. The Fire Suppression market benefits from this multi-technology trend in large infrastructures.
Increased Adoption of Pre-Engineered and Modular Fire Systems
Manufacturers offer pre-engineered systems that reduce on-site installation time and complexity. These systems come fully assembled and tested, improving reliability and code compliance. Commercial kitchens, fuel stations, and data cabinets are key use areas. It allows small and medium businesses to meet safety requirements with lower capital cost. Modular systems also simplify expansion or retrofitting across facilities. The Fire Suppression market expands with demand for compact, plug-and-play fire safety solutions.
Market Challenges Analysis
High Installation and Maintenance Costs in Advanced Fire Suppression Systems
Advanced suppression systems involve significant upfront investment, especially for clean agents and smart platforms. Many small and medium enterprises avoid full-scale installations due to budget limitations. Regular maintenance, inspection, and compliance testing further increase operating expenses. It impacts long-term adoption across low-margin sectors like small retail or warehousing. Limited technical expertise in remote areas delays system setup and servicing. Manufacturers must offer scalable pricing or modular solutions to widen access. The Fire Suppression market faces resistance from cost-sensitive segments despite safety awareness.
Regulatory Variability and Compatibility Issues Across Global Markets
Fire safety regulations vary widely across countries and jurisdictions, complicating product certification. Manufacturers must adapt equipment designs to meet multiple regional codes and approval processes. Compatibility with older infrastructure also limits smooth retrofitting of new systems. It increases engineering time, approval delays, and custom design costs. Product developers struggle to standardize offerings for global scalability. The Fire Suppression market requires flexible product design and strong regulatory support to overcome market-entry barriers.
Market Opportunities
Expansion of Fire Safety Mandates in Developing Countries Creates New Revenue Streams
Emerging economies implement new fire safety regulations in commercial, industrial, and residential sectors. Governments allocate funds to upgrade public infrastructure and enforce compliance across urban zones. Rapid construction growth in Asia-Pacific, Middle East, and Africa fuels demand for certified suppression systems. It opens opportunities for manufacturers to offer cost-effective, scalable products in these markets. Local partnerships help meet region-specific codes and accelerate market penetration. The Fire Suppression market benefits from this regulatory shift and rising awareness in underpenetrated regions.
Growth in Data Centers, Renewable Energy, and EV Infrastructure Drives Niche Demand
The rise in data centers and electric vehicle charging stations requires specialized fire protection systems. These facilities need clean agent or hybrid systems to protect sensitive electronics and battery storage. It enables tailored solutions with high activation speed and minimal damage risk. Renewable energy plants also demand fire suppression for inverters, transformers, and control rooms. Players offering customized solutions can secure long-term service contracts. The Fire Suppression market finds growth in these technology-driven sectors that demand high reliability and uptime.
Market Segmentation Analysis:
By Product Type:
Sprinklers lead due to their widespread use in commercial and industrial facilities. These systems provide continuous water discharge and activate automatically upon detecting heat. It ensures rapid suppression and minimizes structural damage. Water-based systems remain popular in warehouses, schools, and offices due to ease of installation and maintenance. Gas-based systems gain traction in server rooms and power plants where water is not suitable. The Fire Suppression market also includes clean agent and inert gas systems under the gas segment, which cater to sensitive environments. Dry chemical powder systems are preferred for vehicle bays, fuel stations, and electrical panels, offering versatile suppression with fast knockdown. Fire extinguishers continue to serve as essential tools for immediate manual response in every sector.
- For instance, Victaulic’s FireLock™ Series FL-SR/ST standard-response storage sprinklers deliver a K-factor of 11.2 Imp (16.1 S.I.). They are 100% factory hydrostatically tested at 500 psi (approximately 34 bar) and are rated for a minimum operating pressure of 7 psi for UL/FM compliance, ensuring reliable performance in storage applications
By Application:
The commercial segment holds the dominant share due to strict compliance regulations in malls, hospitals, and data centers. Businesses prioritize fire protection to avoid insurance penalties and ensure uninterrupted operations. It pushes demand for integrated systems with automated detection and suppression. The industrial segment follows closely, driven by fire hazards in chemical plants, factories, and logistics hubs. High-risk zones require tailored suppression methods including foam, clean agents, and water mist. The residential segment grows steadily with rising urbanization and building safety mandates. It contributes to demand for sprinklers and compact extinguishers in multi-family housing and high-rise apartments. The Fire Suppression market serves a wide range of end-users with varied risk profiles and safety needs.
- For instance, ANSUL’s INERGEN® clean-agent system is stored in cylinders pressurized to 150 bar (2,175 psi), containing approximately 350 to 435 cubic feet of clean agent per cylinder—discharging a breathable, residue-free mixture ideal for protecting sensitive environments like museums and server rooms, fully complying with NFPA 2001 standards.
Segments:
Based on Product Type:
- Fire Extinguishers
- Gas
- Water
- Dry Chemical Powder
- Others
- Sprinklers
Based on Application:
- Commercial
- Industrial
- Residential
Based on the Geography:
- North America
- U.S.
- Canada
- Mexico
- Europe
- UK
- France
- Germany
- Italy
- Spain
- Russia
- Belgium
- Netherlands
- Austria
- Sweden
- Poland
- Denmark
- Switzerland
- Rest of Europe
- Asia Pacific
- China
- Japan
- South Korea
- India
- Australia
- Thailand
- Indonesia
- Vietnam
- Malaysia
- Philippines
- Taiwan
- Rest of Asia Pacific
- Latin America
- Brazil
- Argentina
- Peru
- Chile
- Colombia
- Rest of Latin America
- Middle East
- UAE
- KSA
- Israel
- Turkey
- Iran
- Rest of Middle East
- Africa
- Egypt
- Nigeria
- Algeria
- Morocco
- Rest of Africa
Regional Analysis
North America
North America holds the largest share of the Fire Suppression market with 35.6% in 2024. The region benefits from well-established safety regulations, high compliance rates, and a mature construction industry. The U.S. leads in adoption across commercial offices, data centers, and manufacturing plants. Frequent upgrades of existing infrastructure and insurance-driven fire safety policies drive ongoing demand. Key players offer smart, integrated suppression systems aligned with NFPA standards. The retrofit market remains strong, especially in healthcare and educational facilities. It supports continued growth and investment in advanced gas-based and water mist systems.
Europe
Europe accounts for 24.1% of the global market, driven by strong enforcement of fire safety codes across member nations. Countries like Germany, France, and the UK lead in modern suppression deployment across high-value assets and public infrastructure. Industrial automation and energy facilities adopt clean agent and hybrid systems to protect critical operations. The region sees growing investment in R&D and green technologies, favoring systems that meet EU environmental standards. Urban housing projects and heritage building preservation further support market expansion. It reflects a stable, regulation-led adoption pattern across both public and private sectors.
Asia-Pacific
Asia-Pacific captures 22.8% of the Fire Suppression market, supported by rapid urbanization and infrastructure development in China, India, and Southeast Asia. Commercial real estate growth, high-rise constructions, and industrial expansion drive significant installations. Governments enforce stricter building codes, prompting wide-scale adoption of sprinklers and gas systems. Domestic manufacturers gain traction with cost-effective solutions for the mid-tier segment. The industrial segment shows high demand due to risks in power plants, electronics, and logistics hubs. It reflects a dynamic market supported by construction activity and rising awareness of fire safety.
Latin America
Latin America holds a market share of 9.2%, with Brazil and Mexico being key contributors. Fire safety regulations improve across commercial and industrial sectors, creating opportunities for both local and global suppliers. Real estate developers and industrial parks invest in suppression systems to meet insurance and export compliance standards. Mining, oil, and logistics operations drive demand for robust, large-scale fire protection. It enables consistent adoption of both basic and advanced fire suppression technologies. Regional projects backed by public-private partnerships also support long-term growth.
Middle East & Africa
The Middle East & Africa region represents 8.3% of the global market. Oil & gas installations, commercial towers, and airports dominate demand in GCC countries. Governments in the UAE and Saudi Arabia mandate strict safety codes, pushing the deployment of high-capacity gas and foam systems. Africa shows gradual growth through infrastructure upgrades in hospitals, transport, and educational buildings. It supports long-term development despite budget constraints. Adoption of modular and clean agent systems grows as awareness and regulatory reach expand across emerging urban centers.
Key Player Analysis
- HOCHIKI America Corporation
- Feuerschutz JOCKEL GmbH & Co. KG
- Honeywell International Inc.
- GENTEX Corporation
- NAFFCO
- ORR Protection
- Johnson Controls
- Amerex Corporation
- Carrier
- Halma Plc
- Robert Bosch GmbH
- Fike Corporation
- Desautel
- Minimax USA LLC
- Siemens AG
Competitive Analysis
Leading players in the Fire Suppression market include Johnson Controls, Siemens AG, Honeywell International Inc., Carrier, NAFFCO, HOCHIKI America Corporation, GENTEX Corporation, and Robert Bosch GmbH. These companies maintain strong global presence through diversified product portfolios and established distribution networks. They focus on expanding clean agent, hybrid, and intelligent suppression systems tailored to critical infrastructure. Product innovation, such as IoT-enabled panels and real-time monitoring tools, supports competitive differentiation. Strategic partnerships with construction firms and public safety agencies help capture large-scale contracts. Leading players also invest in compliance with regional fire safety codes and environmental regulations to secure approval across markets. Localized production and service centers help reduce response time and cost, especially in emerging markets. The market remains moderately fragmented, with top firms competing on innovation, cost-efficiency, and system reliability. Competitive pressure drives continuous investment in R&D and modular solutions. Players also seek long-term service agreements to ensure recurring revenue. New entrants face entry barriers due to certification requirements and brand credibility. Established companies strengthen market position through acquisitions, product upgrades, and multi-region strategies.
Recent Developments
- In 2023, Halma Plc announced the acquisition of Thermocable Ltd., integrating Thermocable's specialized detection technologies into Halma’s subsidiary, Apollo Fire Detectors Limited
- In June 2023, Fike Corporation introduced its latest innovation, the Fike Fire Monitors, which are automatic water cannons designed to quickly target fires that are difficult to access, activating within 15 seconds after detection. These often work in conjunction with flame detectors equipped with HD or thermal imaging cameras for reliable water-based fire suppression.
- In 2022, Siemens added new IoT-enabled components to its Cerberus™ PRO system. This included updated fire control panels, an IoT-enabled detector with "Disturbance-free Testing," and the Cerberus Connect mobile app.
Report Coverage
The research report offers an in-depth analysis based on Product Type, Application and Geography. It details leading market players, providing an overview of their business, product offerings, investments, revenue streams, and key applications. Additionally, the report includes insights into the competitive environment, SWOT analysis, current market trends, as well as the primary drivers and constraints. Furthermore, it discusses various factors that have driven market expansion in recent years. The report also explores market dynamics, regulatory scenarios, and technological advancements that are shaping the industry. It assesses the impact of external factors and global economic changes on market growth. Lastly, it provides strategic recommendations for new entrants and established companies to navigate the complexities of the market.
Future Outlook
- Demand for clean agent systems will rise across data centers, labs, and critical infrastructure.
- Modular and pre-engineered systems will gain traction in small commercial and residential buildings.
- Integration with IoT and AI will enhance real-time response and remote system control.
- Regulatory updates in emerging markets will push adoption of certified suppression technologies.
- Gas-based systems will expand in power plants, aviation hangars, and semiconductor facilities.
- Water mist and hybrid systems will see increased use in multi-zone industrial facilities.
- Fire extinguishers with smart sensors and tracking features will become more common.
- Demand for retrofit and system upgrade projects will grow in aging infrastructure.
- Manufacturers will invest in eco-friendly materials to meet environmental compliance.
- Growth in EV charging stations and renewable energy sites will create new application areas.
Request a Free Sample
Fill in your details and we'll send you a free sample report.
- Sample data tables & charts
- Research methodology
Need a Custom Version of This Report?
Tailor the scope, geography, or segments to your exact requirements.
- Custom geography or segment scope
- Direct access to our analyst team
Frequently Asked Questions
What is the current market size for Fire Suppression market, and what is its projected size in 2032?
At what Compound Annual Growth Rate is the Fire Suppression Market projected to grow between 2025 and 2032?
What are the primary factors fueling the growth of the Fire Suppression market?
Who are the leading companies in the Fire Suppression Market?
Table of Content
Chapter 1. Report Introduction
- 1.1 Report Description & Purpose
- 1.1.1 Report Title & Market Definition
- 1.1.2 Unique Selling Propositions (USP) & Key Differentiators
- 1.1.3 Value Proposition for Stakeholders
- 1.2 Research Objectives
- 1.2.1 Market Sizing Objectives (Volume & Revenue)
- 1.2.2 Segmentation Objectives
- 1.2.3 Competitive Intelligence Objectives
- 1.2.4 Forecast & Scenario Objectives
- 1.3 Report Scope
- 1.3.1 Fire Suppression Scope – Types & Subtypes Covered
- 1.3.2 Geographic Scope – Regions & Countries Covered
- 1.3.3 Historical Period, Base Year & Forecast Period (2024; forecast to 2032)
- 1.3.4 Inclusions & Exclusions
- 1.4 HS Code & Classification Framework
- 1.5 Currency, Units & Pricing Basis
- 1.6 Target Stakeholders
- 1.7 Limitations & Assumptions
Chapter 2. Executive Summary
- 2.1 Global Fire Suppression Market Snapshot
- 2.1.1 Market Size – Historical (2024) & Forecast (2024-2032) (2024: USD 6.5 billion → 2032: USD 9.4 billion)
- 2.1.2 Volume & Revenue – Global Totals
- 2.1.3 Key Market Highlights – Top Five Facts
- 2.2 Fire Suppression Market Segmentation Snapshot
- 2.2.1 Market Split by Region – 2024 vs. 2032
- 2.3 Competitive Snapshot
- 2.3.1 Top 10 Players by Revenue Share – 2024
- 2.3.2 Top 10 Players by Volume Share – 2024
- 2.3.3 Recent Strategic Developments (18-Month Summary)
- 2.4 Key Investment Highlights & Strategic Conclusions
Chapter 3. Fire Suppression Market Dynamics & Industry Analysis
- 3.1 Market Overview & Context
- 3.1.1 Fire Suppression Market Position in the Broader Automotive Value Chain
- 3.1.2 OEM vs. Replacement Market Dynamics
- 3.1.3 Market Maturity & Development Stage by Region
- 3.2 Fire Suppression Market Drivers
- 3.3 Fire Suppression Market Restraints & Challenges
- 3.4 Fire Suppression Market Opportunities
- 3.5 Porter's Five Forces Analysis
- 3.5.1 Threat of New Entrants
- 3.5.2 Bargaining Power of Suppliers
- 3.5.3 Bargaining Power of Buyers
- 3.5.4 Threat of Substitutes
- 3.5.5 Competitive Rivalry – Intensity Assessment
- 3.6 Fire Suppression Value Chain Analysis
- 3.6.1 Upstream – Raw Material/Input Suppliers
- 3.6.1.1 Raw Material/Input 1
- 3.6.1.2 Raw Material/Input 2
- 3.6.1.3 Raw Material/Input 3
- 3.6.2 Midstream – Production/Manufacturing/Service Delivery
- 3.6.2.1 Production/Process Overview
- 3.6.2.2 Key Facility Locations & Capacity by Manufacturer
- 3.6.3 Downstream – Distribution & End Consumer
- 3.6.3.1 Primary Channel – B2B/OEM
- 3.6.3.2 Secondary Channels – Dealer, Retail, Online, Direct
- 3.6.4 Value Chain Profitability Analysis
- 3.6.1 Upstream – Raw Material/Input Suppliers
- 3.7 PESTEL Analysis
- 3.7.1 Political Factors
- 3.7.2 Economic Factors
- 3.7.3 Social Factors
- 3.7.4 Technological Factors
- 3.7.5 Environmental Factors
- 3.7.6 Legal Factors
- 3.8 Fire Suppression Supply Chain Analysis
- 3.8.1 Raw Material/Input Supply Risk Assessment
- 3.8.2 Manufacturing Concentration Risk (Geographic Exposure)
- 3.8.3 Trade Disruption Impact Analysis
- 3.9 Regulatory & Policy Landscape
Note: The regulatory and policy landscape section covers regulations based on their applicability to the market, Fire Suppression category, geography, and scope of the study. Only regulatory frameworks with a material impact on operations, compliance, trade, sustainability, or market access are analyzed in detail.
Chapter 4. Key Investment Pockets & Opportunity Analysis
- 4.1 Fire Suppression Market Attractiveness Analysis
- 4.1.1 By Region – Investment Attractiveness Matrix (Volume × CAGR)
- 4.2 Absolute Revenue Growth Opportunity
- 4.2.1 By Region – Absolute USD Growth Through 2032
- 4.3 Incremental Volume Opportunity
- 4.3.1 By Region – Incremental Volume Through 2032
- 4.3.2 Segment – Incremental Volume
- 4.4 Emerging Submarket Opportunity Deep Dive (Subject to Applicability)
- 4.5 Emerging Market Opportunity Scorecards
- 4.5.1 United States
- 4.5.2 Europe
- 4.5.3 Asia
- 4.5.4 Middle East & Africa
Note: Emerging Market Opportunity Scorecards will be included based on relevance and strategic importance. Regions listed are indicative and may vary depending on data availability and market dynamics.
Chapter 5. Fire Suppression Import-Export Analysis & Trade Flows
- 5.1 Global Trade Overview
- 5.1.1 Global Export Value by Country (2024)
- 5.1.2 Global Export Volume by Country (2024)
- 5.1.3 Global Import Value by Country (2024)
- 5.1.4 Global Import Volume by Country (2024)
- 5.1.5 Net Trade Balance by Country (2024)
- 5.2 Export Analysis – Segment
- 5.2.1 Type 1 (HS Code)
- 5.2.2 Type 2 (HS Code)
- 5.2.3 Type 3 (HS Code)
- 5.2.4 Type 4 (HS Code)
- 5.2.5 Type 5 (HS Code)
- 5.3 Import Analysis – Segment
- 5.3.1 Type 1 (HS Code)
- 5.3.2 Type 2 (HS Code)
- 5.3.3 Type 3 (HS Code)
- 5.3.4 Type 4 (HS Code)
- 5.3.5 Type 5 (HS Code)
- 5.4 Average Unit Trade Prices
- 5.4.1 Average Export Price – Segment & Country
- 5.4.2 Average Import Price – Segment & Source Country
- 5.4.3 Price Trends (2024)
- 5.5 Key Trade Route Analysis
- 5.5.1 Trade Route 1
- 5.5.2 Trade Route 2
- 5.5.3 Trade Route 3
- 5.5.4 Trade Route 4
- 5.5.5 Trade Route 5
- 5.6 Trade Policy Impact Assessment
- 5.6.1 US Anti-Dumping & Section 301 Tariffs
- 5.6.2 EU Customs Union Impact
- 5.6.3 Major Free Trade Agreements
- 5.6.4 USMCA Rules of Origin
Note: Trade policy analysis will be included only where relevant to the Fire Suppression market.
Chapter 6. Competitive Landscape & Company Benchmarking
- 6.1 Fire Suppression Market Concentration & Structure
- 6.1.1 Herfindahl-Hirschman Index (HHI) – vs. 2024
- 6.1.2 Tier 1, Tier 2 & Tier 3 Market Structure
- 6.1.3 Global, Regional & Local Player Dynamics
- 6.2 Fire Suppression Market Share Analysis – 2024
- 6.2.1 Global Revenue Share by Company
- 6.2.2 Global Volume Share by Company
- 6.2.3 Regional Revenue Share
- 6.2.4 Market Share Evolution ( vs. 2024)
- 6.2.5 OEM Segment Share by Company
- 6.2.6 Replacement Segment Share by Company
- 6.3 Production/Delivery Capacity & Facility Analysis
- 6.3.1 Global Installed Capacity
- 6.3.2 Capacity Utilization Rates
- 6.3.3 Production/Output Volume
- 6.3.4 Facility Locations & Capacity Map
- 6.3.5 Planned Capacity Additions
- 6.4 Fire Suppression Competitive Benchmarking Matrix
- 6.4.1 Revenue, Volume, CAGR & Profitability Comparison
- 6.4.2 Channel Revenue Mix
- 6.4.3 Geographic Revenue Exposure
- 6.4.4 R&D Intensity
- 6.4.5 Sustainability Maturity
- 6.5 Strategic Developments in Fire Suppression (Last 24 Months)
- 6.5.1 Mergers, Acquisitions & Divestments
- 6.5.2 New Fire Suppression Launches
- 6.5.3 Facility Expansions
- 6.5.4 Strategic Alliances, Joint Ventures & Partnerships
- 6.5.5 Distribution Expansion & Market Entry
- 6.5.6 Sustainability & ESG Initiatives
- 6.6 Competitive Strategy Mapping
- 6.6.1 Leader, Challenger, Follower & Niche Classification
- 6.6.2 Pricing Strategy Comparison
- 6.6.3 Channel Strategy Matrix
Note: Strategic developments are included based on their materiality and the availability of reliable information.
Chapter 7. Global Fire Suppression Market – By Distribution Channel
- 7.1 Segment Overview
- 7.1.1 Volume & Revenue Split by Channel (2024 & 2032)
- 7.1.2 Channel Mix Evolution (2024-2032)
Chapter 8. Regional Market Analysis – Global Overview
- 8.1 Global Regional Overview
- 8.1.1 Regional Volume Share
- 8.1.2 Regional Revenue Share
- 8.1.3 Regional Volume by Region
- 8.1.4 Regional Revenue by Region
- 8.1.5 Regional Forecast Through 2032
- 8.2 Cross-Regional Segment Analysis
- 8.2.1 By Distribution Channel
- 8.2.2 By Brand/Price Tier
Chapter 9. North America Fire Suppression Market
- 9.1 United States
- 9.2 Canada
- 9.3 Mexico
Chapter 10. Europe Fire Suppression Market
- 10.1 Germany
- 10.2 France
- 10.3 Italy
- 10.4 United Kingdom
- 10.5 Spain
- 10.6 Poland
- 10.7 Russia
- 10.8 Netherlands
- 10.9 Belgium
- 10.10 Sweden
- 10.11 Denmark
- 10.12 Norway
- 10.13 Rest of Europe
Chapter 11. Asia Pacific Fire Suppression Market
- 11.1 China
- 11.2 India
- 11.3 Japan
- 11.4 South Korea
- 11.5 Thailand
- 11.6 Indonesia
- 11.7 Vietnam
- 11.8 Malaysia
- 11.9 Australia
- 11.10 Rest of Asia Pacific
Chapter 12. Latin America Fire Suppression Market
- 12.1 Brazil
- 12.2 Argentina
- 12.3 Colombia
- 12.4 Chile
- 12.5 Rest of Latin America
Chapter 13. Middle East Fire Suppression Market
- 13.1 Saudi Arabia
- 13.2 United Arab Emirates
- 13.3 Turkey
- 13.4 Israel
- 13.5 Iran
- 13.6 Rest of the Middle East
Chapter 14. Africa Fire Suppression Market
- 14.1 South Africa
- 14.2 Egypt
- 14.3 Nigeria
- 14.4 Morocco
- 14.5 Rest of Africa
Chapter 15. Fire Suppression Company Profiles
- 15.1 [Company 01]
- 15.1.1 Company Overview
- 15.1.2 Key Management Personnel
- 15.1.3 Products & Services Portfolio
- 15.1.4 Financial Performance
- 15.1.5 Key Market Focus & Geographic Presence
- 15.1.6 Recent Developments & Strategic Initiatives
Note: The company profile list is preliminary and may change based on research findings, market developments, data availability, and client requirements.
Chapter 16. Appendices
- Appendix A – List of Abbreviations & Acronyms
- Appendix B – Industry Classification Code Reference – Full Series
- Appendix C – Production & Capacity Data Tables
- Appendix D – End-Use & Demand Base Tables
- Appendix E – Consumption & Replacement Rate Assumptions
- Appendix F – ASP Reference Tables
- Appendix G – Manufacturing & Facility Database
- Appendix H – Import-Export Data Tables
- Appendix I – Regulatory Summary Tables
- Appendix J – Primary Research Participant List (Anonymized)
- Appendix K – Primary Research Questionnaire Framework
- Appendix L – Data Sources & Bibliography
- Appendix M – Market Size Divergence & Source Comparison
Chapter 17. Research Methodology
- 17.1 Research Framework & Philosophy
- 17.2 Secondary Research – Sources, Hierarchy & Data Extraction
- 17.3 Data Modeling – Bottom-Up & Top-Down Market Sizing
- 17.4 Primary Research – Stakeholder Framework, LOI & Sample Sizes
- 17.5 Forecast Methodology – Regression, Scenario & Sensitivity Analysis
- 17.6 Quality Control – Four-Layer Validation Framework
- 17.7 Limitations & Standard Assumptions
- 17.8 Disclaimer
