
Steel relining cycles set demand as furnace routes change
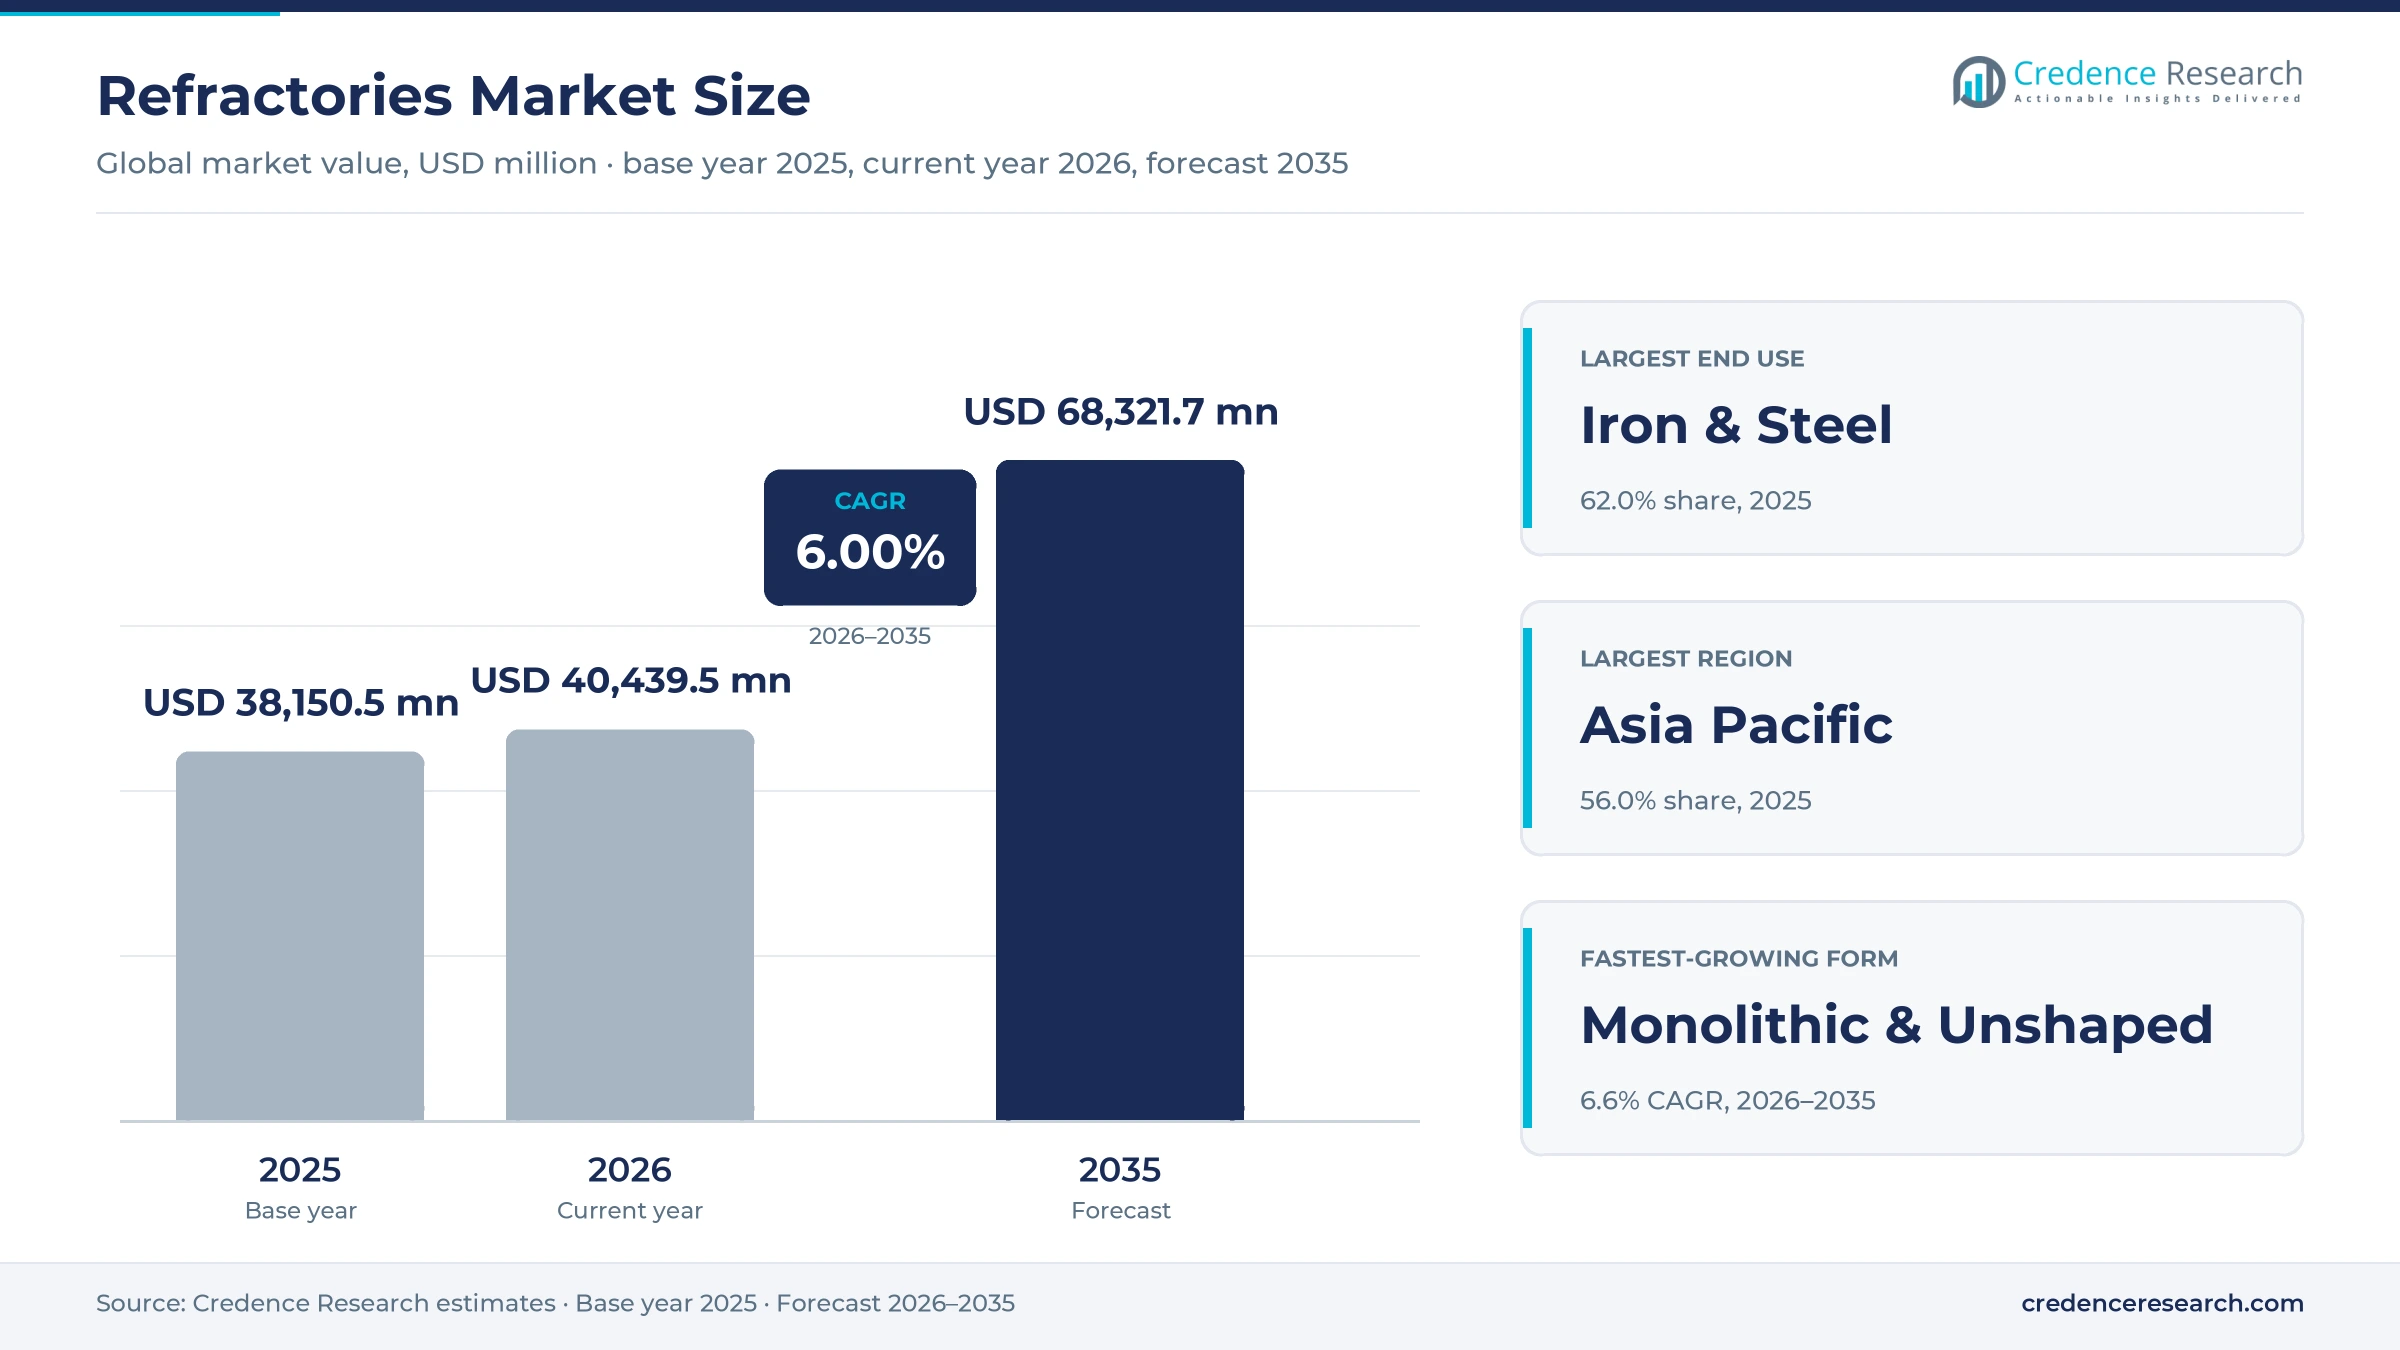
The global refractories market was valued at USD 38.15 billion in 2025 and is projected to increase from USD 40.44 billion in 2026 to USD 68.32 billion by 2035, registering a CAGR of 6.00% during 2026–2035. Iron and steel mills buy most of the material, relining converters, ladles, electric arc furnaces and tundishes on wear cycles counted in heats, while cement kilns, glass tanks and aluminum smelters buy on longer campaign schedules. Asia Pacific held the largest regional share, 56.0% in 2025, because China and India together host well over half of world steelmaking. Middle East & Africa is the fastest-growing region at 6.9% a year, as new direct reduction and electric steel capacity in the Gulf creates first-fill lining demand. The most important commercial change is the move from blast furnaces to electric arc furnaces, which consume more gunning and repair mixes per metric ton. Surplus production capacity is the main restraint, because it keeps contract prices under pressure in most regions.
Why do steel wear cycles decide how much material is bought?
The estimate counts shaped bricks, monolithic castables, gunning and ramming mixes, insulating products and functional flow-control parts such as slide gates, nozzles and stoppers, valued at the producer selling price. Large steel and cement buyers increasingly contract on a cost-per-metric-ton basis, where the supplier supplies, installs and maintains the lining and is paid for each metric ton of steel or clinker produced.
Raw minerals such as magnesite, bauxite, graphite and fused alumina sold to lining makers are excluded to avoid double counting, as are furnaces, kiln equipment and stand-alone demolition services. The value chain therefore runs from mines and fused-grain plants through brick and mix producers to installation crews at the mill, and margins are highest where suppliers own their raw materials and run the service contract.
Refractories Market Insights
- The market rises from USD 38.15 billion in 2025 to USD 68.32 billion by 2035, a 6.00% CAGR, as Indian capacity additions and electric arc furnace mix intensity offset lower Chinese steel output.
- Asia Pacific held 56.0% of 2025 value, because China and India produced about 61% of world crude steel in 2025 and host most brick and fused-grain capacity.
- Iron and steel took 62.0% of 2025 demand, since converters, ladles and arc furnaces need relining far more often than cement kilns or glass tanks.
- Recycled material reached a record 15.9% of raw material use at the largest supplier in 2025, showing that spent linings are becoming a priced input rather than landfill.
- Consolidation continues, with the Resco and Molten Metal Systems deals completed in 2025 and Nippon Steel cleared in January 2026 to take full ownership of Krosaki Harima.
Shaped bricks lead while monolithic mixes gain share
Bricks hold the converter as mixes win repair work
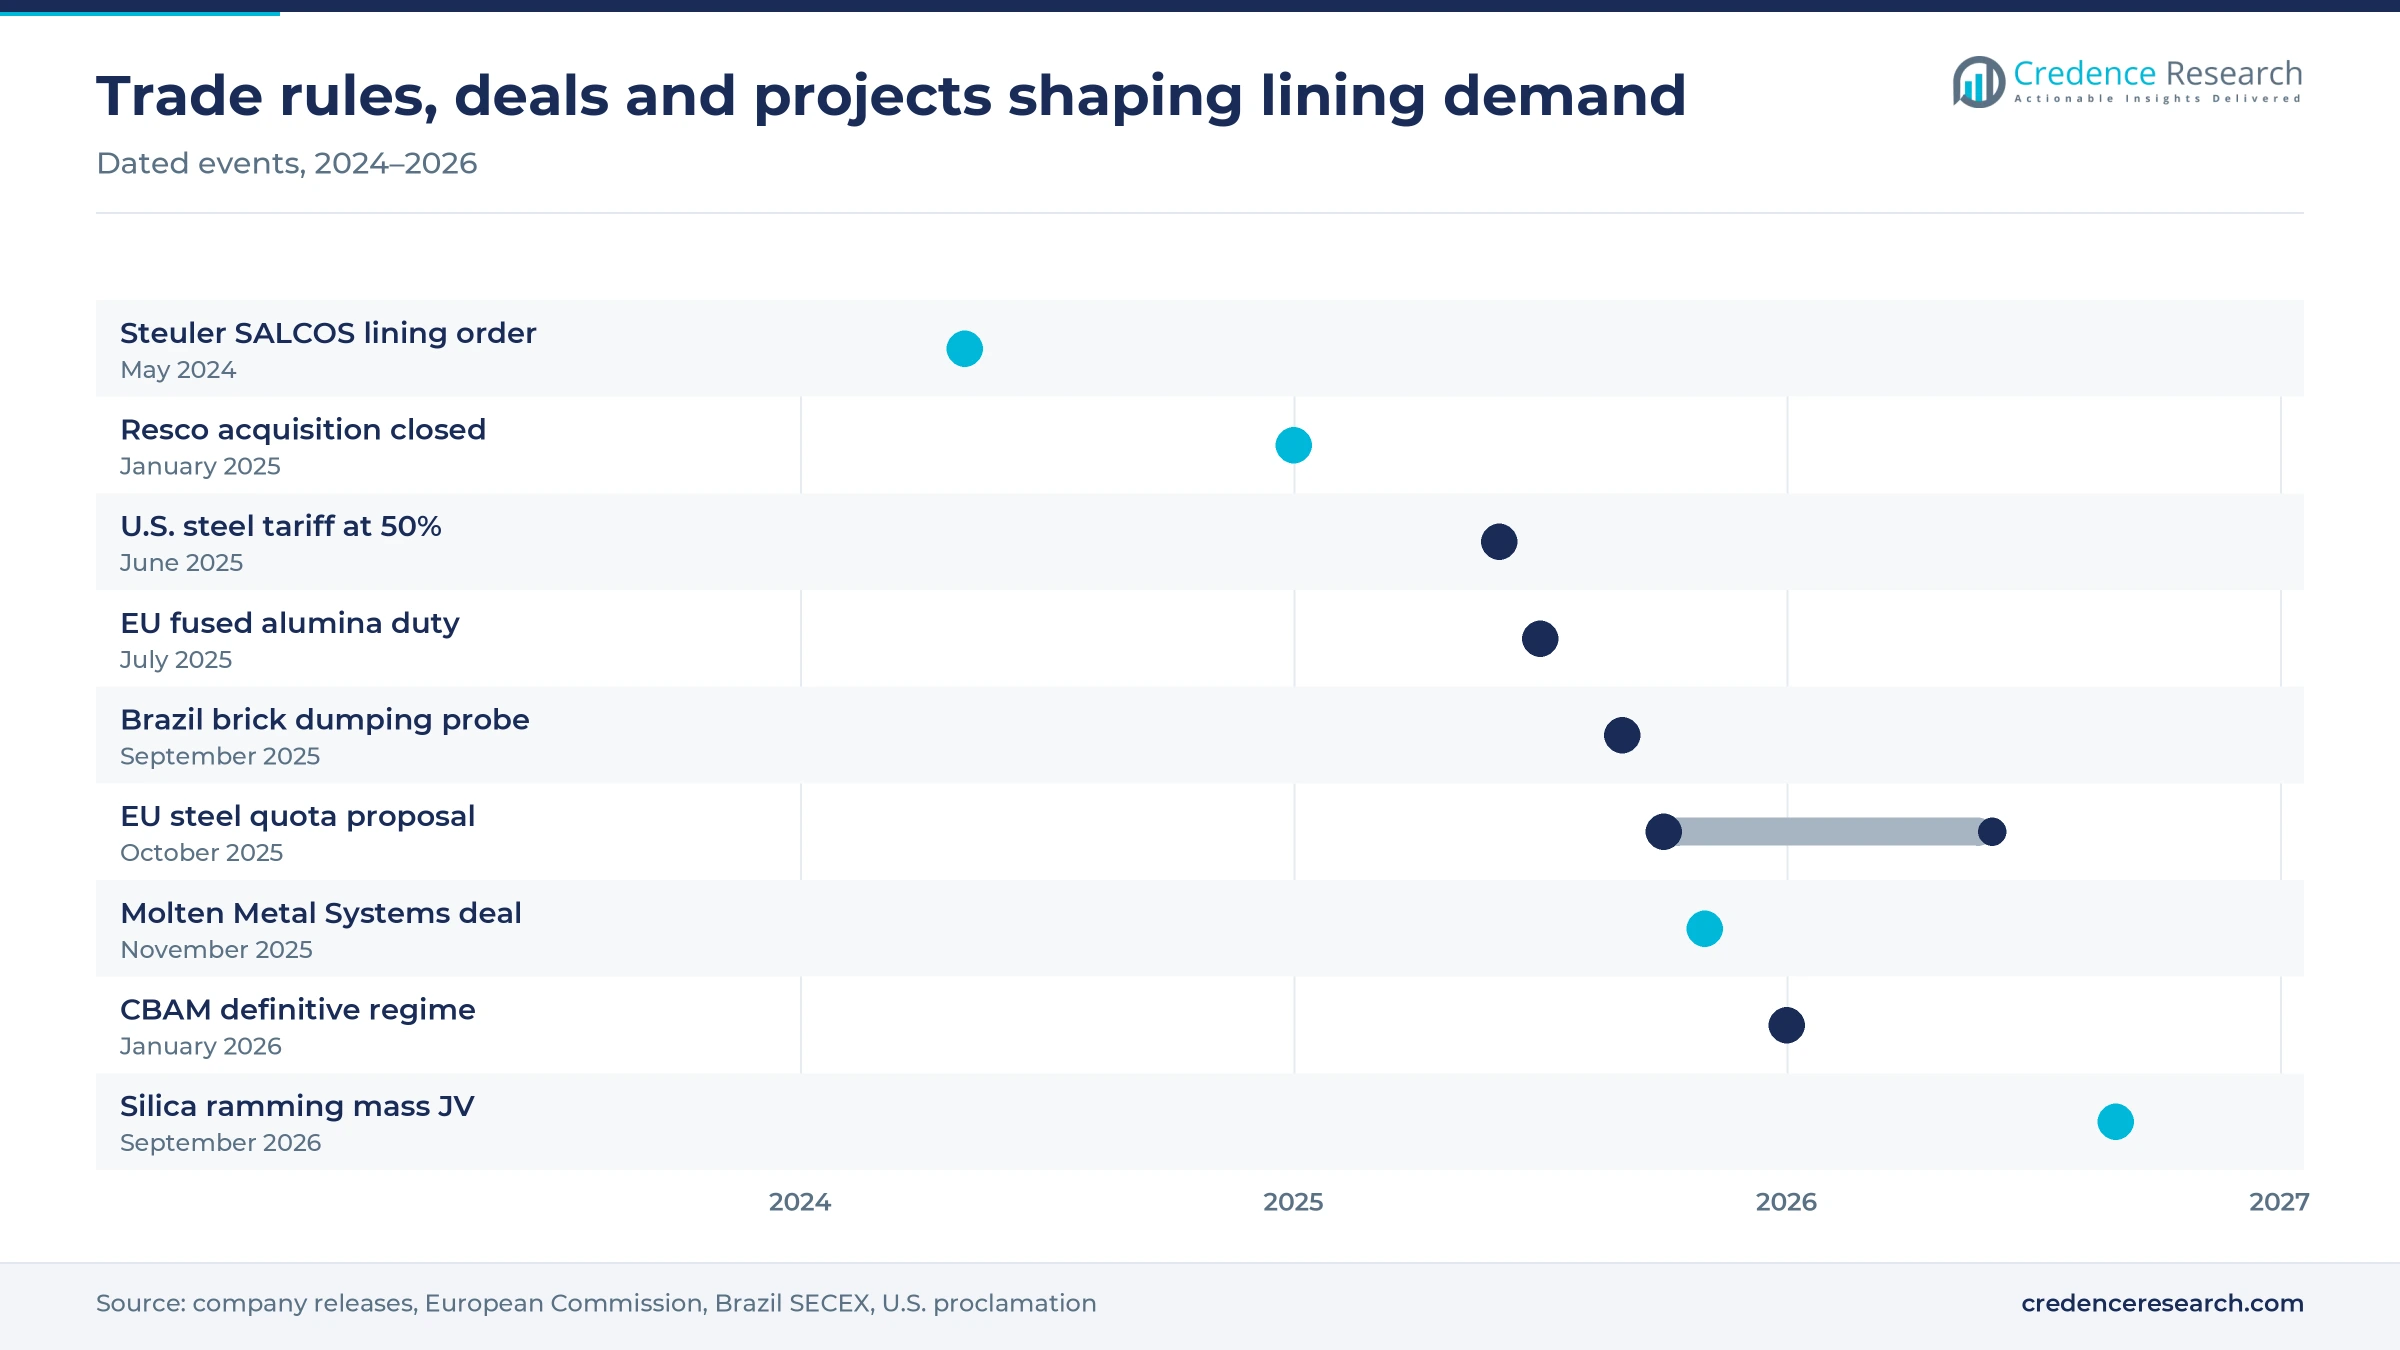
Based on form, the market is categorized into bricks & shaped and monolithic & unshaped products. Bricks & Shaped led with 57.0% of 2025 value because converter, ladle and arc furnace walls still rely on pressed magnesia-carbon and alumina bricks, and that tonnage is why Brazil targeted shaped bricks when it opened an anti-dumping investigation on Sept. 30, 2025, into basic and non-basic bricks from China across eleven tariff lines. Monolithic & Unshaped grow fastest at 6.6% a year as mills switch to installable mixes, and TRL Krosaki signed a joint venture in September 2026 for a planned 350,000-metric-ton silica ramming mass plant in Odisha.
Magnesia and alumina grades outgrow fireclay
Based on product, the market is categorized into clay and non-clay products. Non-Clay led with 72.0% of 2025 value and also grows fastest at 6.3% a year, because magnesia, high-alumina, silicon carbide and zirconia grades survive the slag and temperatures of modern steel and glass furnaces. Their input costs depend on fused and sintered grains such as calcined bauxite and fused alumina. The European Commission imposed provisional anti-dumping duties on Chinese fused alumina on July 17, 2025, after a complaint filed in October 2024, which raises grain costs for European mix makers. Clay grades keep backup and insulating linings in kilns and boilers.
Basic linings follow steel slag chemistry
Based on alkalinity, the market is categorized into acidic & neutral and basic products. Basic led with 55.0% of 2025 value because magnesia-based linings resist the lime-rich slags of converters and arc furnaces. A June 2026 technical review in Heat Processing found that hydrogen-reduced iron raises FeO in slag, which increases MgO solubility and wear on magnesia-carbon bricks. Acidic & Neutral grow fastest at 6.4% a year as refinery, petrochemical and aluminum users buy alumina-silica castables, such as the Rescobond and Rescocast lines acquired with Resco in January 2025.
Steel dominates as non-ferrous foundries grow fastest
Based on end-use industry, the market is categorized into iron & steel, non-ferrous metals, glass, cement and others. Iron & Steel led with 62.0% of 2025 value, and steel customers account for 70% of the largest supplier's sales, according to S&P Global Platts in September 2026. Non-Ferrous Metals grow fastest at 6.8% a year, as world primary aluminum output rose 1.1% to 73.78 million metric tons in 2025, according to the International Aluminium Institute. Vesuvius completed its purchase of Molten Metal Systems on Nov. 12, 2025, to gain non-ferrous foundry exposure and a larger position in India.
| Segment Group | Leading Sub-segment | Share, 2025 | Fastest-growing Sub-segment | CAGR, 2026–2035 |
|---|---|---|---|---|
| By Form | Bricks & Shaped | 57.0% | Monolithic & Unshaped | 6.6% |
| By Product | Non-Clay | 72.0% | Non-Clay | 6.3% |
| By Alkalinity | Basic | 55.0% | Acidic & Neutral | 6.4% |
| By End-Use Industry | Iron & Steel | 62.0% | Non-Ferrous Metals | 6.8% |
Contract prices sit at cyclical lows after 2025 cuts
Steel mills buy most linings through annual tenders or cost-per-metric-ton contracts, so prices move with steel output, grain costs and the number of competing bidders. Chinese dead-burned magnesia prices fell 8% in 2025, and the leading supplier's average revenue per metric ton fell 7% in India and 8% in China & East Asia while European pricing stayed stable. Lower grain costs passed quickly into tender prices, so producers that buy grain kept little of the saving, while integrated miners lost margin on their own magnesia. Prices are likely to recover only when mill utilization rises in protected markets.
| Product or indicator | Typical price or fee | Basis |
|---|---|---|
| Magnesia-carbon bricks for converters and arc furnaces | USD 900–1,400 per metric ton | Credence Research estimate, 2025 |
| High-alumina castables and gunning mixes | USD 700–1,300 per metric ton | Credence Research estimate, 2025 |
| Fireclay bricks for backup linings | USD 250–500 per metric ton | Credence Research estimate, 2025 |
| Average revenue per metric ton, India and China & East Asia | Down 7% and 8% in 2025 | RHI Magnesita, March 2026 |
Request a Free Sample
Fill in your details and we'll send you a free sample report.
- Sample data tables & charts
- Research methodology
Indian steel, arc furnaces and trade shields lift volumes
India's steel build-out adds lining tonnage every year
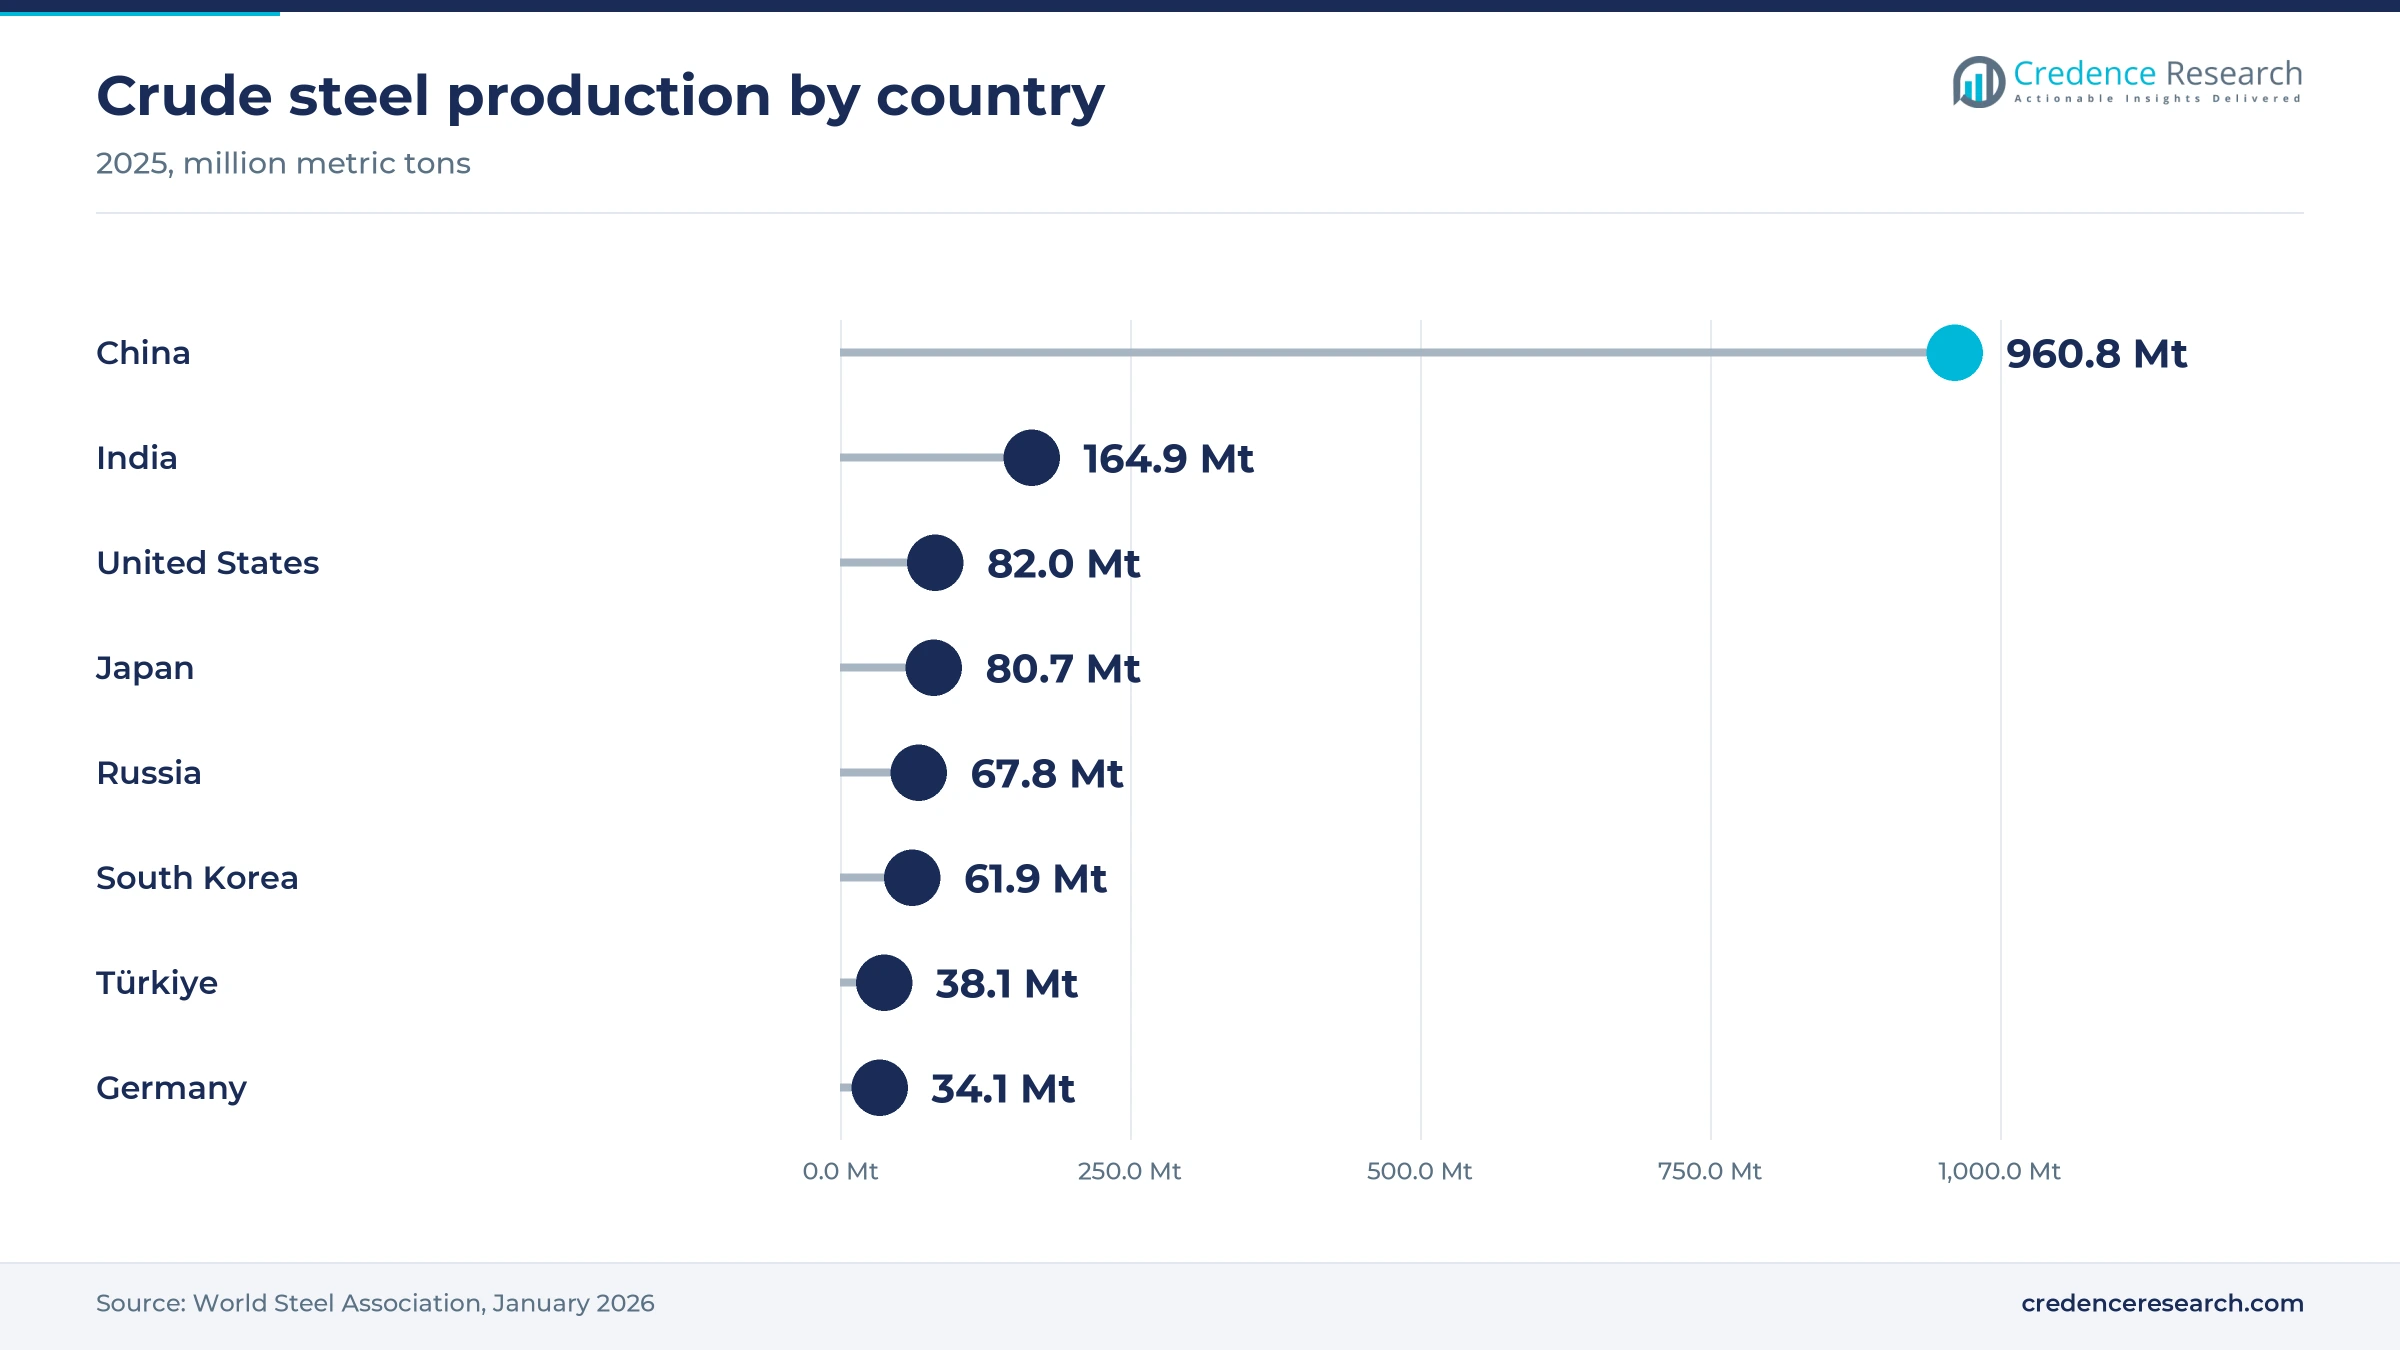
New blast furnaces, converters and arc furnaces need a full first lining before producing steel, and each metric ton of added output then creates recurring relining demand. India produced 164.9 million metric tons of crude steel in 2025, up 10.4%, according to World Steel Association data released in January 2026. Installed capacity reached about 235 million metric tons in November 2025, and the government targets 300 million metric tons by 2030. RHI Magnesita told BizzBuzz in January 2025 that it runs more than 500,000 metric tons of local capacity and aims for a 40% Indian market share within four years. Its Indian shipments rose only 4% in 2025, according to its March 2026 results, well below steel output growth, which shows that imports and new local rivals are taking part of the added tonnage.
Arc furnaces use more repair mixes per metric ton of steel
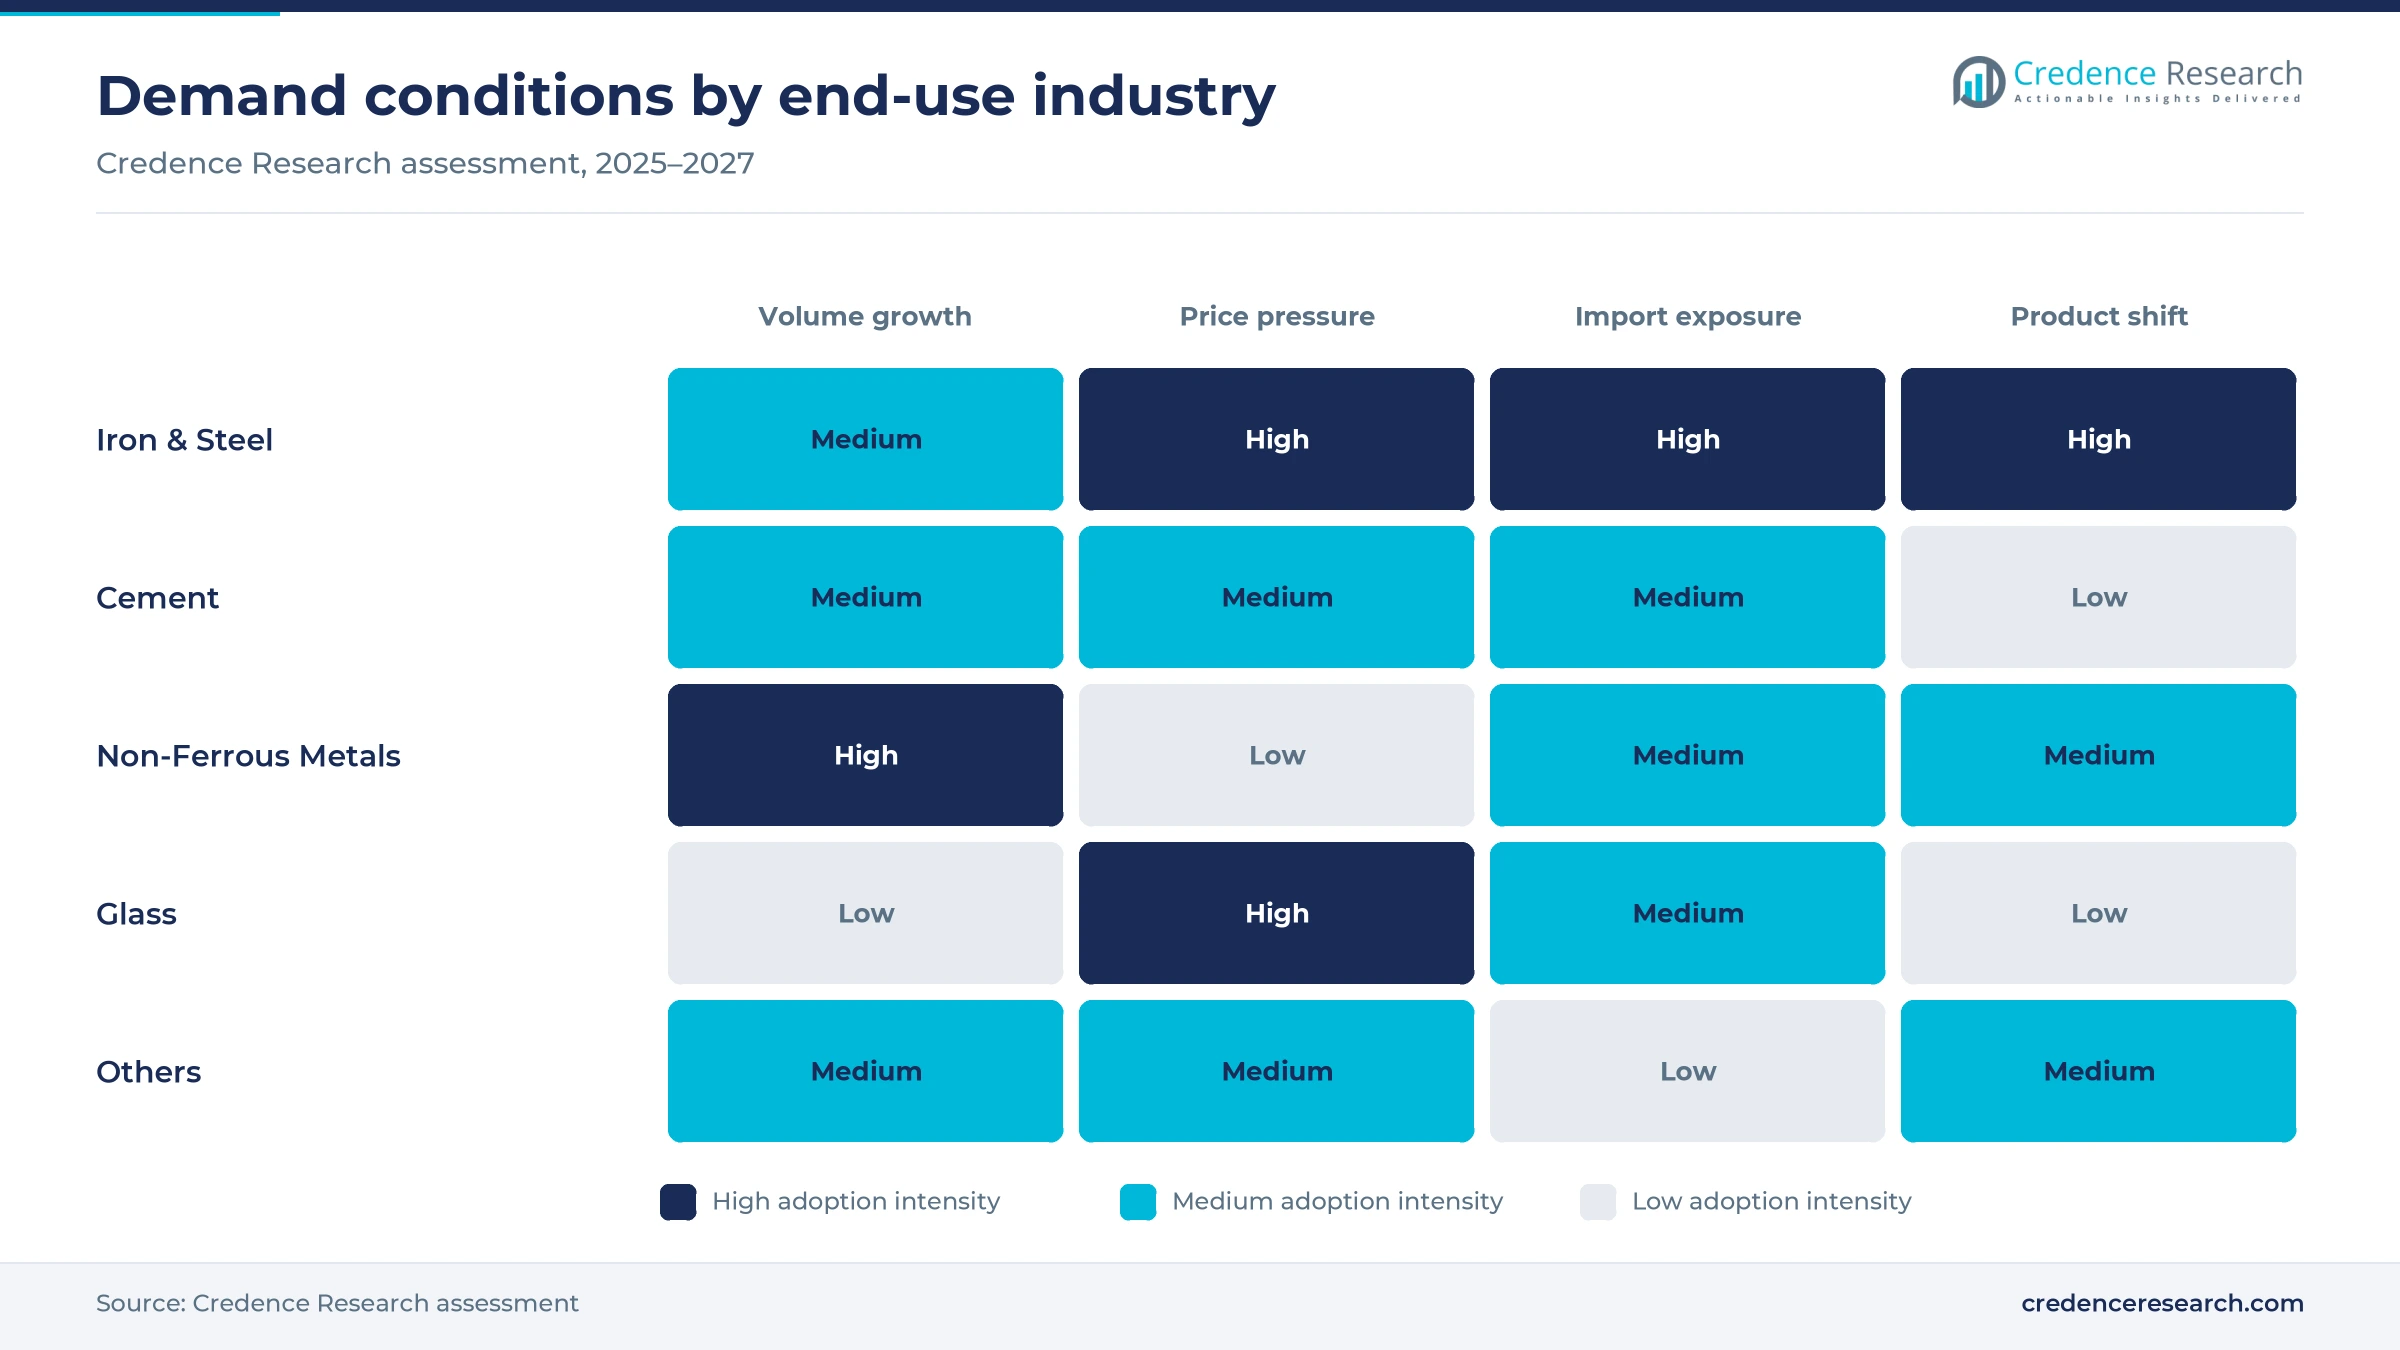
The shift from blast furnace and converter routes to electric arc furnaces changes both the amount and the type of lining that mills buy. Arc furnaces rose from 60% of U.S. steel output in 2012 to about 80% in 2026, according to S&P Global Platts in September 2026. RHI Magnesita told the same outlet that arc furnaces consume more lining mixes per metric ton than integrated mills, because walls and hearths are gunned between heats. HYUNDAI-POSCO Louisiana Steel awarded Danieli contracts in May 2026 for a 2.5-million-metric-ton direct reduction plant and a 2.88-million-metric-ton meltshop with two arc furnaces. This route change favors suppliers with gunning equipment and on-site crews.
Trade protection restores mill utilization in the west
Lining demand follows furnace utilization, so import barriers that lift domestic steel output also lift domestic relining. The U.S. Section 232 tariff on steel imports rose to 50% on June 4, 2025, which gave domestic mills room to restart idle furnace capacity. The European Commission proposed on Oct. 7, 2025 to cut tariff-free steel import quotas by 47% to 18.3 million metric tons and to double the out-of-quota duty to 50%, replacing the safeguard that expires in June 2026. Vesuvius expects these measures to have a meaningful effect from late 2026, while the market leader sees no material lift before 2027.
Cement kilns face carbon costs that reward better linings
Kiln operators buy longer-lasting and better-insulating linings when fuel and carbon costs rise, because heat loss through the shell becomes a direct expense. World cement production reached about 3.8 billion metric tons in 2025, including 1.7 billion metric tons in China and 470 million metric tons in India, according to the U.S. Geological Survey. The EU Carbon Border Adjustment Mechanism entered its definitive regime on Jan. 1, 2026, covering cement, iron, steel and aluminum imports. The same supplier reported that cement and lime demand stayed resilient in Europe in 2025 while glass weakened. Cement linings therefore offer steadier volume than steel, although Indian and Middle Eastern buyers remain very price sensitive.
Recycled grain, local plants and hydrogen-ready linings
Recycled grain is rising in steel plant linings
Lining makers are shifting toward recycled grain from spent bricks to cut raw material costs and embodied carbon, which turns demolition waste into a traded input. RHI Magnesita raised its recycling rate to a record 15.9% in 2025 from 14.2% in 2024, with Europe at 22.3%, India at 18.8% and China & East Asia at only 9.6%. In a press release carried by Alcircle, the company also asked Indian policymakers to restrict landfilling of used linings and promote secondary raw materials. These gaps show where recycling capacity can still grow, and they favor suppliers that run tear-out contracts and sorting yards at the mill. Recycled content cannot yet replace virgin grain in the hottest zones, which limits the substitution rate.
Suppliers are moving production closer to the mill
Large suppliers are shifting toward local-for-local production to address tariffs, freight costs and the service response that cost-per-metric-ton contracts require. The market leader expects more than 75% of its North American sales to be produced in the region in 2026, after spending EUR 27 million in 2025 to close two German plants, Mainzlar and Wetro. Vesuvius said in March 2026 that it had completed its capacity expansion program, and Saint-Gobain Performance Ceramics & Refractories launched a new production line at Halol in India in May 2025. Platinum Equity bought Calderys from Imerys for EUR 930 million on Jan. 31, 2023 and merged it with HarbisonWalker International a month later. Importers without local plants are likely to lose ground in tenders that weigh tariffs and delivery time.
Hydrogen-ready iron plants open a new lining package
Direct reduction shafts, gas heaters and the arc furnaces that melt their iron need linings qualified for hydrogen-rich gas, which creates a first-fill and relining opportunity for tested suppliers. Steuler received the order in May 2024 for the complete brick lining of the SALCOS direct reduction plant, more than 2,000 metric tons for a 1.2-million-metric-ton plant. Jindal Steel Duqm ordered a second 2.5-million-metric-ton hydrogen-ready plant from Danieli in September 2025, and its first unit is scheduled to start in 2026. The market leader also secured four new Green Steel contracts in 2025, according to its March 2026 results release. Suppliers that test grades under real gas mixtures can win these specifications early.
North American buyers need domestic raw material sources
U.S. lining producers depend on imported magnesia, which gives domestic and recycled grain suppliers a clear opening with mills that want shorter supply chains. China supplied 69% of U.S. dead-burned and fused magnesia imports and 74% of caustic-calcined magnesia imports in 2021 to 2024, according to the U.S. Geological Survey. RHI Magnesita and BPI announced a joint venture in June 2025 to process circular raw materials across 20 plant locations in seven states and Quebec. Resco added two U.S. raw material sites in January 2025. Steel and aluminum plants can lower import risk by qualifying recycled magnesia and domestic alumina-silica grades.
Surplus capacity, Chinese cuts and mineral risk weigh
Surplus capacity keeps contract prices falling
Production capacity exceeds demand in every region, and new plants are still being added in India and the Middle East, according to the market leader's March 2026 results. Chinese exports also pressure prices and volumes in Latin America and the Middle East. Independent brick makers without their own raw materials are the most exposed group, because they cannot offset lower selling prices with mining margins. Mills gain bargaining power in annual tenders as a result of this surplus. Cost-per-ton service contracts offer partial protection, because suppliers are paid on steel output rather than on bricks shipped.
China's steel cuts remove the largest demand pool
China plans to remove 200 to 300 million metric tons of steel capacity over five years, S&P Global Platts reported in September 2026, and its crude steel output fell 4.4% to 960.8 million metric tons in 2025. Chinese lining makers serve mostly domestic mills, so each closure removes recurring demand. Chinese producers that depend on domestic mills are most exposed, and many will push surplus output into export markets at low prices. Suppliers elsewhere then face that export pressure in their own tenders until Chinese capacity falls.
Magnesite supply is concentrated in one country
China mined about 12.7 million of the roughly 21 million metric tons of magnesite produced outside the United States in 2025, gross weight, according to the U.S. Geological Survey. Liaoning province cut magnesite mining enterprises from 114 in 2020 to 63 in 2024 under a consolidation plan. Basic brick makers in Europe, India and the Americas that buy grain on the spot market are most exposed when quotas tighten. Vertically integrated suppliers that mine their own magnesite are better protected when Chinese grain supply tightens.
Glass and smelter projects keep slipping
Industrial lining volumes at the market leader fell 6% in 2025, with glass manufacturing the weakest segment because of oversupply in China and delayed rebuilds in Europe. Base metal smelter investment has been postponed repeatedly and is expected to pick up only in 2027 to 2028, the market leader said in September 2026. Project-driven suppliers of fused-cast and alumina-silica grades face idle installation crews and lower plant utilization until these rebuilds return.
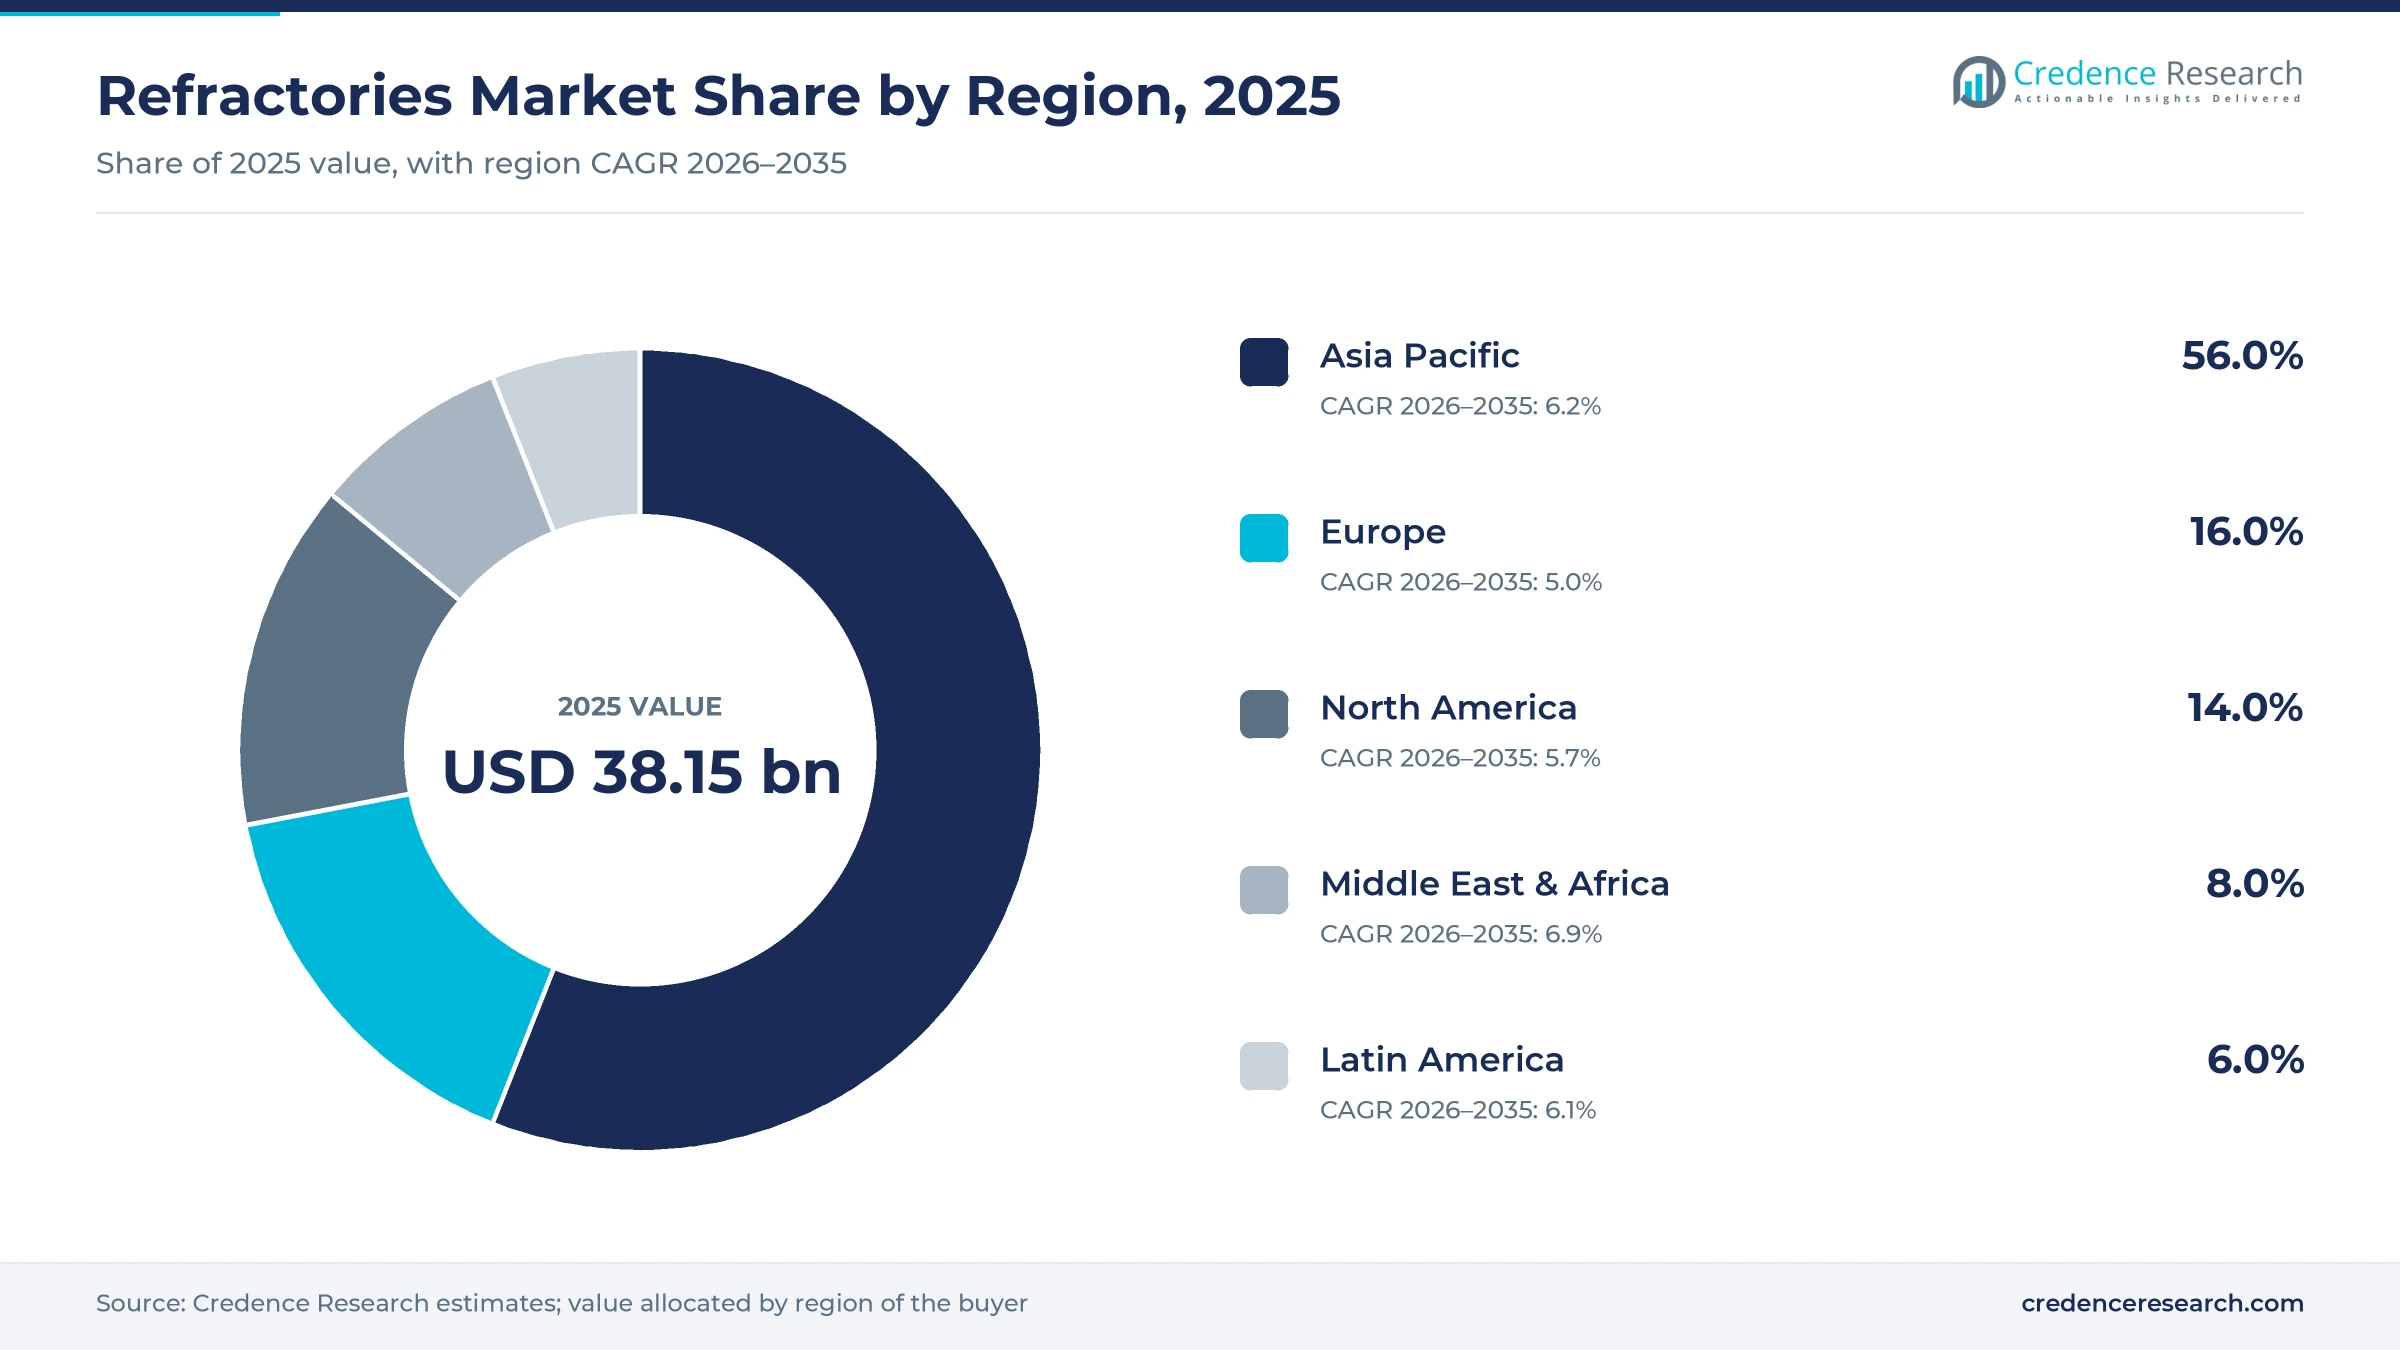
Asia Pacific leads as Gulf steel projects grow fastest
| Region | Value, 2025 (USD billion) | Share, 2025 | CAGR, 2026–2035 |
|---|---|---|---|
| Asia Pacific | 21.36 | 56.0% | 6.2% |
| Europe | 6.10 | 16.0% | 5.0% |
| North America | 5.34 | 14.0% | 5.7% |
| Middle East & Africa | 3.05 | 8.0% | 6.9% |
| Latin America | 2.29 | 6.0% | 6.1% |
Asia Pacific leads, with India offsetting Chinese decline
Asia Pacific held 56.0% of 2025 value and grows at 6.2% a year, the largest regional pool because China and India host most of the world's steel and cement capacity. Japan's crude steel output fell 4.0% to 80.7 million metric tons in 2025, while South Korea fell 2.8%, according to the World Steel Association. India's capacity build-out, described in the drivers, offsets most of the decline in North Asian mill output. Indian demand, Chinese export pricing and Japanese and Korean mill output together decide the regional outcome.
Europe grows slowest as mills and glass plants cut output
Europe held 16.0% of 2025 value and grows at 5.0% a year, the slowest rate, because steel and glass output contracted across the region in 2025. German crude steel production fell 8.6% to 34.1 million metric tons in 2025, according to the World Steel Association. The market leader's European and CIS shipments fell 14% in 2025, with industrial volumes down 22%. Recovery depends on the import quota regime that replaces the EU safeguard in 2026, which should favor local suppliers once mills restart idle furnaces.
North America gains from arc furnaces and local plants
North America held 14.0% of 2025 value and grows at 5.7% a year, and the United States accounts for most of that value. U.S. crude steel output rose 3.1% to 82.0 million metric tons in 2025, according to the World Steel Association, in the same year that the Section 232 duty was doubled. Most new U.S. electric arc furnace capacity is mix-intensive, which raises lining value per metric ton. RHI Magnesita's North American shipments rose 19% in 2025 after the Resco acquisition while its organic steel volumes stayed flat, which shows that supplier growth there comes mostly from consolidation.
Middle East & Africa grows on Gulf iron and steel projects
Middle East & Africa held 8.0% of 2025 value and grows fastest at 6.9% a year, as direct reduction and arc furnace projects in Oman and other Gulf states need first linings. The market leader says it meets about 60% of demand from Gulf Cooperation Council steel mills, which ties regional growth to a single dominant supplier. Türkiye, which the Credence Research regional model groups with the Middle East, raised crude steel output 3.3% to 38.1 million metric tons in 2025, and Vesuvius bought Turkish producer PiroMET to serve that growth. Price-led tenders and Chinese imports still cap margins for local suppliers.
Latin America waits on trade defense in Brazil
Latin America held 6.0% of 2025 value and grows at 6.1% a year, with Brazil and Mexico as the main steel and cement buyers. Brazilian crude steel output fell 1.6% to 33.3 million metric tons in 2025, according to the World Steel Association. The market leader's Latin American revenue per metric ton fell 9% and shipments fell 4% as Chinese imports competed for contracts. The Brazilian anti-dumping case on Chinese bricks noted above could restore pricing for local producers if duties are imposed.
Acquisitions and joint ventures reshape the supply base
| Development | Status and market relevance |
|---|---|
| In January 2025, RHI Magnesita completed its acquisition of Resco Group, adding seven U.S. plants and two U.S. raw material sites that make shaped and unshaped products for petrochemical, cement, aluminum and steel customers. | Completed acquisition; it raises local North American supply and adds alumina-silica brands for refinery users. |
| In June 2025, RHI Magnesita and BPI announced a joint venture to process circular raw materials for linings across 20 plant locations in North America, with completion expected in the second half of 2025. | Announced joint venture; closing was not confirmed in the source, and it targets domestic recycled grain. |
| In November 2025, Vesuvius completed the acquisition of the Molten Metal Systems business from Morgan Advanced Materials, extending its foundry business into non-ferrous metals and India. | Completed on Nov. 12, 2025; it shifts part of Vesuvius toward faster-growing non-ferrous casting. |
| In January 2026, the Competition Commission of India approved Nippon Steel's purchase of the remaining 53.4% of Krosaki Harima, which would give the steelmaker full ownership of its lining supplier. | Regulatory approval; it ties a major Japanese and Indian supplier closer to a single captive steel customer. |
| In September 2026, Raghav Productivity Enhancers and TRL Krosaki signed a joint venture for a 350,000-metric-ton-a-year silica ramming mass plant in Odisha, with an initial investment of about INR 100 crore. | Agreement signed; the plant is planned and no commissioning date has been given. |
Lining chemistry and wear monitoring cut consumption
- Magnesia-carbon bricks with aluminum or silicon antioxidants resist oxidation and slag attack in arc furnace and converter walls.
- Low-cement castables shorten installation and dry-out time in ladles and reheating furnaces, which favors suppliers with application crews.
- Laser lining scanners and robotic gunning measure wear between heats so mills repair only thin zones and cut consumption per metric ton.
- Recycled grain from spent linings replaces part of virgin magnesia and alumina, lowering raw material cost and embodied carbon.
Need a Custom Version of This Report?
Tailor the scope, geography, or segments to your exact requirements.
- Custom geography or segment scope
- Direct access to our analyst team
Integrated majors compete on service and raw materials
Competition turns on three assets, which are captive raw materials, mill service crews and qualified products for each furnace zone. RHI Magnesita combines magnesite mines with a broad brick and mix range and holds strong positions in India and North America. Vesuvius leads in steel flow control and foundry consumables, and its 2025 purchase of Molten Metal Systems widened its non-ferrous reach. Calderys, which now includes HWI in the Americas, competes on monolithics and installation across Europe and the Americas, while Krosaki Harima and Shinagawa Refra serve Japanese and Indian mills. Puyang Refractories is a large Chinese producer of steel linings. Saint-Gobain, Morgan Advanced Materials and Allied Mineral Products focus on specialty, insulating and monolithic grades, while Minerals Technologies supplies steel linings and laser measurement through Minteq. Buyers rank suppliers on cost per metric ton of steel, which rewards service depth more than list price.
A few integrated majors and many regional brick makers
The supply side has two clearly separated tiers of producers. A small group of multinational suppliers, led by RHI Magnesita with 76 main production sites and 16 raw material sites, sells across regions and runs service contracts at large mills. Beneath them, many regional producers in China, India and Europe sell standard bricks and mixes on price. Entry barriers are mill qualification trials, which can take several campaigns, and access to magnesia and alumina grain. Margins sit in flow-control parts, captive raw materials and cost-per-metric-ton contracts rather than in commodity bricks.
Leading suppliers and their roles
| Company | Type | Role in the market |
|---|---|---|
| RHI Magnesita N.V. | Integrated full-line supplier | Magnesia bricks, mixes and flow control, with own magnesite mines |
| Vesuvius plc | Flow control and foundry specialist | Slide gates, nozzles, tundish linings and foundry consumables |
| Calderys (Platinum Equity), including former HarbisonWalker International | Full-line supplier | Monolithics, bricks and installation services in Europe and the Americas |
| Krosaki Harima Corporation (Nippon Steel) | Steel-affiliated supplier | Steel linings in Japan and, through TRL Krosaki, India |
| Shinagawa Refra Co., Ltd. | Full-line supplier | Bricks, monolithics and casting parts for Japanese and Asian mills |
| Puyang Refractories Group Co., Ltd. | Chinese full-line producer | Shaped and unshaped steel linings for Chinese and export mills |
| Saint-Gobain (Performance Ceramics & Refractories) | Specialty supplier | Fused-cast and silicon carbide products for glass and industry |
| Refratechnik Holding GmbH | Specialist | Basic and alumina products for cement kilns and steel |
| Morgan Advanced Materials plc | Insulation specialist | Ceramic fiber and insulating bricks through Thermal Ceramics |
| Minerals Technologies Inc. (Minteq) | Steel service specialist | Gunning mixes, application systems and laser wear measurement |
| Allied Mineral Products, LLC | Monolithic specialist | Castables and precast shapes for foundry and industrial furnaces |
Value follows the arc furnace and the Indian mill
Credence Research's view is that value is moving from the blast furnace in China to the arc furnace and the Indian mill. Total volume may barely grow, yet arc furnaces need more repair mixes per metric ton, and Indian mills add first linings every year. Suppliers with local plants, own grain and service crews in India, the Gulf and the United States should gain share, while import-dependent brick makers lose. The main risk is that Chinese capacity cuts arrive faster than new furnaces elsewhere, which would keep tender prices near 2025 lows for longer.
Steel output and supplier disclosures anchor the model
The report uses 2025 as the base year and forecasts to 2035. Market values come from the Credence Research model, which links lining demand to crude steel, cement, glass and aluminum output and to average prices by product. Inputs include World Steel Association production data, U.S. Geological Survey commodity summaries, company annual results and trade measures published by the European Commission and Brazil. Segment and regional splits are Credence Research estimates from these inputs. No interviews or surveys were used to build the estimates.
India and Gulf steel carry growth as China contracts
Through 2035 growth should come from India, the Gulf and protected U.S. and European mills, while Chinese demand shrinks as capacity closes. Arc furnace and hydrogen-ready iron projects will raise the share of monolithic mixes and alumina-silica grades in the product mix. Recycled grain should become a standard part of contracts, especially in Europe and India. Pricing is the main uncertainty, because surplus capacity can keep tender values low even when volumes recover, so the forecast should be read with the scenario range in mind.
Steel utilization outside China decides the 2035 value
The range of outcomes depends mainly on how fast China removes capacity compared with how fast India, the Gulf and protected Western markets add or restart furnaces. Price recovery from the 2025 lows matters almost as much as volume, because tender prices fell faster than shipments. Faster hydrogen-ready iron projects would lift the upside through first linings.
| Scenario | CAGR, 2026–2035 | Value, 2035 | What has to hold |
|---|---|---|---|
| Downside | 4.0% | USD 57.56 billion | Chinese cuts outpace Indian additions and export pricing keeps contract values falling |
| Base | 6.00% | USD 68.32 billion | India reaches about 300 million metric tons of capacity by 2030 and trade measures restore Western utilization |
| Upside | 7.0% | USD 74.35 billion | Gulf and U.S. direct reduction and arc furnace projects start on schedule from 2026 |
Frequently Asked Questions
How big is the refractories market?
Which end-use industry buys the most refractories?
How large is the U.S. refractories market?
What is driving demand in the India refractories market?
How important is refractory recycling?
Which region grows fastest?
Why are refractory prices under pressure?
Who are the leading suppliers?
Table of Content
Chapter 1 Market Segmentation
- 1.1 Segmentation Framework
- 1.1.1 Product and Service Classification
- 1.1.2 Application and End-Use Classification
- 1.1.3 Technology and Solution Classification
- 1.1.4 Customer and Distribution Channel Classification
- 1.1.5 Geographic Segmentation
- 1.1.6 Market Segment Definitions and Boundaries
- 1.2 By Form
- 1.2.1 Bricks & Shaped
- 1.2.2 Monolithic & Unshaped
- 1.3 By Product
- 1.3.1 Clay
- 1.3.2 Non-Clay
- 1.4 By Alkalinity
- 1.4.1 Basic
- 1.4.2 Acidic & Neutral
- 1.5 By End-Use Industry
- 1.5.1 Iron & Steel
- 1.5.2 Cement
- 1.5.3 Non-Ferrous Metals
- 1.5.4 Glass
- 1.5.5 Others
Chapter 2 Introduction
- 2.1 Report Objectives and Scope
- 2.2 Product Definition and Industry Terminology
- 2.3 Market Inclusions and Exclusions
- 2.4 Research Process
- 2.4.1 Primary Research and Expert Interviews
- 2.4.2 Secondary Research and Source Review
- 2.4.3 Top-Down and Bottom-Up Estimation
- 2.4.4 Data Triangulation and Verification
- 2.5 Market Size Measurement Basis
- 2.5.1 2025: USD 38.15 billion → 2035: USD 68.32 billion
- 2.6 Historical and Forecast Reference Periods
- 2.6.1 Historical Period: 2018-2025
- 2.6.2 Base Year: 2025
- 2.6.3 Forecast Period: 2025-2035
- 2.7 Research Assumptions and Limitations
Chapter 3 Executive Summary
- 3.1 Market Snapshot and Key Findings
- 3.2 Base-Year Market Size, 2025
- 3.3 Forecast Market Size, 2035
- 3.4 Revenue and Volume Growth Outlook
- 3.5 Key Demand and Supply Indicators
- 3.6 Leading Market Segments
- 3.7 Fastest-Growing Market Opportunities
- 3.8 Regional Performance Highlights
- 3.9 Technology and Industry Transformation
- 3.10 Competitive Landscape Summary
- 3.11 Analyst View and Strategic Implications
Chapter 4 Global Refractories Market Trends and Developments
- 4.1 Historical Industry Development, 2018-2025
- 4.2 Recent Market Trends and Developments
- 4.3 Demand and Customer Behavior Trends
- 4.4 Technology and Product Innovation
- 4.5 Artificial Intelligence, Automation and Digitalization
- 4.6 Local Manufacturing and Supply Chain Realignment
- 4.7 Industry Partnerships, Mergers and Acquisitions
- 4.8 Sustainability and Circular Economy Developments
- 4.9 Government and Private Sector Investment Trends
- 4.10 Emerging Business Models and Commercialization
- 4.11 Industry Developments and Announcements
Chapter 5 Global Refractories Market Production, Supply and Demand Analysis
- 5.1 Demand Trend and Consumption Analysis, 2018-2025
- 5.2 Demand Forecast, 2025-2035
- 5.3 Production and Output Trend, 2018-2025
- 5.4 Production and Output Forecast, 2025-2035
- 5.5 Installed Capacity and Capacity Utilization
- 5.6 Company-Wise Production Plants and Statistics
- 5.6.1 Installed Production Capacity
- 5.6.2 Actual Production
- 5.6.3 Planned Capacity and Expansion Targets
- 5.7 Supply Chain Structure and Procurement Trends
- 5.8 Supply-Demand Gap and Bottlenecks
- 5.9 Import Dependence and Sourcing Structure
- 5.10 Contract Manufacturing and Outsourcing
- 5.11 Regional Supply and Demand Concentration
Chapter 6 Global Refractories Market Pricing Analysis
- 6.1 Pricing Structure and Measurement
- 6.2 Historical Pricing Trends, 2018-2025
- 6.3 Pricing Outlook, 2025-2035
- 6.4 Average Selling Price and Unit Economics
- 6.5 Pricing by Product and Market Segment
- 6.6 Geographic Pricing Differences
- 6.7 Key Input, Energy, Labor and Logistics Costs
- 6.8 Contract Pricing and Purchasing Models
- 6.9 Pricing Sensitivity and Competitive Positioning
- 6.10 Price, Margin and Profitability Implications
Chapter 7 Global Refractories Market Dynamics
- 7.1 Market Growth Drivers
- 7.1.1 Demand-Side Drivers
- 7.1.2 Technology and Innovation Drivers
- 7.1.3 Infrastructure and Investment Drivers
- 7.1.4 Regulatory and Policy Drivers
- 7.2 Market Restraints
- 7.2.1 Cost and Affordability Constraints
- 7.2.2 Technology and Adoption Barriers
- 7.2.3 Supply Chain and Operational Constraints
- 7.3 Market Challenges
- 7.3.1 Competitive Pressure and Margin Erosion
- 7.3.2 Skills, Infrastructure and Implementation Gaps
- 7.4 Emerging Market Opportunities
- 7.5 Market Dynamics Impact and Time-Horizon Assessment
Chapter 8 Global Refractories Value Chain Analysis
- 8.1 Industry Value Chain Overview
- 8.2 Upstream Suppliers and Critical Inputs
- 8.3 Technology and Component Providers
- 8.4 Manufacturing or Service Delivery
- 8.5 Distribution, Channel Partners and Integrators
- 8.6 Downstream Applications and End Users
- 8.7 Value Addition and Profit Pools
- 8.8 Vertical Integration and Outsourcing
- 8.9 Supplier Concentration and Risk
- 8.10 Supply Chain Localization and Resilience
Chapter 9 Global Refractories Market Regulations and Policies
- 9.1 Relevant Laws, Standards and Compliance Frameworks
- 9.2 Product, Service, Safety and Quality Requirements
- 9.3 Government Policies, Incentives and Subsidies
- 9.4 Imports, Exports and Trade Barriers
- 9.5 Public Procurement and Local Content Requirements
- 9.6 Environmental and Sustainability Compliance
- 9.7 Upcoming Policy Changes and Market Implications
Chapter 10 Global Refractories Market Hotspots and Opportunities
- 10.1 Market Opportunity Mapping and Growth Hotspots
- 10.2 High-Growth Applications and Customer Groups
- 10.3 Underserved Markets and White-Space Opportunities
- 10.4 Emerging Technology and Product Opportunities
- 10.5 New Capacity and Investment Hotspots
- 10.6 Market Entry and Expansion Opportunities
- 10.7 Distribution and Partnership Opportunities
- 10.8 Near-Term and Long-Term Commercial Potential
- 10.9 Opportunity Attractiveness and Execution Risks
Chapter 11 Global Refractories Market Outlook, 2025-2035
- 11.1 Market Size and Analysis
- 11.1.1 Revenue (Market Measurement: 2025: USD 38.15 billion → 2035: USD 68.32 billion)
- 11.1.2 Market Volume and Quantity Sold
- 11.1.3 Historical Market Size, 2018-2025
- 11.1.4 Base-Year Market Size, 2025
- 11.2 Market Forecast, 2025-2035
- 11.2.1 Revenue Forecast to 2035
- 11.2.2 Volume Forecast to 2035
- 11.2.3 CAGR and Year-on-Year Growth
- 11.2.4 Incremental Revenue Opportunity
- 11.3 Forecast Assumptions and Scenario Analysis
- 11.3.1 Base-Case Forecast
- 11.3.2 Optimistic and Conservative Scenarios
- 11.3.3 Technology, Pricing and Policy Sensitivities
- 11.4 Market Attractiveness and Growth Outlook
Chapter 12 Global Refractories Market Segmentation and Outlook
- 12.1 Segmentation Summary and Market Shares, 2025
- 12.2 Largest and Fastest-Growing Segments
- 12.3 By Form - Market Size and Forecast, 2025-2035
- 12.3.1 Segment Definition and Scope
- 12.3.2 Historical Market Size, 2018-2025
- 12.3.3 Revenue Forecast, 2025-2035
- 12.3.4 Volume Forecast, 2025-2035
- 12.3.5 Base-Year Market Share, 2025
- 12.3.6 Segment CAGR and Growth Drivers
- 12.3.7 Subsegment Market Size and Forecast
- 12.3.7.1 Bricks & Shaped
- 12.3.7.2 Monolithic & Unshaped
- 12.3.8 Subsegment Pricing and Adoption Trends
- 12.3.9 Leading Suppliers and Competition
- 12.3.10 Regional Demand and Opportunities
- 12.4 By Product - Market Size and Forecast, 2025-2035
- 12.4.1 Segment Definition and Scope
- 12.4.2 Historical Market Size, 2018-2025
- 12.4.3 Revenue Forecast, 2025-2035
- 12.4.4 Volume Forecast, 2025-2035
- 12.4.5 Base-Year Market Share, 2025
- 12.4.6 Segment CAGR and Growth Drivers
- 12.4.7 Subsegment Market Size and Forecast
- 12.4.7.1 Clay
- 12.4.7.2 Non-Clay
- 12.4.8 Subsegment Pricing and Adoption Trends
- 12.4.9 Leading Suppliers and Competition
- 12.4.10 Regional Demand and Opportunities
- 12.5 By Alkalinity - Market Size and Forecast, 2025-2035
- 12.5.1 Segment Definition and Scope
- 12.5.2 Historical Market Size, 2018-2025
- 12.5.3 Revenue Forecast, 2025-2035
- 12.5.4 Volume Forecast, 2025-2035
- 12.5.5 Base-Year Market Share, 2025
- 12.5.6 Segment CAGR and Growth Drivers
- 12.5.7 Subsegment Market Size and Forecast
- 12.5.7.1 Basic
- 12.5.7.2 Acidic & Neutral
- 12.5.8 Subsegment Pricing and Adoption Trends
- 12.5.9 Leading Suppliers and Competition
- 12.5.10 Regional Demand and Opportunities
- 12.6 By End-Use Industry - Market Size and Forecast, 2025-2035
- 12.6.1 Segment Definition and Scope
- 12.6.2 Historical Market Size, 2018-2025
- 12.6.3 Revenue Forecast, 2025-2035
- 12.6.4 Volume Forecast, 2025-2035
- 12.6.5 Base-Year Market Share, 2025
- 12.6.6 Segment CAGR and Growth Drivers
- 12.6.7 Subsegment Market Size and Forecast
- 12.6.7.1 Iron & Steel
- 12.6.7.2 Cement
- 12.6.7.3 Non-Ferrous Metals
- 12.6.7.4 Glass
- 12.6.7.5 Others
- 12.6.8 Subsegment Pricing and Adoption Trends
- 12.6.9 Leading Suppliers and Competition
- 12.6.10 Regional Demand and Opportunities
- 12.7 Segment Growth Comparison
- 12.8 Segment Attractiveness and Priority Matrix
Chapter 13 Global Refractories End-Use and Application Market Outlook
- 13.1 End-Use Industry and Customer Demand Structure
- 13.2 Leading Applications and Customer Groups
- 13.3 End-Use Market Size, Share and Forecast
- 13.4 Major End-Use Industry Deep Dives
- 13.4.1 Customer Requirements and Use Cases
- 13.4.2 Demand and Replacement Cycles
- 13.4.3 Technical and Regulatory Considerations
- 13.4.4 Purchasing and Procurement Models
- 13.4.5 Leading Vendors and Distribution Channels
- 13.4.6 Forecast and Commercial Opportunities
- 13.5 Emerging Applications and Cross-Segment Demand
- 13.6 End-Use Industry Investment Priorities
Chapter 14 Global Refractories Geographic Market Outlook, 2025-2035
- 14.1 Regional Market Size and Share, 2025
- 14.2 Regional Market Forecast, 2025-2035
- 14.3 Regional Pricing, Production and Demand Differences
- 14.4 North America
- 14.4.1 United States
- 14.4.2 Canada
- 14.4.3 Mexico
- 14.5 Europe
- 14.5.1 Germany
- 14.5.2 France
- 14.5.3 Italy
- 14.5.4 United Kingdom
- 14.5.5 Spain
- 14.5.6 Poland
- 14.5.7 Russia
- 14.5.8 Netherlands
- 14.5.9 Belgium
- 14.5.10 Sweden
- 14.5.11 Denmark
- 14.5.12 Norway
- 14.5.13 Rest of Europe
- 14.6 Asia Pacific
- 14.6.1 China
- 14.6.2 India
- 14.6.3 Japan
- 14.6.4 South Korea
- 14.6.5 Thailand
- 14.6.6 Indonesia
- 14.6.7 Vietnam
- 14.6.8 Malaysia
- 14.6.9 Australia
- 14.6.10 Rest of Asia Pacific
- 14.7 Latin America
- 14.7.1 Brazil
- 14.7.2 Argentina
- 14.7.3 Colombia
- 14.7.4 Chile
- 14.7.5 Rest of Latin America
- 14.8 Middle East
- 14.8.1 Saudi Arabia
- 14.8.2 United Arab Emirates
- 14.8.3 Turkey
- 14.8.4 Israel
- 14.8.5 Iran
- 14.8.6 Rest of the Middle East
- 14.9 Africa
- 14.9.1 South Africa
- 14.9.2 Egypt
- 14.9.3 Nigeria
- 14.9.4 Morocco
- 14.9.5 Rest of Africa
- 14.10 Regional Investment, Policy and Supply Chain Differences
- 14.11 Regional Competitive Landscape
- 14.12 Geographic Growth Hotspots
Chapter 15 Global Refractories Technology, Innovation and Sustainability Outlook
- 15.1 Technology Landscape and Maturity
- 15.2 Product, Process and Service Innovation
- 15.3 AI, Automation and Digital Tools in the Industry
- 15.4 Technology Adoption and Performance Benchmarking
- 15.5 Innovation Pipeline and R&D Investment
- 15.6 Patent and Intellectual Property Trends
- 15.7 Energy Efficiency and Resource Management
- 15.8 Sustainability, Recycling and Circularity
- 15.9 Technology Roadmap, 2025-2035
- 15.10 Risks of Obsolescence and Technology Substitution
Chapter 16 Global Refractories Market Key Strategic Imperatives
- 16.1 Growth and Market Entry Priorities
- 16.2 High-Return Products and Segments
- 16.3 Pricing, Profitability and Cost Optimization
- 16.4 Technology Investment and Product Differentiation
- 16.5 Supply Chain Localization and Resilience
- 16.6 Distribution and Customer Acquisition
- 16.7 Partnership, Acquisition and Capacity Strategy
- 16.8 Regional Expansion Priorities
- 16.9 Short-, Medium- and Long-Term Actions
Chapter 17 Competition Outlook
- 17.1 Industry Competition Characteristics
- 17.2 Market Structure and Concentration
- 17.3 Market Share and Competitive Positioning, 2025
- 17.4 Company-Wise Revenue and Product Benchmarking
- 17.5 Production and Service Capacity Benchmarking
- 17.6 Technology, Pricing and Differentiation
- 17.7 Regional Footprint and Distribution Strength
- 17.8 Mergers, Acquisitions and Strategic Alliances
- 17.9 New Entrants and Competitive Threats
- 17.10 Porter's Five Forces and Industry Attractiveness
- 17.11 Competitive Outlook, 2025-2035
Chapter 18 Company Profiles
- 18.1 Company Coverage and Selection Criteria
- 18.2 RHI Magnesita N.V.
- 18.2.1 Business Description
- 18.2.2 Company Ownership and Geographic Presence
- 18.2.3 Product and Service Portfolio
- 18.2.4 Manufacturing and Operating Footprint
- 18.2.5 Production Capacity and Expansion Plans
- 18.2.6 Financial Performance and Investment
- 18.2.7 Market Share and Competitive Position
- 18.2.8 Technology and Innovation Capabilities
- 18.2.9 Strategic Alliances or Partnerships
- 18.2.10 Recent Developments
- 18.2.11 Growth Strategy and Outlook
- 18.3 Vesuvius plc
- 18.4 Calderys (Platinum Equity), including former HarbisonWalker International
- 18.5 Krosaki Harima Corporation (Nippon Steel)
- 18.6 Shinagawa Refra Co., Ltd.
- 18.7 Puyang Refractories Group Co., Ltd.
- 18.8 Saint-Gobain (Performance Ceramics & Refractories)
- 18.9 Refratechnik Holding GmbH
- 18.10 Morgan Advanced Materials plc
- 18.11 Minerals Technologies Inc. (Minteq)
- 18.12 Allied Mineral Products, LLC
- 18.13 Other Relevant Market Participants
Note: Every listed company is profiled on the structure shown under the first company. The company list is preliminary and may change based on research findings, market developments, data availability and client requirements.
Chapter 19 Disclaimer
- 19.1 Research and Forecast Disclaimer
- 19.2 Data Source and Estimation Limitations
Note: The depth of individual sections depends on data availability for this market. Volume, capacity, trade and other unit-based metrics are included where applicable.

