
Emission control and refining anchor a shrinking fuels base
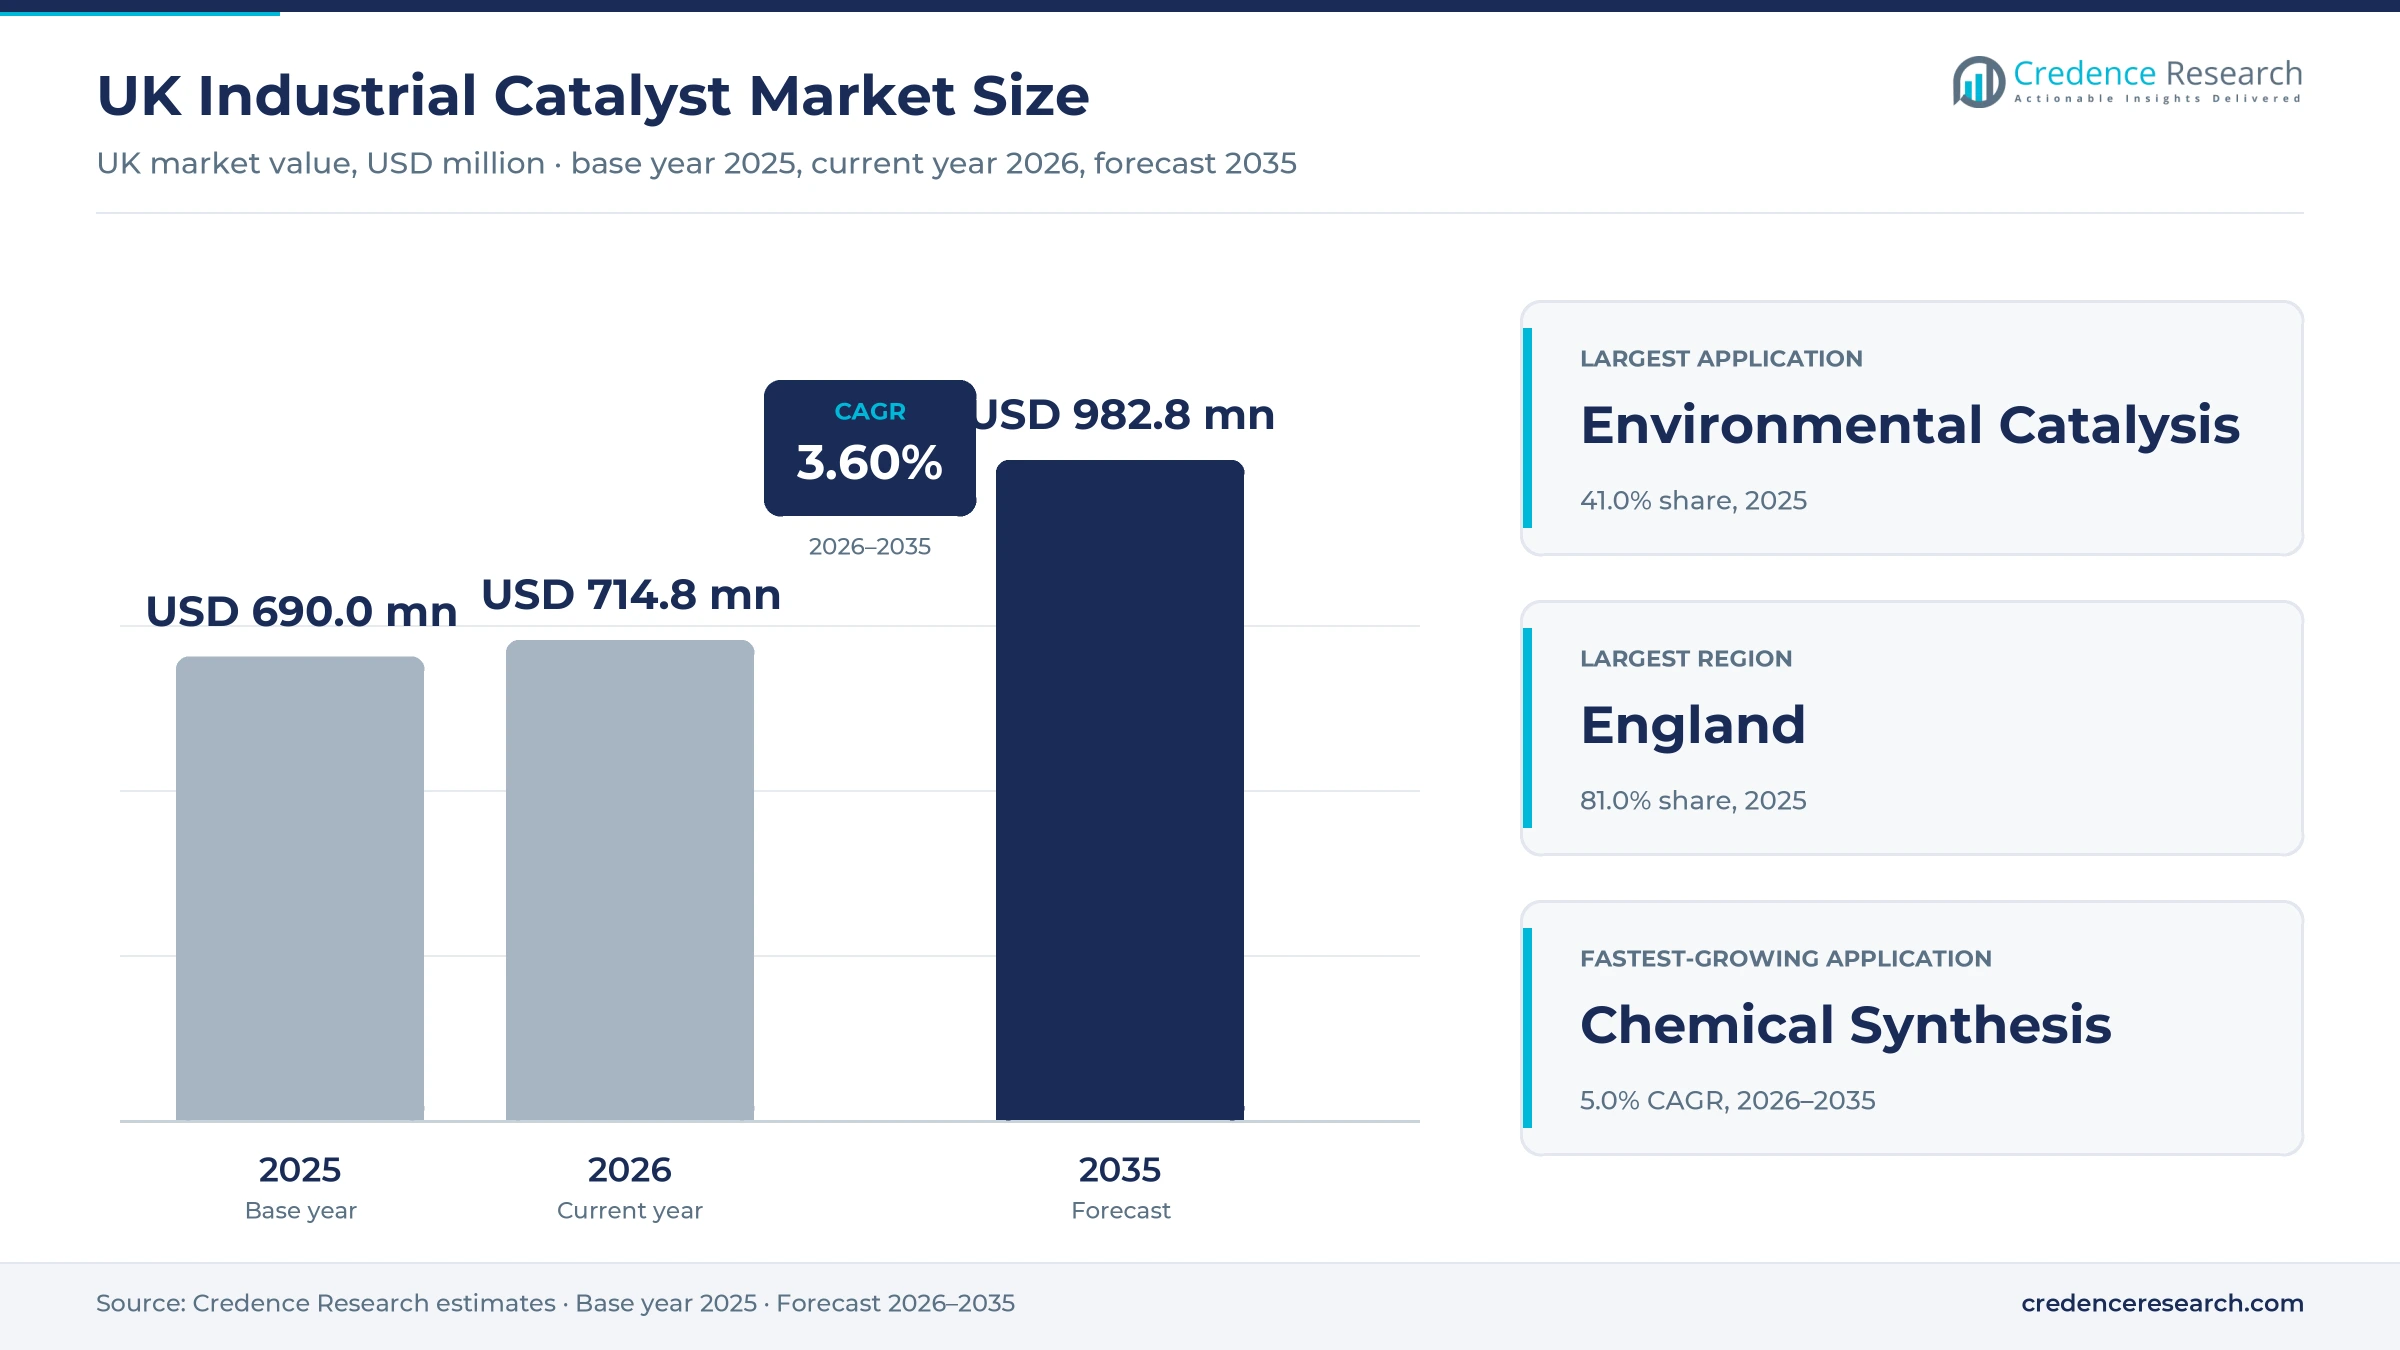
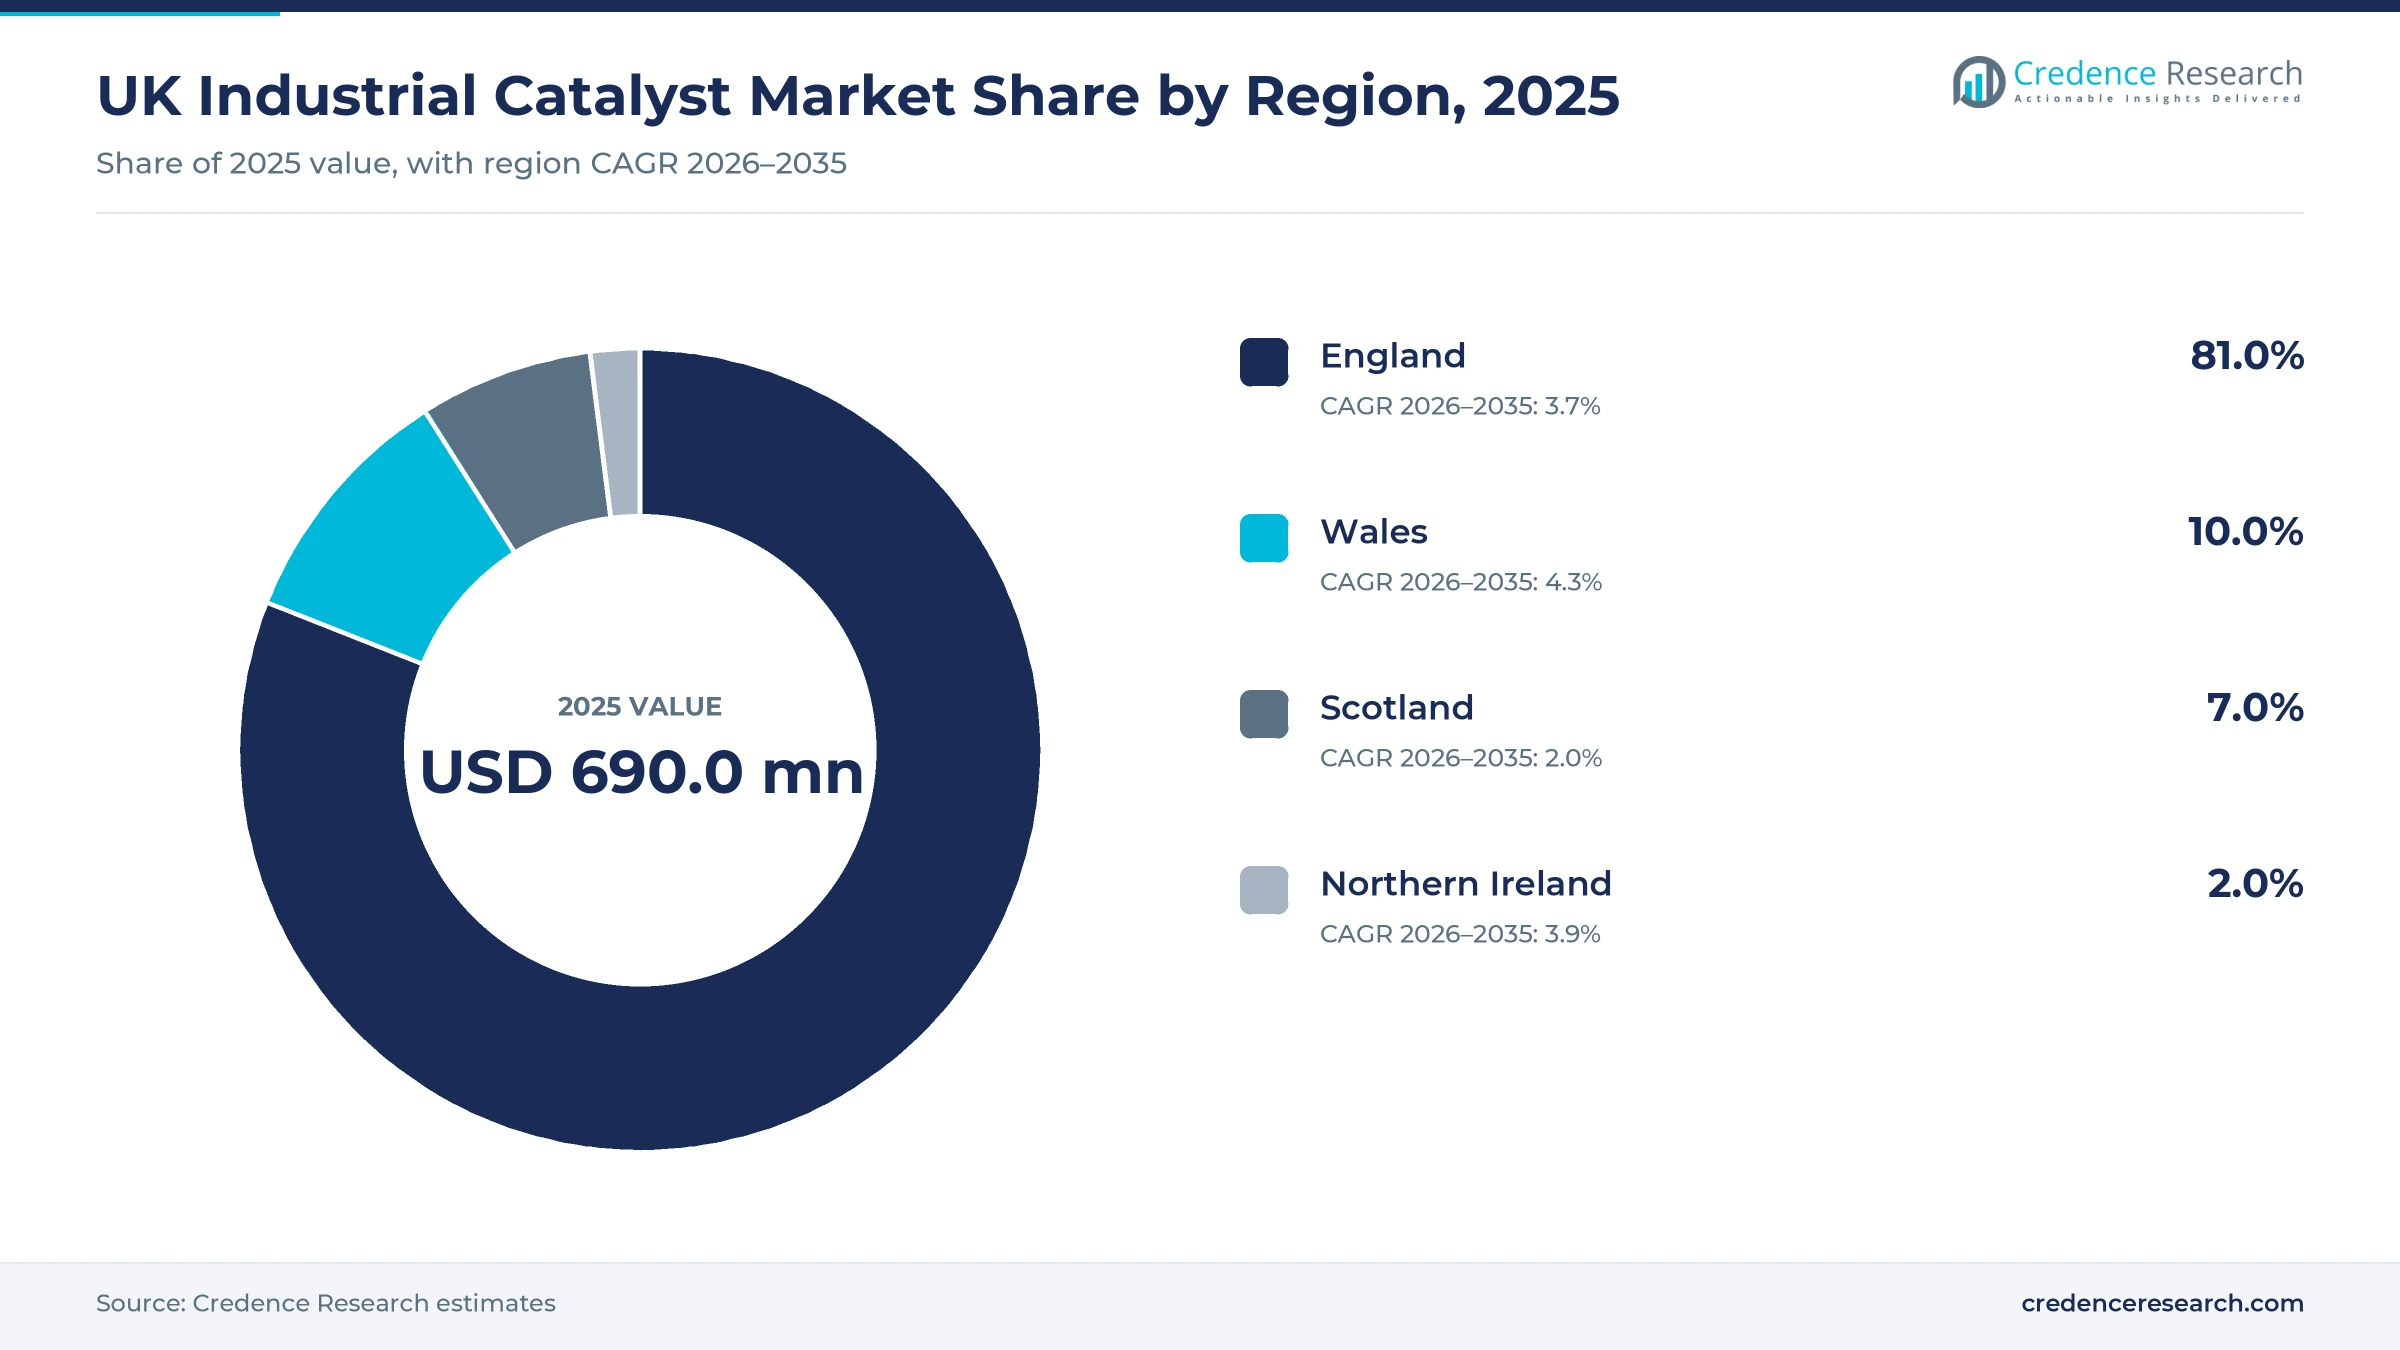
The U.K. industrial catalyst market was valued at USD 690.0 million in 2025 and is projected to increase from USD 714.8 million in 2026 to USD 982.8 million by 2035, registering a CAGR of 3.60% during 2026–2035. Demand comes from engine plants that fit exhaust catalysts, the four remaining crude oil refineries, chemical sites and drug plants. England held the largest regional share, 81.0% in 2025, because the Fawley, Stanlow and Humber refineries and most vehicle assembly sit there. Wales is the fastest-growing region at 4.2% a year, as hydrogen projects at Milford Haven add demand beside the Pembroke refinery. The main commercial change is a smaller fuels base, because Scotland's only refinery has stopped processing crude, which shifts catalyst spending toward hydrogen and synthetic aviation fuel.
Exhaust, refinery and synthesis catalysts are counted at first sale
The estimate counts the value of heterogeneous, homogeneous and enzyme catalysts sold to refineries, chemical and polymer plants, pharmaceutical manufacturers, vehicle and engine makers and operators of stationary combustion plants in the United Kingdom. Values sit at the first sale by the catalyst maker or importer and include the precious metal content of finished emission catalysts. Large buyers usually purchase on multiyear supply contracts tied to unit turnarounds or vehicle programs.
Process licensing fees, metal leasing charges, catalyst loading services and the recovered value of spent material sit outside the estimate, although they shape what buyers pay. The value chain runs from metal, zeolite and enzyme inputs through catalyst manufacture and coating to fixed-bed reactors, exhaust systems and fermentation lines, and it ends with spent catalyst recovery by precious metal refiners and base metal reclaimers.
UK Industrial Catalyst Market Insights
- The U.K. industrial catalyst market was valued at USD 690.0 million in 2025 and is projected to reach USD 982.8 million by 2035, registering a CAGR of 3.60% during 2026–2035.
- England held 81.0% of 2025 value, because the Fawley, Stanlow and Humber refineries, the Teesside chemical cluster and most vehicle plants sit there.
- Environmental Catalysis led with 41.0% of 2025 value, as U.K. plants built 717,371 cars and 1.6 million engines in 2025 that need exhaust aftertreatment.
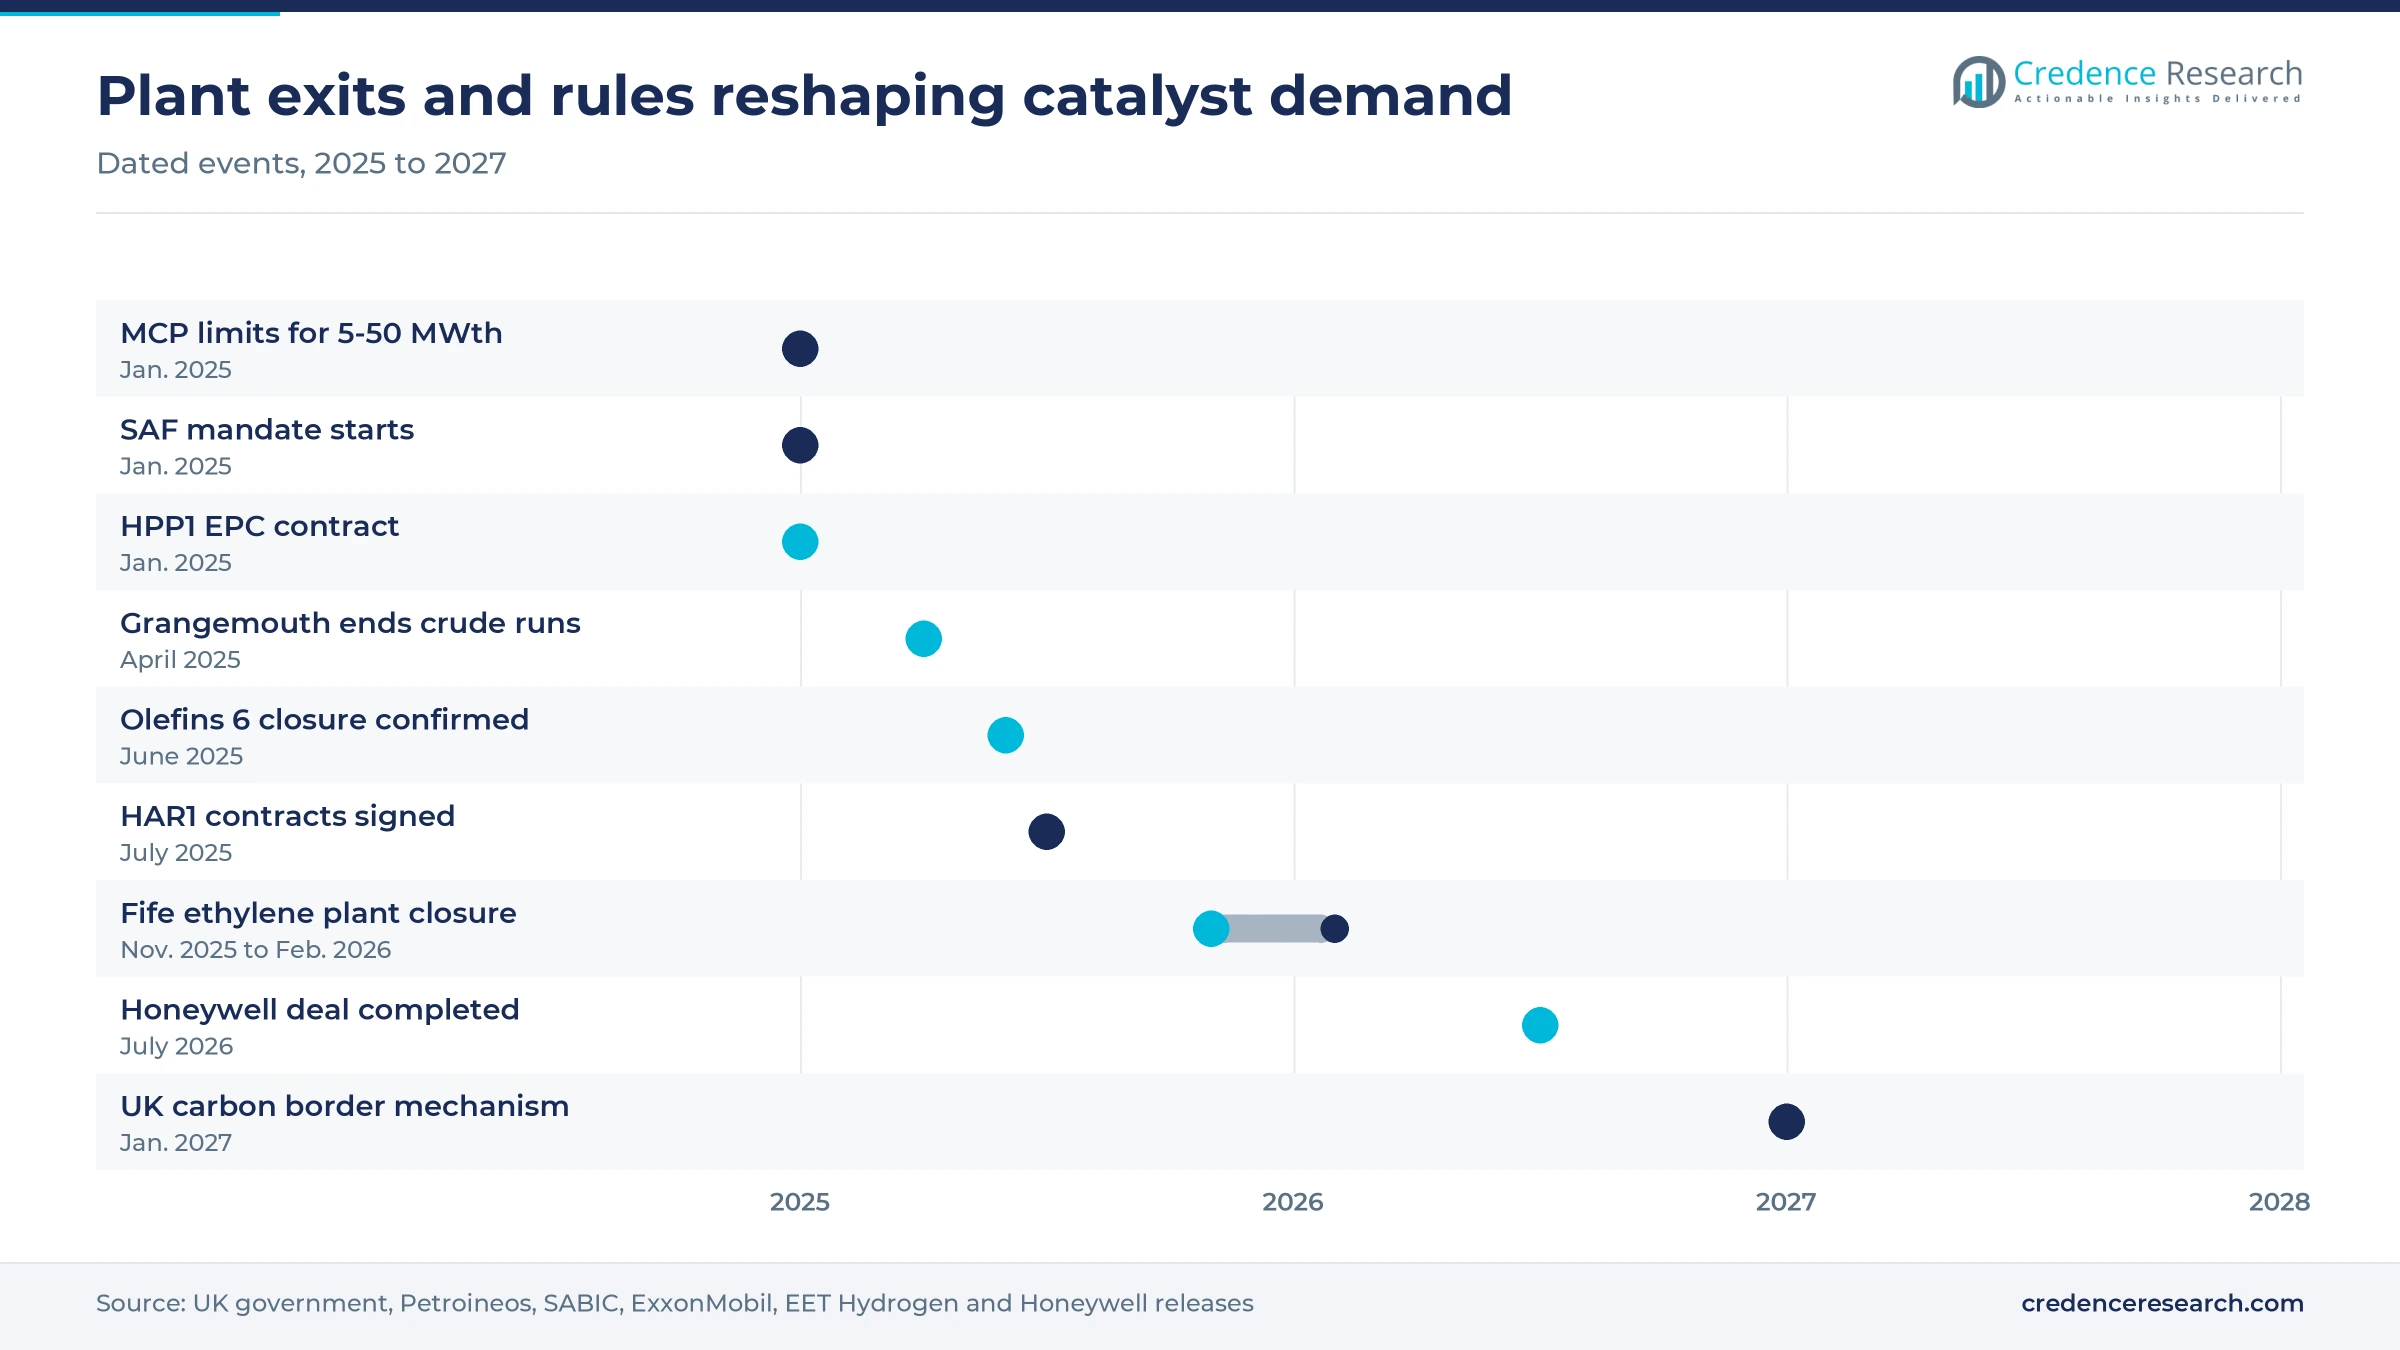
- Grangemouth stopped processing crude oil in April 2025 and became an import terminal, which removed Scotland from the refinery catalyst market.
- Honeywell completed its purchase of the Johnson Matthey Catalyst Technologies business in July 2026, which moves a major British syngas catalyst supplier under U.S. ownership.
Environmental catalysis leads while chemical synthesis grows
Why do heterogeneous catalysts hold most of the value?
Based on type, the market is categorized into heterogeneous catalysts, homogeneous catalysts and biocatalysts. Heterogeneous Catalysts led with 74.0% of 2025 value because fixed-bed and washcoated solids serve refinery hydrotreaters, fluid catalytic crackers, nitric acid plants and vehicle exhausts, and U.K. refineries still produced 48 million metric tons of products in 2025, according to the Digest of U.K. Energy Statistics. Biocatalysts grow fastest at 4.9% a year as drug makers adopt enzyme steps for chiral intermediates, and BRAIN Biotech's Biocatalysts Ltd added large-scale freeze-drying at its Cardiff enzyme plant in November 2023.
Why does environmental catalysis lead as chemical synthesis grows?
Based on application, the market is categorized into petroleum refining, chemical synthesis, environmental catalysis, polymer production and pharmaceutical synthesis. Environmental Catalysis led with 41.0% of 2025 value because three-way, oxidation and reduction catalysts carry platinum group metals, and U.K. plants built 717,371 cars and 1.6 million engines in 2025, SMMT data compiled by the MTA show. Chemical Synthesis grows fastest at 5.0% a year as low-carbon hydrogen plants need reforming and shift catalysts, led by the 350 MW HPP1 project at Stanlow, whose developer signed an EPC contract with ENKA in January 2025.
Why do metal catalysts lead while chemical compounds grow fastest?
Based on material, the market is categorized into metals, zeolites, chemical compounds and organometallic materials. Metals led with 54.0% of 2025 value because platinum, palladium, rhodium, nickel and cobalt form the active sites in emission, reforming and hydrogenation catalysts, and Johnson Matthey describes itself as the largest secondary refiner of platinum group metals in the world. Chemical Compounds grow fastest at 4.7% a year as existing 1 to 5 MWth boilers must meet emission limits by Jan. 1, 2030 under U.K. medium combustion plant rules, which favors oxide-based abatement catalysts.
| Segment Group | Leading Sub-segment | Share, 2025 | Fastest-growing Sub-segment | CAGR, 2026–2035 |
|---|---|---|---|---|
| By Type | Heterogeneous Catalysts | 74.0% | Biocatalysts | 4.9% |
| By Application | Environmental Catalysis | 41.0% | Chemical Synthesis | 5.0% |
| By Material | Metals | 54.0% | Chemical Compounds | 4.7% |
Metal prices and energy costs set what catalyst buyers pay
Catalyst pricing splits into a metal component and a manufacturing component. Emission, reforming and hydrogenation catalysts that use platinum group metals pass the metal through at market value or lease it, while zeolite and base metal catalysts sell per metric ton on multiyear contracts. Platinum averaged USD 1,278 per troy ounce in 2025, up from USD 955 in 2024, World Bank data show, which raised the value of each exhaust and process catalyst without changing volumes. European natural gas averaged USD 11.96 per mmbtu in 2025, which keeps calcination and hydrogen costs high. Buyers that lease metal limit cash exposure, while suppliers earn their margin on coating, formulation and recovery.
| Input or product | Typical price or fee | Basis |
|---|---|---|
| Platinum, 2025 annual average | USD 1,278 per troy ounce | World Bank Pink Sheet, January 2026 |
| Platinum, 2024 annual average | USD 955 per troy ounce | World Bank Pink Sheet, January 2026 |
| Natural gas, Europe, 2025 average | USD 11.96 per mmbtu | World Bank Pink Sheet, January 2026 |
| FCC catalyst delivered to a refinery | About USD 3,000-5,000 per metric ton | Credence Research estimate from zeolite and rare earth input costs |
| Exhaust catalyst for a petrol car | About USD 250-450 per vehicle | Credence Research estimate from PGM loadings and 2025 metal prices |
Request a Free Sample
Fill in your details and we'll send you a free sample report.
- Sample data tables & charts
- Research methodology
Engines, combustion rules, SAF and hydrogen lift demand
Engine and hybrid output sustains exhaust catalyst demand
Engine plants keep the largest single pool of catalyst value in the country, because every petrol, diesel and hybrid powertrain needs a coated converter or particulate filter. U.K. engine output rose 1% to 1.6 million units in 2025, and about 65% of those engines were exported directly, according to SMMT data. Of the 717,371 cars built that year, 298,813 were battery electric, plug-in hybrid or hybrid models, and the hybrids among them still carry full exhaust aftertreatment. Around 77% of U.K.-built cars were exported, with the EU taking 57% of them, so European emission rules set the catalyst specification. Coaters that hold platform approvals with engine makers therefore keep steady volumes even as domestic car output falls.
Combustion plant limits widen stationary emission catalysts
Emission limits for medium combustion plants widen demand for oxidation and selective catalytic reduction systems on boilers, engines and turbines at factories, hospitals and data centers. Existing plants of 5 to 50 MWth had to meet the limits by Jan. 1, 2025, and existing plants of 1 to 5 MWth must comply by Jan. 1, 2030, according to U.K. government guidance. Operators of the smaller plants need permits by Jan. 1, 2029, which brings retrofit decisions forward into the next three years. Chemical Compounds grow fastest at 4.7% a year in the Credence Research model, helped by these retrofits. Suppliers that pair abatement catalysts with monitoring and permit support can win a long tail of small sites.
The aviation fuel mandate lifts hydroprocessing catalyst use
The SAF mandate requires 2% of U.K. jet fuel to be sustainable in 2025, about 230,000 metric tons, rising to 10% in 2030 and 22% in 2040, which creates demand for hydrotreating and isomerization catalysts. HEFA fuel made from waste oils and fats may supply up to 100% of the obligation in 2025 and 2026, so existing hydroprocessing units are the first route. Phillips 66 says its Humber refinery co-processes waste oils into bio-propane, bio-gasoline and sustainable aviation fuel. Co-processing shortens catalyst cycles, because waste lipids carry oxygen, phosphorus and metals that deactivate active sites. Refiners that run waste feeds therefore buy guard beds and replace hydrotreating catalysts more often.
Hydrogen production contracts add reforming and shift catalysts
Low-carbon hydrogen contracts add demand for reforming, shift, methanation and electrolysis catalysts at sites that previously bought none. Ten projects from the first hydrogen allocation round signed production contracts on July 23, 2025, backed by more than GBP 400 million of private investment, according to the U.K. government. These projects can access more than GBP 2 billion of revenue support over 15 years, from Teesside and Trafford to Milford Haven and Cromarty. The U.K. carbon border mechanism will cover imported hydrogen and fertilizer from Jan. 1, 2027, which favors domestic hydrogen production. Catalyst and electrode suppliers that qualify early with these developers lock in first fills and replacement cycles.
Refinery exits and metal recovery reshape catalyst buying
Refiners shift from crude processing toward imports
U.K. fuel supply is shifting from domestic crude processing toward imported products, which shrinks the installed base of refinery catalysts. Petroineos ended crude processing at Grangemouth in April 2025 and turned the site into an import terminal, cutting staff from 475 to 75, Hydrocarbon Processing reported. The 113,000 barrel-a-day Lindsey refinery followed after its owner entered insolvency, and the energy minister announced its closure on July 22, 2025. Refinery output fell to 48 million metric tons in 2025, 18% below 2019, while product imports rose 3.6%, government energy statistics show. Suppliers of cracking and reforming catalysts now serve four refineries, so each lost turnaround order weighs more on their U.K. sales.
Spent catalyst recovery is rising with metal prices
Buyers are shifting toward closed-loop contracts that return spent catalyst for metal recovery. The platinum price rise shown in the pricing table lifted the recovery value of exhausted emission catalysts. Johnson Matthey, which kept its metal refining business after the July 2026 catalyst sale, smelts and refines spent catalysts and chemical residues to recover platinum group metals, the company says. London Chemicals and Resources says it uses roasting, leaching and hydrometallurgical recovery on spent catalysts from U.K. refineries and chemical plants to reclaim molybdenum, vanadium, nickel and cobalt. Spent hydroprocessing catalyst concentrates at four refineries, Fawley and Pembroke at about 270,000 barrels a day each, Humber at 221,000 and Stanlow at about 296,000. Refiners that tender handling, transport and recovery together lower net catalyst costs and waste volumes.
Synthetic fuel plants create a Fischer-Tropsch catalyst opening
Synthetic fuel plants open a new market for Fischer-Tropsch, reforming and hydrocracking catalysts, because the SAF mandate limits how much of the obligation waste-oil fuel can meet over time. The HEFA share of the main obligation falls to 71% in 2030 and 35% in 2040, while a power-to-liquid obligation starts at 0.2% in 2028 and reaches 3.5% in 2040, the government guide states. Willis Sustainable Fuels selected the FT CANS process of Johnson Matthey and bp in March 2025 for a planned Teesside plant of about 14,000 metric tons a year, due to start in 2028. Licensors that sell process technology with first catalyst fills stand to win these early plants.
Drug makers create openings for enzyme catalysis
Pharmaceutical and fine chemical producers create openings for engineered enzymes that replace metal-catalyzed or high-temperature steps in chiral synthesis. Almac says it built a biocatalysis group in Craigavon, launched carbonyl reductase, transaminase and nitrilase screening kits, and committed a further USD 4 million to enzyme research and development. Biocatalysts Ltd, part of BRAIN Biotech since 2018, makes enzymes for food, beverage and life science buyers in Cardiff, and the expansion noted above added large-scale drying capacity there. Biocatalysts grow fastest at 4.9% a year in U.K. catalyst demand through 2035. Enzyme suppliers that offer screening, scale-up and regulatory files alongside the enzyme itself can win contract manufacturing work from drug developers.
Cracker closures, energy costs and EV rules limit growth
Ethylene cracker closures cut polymer catalyst volumes
Two ethylene cracker closures remove much of the U.K. feedstock base for polymerization catalysts. SABIC confirmed in June 2025 that it will permanently close its Olefins 6 cracker at Wilton, offline since 2020, while its LDPE plant buys feedstock externally. ExxonMobil announced on Nov. 18, 2025 that it would close the Fife Ethylene Plant by February 2026, affecting 179 staff and about 250 contractors. Suppliers of polyolefin catalysts and cracker hydrogenation catalysts are most exposed.
Falling chemical output and energy costs erode demand
Chemical output losses reduce demand for synthesis catalysts across the country. The Chemical Industries Association said in February 2026 that U.K. chemical production fell nearly 40% between 2021 and 2024, with energy prices up to four times those of key competitors. Vivergo's 416 million liter Saltend bioethanol plant was set to shut in August 2025 after the government refused aid. Enzyme and synthesis catalyst suppliers that rely on a few large plants face the sharpest losses.
Carbon costs squeeze the remaining refineries
Carbon costs squeeze the cash that the four remaining refineries can spend on catalyst upgrades and turnarounds. Fuels Industry U.K. says these refineries pay up to GBP 400 million a year for the carbon they emit, a cost that rivals in the United States, the Middle East and India do not face, Forecourt Trader reported in February 2026. Refinery catalyst suppliers are most exposed, because operators facing losses tend to stretch cycle lengths and defer reloads.
Electric car targets erode exhaust catalyst volumes
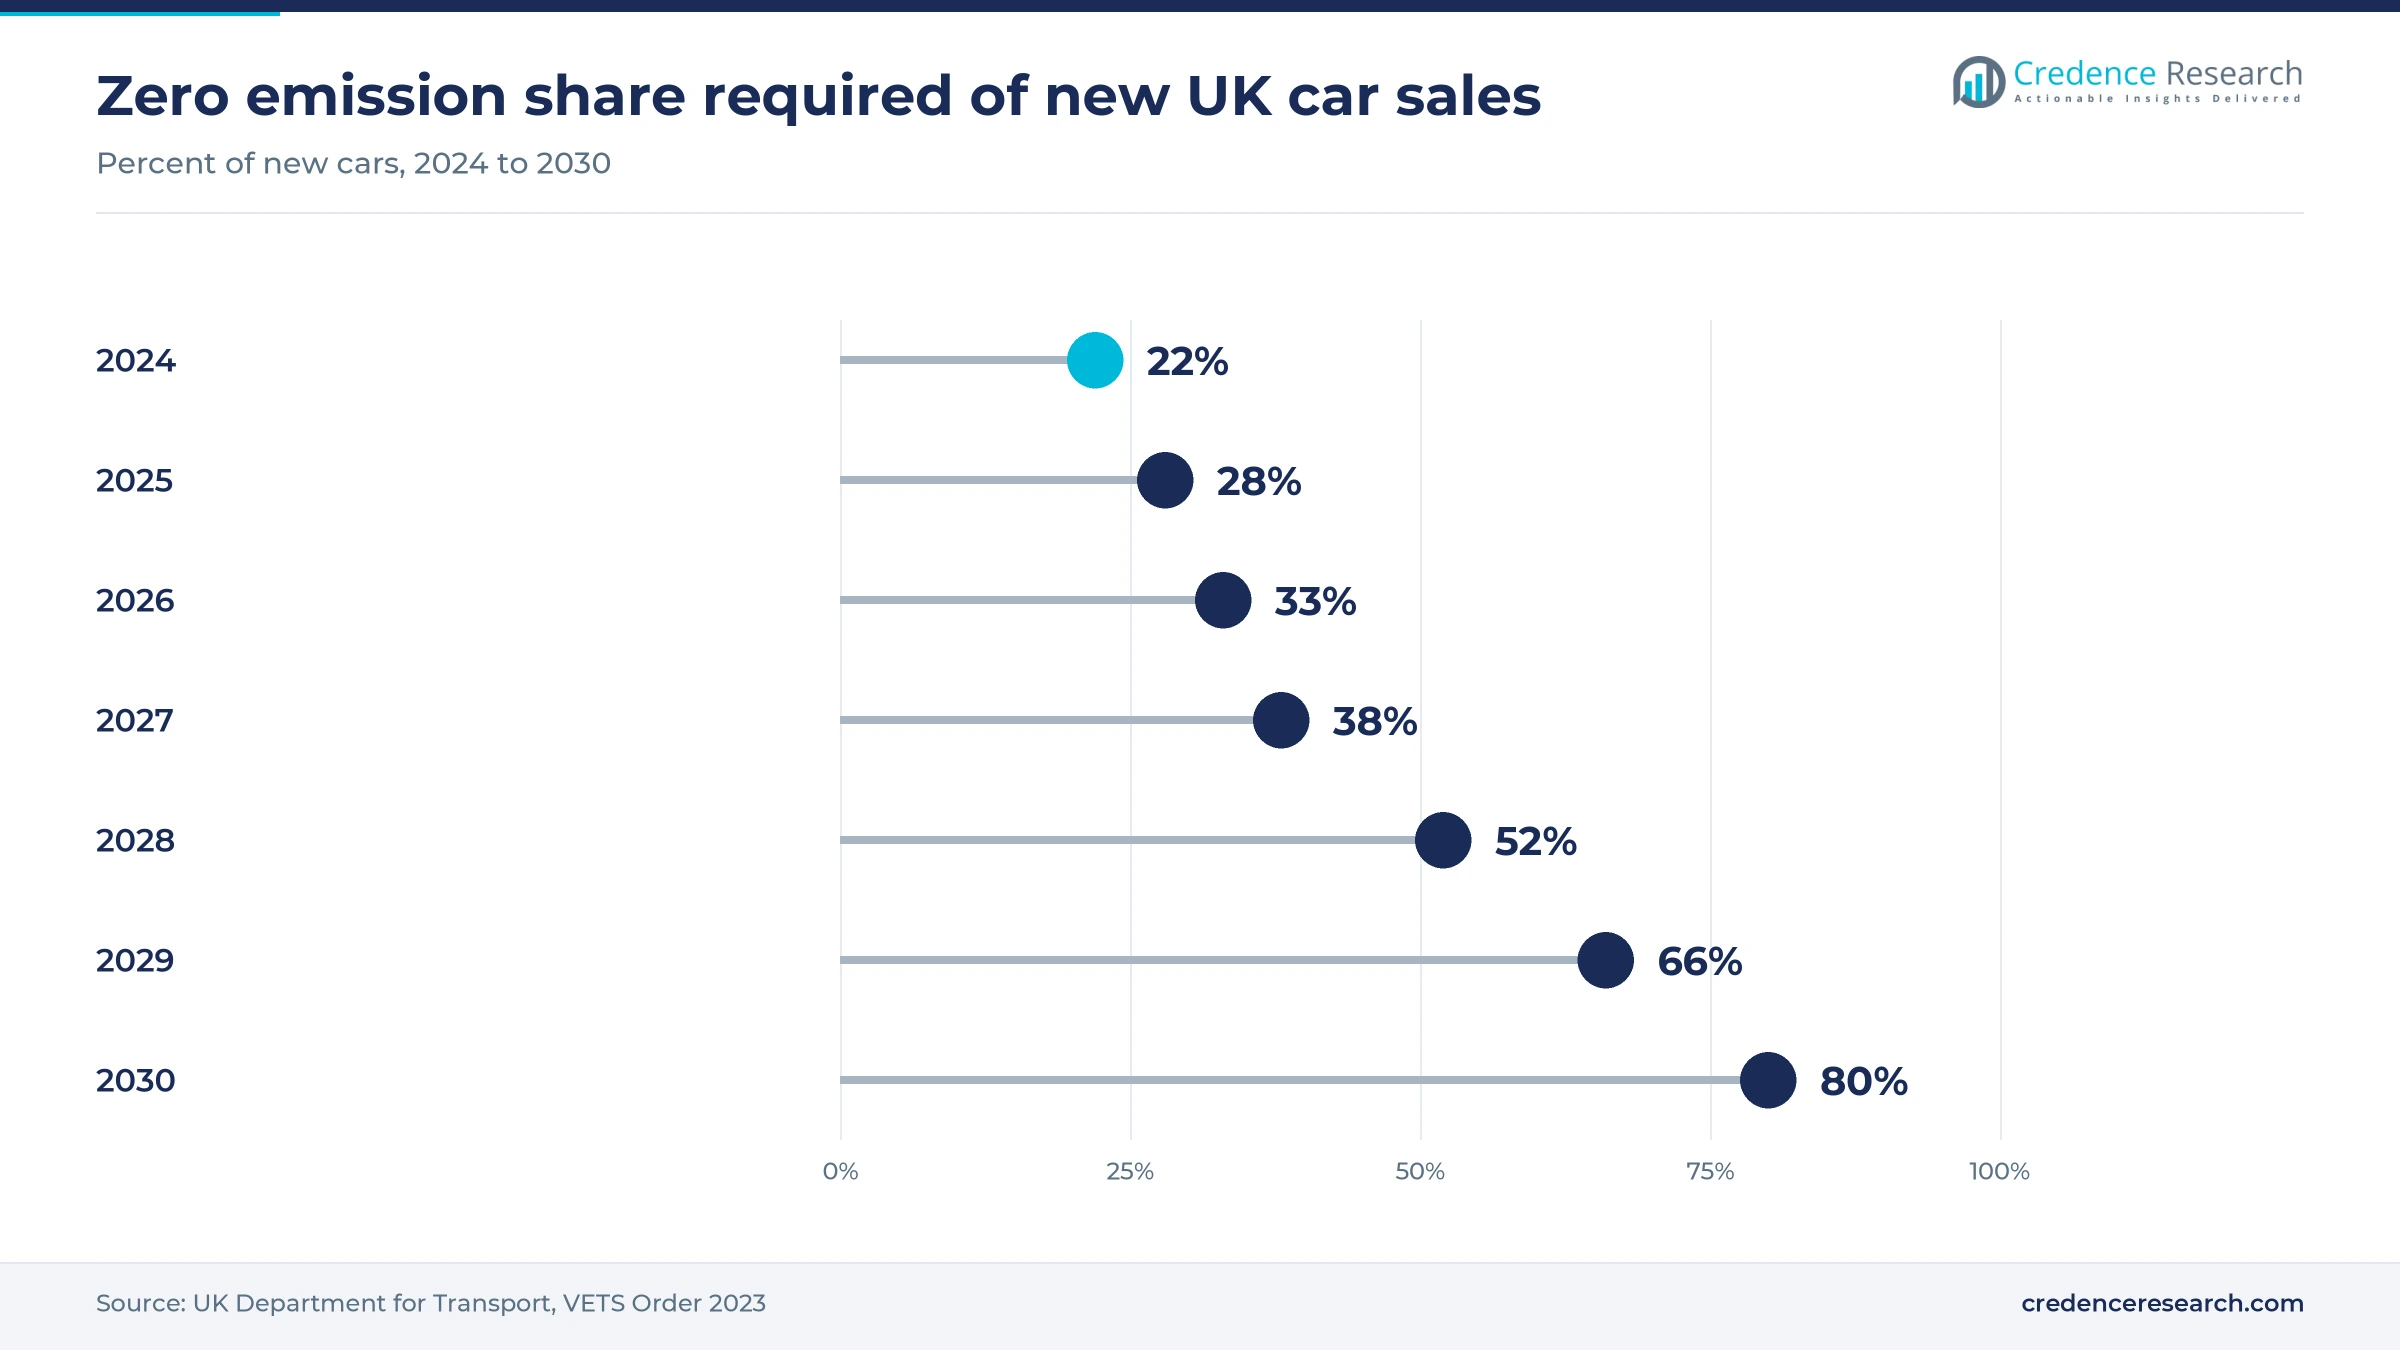
The zero emission vehicle mandate reduces the share of new cars sold in the U.K. with exhaust catalysts every year. The target rises from 28% of new cars in 2025 to 33% in 2026 and 80% in 2030, with vans at 70% in 2030, U.K. government data show. Coaters that depend on domestic sales of petrol and diesel models are most exposed, while plants that export hybrid powertrains to the EU retain volume longer.
England leads on refining while Wales grows the fastest
| Region | Value, 2025 (USD million) | Share, 2025 | CAGR, 2026–2035 |
|---|---|---|---|
| England | 558.9 | 81.0% | 3.6% |
| Wales | 69.0 | 10.0% | 4.2% |
| Scotland | 48.3 | 7.0% | 1.9% |
| Northern Ireland | 13.8 | 2.0% | 3.9% |
England leads on refineries, engines and hydrogen projects
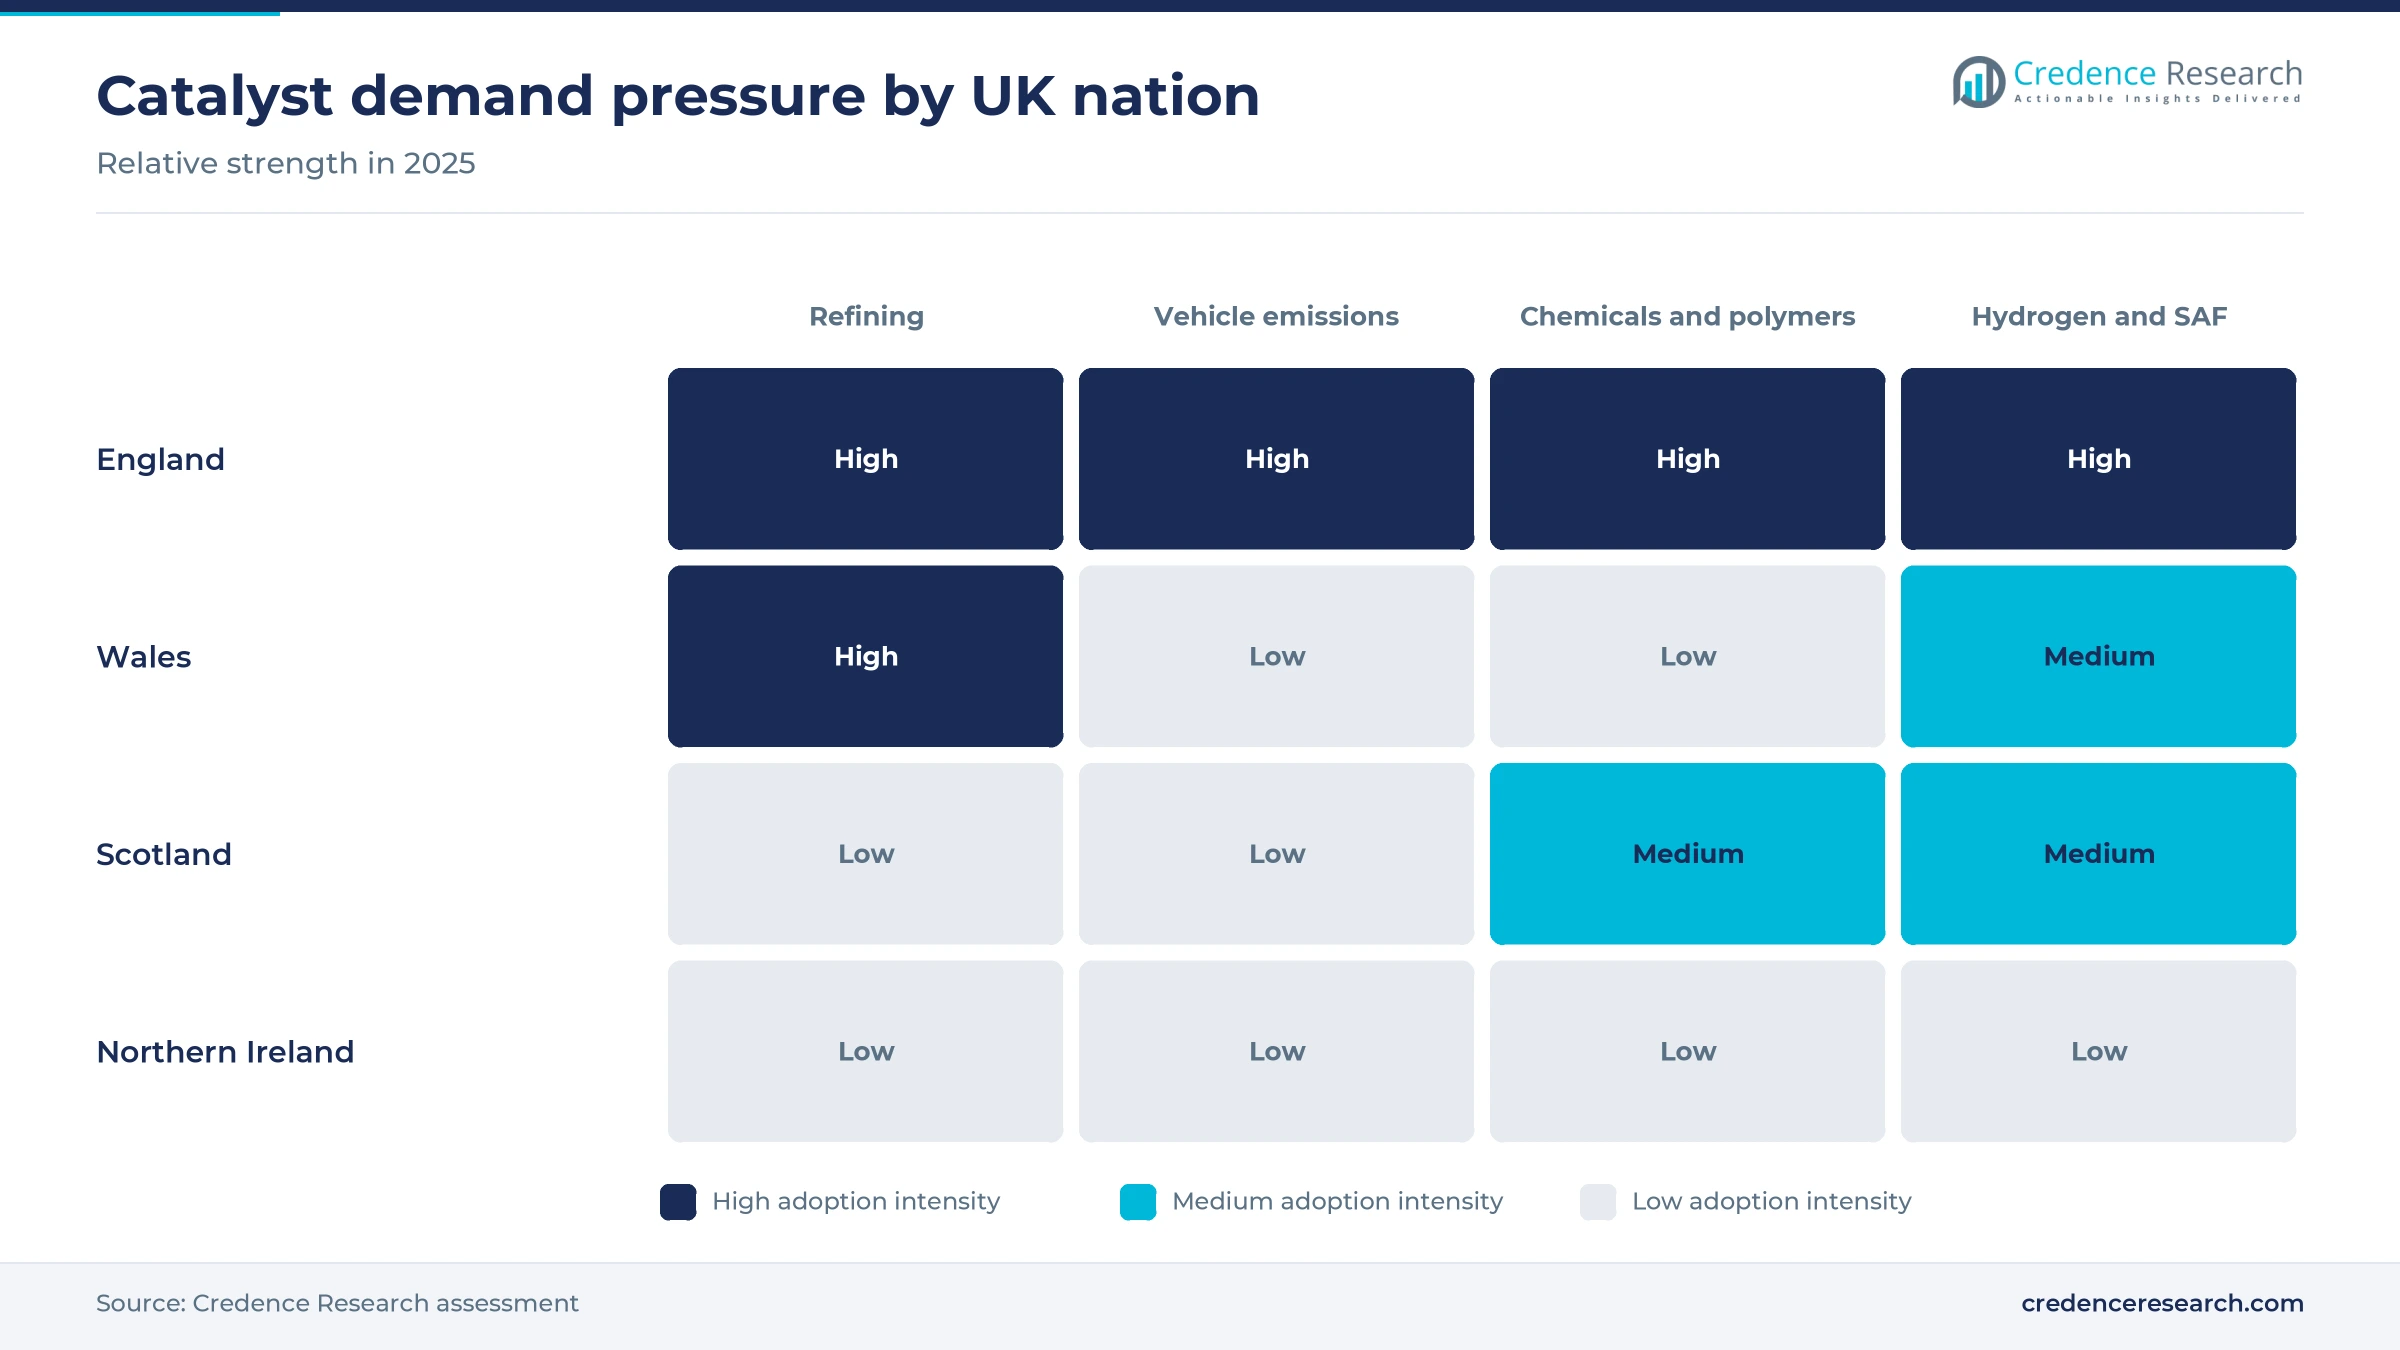
England held 81.0% of 2025 U.K. catalyst demand and grows at 3.6% a year through 2035. Three of the four remaining refineries, Fawley, Stanlow and Humber, operate there alongside most car and engine plants. Most of the first-round hydrogen projects described above sit in England, including Tees Green at Redcar, Trafford, Bradford and Langage near Plymouth. Teesside and Merseyside also concentrate nitric acid, specialty chemical and pharmaceutical sites that buy synthesis catalysts, although the Wilton cracker exit trims polymer demand in the North East.
Wales grows fastest on hydrogen and enzyme production
Wales held 10.0% of 2025 catalyst demand and grows fastest at 4.2% a year among the four nations. The Valero refinery at Pembroke remains one of the four U.K. sites with fixed-bed catalyst demand. The West Wales Hydrogen Project at Milford Haven is one of the first-round hydrogen projects with a government contract, which adds electrolysis demand near the refinery. Cardiff hosts the BRAIN Biotech enzyme plant noted above, and its local production supports the fastest enzyme segment. Public data on Welsh catalyst purchases are not available, so this share carries a wide error range.
Scotland contracts after the refinery and cracker exits
Scotland held 7.0% of 2025 catalyst demand and grows at 1.9% a year, the slowest regional rate. The Grangemouth refinery shutdown and the Fife cracker closure described above removed its two largest catalyst buyers. Growth now rests on hydrogen, as the Cromarty project in the northeast uses three 5 MW electrolyzers and Whitelee near Kilmarnock also holds a first-round government contract. Chemical plants that remain at Grangemouth keep some demand for synthesis and emission catalysts.
Northern Ireland relies on pharmaceutical synthesis
Northern Ireland held 2.0% of 2025 catalyst demand and grows at 3.9% a year through 2035. It has no refinery or cracker, so its catalyst use centers on drug and fine chemical synthesis. The Almac biocatalysis group in Craigavon described above is the main local buyer and developer of engineered enzymes. The U.K. carbon border mechanism applies in Northern Ireland from Jan. 1, 2027, according to government guidance. Public data on catalyst demand in Northern Ireland are thin, so this share is a Credence Research estimate.
Refinery exits, hydrogen contracts and a takeover since 2025
| Development | Status and market relevance |
|---|---|
| In January 2025, EET Hydrogen signed an engineering, procurement and construction contract with ENKA for the 350 MW HPP1 plant at Stanlow. | Contract signed after government funding approval in October 2024; a final investment decision was not confirmed in the public sources reviewed. |
| In March 2025, Willis Sustainable Fuels selected the FT CANS process of Johnson Matthey and bp for a Teesside SAF plant. | Technology selection; the plan targets about 14,000 metric tons a year from 2028 with Advanced Fuels Fund support. |
| In April 2025, Petroineos ended crude oil processing at Grangemouth and converted the site to an import terminal. | Completed; removes a refinery from the U.K. catalyst base and leaves four refineries in operation. |
| In July 2025, 10 hydrogen production projects from the first allocation round signed contracts with the U.K. government. | Contracts signed; projects move to construction and create first-fill demand for electrolysis and process catalysts. |
| In July 2026, Honeywell completed its purchase of the Johnson Matthey Catalyst Technologies business for GBP 1.325 billion. | Completed acquisition; combines syngas, hydrogen and Fischer-Tropsch catalyst lines with Honeywell process technology. |
Supports, washcoats and synthesis routes set catalyst value
- Catalyst supports such as alumina, silica, titania and zeolites carry the active metal in chemical manufacture and set surface area, pore size and resistance to heat.
- Washcoat formulation spreads platinum group metals over ceramic or metal substrates in exhaust converters, so suppliers compete on metal loading per vehicle.
- Fischer-Tropsch catalysts convert syngas from biomass or captured carbon into liquid hydrocarbons, which hydrocracking then upgrades to jet fuel.
- Enzyme immobilization fixes engineered enzymes on carriers so drug makers can reuse them across batches and cut cost per kilogram of product.
Need a Custom Version of This Report?
Tailor the scope, geography, or segments to your exact requirements.
- Custom geography or segment scope
- Direct access to our analyst team
Global licensors and coaters compete for few large buyers
Competition turns on process licenses, engine platform approvals and metal management rather than on price lists. Johnson Matthey, BASF and Umicore compete for exhaust catalyst programs with engine makers, where approvals last for the life of a model. Honeywell Technologies widened its catalyst range across refining, petrochemicals and renewable fuels when it completed the Johnson Matthey Catalyst Technologies acquisition in July 2026. Topsoe and Clariant compete in hydrogen and chemical catalysts, while Grace and Ketjen supply refinery cracking and hydroprocessing grades to the four remaining refineries. Evonik sells activated metal catalysts for hydrogenation, while Novonesis and Biocatalysts Ltd supply enzymes to food, fuel and drug makers. Public data on supplier shares in the U.K. are not available, so market shares remain an evidence gap. The 11 companies profiled below cover emission, process and enzyme catalysts sold to U.K. buyers.
How concentrated is the catalyst supply side?
Supply is concentrated in a few global groups with distinct roles. Emission catalysts come from coaters such as Johnson Matthey, BASF and Umicore, which hold engine platform approvals and handle precious metals. Process catalysts for refining, syngas and chemicals come from licensors and specialists, including Honeywell, Topsoe, Clariant, Grace and Ketjen. Novonesis and Biocatalysts Ltd supply the enzymes used in food, fuel and drug processing. Entry barriers sit in reactor qualification runs, process licenses and metal handling permits, so buyers rarely switch suppliers mid-cycle. Margins are highest in licensed process catalysts and metal recovery, and thinnest in commodity cracking catalysts.
Companies profiled and their roles in this market
| Company | Type | Role in the market |
|---|---|---|
| Johnson Matthey PLC | Emission catalyst and PGM specialist | Supplies exhaust catalysts and refines platinum group metals from spent catalysts |
| Honeywell Technologies | Process technology licensor | Sells refining, syngas, hydrogen and Fischer-Tropsch catalysts after the JM deal |
| BASF SE | Full-line supplier | Supplies emission, refinery and chemical process catalysts |
| Umicore | Emission catalyst specialist | Supplies automotive exhaust catalysts for light and heavy-duty engines |
| Topsoe A/S | Process technology licensor | Supplies hydroprocessing, hydrogen, ammonia and emission control catalysts |
| Clariant AG | Specialty supplier | Supplies syngas, petrochemical and polymer process catalysts |
| W. R. Grace & Co. | Refining and polyolefin specialist | Supplies FCC catalysts and polyolefin polymerization catalysts |
| Ketjen | Refining specialist | Supplies FCC and hydroprocessing catalysts to refiners |
| Evonik Industries AG | Specialty supplier | Supplies activated base metal and precious metal hydrogenation catalysts |
| Novonesis | Enzyme maker | Supplies industrial enzymes for food, fuel ethanol and chemical processing |
| Biocatalysts Ltd (BRAIN Biotech) | Local enzyme manufacturer | Makes enzymes for food, beverage and life science buyers in Cardiff |
Catalyst spending moves from fuels toward new molecules
Credence Research's view is that U.K. catalyst spending is moving from fuels and olefins toward hydrogen, synthetic fuels, stationary emission control and pharmaceutical enzymes. The closures of Grangemouth, Lindsey and two crackers remove volume that new projects will only partly replace before 2030. Suppliers that sell technology, first fills and metal recovery as one package will win the new plants, while those tied to commodity cracking catalysts face a shrinking customer list. Buyers should secure recovery terms and metal leases before precious metal prices move again.
Earlier estimate re-tested against refinery and car output
The report uses 2025 as the base year and forecasts to 2035. The earlier Credence Research estimate was tested against refinery output, vehicle and engine production, platinum prices and recent plant closures, and the base was re-estimated from these inputs. Regional and segment shares are Credence Research estimates based on refinery locations, vehicle plants, chemical sites and hydrogen projects. Sources include U.K. government statistics and guidance, the World Bank, trade associations and company releases. No interviews or surveys were conducted for this update of the estimate.
Hydrogen, synthetic fuels and enzymes carry growth to 2035
Growth in U.K. industrial catalyst demand to 2035 depends on whether the four remaining refineries keep running and on how many hydrogen and synthetic fuel projects reach construction. The base case assumes no further refinery closures and start-up of the first hydrogen round projects later this decade. Chemical synthesis and enzyme catalysts should gain share, while polymer and car exhaust catalysts lose ground as cracker capacity shrinks and electric car targets rise. Wales and England gain from hydrogen projects, while Scotland grows at about half the national rate.
Plant closures and hydrogen build-out set the range of outcomes
The range of outcomes depends on whether more refineries and chemical sites close and on how many hydrogen and synthetic fuel projects reach construction. Further closures and slower hybrid output would cut process and emission catalyst volumes. A second hydrogen round and synthetic fuel plants on Teesside and Merseyside would add new first fills that offset the shrinking fuels base.
| Scenario | CAGR, 2026–2035 | Value, 2035 | What has to hold |
|---|---|---|---|
| Downside | 2.1% | USD 861.9 million | Another refinery or chemical site closes and hybrid engine output falls |
| Base | 3.60% | USD 982.8 million | Four refineries keep running and HAR1 projects start up on schedule |
| Upside | 4.9% | USD 1.10 billion | Further hydrogen rounds and Fischer-Tropsch fuel plants reach construction |
Frequently Asked Questions
How big is the U.K. industrial catalyst market?
Which companies supply industrial catalysts in the U.K.?
Which application leads catalyst demand in the U.K.?
How are spent catalysts recycled in the U.K.?
Which catalyst supports are used in chemical manufacture?
Which region leads catalyst demand in the U.K.?
Which application grows fastest in the U.K. catalyst market?
How does the SAF mandate affect catalyst demand?
Table of Content
Chapter 1 Market Segmentation
- 1.1 Segmentation Framework
- 1.1.1 Product and Service Classification
- 1.1.2 Application and End-Use Classification
- 1.1.3 Technology and Solution Classification
- 1.1.4 Customer and Distribution Channel Classification
- 1.1.5 Geographic Segmentation
- 1.1.6 Market Segment Definitions and Boundaries
- 1.2 By Type
- 1.2.1 Heterogeneous Catalysts
- 1.2.2 Homogeneous Catalysts
- 1.2.3 Biocatalysts
- 1.3 By Application
- 1.3.1 Petroleum Refining
- 1.3.2 Chemical Synthesis
- 1.3.3 Environmental Catalysis
- 1.3.4 Polymer Production
- 1.3.5 Pharmaceutical Synthesis
- 1.4 By Material
- 1.4.1 Metals
- 1.4.2 Zeolites
- 1.4.3 Chemical Compounds
- 1.4.4 Organometallic Materials
Chapter 2 Introduction
- 2.1 Report Objectives and Scope
- 2.2 Product Definition and Industry Terminology
- 2.3 Market Inclusions and Exclusions
- 2.4 Research Process
- 2.4.1 Primary Research and Expert Interviews
- 2.4.2 Secondary Research and Source Review
- 2.4.3 Top-Down and Bottom-Up Estimation
- 2.4.4 Data Triangulation and Verification
- 2.5 Market Size Measurement Basis
- 2.5.1 2025: USD 690.0 million → 2035: USD 982.8 million
- 2.6 Historical and Forecast Reference Periods
- 2.6.1 Historical Period: 2018-2025
- 2.6.2 Base Year: 2025
- 2.6.3 Forecast Period: 2025-2035
- 2.7 Research Assumptions and Limitations
Chapter 3 Executive Summary
- 3.1 Market Snapshot and Key Findings
- 3.2 Base-Year Market Size, 2025
- 3.3 Forecast Market Size, 2035
- 3.4 Revenue and Volume Growth Outlook
- 3.5 Key Demand and Supply Indicators
- 3.6 Leading Market Segments
- 3.7 Fastest-Growing Market Opportunities
- 3.8 Regional Performance Highlights
- 3.9 Technology and Industry Transformation
- 3.10 Competitive Landscape Summary
- 3.11 Analyst View and Strategic Implications
Chapter 4 UK Industrial Catalyst Market Trends and Developments
- 4.1 Historical Industry Development, 2018-2025
- 4.2 Recent Market Trends and Developments
- 4.3 Demand and Customer Behavior Trends
- 4.4 Technology and Product Innovation
- 4.5 Artificial Intelligence, Automation and Digitalization
- 4.6 Local Manufacturing and Supply Chain Realignment
- 4.7 Industry Partnerships, Mergers and Acquisitions
- 4.8 Sustainability and Circular Economy Developments
- 4.9 Government and Private Sector Investment Trends
- 4.10 Emerging Business Models and Commercialization
- 4.11 Industry Developments and Announcements
Chapter 5 UK Industrial Catalyst Market Production, Supply and Demand Analysis
- 5.1 Demand Trend and Consumption Analysis, 2018-2025
- 5.2 Demand Forecast, 2025-2035
- 5.3 Production and Output Trend, 2018-2025
- 5.4 Production and Output Forecast, 2025-2035
- 5.5 Installed Capacity and Capacity Utilization
- 5.6 Company-Wise Production Plants and Statistics
- 5.6.1 Installed Production Capacity
- 5.6.2 Actual Production
- 5.6.3 Planned Capacity and Expansion Targets
- 5.7 Supply Chain Structure and Procurement Trends
- 5.8 Supply-Demand Gap and Bottlenecks
- 5.9 Import Dependence and Sourcing Structure
- 5.10 Contract Manufacturing and Outsourcing
- 5.11 Regional Supply and Demand Concentration
Chapter 6 UK Industrial Catalyst Market Pricing Analysis
- 6.1 Pricing Structure and Measurement
- 6.2 Historical Pricing Trends, 2018-2025
- 6.3 Pricing Outlook, 2025-2035
- 6.4 Average Selling Price and Unit Economics
- 6.5 Pricing by Product and Market Segment
- 6.6 Geographic Pricing Differences
- 6.7 Key Input, Energy, Labor and Logistics Costs
- 6.8 Contract Pricing and Purchasing Models
- 6.9 Pricing Sensitivity and Competitive Positioning
- 6.10 Price, Margin and Profitability Implications
Chapter 7 UK Industrial Catalyst Market Dynamics
- 7.1 Market Growth Drivers
- 7.1.1 Demand-Side Drivers
- 7.1.2 Technology and Innovation Drivers
- 7.1.3 Infrastructure and Investment Drivers
- 7.1.4 Regulatory and Policy Drivers
- 7.2 Market Restraints
- 7.2.1 Cost and Affordability Constraints
- 7.2.2 Technology and Adoption Barriers
- 7.2.3 Supply Chain and Operational Constraints
- 7.3 Market Challenges
- 7.3.1 Competitive Pressure and Margin Erosion
- 7.3.2 Skills, Infrastructure and Implementation Gaps
- 7.4 Emerging Market Opportunities
- 7.5 Market Dynamics Impact and Time-Horizon Assessment
Chapter 8 UK Industrial Catalyst Value Chain Analysis
- 8.1 Industry Value Chain Overview
- 8.2 Upstream Suppliers and Critical Inputs
- 8.3 Technology and Component Providers
- 8.4 Manufacturing or Service Delivery
- 8.5 Distribution, Channel Partners and Integrators
- 8.6 Downstream Applications and End Users
- 8.7 Value Addition and Profit Pools
- 8.8 Vertical Integration and Outsourcing
- 8.9 Supplier Concentration and Risk
- 8.10 Supply Chain Localization and Resilience
Chapter 9 UK Industrial Catalyst Market Regulations and Policies
- 9.1 Relevant Laws, Standards and Compliance Frameworks
- 9.2 Product, Service, Safety and Quality Requirements
- 9.3 Government Policies, Incentives and Subsidies
- 9.4 Imports, Exports and Trade Barriers
- 9.5 Public Procurement and Local Content Requirements
- 9.6 Environmental and Sustainability Compliance
- 9.7 Upcoming Policy Changes and Market Implications
Chapter 10 UK Industrial Catalyst Market Hotspots and Opportunities
- 10.1 Market Opportunity Mapping and Growth Hotspots
- 10.2 High-Growth Applications and Customer Groups
- 10.3 Underserved Markets and White-Space Opportunities
- 10.4 Emerging Technology and Product Opportunities
- 10.5 New Capacity and Investment Hotspots
- 10.6 Market Entry and Expansion Opportunities
- 10.7 Distribution and Partnership Opportunities
- 10.8 Near-Term and Long-Term Commercial Potential
- 10.9 Opportunity Attractiveness and Execution Risks
Chapter 11 UK Industrial Catalyst Market Outlook, 2025-2035
- 11.1 Market Size and Analysis
- 11.1.1 Revenue (Market Measurement: 2025: USD 690.0 million → 2035: USD 982.8 million)
- 11.1.2 Market Volume and Quantity Sold
- 11.1.3 Historical Market Size, 2018-2025
- 11.1.4 Base-Year Market Size, 2025
- 11.2 Market Forecast, 2025-2035
- 11.2.1 Revenue Forecast to 2035
- 11.2.2 Volume Forecast to 2035
- 11.2.3 CAGR and Year-on-Year Growth
- 11.2.4 Incremental Revenue Opportunity
- 11.3 Forecast Assumptions and Scenario Analysis
- 11.3.1 Base-Case Forecast
- 11.3.2 Optimistic and Conservative Scenarios
- 11.3.3 Technology, Pricing and Policy Sensitivities
- 11.4 Market Attractiveness and Growth Outlook
Chapter 12 UK Industrial Catalyst Market Segmentation and Outlook
- 12.1 Segmentation Summary and Market Shares, 2025
- 12.2 Largest and Fastest-Growing Segments
- 12.3 By Type - Market Size and Forecast, 2025-2035
- 12.3.1 Segment Definition and Scope
- 12.3.2 Historical Market Size, 2018-2025
- 12.3.3 Revenue Forecast, 2025-2035
- 12.3.4 Volume Forecast, 2025-2035
- 12.3.5 Base-Year Market Share, 2025
- 12.3.6 Segment CAGR and Growth Drivers
- 12.3.7 Subsegment Market Size and Forecast
- 12.3.7.1 Heterogeneous Catalysts
- 12.3.7.2 Homogeneous Catalysts
- 12.3.7.3 Biocatalysts
- 12.3.8 Subsegment Pricing and Adoption Trends
- 12.3.9 Leading Suppliers and Competition
- 12.3.10 Regional Demand and Opportunities
- 12.4 By Application - Market Size and Forecast, 2025-2035
- 12.4.1 Segment Definition and Scope
- 12.4.2 Historical Market Size, 2018-2025
- 12.4.3 Revenue Forecast, 2025-2035
- 12.4.4 Volume Forecast, 2025-2035
- 12.4.5 Base-Year Market Share, 2025
- 12.4.6 Segment CAGR and Growth Drivers
- 12.4.7 Subsegment Market Size and Forecast
- 12.4.7.1 Petroleum Refining
- 12.4.7.2 Chemical Synthesis
- 12.4.7.3 Environmental Catalysis
- 12.4.7.4 Polymer Production
- 12.4.7.5 Pharmaceutical Synthesis
- 12.4.8 Subsegment Pricing and Adoption Trends
- 12.4.9 Leading Suppliers and Competition
- 12.4.10 Regional Demand and Opportunities
- 12.5 By Material - Market Size and Forecast, 2025-2035
- 12.5.1 Segment Definition and Scope
- 12.5.2 Historical Market Size, 2018-2025
- 12.5.3 Revenue Forecast, 2025-2035
- 12.5.4 Volume Forecast, 2025-2035
- 12.5.5 Base-Year Market Share, 2025
- 12.5.6 Segment CAGR and Growth Drivers
- 12.5.7 Subsegment Market Size and Forecast
- 12.5.7.1 Metals
- 12.5.7.2 Zeolites
- 12.5.7.3 Chemical Compounds
- 12.5.7.4 Organometallic Materials
- 12.5.8 Subsegment Pricing and Adoption Trends
- 12.5.9 Leading Suppliers and Competition
- 12.5.10 Regional Demand and Opportunities
- 12.6 Segment Growth Comparison
- 12.7 Segment Attractiveness and Priority Matrix
Chapter 13 UK Industrial Catalyst End-Use and Application Market Outlook
- 13.1 End-Use Industry and Customer Demand Structure
- 13.2 Leading Applications and Customer Groups
- 13.3 End-Use Market Size, Share and Forecast
- 13.4 Major End-Use Industry Deep Dives
- 13.4.1 Customer Requirements and Use Cases
- 13.4.2 Demand and Replacement Cycles
- 13.4.3 Technical and Regulatory Considerations
- 13.4.4 Purchasing and Procurement Models
- 13.4.5 Leading Vendors and Distribution Channels
- 13.4.6 Forecast and Commercial Opportunities
- 13.5 Emerging Applications and Cross-Segment Demand
- 13.6 End-Use Industry Investment Priorities
Chapter 14 UK Industrial Catalyst Geographic Market Outlook, 2025-2035
- 14.1 Domestic Market Distribution and Demand Clusters
- 14.2 State- or Province-Wise Market Size and Forecast, 2025-2035
- 14.3 City and Metropolitan Market Outlook
- 14.4 Industrial, Manufacturing and Commercial Clusters
- 14.5 Geographic Concentration of Key End Users
- 14.6 Local Pricing and Purchasing Differences
- 14.7 Domestic Production Facilities and Capacity Map
- 14.8 Local Infrastructure and Project Pipeline
- 14.9 State-Level Policy and Incentive Differences
- 14.10 Subnational Investment Hotspots and Opportunities
- 14.11 Distribution and Logistics Networks
- 14.12 Domestic Competitive Footprint
Chapter 15 UK Industrial Catalyst Technology, Innovation and Sustainability Outlook
- 15.1 Technology Landscape and Maturity
- 15.2 Product, Process and Service Innovation
- 15.3 AI, Automation and Digital Tools in the Industry
- 15.4 Technology Adoption and Performance Benchmarking
- 15.5 Innovation Pipeline and R&D Investment
- 15.6 Patent and Intellectual Property Trends
- 15.7 Energy Efficiency and Resource Management
- 15.8 Sustainability, Recycling and Circularity
- 15.9 Technology Roadmap, 2025-2035
- 15.10 Risks of Obsolescence and Technology Substitution
Chapter 16 UK Industrial Catalyst Market Key Strategic Imperatives
- 16.1 Growth and Market Entry Priorities
- 16.2 High-Return Products and Segments
- 16.3 Pricing, Profitability and Cost Optimization
- 16.4 Technology Investment and Product Differentiation
- 16.5 Supply Chain Localization and Resilience
- 16.6 Distribution and Customer Acquisition
- 16.7 Partnership, Acquisition and Capacity Strategy
- 16.8 Regional Expansion Priorities
- 16.9 Short-, Medium- and Long-Term Actions
Chapter 17 Competition Outlook
- 17.1 Industry Competition Characteristics
- 17.2 Market Structure and Concentration
- 17.3 Market Share and Competitive Positioning, 2025
- 17.4 Company-Wise Revenue and Product Benchmarking
- 17.5 Production and Service Capacity Benchmarking
- 17.6 Technology, Pricing and Differentiation
- 17.7 Regional Footprint and Distribution Strength
- 17.8 Mergers, Acquisitions and Strategic Alliances
- 17.9 New Entrants and Competitive Threats
- 17.10 Porter's Five Forces and Industry Attractiveness
- 17.11 Competitive Outlook, 2025-2035
Chapter 18 Company Profiles
- 18.1 Company Coverage and Selection Criteria
- 18.2 Johnson Matthey PLC
- 18.2.1 Business Description
- 18.2.2 Company Ownership and Geographic Presence
- 18.2.3 Product and Service Portfolio
- 18.2.4 Manufacturing and Operating Footprint
- 18.2.5 Production Capacity and Expansion Plans
- 18.2.6 Financial Performance and Investment
- 18.2.7 Market Share and Competitive Position
- 18.2.8 Technology and Innovation Capabilities
- 18.2.9 Strategic Alliances or Partnerships
- 18.2.10 Recent Developments
- 18.2.11 Growth Strategy and Outlook
- 18.3 Honeywell Technologies
- 18.4 BASF SE
- 18.5 Umicore
- 18.6 Topsoe A/S
- 18.7 Clariant AG
- 18.8 W. R. Grace & Co.
- 18.9 Ketjen
- 18.10 Evonik Industries AG
- 18.11 Novonesis
- 18.12 Biocatalysts Ltd (BRAIN Biotech)
- 18.13 Other Relevant Market Participants
Note: Every listed company is profiled on the structure shown under the first company. The company list is preliminary and may change based on research findings, market developments, data availability and client requirements.
Chapter 19 Disclaimer
- 19.1 Research and Forecast Disclaimer
- 19.2 Data Source and Estimation Limitations
Note: The depth of individual sections depends on data availability for this market. Volume, capacity, trade and other unit-based metrics are included where applicable.

