Food cases and parcels anchor a flat-volume market
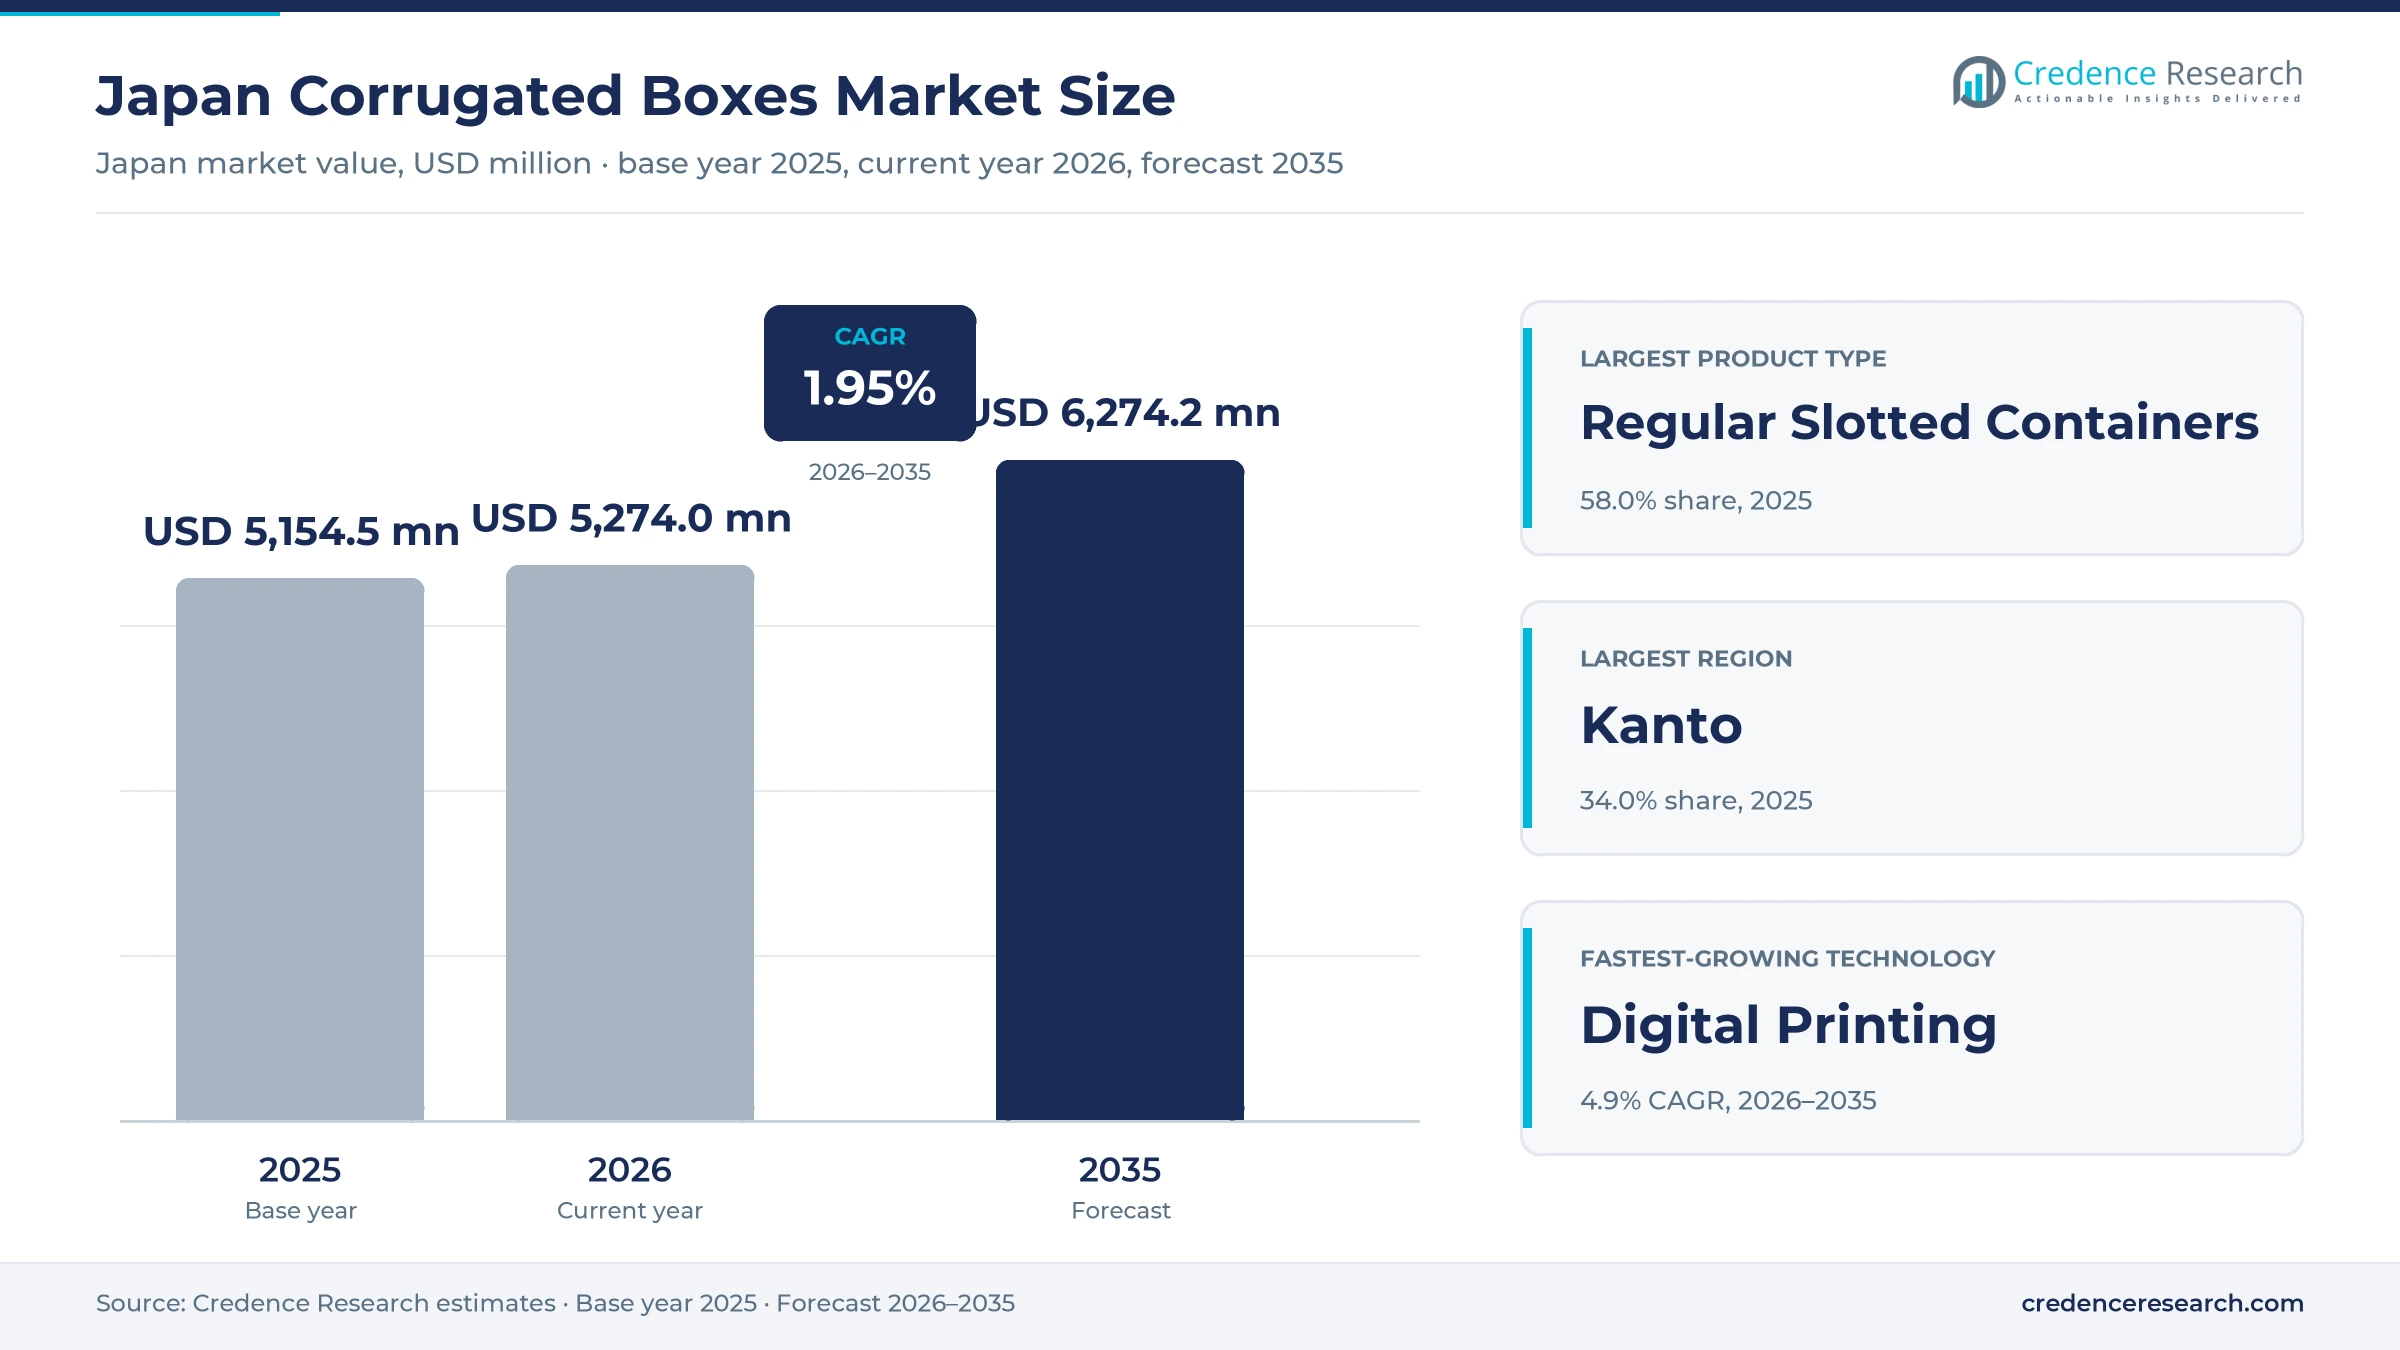
The Japan corrugated boxes market was valued at USD 5.15 billion in 2025 and is projected to increase from USD 5.27 billion in 2026 to USD 6.27 billion by 2035, registering a CAGR of 1.95% during 2026–2035. Demand comes mainly from processed food and beverage makers, fresh produce shippers, appliance and machinery plants, and online retailers that ship parcels in mailers and cases. Kanto held 34.0% of 2025 value, the largest regional share, because the Tokyo area concentrates consumers, distribution centers and food plants. Kanto is also the fastest-growing region at 2.3% a year, as parcel fulfillment keeps expanding around the capital. Volume in square meters is broadly flat, so value growth depends on price rounds that pass higher paper, energy and labor costs to buyers. On the regulatory side, a revised logistics law now pushes large shippers to load trucks more efficiently, which favors boxes sized to the product and to the pallet.
Cases, mailers and heavy-duty packs form one estimate
The estimate measures the value of corrugated cases, die-cut boxes, full-overlap boxes and heavy-duty corrugated packs sold by converters to users in Japan. Most buyers are food, beverage and consumer goods makers that order printed cases by the thousand under annual contracts, while online retailers and logistics operators buy mailers and plain shipping cases.
The estimate excludes containerboard sold to other industries, folding cartons, molded pulp and plastic returnable containers. Sheets sold by sheet plants to independent box makers are counted only in the finished box, so no input is counted twice. The value chain runs from recovered paper and kraft pulp through containerboard mills and corrugators to converting plants that print, cut and glue the boxes.
Japan Corrugated Boxes Market Insights
- The Japan corrugated boxes market was valued at USD 5.15 billion in 2025 and is projected to reach USD 6.27 billion by 2035, registering a CAGR of 1.95% during 2026–2035.
- Kanto held the largest regional share of Japan corrugated boxes demand at 34.0% of 2025 value, because Tokyo alone accounts for about 11.5% of the national population and hosts the densest parcel hubs.
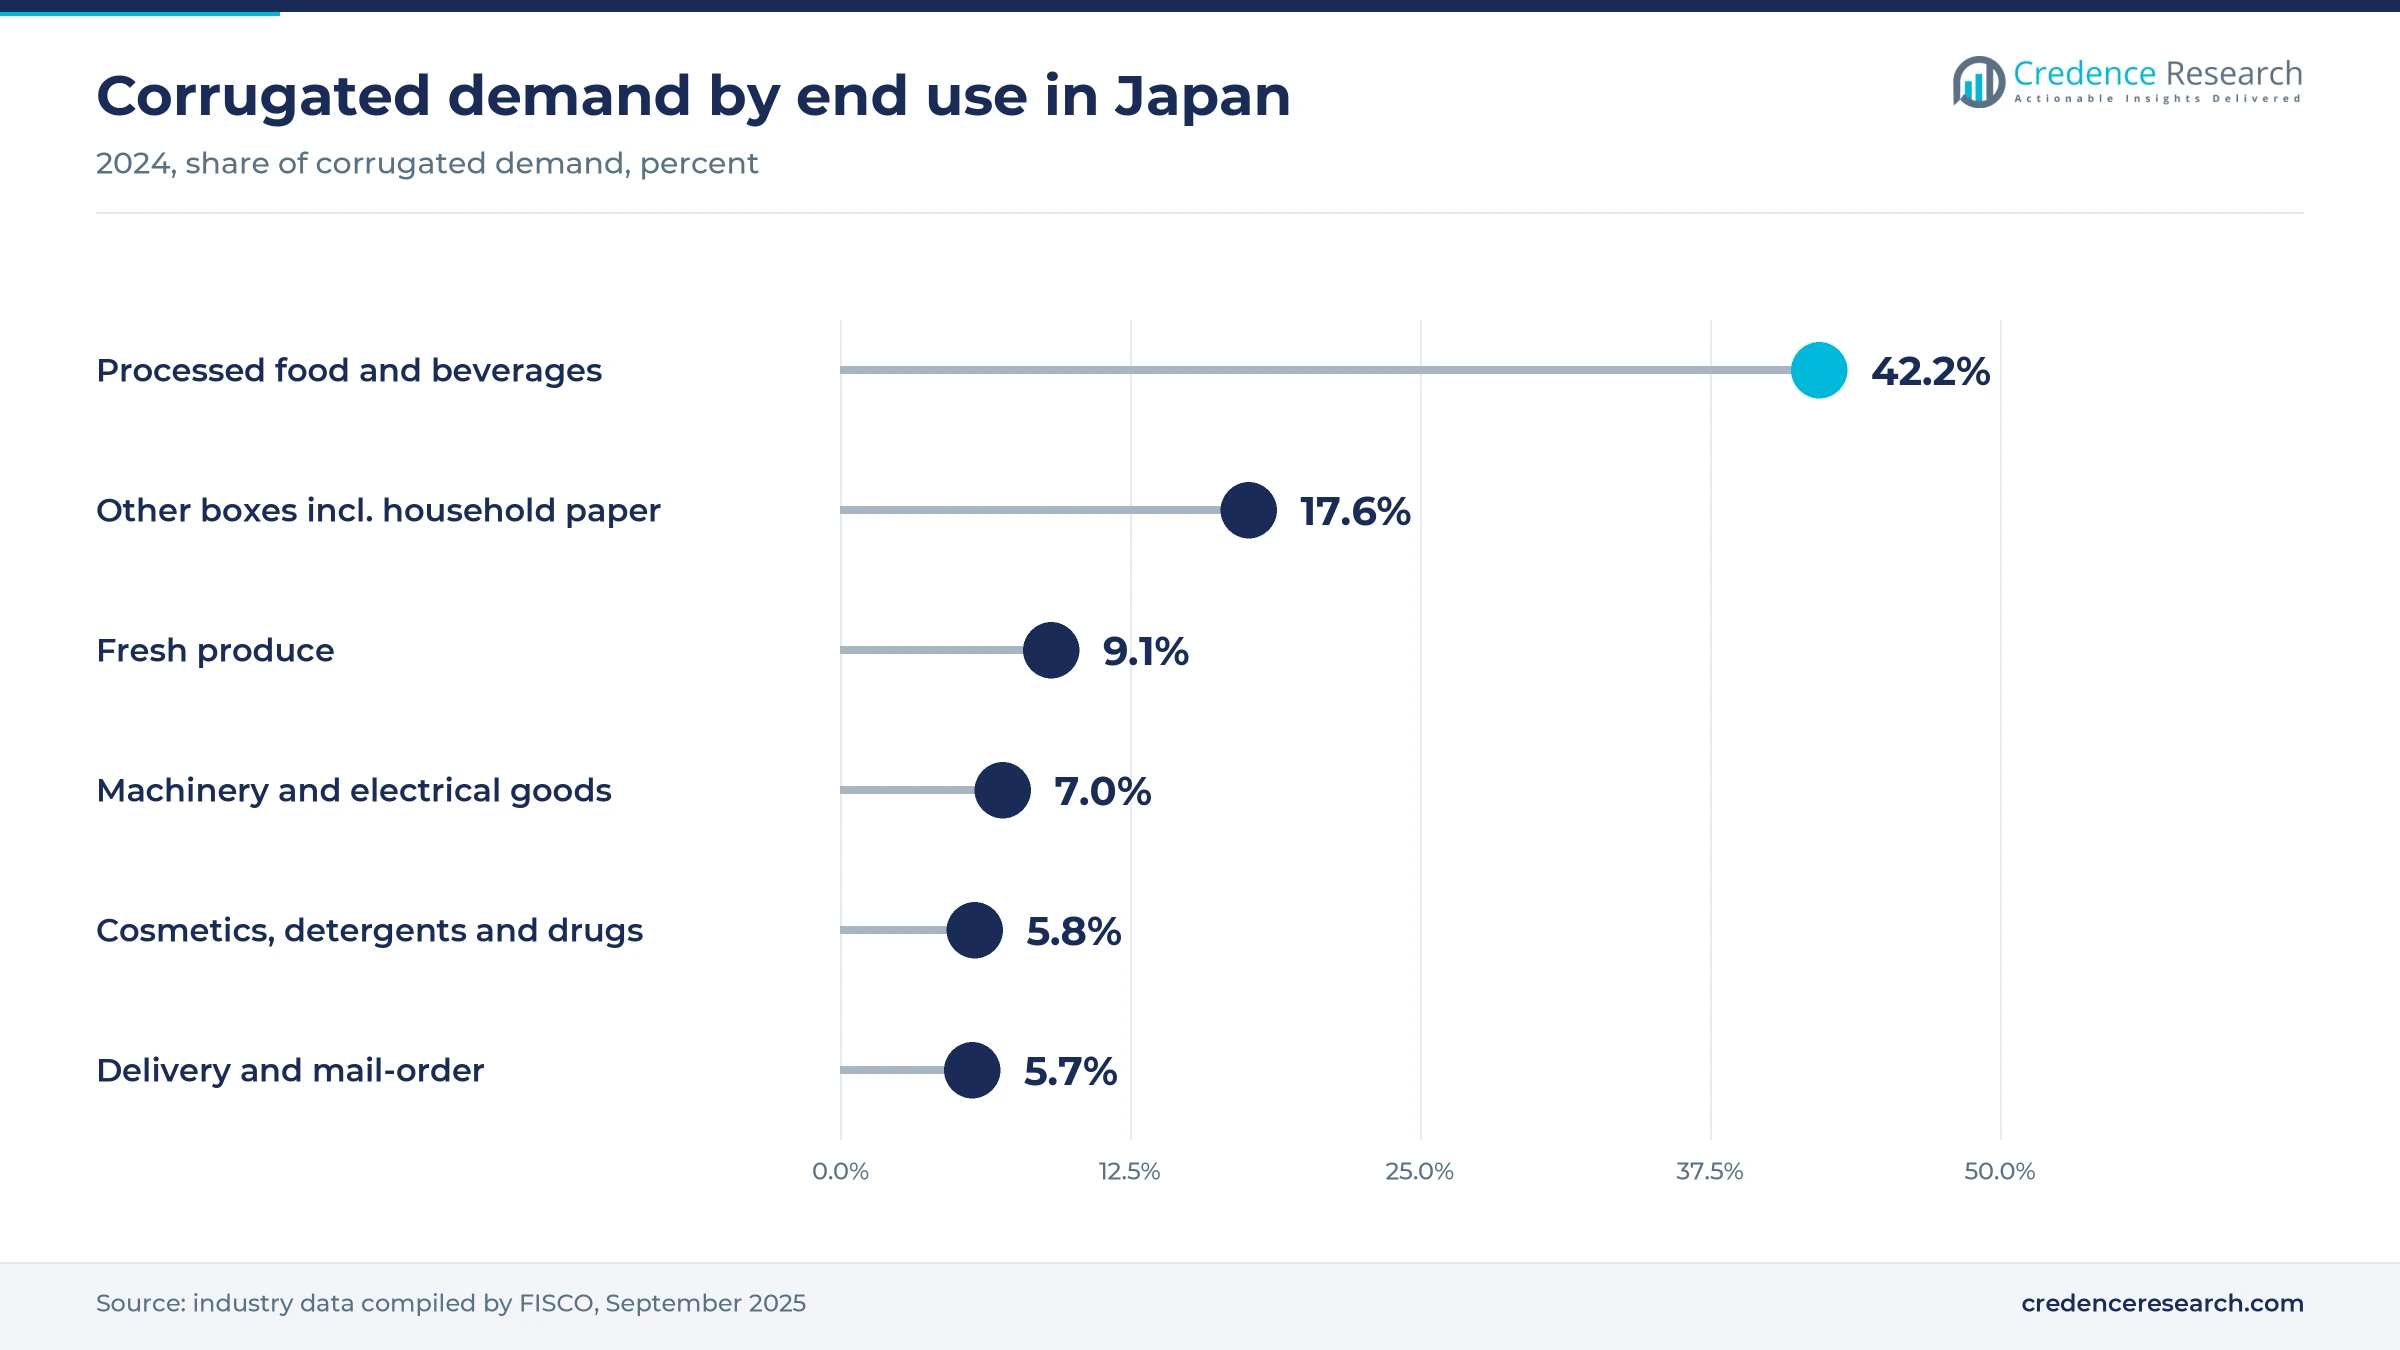
- Regular slotted containers led product types with 58.0% of 2025 value, because processed food and beverages took 42.2% of corrugated demand in 2024.
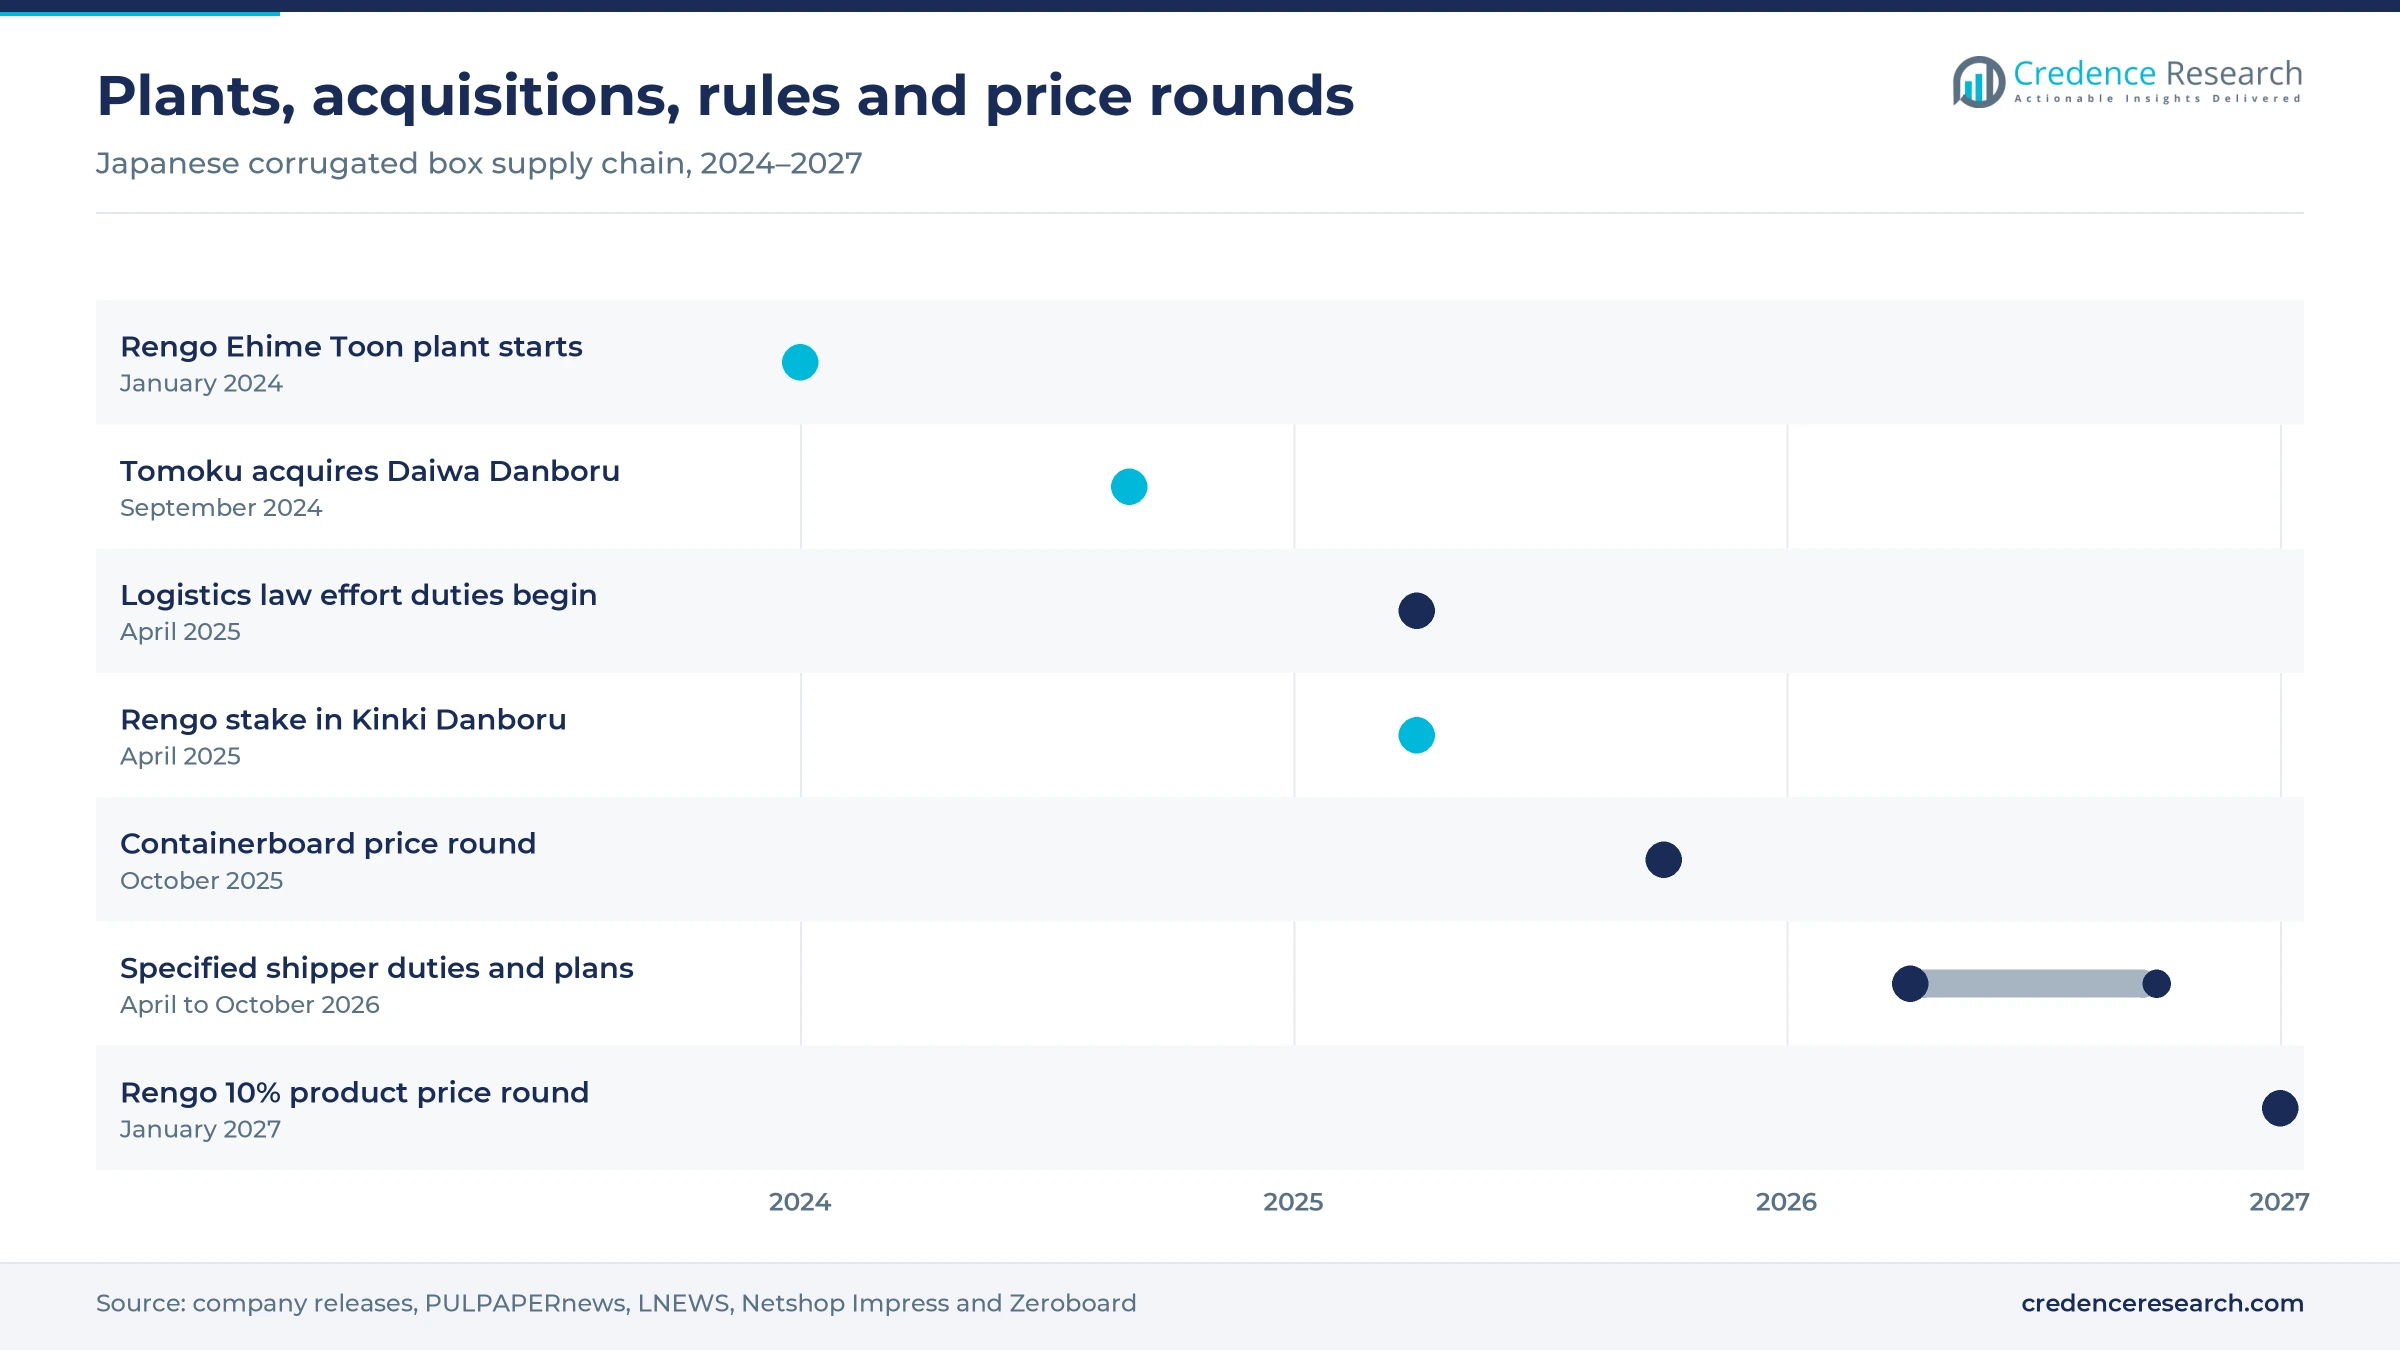
- Rengo raised containerboard prices by at least 10 yen per kilogram from Oct. 1, 2025, and announced a further rise of at least 10% for deliveries from Jan. 1, 2027.
- Paper majors' groups hold just over half of the market, while more than 2,000 mostly small converters serve local buyers and face consolidation.
Slotted cases lead while digital print grows fastest
Why do regular slotted cases take most of the value?
Based on product type, the market is categorized into regular slotted containers, die-cut boxes, full-overlap boxes and heavy-duty corrugated boxes. Regular Slotted Containers led with 58.0% of 2025 value, because processed food and beverages took 42.2% of corrugated demand in 2024, and beverage and food plants pack on high-speed lines built for standard cases, according to FISCO. Die-Cut Boxes grow fastest at 2.6% a year, as online sales of physical goods reached an EC rate of 9.78% in 2024, according to the Ministry of Economy, Trade and Industry. Retailers want mailers that open cleanly and present the product without extra fillers.
How much of box demand still depends on food makers?
Based on end-use industry, the market is categorized into processed food and beverages, fresh produce and agriculture, electrical appliances and machinery, and consumer and healthcare products. Processed Food and Beverages led with 47.0% of 2025 value, because food of all kinds took about 55.5% of corrugated demand in 2024, according to FISCO. Consumer and Healthcare Products grow fastest at 2.2% a year, as cosmetics, detergents and pharmaceuticals took 5.8% and delivery and mail-order 5.7% of 2024 demand, and both groups ship more units in smaller, printed boxes. Converters that serve these buyers earn more per square meter than plain case makers.
Where does e-commerce packaging fit beside transport cases?
Based on application, the market is categorized into transport packaging, e-commerce fulfillment packaging, shelf-ready packaging and protective industrial packaging. Transport Packaging led with 62.0% of 2025 value, because most food shipments and the machinery and electrical goods that took 7.0% of 2024 demand, according to FISCO, move in plain cases between plants, warehouses and stores rather than in consumer parcels. E-commerce Fulfillment Packaging grows fastest at 3.1% a year, as Rengo launched its blade-free J-RexS packing machine for e-commerce in February 2025, according to PULPAPERnews. Converters that supply both the packing machine and the board keep these accounts as single-order shipping volumes rise.
Which printing method carries most box value?
Based on technology, the market is categorized into flexographic printing, digital printing, litho-laminated printing and automated right-sizing and box-on-demand. Flexographic Printing led with 72.0% of 2025 value, because Japanese converters print most cases in-line on the corrugator floor, and regional converters such as Ohmura Shigyo make their own plates and dies across 13 production sites, according to its annual securities report, which keeps changeover costs low on long food runs. Digital Printing grows fastest at 4.9% a year, as Rengo installed a six-color HP PageWide T1190 press with a 2.8-meter web for pre-printing liner. Short runs and seasonal designs are moving to such presses.
| Segment Group | Leading Sub-segment | Share, 2025 | Fastest-growing Sub-segment | CAGR, 2026–2035 |
|---|---|---|---|---|
| By Product Type | Regular Slotted Containers | 58.0% | Die-Cut Boxes | 2.6% |
| By End-Use Industry | Processed Food and Beverages | 47.0% | Consumer and Healthcare Products | 2.2% |
| By Application | Transport Packaging | 62.0% | E-commerce Fulfillment Packaging | 3.1% |
| By Technology | Flexographic Printing | 72.0% | Digital Printing | 4.9% |
Containerboard costs and price rounds set box prices
Box prices in Japan are set per case or per thousand cases for each size, board grade and print, on top of a containerboard cost that mills revise in rounds. Converters then add their own energy, labor and freight costs, so each mill increase reaches box buyers a few months later. Rengo's October 2025 round, reported by LNEWS, added at least 10 yen per kilogram to base paper, and its January 2027 round sets at least 10% on finished products. Integrated groups that make their own board keep more of each increase, while independent converters face a squeeze until their own prices catch up.
| Price item | Typical price or fee | Basis |
|---|---|---|
| Containerboard, Rengo price round | At least JPY 10 per kg, from Oct. 1, 2025 | LNEWS, July 2025 |
| Corrugated and paperboard products, Rengo round | At least 10%, from Jan. 1, 2027 | Netshop Impress, October 2026 |
| Converted cases, average unit value | About JPY 108 per square meter | Credence Research calculation from the Ohmura Shigyo annual securities report |
| Producer prices, pulp, paper and related products | Up 6.0% year on year, July 2026 | Bank of Japan, August 2026 |
Request a Free Sample
Fill in your details and we'll send you a free sample report.
- Sample data tables & charts
- Research methodology
Parcels, food demand and fiber economics lift value
E-commerce parcels add more, smaller boxes
Online retail turns one pallet of cases into many single-order parcels, which raises the number of boxes and the print and design work per square meter. B2C e-commerce in physical goods reached 15.22 trillion yen in 2024, with an EC rate of 9.78%, according to the Ministry of Economy, Trade and Industry. Parcel deliveries reached about 5.03 billion items in fiscal 2024, according to the Ministry of Land, Infrastructure, Transport and Tourism. E-commerce fulfillment packaging, as a result, grows fastest by application at 3.1% a year. Each parcel needs a box that survives sorting hubs and home delivery, which keeps board grades high even as box sizes fall.
Food and beverage cases give the market a stable base
Processed food and drinks are bought every week regardless of the economic cycle, so their case demand holds the market steady when other buyers cut orders. Processed food and beverages took 42.2% of corrugated demand in 2024 and fresh produce 9.1%, according to FISCO. National corrugated production was 99.7% of the prior year's level in the latest fiscal year, according to the annual securities report of Ohmura Shigyo. Processed food and beverages hold a share of 47.0% of 2025 value in the Credence Research estimate. Because demand barely moves, converters with long food contracts can plan corrugator loads and paper purchases with more confidence than suppliers to machinery or export buyers.
Fiber economics favor lighter, stronger board
Corrugated boxes in Japan run mostly on recovered fiber, so every gram saved per box cuts cost for both mills and buyers. A March 2024 Rengo paper showed containerboard production up about 10% from 2005 while recovered corrugated collection rose only about 6%, which points to a tighter fiber balance. Daio Paper converted its Mishima No. 7 machine from printing paper to paperboard in April 2020 and moved to high-strength grades of 300 g per square meter and above, its securities report says. Rengo says its J-RexS machine cuts packaging material and raises truck loading efficiency. Mills that sell lighter, high-strength containerboard can charge for performance per square meter rather than tonnage, which lets converters cut fiber use without weakening cases.
Logistics law pushes shippers to right-size boxes
A revised logistics efficiency law makes large shippers responsible for how well their trucks are loaded, which turns box size into a compliance issue. Effort obligations for all shippers took effect on April 1, 2025, and from April 2026 shippers handling 90,000 tons or more a year must appoint a chief logistics officer and file medium-term plans by the end of October 2026, according to Zeroboard. The national goal is a loading efficiency of 44% across all trucks. Tomoku says the 2024 overtime limits for truck drivers raised collection costs in its own transport business. Shippers now ask converters for case sizes that fit standard pallets and cut empty space inside each box.
Right-sizing, consolidation and food exports reshape demand
Shift to automated right-sizing and box-on-demand lines
Fulfillment centers are shifting from stocks of standard cases to machines that build a box around each order, which cuts void space, filler and freight cost. Mitsubishi Heavy Industries sells its COMPOX machine, which adjusts length, width and height and makes up to 600 boxes an hour for products with total sides from 50 to 130 centimeters. Rengo's blade-free packing machine, launched in February 2025, trims each box to the height of the product, PULPAPERnews reported. Carriers also chase cost per parcel, and the redelivery rate fell to 8.4% in an April 2025 survey by the transport ministry, as Nippon.com reported. Box makers that sell fanfold board and service contracts for these machines keep the customer when cases disappear.
Rise of acquisitions as majors absorb regional converters
Large groups are buying stakes in family-owned converters, because aging owners and labor shortages make many small plants hard to run alone. Rengo took a 28.6% stake in Kinki Danboru, a Shiga-based converter, through a third-party allotment, PULPAPERnews reported on April 25, 2025. It bought 100% of Shinko, the box-making company of the Beams Group with a plant in Higashimurayama in Tokyo, in May 2025. Global PaperMoney reported that Rengo later raised its stake in Murase Danboru of Konan, Aichi, which runs two plants, to 49%. Tomoku bought Daiwa Danboru in September 2024, according to its securities report. Buyers gain stronger supply security but face fewer independent bidders in each prefecture.
Can digital printing open a premium for short runs?
Digital printing lets brands change designs, run seasonal graphics and print small lots without plates, which opens a price premium in a market where plain cases compete on cost. Rengo scheduled the first high-volume HP PageWide T1190 in Asia Pacific for installation around June 2019, Wide Format Image reported, to start full-scale digital printing in Japanese corrugated packaging. The press runs at 305 meters a minute and handles short, medium and long runs of pre-printed liner, according to NS Packaging. Digital printing grows fastest by technology at 4.9% a year, although flexographic printing still prints most cases. Converters that pair digital package printing with design services can win shelf-ready and e-commerce programs that need fast changeovers.
Food exports open a new outlet for export-grade cases
Record food exports create demand for stronger, moisture-resistant cases that survive ocean freight and cold chains. Japan's farm, fishery and food exports reached 1,700.5 billion yen in 2025, up 12.8%, the 13th straight record, according to the agriculture ministry as reported by Nippon.com. The government targets 5 trillion yen by 2030, after missing its 2 trillion yen goal for 2025. Fresh produce and agriculture hold a smaller share of the market but buy heavier grades for export shipments. Converters near ports and export food plants can sell coated and wet-strength cases at higher prices than domestic shipping cases.
Shrinking population and cost inflation squeeze converters
Why does a shrinking population limit box volumes?
Fewer consumers mean fewer food and household goods to ship, which is the main risk that limits square-meter growth for most converters. Japan's population fell by about 550,000 to 123.8 million in the year to Oct. 1, 2024, according to the Statistics Bureau. Corrugated production slipped 0.2% to about 6,835 million square meters in the first half of 2025, according to FISCO. Converters respond by selling more printed and specialty boxes per customer rather than chasing volume.
Cost inflation forces repeated price rounds
Paper, energy, labor and freight costs keep rising, and converters must pass them on or lose margin. The Bank of Japan's producer price index for pulp, paper and related products rose 6.0% year on year in July 2026. Rengo then announced the January 2027 product price round noted in the pricing table, citing inflation, interest rates and Middle East tension. Small converters without their own containerboard supply absorb these rounds worst, while buyers lock in contracts earlier.
Returnable containers compete on repeat routes
Reusable plastic crates and pallets can replace one-way cases on fixed routes, which threatens volume on regular shipments. A Ministry of Land, Infrastructure, Transport and Tourism pilot found round-trip returnable transport items cost 0.60 of a baseline using cardboard boxes and disposable pallets, according to its April 2024 guidance. Use of plastic pallets and folding crates suits closed loops between plants. Box makers defend these routes with lighter board and supply contracts.
Labor shortages strain small converters and haulers
Corrugated plants and delivery fleets both need workers that Japan is struggling to find, so operating costs rise even when volume does not. Tomoku says national freight volume fell for a fourth straight year while the 2024 driver rules raised collection costs. More than 2,000 corrugated makers operate in Japan, and FISCO notes that aging owners and labor shortages are pushing these mostly small firms to exit or sell. Automation of feeding, bundling and palletizing is the main answer, but it needs capital that small plants often lack.
Kanto leads on population and parcel hubs
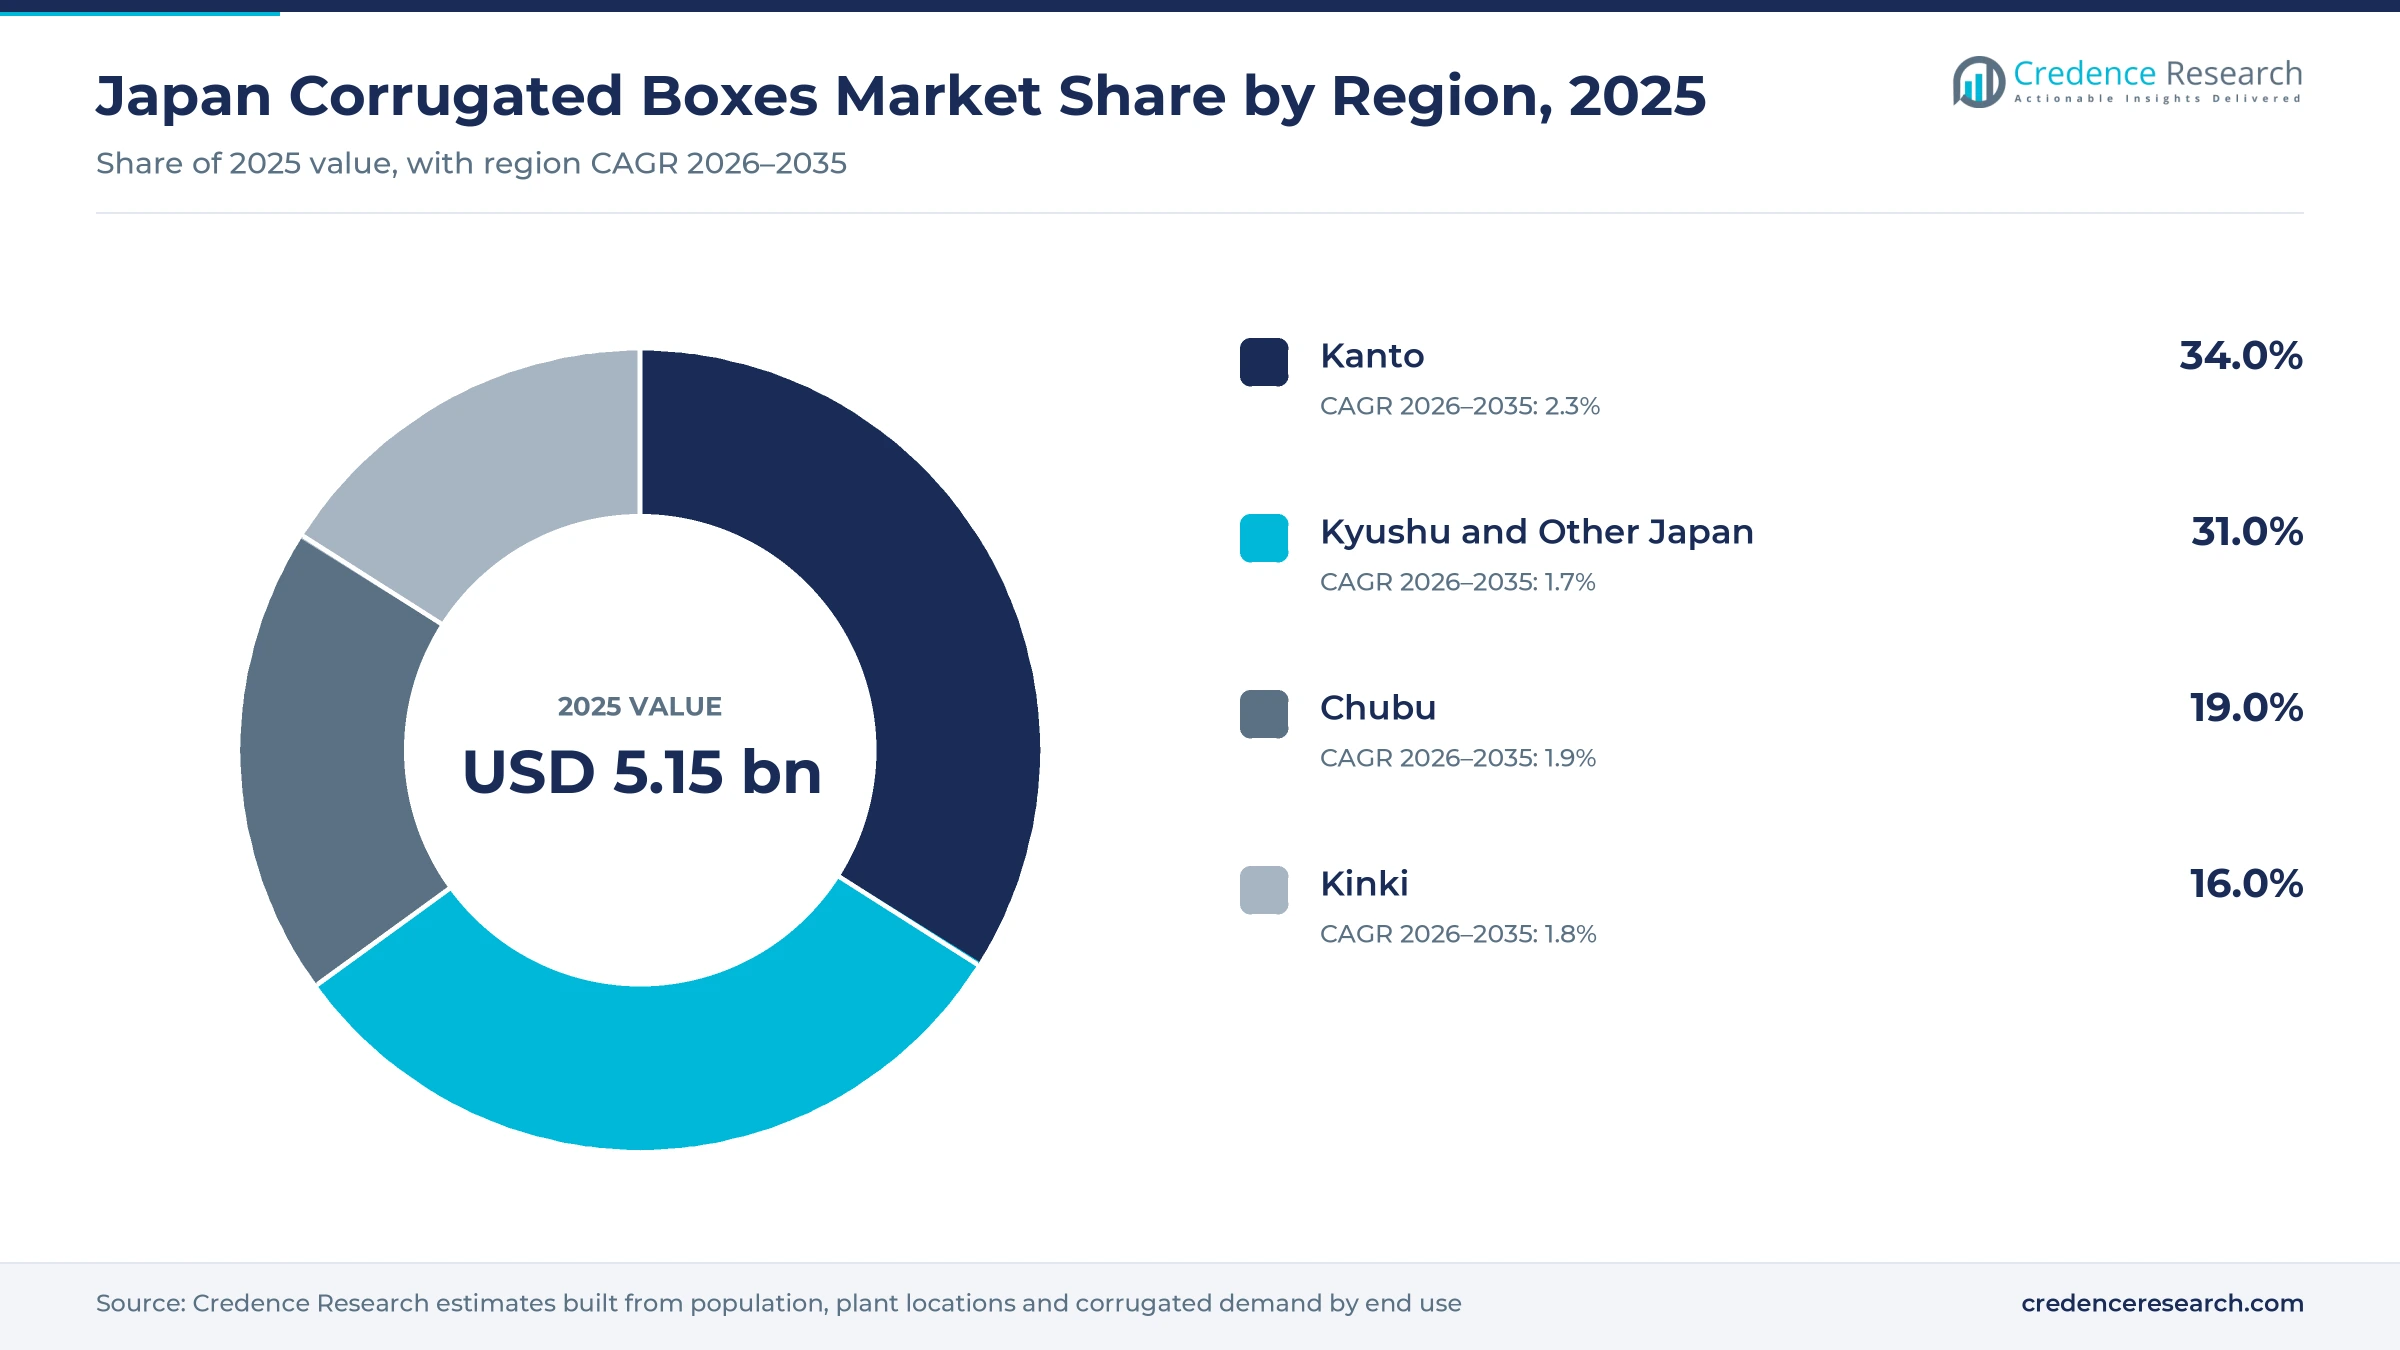
The Japan corrugated boxes market is split into four regions that follow where consumers, food plants and manufacturing clusters sit. Regional shares and growth rates are Credence Research estimates built from population, converter plant locations and corrugated demand by end use.
| Region | Value, 2025 (USD billion) | Share, 2025 | CAGR, 2026–2035 |
|---|---|---|---|
| Kanto | 1.75 | 34.0% | 2.3% |
| Kyushu and Other Japan | 1.60 | 31.0% | 1.7% |
| Chubu | 0.98 | 19.0% | 1.9% |
| Kinki | 0.82 | 16.0% | 1.8% |
Why does Kanto lead box demand?
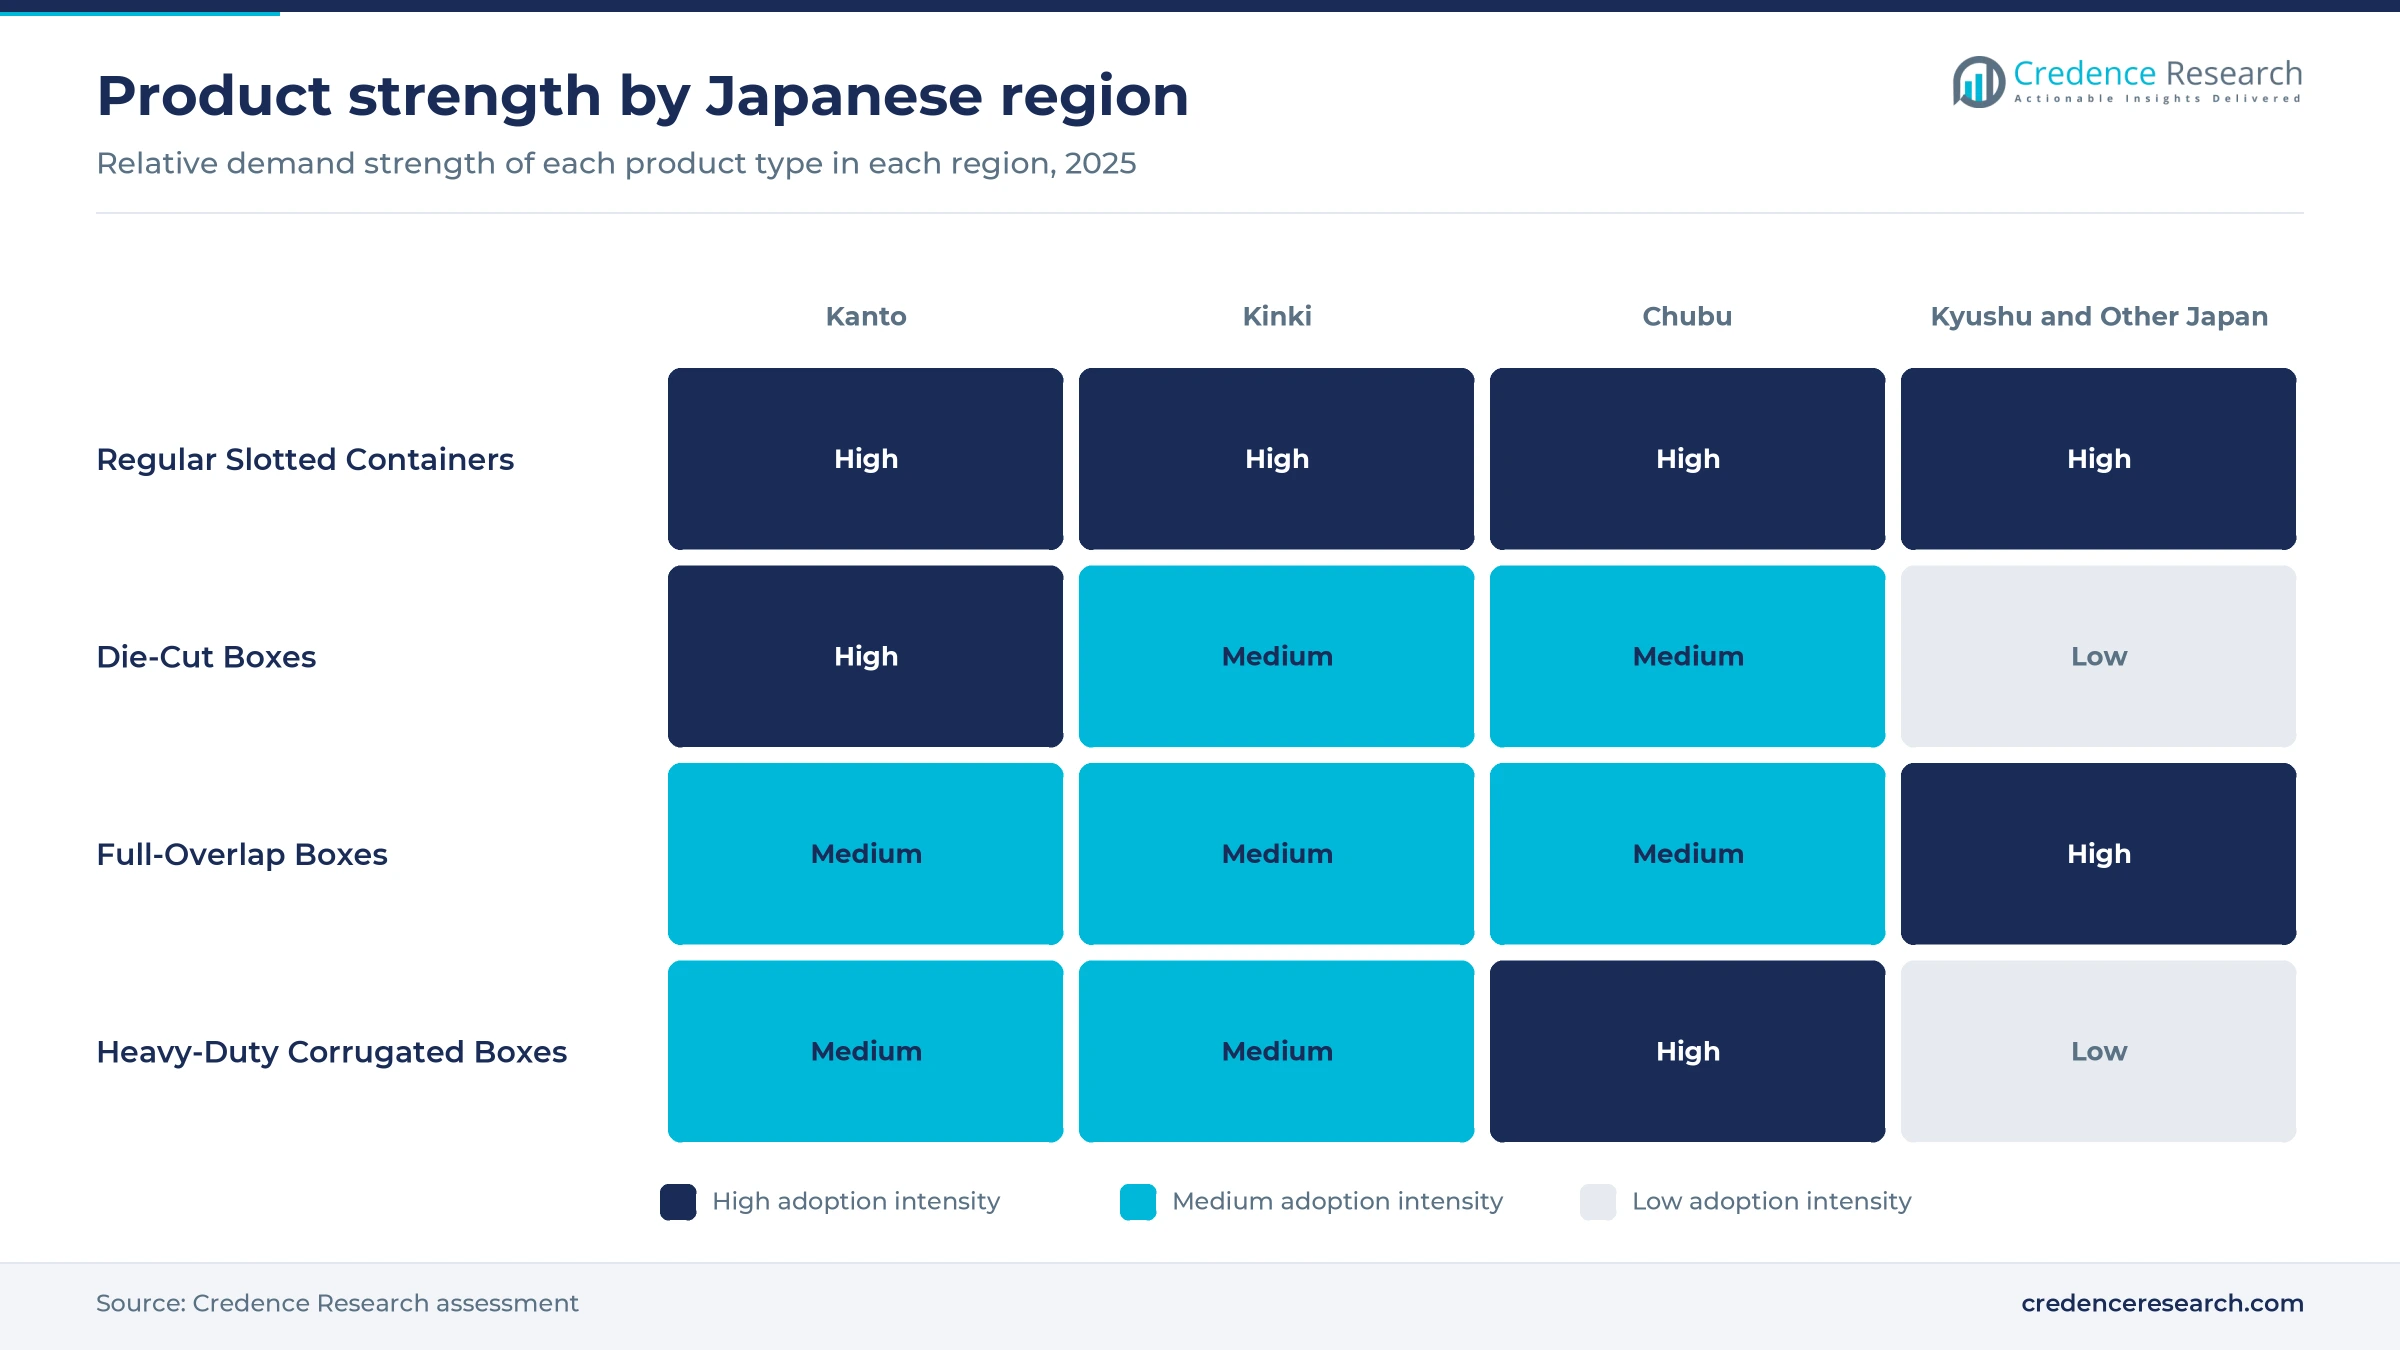
Kanto held 34.0% of 2025 corrugated box demand and grows fastest at 2.3% a year, because the Tokyo area combines the largest consumer base with the densest network of parcel hubs and food plants. Tokyo and Saitama were the only prefectures whose populations grew in 2024, according to the Statistics Bureau, so the Kanto customer base is shrinking more slowly than the rest of Japan. Tomoku's subsidiary Taiyo moved its plant to Isehara in Kanagawa, which began operating in January 2026.
Chubu boxes follow the auto and appliance cluster
Chubu held 19.0% of 2025 corrugated box demand and grows at 1.9% a year, close to the national pace, because its auto, machinery and appliance plants buy heavy-duty and parts boxes in steady volumes. Dynapac runs 19 manufacturing bases from Chubu to Tohoku, and its largest domestic site is the Miyoshi plant in Aichi, according to FISCO. Aichi also hosts Chuoh Pack Industry in Kiyosu, Itoh Corrugated Industrial in Nagoya and Kariya Shiki, which adds parts inspection and packing work in Kariya.
Kinki converters serve food and consumer brands
Kinki held a regional share of 16.0% in 2025 and grows at 1.8% a year, slower than the capital region as its population declines. Osaka is among the five largest prefectures, and the region hosts food, beverage and household goods makers that buy printed cases and displays. Rengo's stake in Kinki Danboru, noted above, links a Shiga converter to nearby Rengo plants. Tomoku describes its Kobe plant as using cutting-edge technology for corrugated production.
Fresh produce shapes demand outside the big three regions
Kyushu and Other Japan held 31.0% of 2025 value and grows at 1.7% a year, the slowest pace, as rural populations shrink. Fresh produce took 9.1% of national corrugated demand in 2024, and buyers in Hokkaido, Tohoku, Kyushu and Shikoku order seasonal cases for vegetables and fruit. Rengo opened its Ehime Toon plant in Shikoku on Jan. 8, 2024, with solar power and LNG facilities, according to Lesprom. Tomoku upgraded its Kyushu plant with a high-speed printer, and its Tokachi Package unit serves Hokkaido.
Acquisitions, plants and price rounds, 2024–2027
| Development | Status and market relevance |
|---|---|
| In April 2025, Rengo acquired a 28.6% stake in Kinki Danboru, a corrugated converter based mainly in Shiga Prefecture. | Deepens Rengo supply links in Kinki |
| In May 2025, Rengo acquired all shares of Shinko, the box-making company of the Beams Group, with a plant in Tokyo. | Adds Tama region customers |
| In July 2025, Rengo announced a containerboard price rise of at least 10 yen per kilogram from Oct. 1, 2025. | Price round passed to box buyers |
| In January 2026, Tomoku subsidiary Taiyo started operations at its relocated plant in Isehara, Kanagawa. | Kanto capacity renewed |
| In October 2026, Rengo announced a rise of at least 10% on paperboard and corrugated products from Jan. 1, 2027. | Takes effect with January deliveries |
Printing and right-sizing technologies set box value
- Flexographic printer-slotters print, crease and slot standard cases in one pass and remain the workhorse for food and beverage orders, with plates and dies often made in-house.
- Digital inkjet presses print liner or finished sheets without plates, which suits short runs, seasonal graphics, regional editions and variable data.
- Litho-laminated printing glues offset-printed paper onto board and serves premium retail, gift and display boxes.
- Right-sizing machines build a box around each product, which cuts void space, filler and truck space per order and helps shippers meet the new loading goals.
Need a Custom Version of This Report?
Tailor the scope, geography, or segments to your exact requirements.
- Custom geography or segment scope
- Direct access to our analyst team
Paper majors and regional converters split supply
Competition in the Japan corrugated boxes market runs on board cost, delivery reach and service to large food and consumer accounts. Rengo is the largest integrated group, with containerboard mills, corrugators and converting plants across the country, and it keeps adding regional converters through stakes and acquisitions. Oji Holdings competes through Oji Container and the Mori Shigyo group, which also run their own board supply. Tomoku and Dynapac are the largest independent specialists, each with plants close to food and manufacturing customers. Daio Package sells board and boxes backed by Daio Paper mills. Ohmura Shigyo, Chuoh Pack Industry, Itoh Corrugated Industrial and Kariya Shiki compete regionally on short lead times, small lots and design support. Buyers shortlist suppliers with stable quality, reliable delivery and the ability to pass price rounds fairly.
Paper majors and family converters share supply
Supply is split between integrated paper groups and a long tail of local converters. Paper majors' groups, led by Rengo and Oji Holdings, hold just over half of the market, while Tomoku holds about 8% and Dynapac about 3% as the leading independent specialists, according to FISCO. The rest is spread across the long tail of small converters described under the challenges above. Entry barriers are corrugator capital, board supply and customer audits, and margins sit with groups that make their own containerboard.
Companies profiled and their roles in this market
| Company | Type | Role in the market |
|---|---|---|
| Rengo Co., Ltd. | Integrated paper and packaging group | Containerboard, corrugated sheets, cases and packing machines nationwide |
| Oji Holdings Corporation (Oji Container, Mori Shigyo) | Integrated paper and packaging group | Corrugated board and cases through Oji Container and Mori Shigyo plants |
| Tomoku Co., Ltd. | Corrugated specialist | Corrugated sheets, cases and printed boxes, about 8% market share |
| Dynapac Co., Ltd. | Corrugated specialist | Corrugated cases and printed boxes from 19 bases, Chubu to Tohoku |
| Daio Package Co., Ltd. (Daio Paper) | Mill-backed converter | Corrugated board and boxes supplied with Daio Paper containerboard |
| Ohmura Shigyo Co., Ltd. | Regional converter | Corrugated sheets, cases and labels from 13 sites, Tohoku to Kansai |
| Chuoh Pack Industry Co., Ltd. | Regional converter | Corrugated board and paper containers from Kiyosu, Aichi |
| Itoh Corrugated Industrial Co., Ltd. | Regional converter | Corrugated products and packaging boxes from Nagoya, Aichi |
| Kariya Shiki Co., Ltd. | Regional converter | Corrugated boxes plus parts inspection and packing work in Kariya, Aichi |
Price and mix, not volume, will drive growth
Credence Research's view is that the Japan corrugated boxes market will grow through price and product mix rather than volume. Square meters will stay close to flat as the population shrinks, but repeated price rounds and a steady shift toward printed mailers, die-cut boxes and digital graphics will raise value per box. Regular slotted containers keep the largest share at 58.0% of 2025 value, while digital printing and e-commerce mailers grow fastest. Winners will be groups with their own containerboard, plants near Kanto parcel hubs and the service teams to redesign boxes for the new logistics rules.
Production, price and demand data anchor the estimate
The report uses 2025 as the base year on a calendar basis, and market values come from the Credence Research model. That model combines corrugated production in square meters, demand shares by end use, converter unit values from company filings, containerboard price rounds, Bank of Japan producer prices, e-commerce and parcel statistics from the Ministry of Economy, Trade and Industry and the Ministry of Land, Infrastructure, Transport and Tourism, and population data from the Statistics Bureau. Segment splits, regional shares and regional growth rates are Credence Research estimates. Sources used are government statistics, company filings and releases, investor research and trade press, and no interviews or surveys were used.
Food, parcels and price rounds carry value to 2035
Corrugated box sales in Japan are expected to reach USD 6.27 billion by 2035, a 1.95% CAGR during 2026–2035, as food and beverage cases hold their base and parcels, shelf-ready packs and digital print add value. Regular slotted containers remain the largest product type, while die-cut boxes and e-commerce fulfillment packaging gain share. Kanto keeps its lead and grows fastest, while regions outside the big three slow with their populations. More family-owned converters are likely to join larger groups before 2035. A failed price round or faster spread of returnable crates would pull growth toward the downside case.
Price pass-through and parcel growth set the range
In the base case, box value grows from the 2026 value along the central forecast as volume stays flat and price rounds stick. The downside case assumes weaker food volumes, faster use of returnable crates and buyers resisting the January 2027 round. The upside case adds faster parcel growth, wider use of digital and shelf-ready formats and a recovery in appliance and machinery output, which would lift value per square meter.
| Scenario | CAGR, 2026–2035 | Value, 2035 | What has to hold |
|---|---|---|---|
| Downside | 0.9% | USD 5.74 billion | Food volumes fall, returnable crates spread and price rounds are partly rolled back |
| Base | 1.95% | USD 6.27 billion | Square-meter volume stays flat and price rounds pass through with a short delay |
| Upside | 2.9% | USD 6.79 billion | Parcels grow faster and digital, shelf-ready and export cases lift value per box |
Frequently Asked Questions
How big is the Japan corrugated boxes market?
Which product type leads the market?
Which region holds the largest share?
How important is food demand for corrugated boxes in Japan?
How does e-commerce affect box demand?
Why are corrugated box prices rising in Japan?
Who are the main companies in this market?
What are the main challenges for box makers?
Table of Content
Chapter 1 Market Segmentation
- 1.1 Segmentation Framework
- 1.1.1 Product and Service Classification
- 1.1.2 Application and End-Use Classification
- 1.1.3 Technology and Solution Classification
- 1.1.4 Customer and Distribution Channel Classification
- 1.1.5 Geographic Segmentation
- 1.1.6 Market Segment Definitions and Boundaries
- 1.2 By Product Type
- 1.2.1 Regular Slotted Containers
- 1.2.2 Die-Cut Boxes
- 1.2.3 Full-Overlap Boxes
- 1.2.4 Heavy-Duty Corrugated Boxes
- 1.3 By End-Use Industry
- 1.3.1 Processed Food and Beverages
- 1.3.2 Fresh Produce and Agriculture
- 1.3.3 Electrical Appliances and Machinery
- 1.3.4 Consumer and Healthcare Products
- 1.4 By Application
- 1.4.1 Transport Packaging
- 1.4.2 E-commerce Fulfillment Packaging
- 1.4.3 Shelf-Ready Packaging
- 1.4.4 Protective Industrial Packaging
- 1.5 By Technology
- 1.5.1 Flexographic Printing
- 1.5.2 Digital Printing
- 1.5.3 Litho-Laminated Printing
- 1.5.4 Automated Right-Sizing and Box-on-Demand
Chapter 2 Introduction
- 2.1 Report Objectives and Scope
- 2.2 Product Definition and Industry Terminology
- 2.3 Market Inclusions and Exclusions
- 2.4 Research Process
- 2.4.1 Primary Research and Expert Interviews
- 2.4.2 Secondary Research and Source Review
- 2.4.3 Top-Down and Bottom-Up Estimation
- 2.4.4 Data Triangulation and Verification
- 2.5 Market Size Measurement Basis
- 2.5.1 2025: USD 5.15 billion → 2035: USD 6.27 billion
- 2.6 Historical and Forecast Reference Periods
- 2.6.1 Historical Period: 2018-2025
- 2.6.2 Base Year: 2025
- 2.6.3 Forecast Period: 2025-2035
- 2.7 Research Assumptions and Limitations
Chapter 3 Executive Summary
- 3.1 Market Snapshot and Key Findings
- 3.2 Base-Year Market Size, 2025
- 3.3 Forecast Market Size, 2035
- 3.4 Revenue and Volume Growth Outlook
- 3.5 Key Demand and Supply Indicators
- 3.6 Leading Market Segments
- 3.7 Fastest-Growing Market Opportunities
- 3.8 Regional Performance Highlights
- 3.9 Technology and Industry Transformation
- 3.10 Competitive Landscape Summary
- 3.11 Analyst View and Strategic Implications
Chapter 4 Japan Corrugated Boxes Market Trends and Developments
- 4.1 Historical Industry Development, 2018-2025
- 4.2 Recent Market Trends and Developments
- 4.3 Demand and Customer Behavior Trends
- 4.4 Technology and Product Innovation
- 4.5 Artificial Intelligence, Automation and Digitalization
- 4.6 Local Manufacturing and Supply Chain Realignment
- 4.7 Industry Partnerships, Mergers and Acquisitions
- 4.8 Sustainability and Circular Economy Developments
- 4.9 Government and Private Sector Investment Trends
- 4.10 Emerging Business Models and Commercialization
- 4.11 Industry Developments and Announcements
Chapter 5 Japan Corrugated Boxes Market Production, Supply and Demand Analysis
- 5.1 Demand Trend and Consumption Analysis, 2018-2025
- 5.2 Demand Forecast, 2025-2035
- 5.3 Production and Output Trend, 2018-2025
- 5.4 Production and Output Forecast, 2025-2035
- 5.5 Installed Capacity and Capacity Utilization
- 5.6 Company-Wise Production Plants and Statistics
- 5.6.1 Installed Production Capacity
- 5.6.2 Actual Production
- 5.6.3 Planned Capacity and Expansion Targets
- 5.7 Supply Chain Structure and Procurement Trends
- 5.8 Supply-Demand Gap and Bottlenecks
- 5.9 Import Dependence and Sourcing Structure
- 5.10 Contract Manufacturing and Outsourcing
- 5.11 Regional Supply and Demand Concentration
Chapter 6 Japan Corrugated Boxes Market Pricing Analysis
- 6.1 Pricing Structure and Measurement
- 6.2 Historical Pricing Trends, 2018-2025
- 6.3 Pricing Outlook, 2025-2035
- 6.4 Average Selling Price and Unit Economics
- 6.5 Pricing by Product and Market Segment
- 6.6 Geographic Pricing Differences
- 6.7 Key Input, Energy, Labor and Logistics Costs
- 6.8 Contract Pricing and Purchasing Models
- 6.9 Pricing Sensitivity and Competitive Positioning
- 6.10 Price, Margin and Profitability Implications
Chapter 7 Japan Corrugated Boxes Market Dynamics
- 7.1 Market Growth Drivers
- 7.1.1 Demand-Side Drivers
- 7.1.2 Technology and Innovation Drivers
- 7.1.3 Infrastructure and Investment Drivers
- 7.1.4 Regulatory and Policy Drivers
- 7.2 Market Restraints
- 7.2.1 Cost and Affordability Constraints
- 7.2.2 Technology and Adoption Barriers
- 7.2.3 Supply Chain and Operational Constraints
- 7.3 Market Challenges
- 7.3.1 Competitive Pressure and Margin Erosion
- 7.3.2 Skills, Infrastructure and Implementation Gaps
- 7.4 Emerging Market Opportunities
- 7.5 Market Dynamics Impact and Time-Horizon Assessment
Chapter 8 Japan Corrugated Boxes Value Chain Analysis
- 8.1 Industry Value Chain Overview
- 8.2 Upstream Suppliers and Critical Inputs
- 8.3 Technology and Component Providers
- 8.4 Manufacturing or Service Delivery
- 8.5 Distribution, Channel Partners and Integrators
- 8.6 Downstream Applications and End Users
- 8.7 Value Addition and Profit Pools
- 8.8 Vertical Integration and Outsourcing
- 8.9 Supplier Concentration and Risk
- 8.10 Supply Chain Localization and Resilience
Chapter 9 Japan Corrugated Boxes Market Regulations and Policies
- 9.1 Relevant Laws, Standards and Compliance Frameworks
- 9.2 Product, Service, Safety and Quality Requirements
- 9.3 Government Policies, Incentives and Subsidies
- 9.4 Imports, Exports and Trade Barriers
- 9.5 Public Procurement and Local Content Requirements
- 9.6 Environmental and Sustainability Compliance
- 9.7 Upcoming Policy Changes and Market Implications
Chapter 10 Japan Corrugated Boxes Market Hotspots and Opportunities
- 10.1 Market Opportunity Mapping and Growth Hotspots
- 10.2 High-Growth Applications and Customer Groups
- 10.3 Underserved Markets and White-Space Opportunities
- 10.4 Emerging Technology and Product Opportunities
- 10.5 New Capacity and Investment Hotspots
- 10.6 Market Entry and Expansion Opportunities
- 10.7 Distribution and Partnership Opportunities
- 10.8 Near-Term and Long-Term Commercial Potential
- 10.9 Opportunity Attractiveness and Execution Risks
Chapter 11 Japan Corrugated Boxes Market Outlook, 2025-2035
- 11.1 Market Size and Analysis
- 11.1.1 Revenue (Market Measurement: 2025: USD 5.15 billion → 2035: USD 6.27 billion)
- 11.1.2 Market Volume and Quantity Sold
- 11.1.3 Historical Market Size, 2018-2025
- 11.1.4 Base-Year Market Size, 2025
- 11.2 Market Forecast, 2025-2035
- 11.2.1 Revenue Forecast to 2035
- 11.2.2 Volume Forecast to 2035
- 11.2.3 CAGR and Year-on-Year Growth
- 11.2.4 Incremental Revenue Opportunity
- 11.3 Forecast Assumptions and Scenario Analysis
- 11.3.1 Base-Case Forecast
- 11.3.2 Optimistic and Conservative Scenarios
- 11.3.3 Technology, Pricing and Policy Sensitivities
- 11.4 Market Attractiveness and Growth Outlook
Chapter 12 Japan Corrugated Boxes Market Segmentation and Outlook
- 12.1 Segmentation Summary and Market Shares, 2025
- 12.2 Largest and Fastest-Growing Segments
- 12.3 By Product Type - Market Size and Forecast, 2025-2035
- 12.3.1 Segment Definition and Scope
- 12.3.2 Historical Market Size, 2018-2025
- 12.3.3 Revenue Forecast, 2025-2035
- 12.3.4 Volume Forecast, 2025-2035
- 12.3.5 Base-Year Market Share, 2025
- 12.3.6 Segment CAGR and Growth Drivers
- 12.3.7 Subsegment Market Size and Forecast
- 12.3.7.1 Regular Slotted Containers
- 12.3.7.2 Die-Cut Boxes
- 12.3.7.3 Full-Overlap Boxes
- 12.3.7.4 Heavy-Duty Corrugated Boxes
- 12.3.8 Subsegment Pricing and Adoption Trends
- 12.3.9 Leading Suppliers and Competition
- 12.3.10 Regional Demand and Opportunities
- 12.4 By End-Use Industry - Market Size and Forecast, 2025-2035
- 12.4.1 Segment Definition and Scope
- 12.4.2 Historical Market Size, 2018-2025
- 12.4.3 Revenue Forecast, 2025-2035
- 12.4.4 Volume Forecast, 2025-2035
- 12.4.5 Base-Year Market Share, 2025
- 12.4.6 Segment CAGR and Growth Drivers
- 12.4.7 Subsegment Market Size and Forecast
- 12.4.7.1 Processed Food and Beverages
- 12.4.7.2 Fresh Produce and Agriculture
- 12.4.7.3 Electrical Appliances and Machinery
- 12.4.7.4 Consumer and Healthcare Products
- 12.4.8 Subsegment Pricing and Adoption Trends
- 12.4.9 Leading Suppliers and Competition
- 12.4.10 Regional Demand and Opportunities
- 12.5 By Application - Market Size and Forecast, 2025-2035
- 12.5.1 Segment Definition and Scope
- 12.5.2 Historical Market Size, 2018-2025
- 12.5.3 Revenue Forecast, 2025-2035
- 12.5.4 Volume Forecast, 2025-2035
- 12.5.5 Base-Year Market Share, 2025
- 12.5.6 Segment CAGR and Growth Drivers
- 12.5.7 Subsegment Market Size and Forecast
- 12.5.7.1 Transport Packaging
- 12.5.7.2 E-commerce Fulfillment Packaging
- 12.5.7.3 Shelf-Ready Packaging
- 12.5.7.4 Protective Industrial Packaging
- 12.5.8 Subsegment Pricing and Adoption Trends
- 12.5.9 Leading Suppliers and Competition
- 12.5.10 Regional Demand and Opportunities
- 12.6 By Technology - Market Size and Forecast, 2025-2035
- 12.6.1 Segment Definition and Scope
- 12.6.2 Historical Market Size, 2018-2025
- 12.6.3 Revenue Forecast, 2025-2035
- 12.6.4 Volume Forecast, 2025-2035
- 12.6.5 Base-Year Market Share, 2025
- 12.6.6 Segment CAGR and Growth Drivers
- 12.6.7 Subsegment Market Size and Forecast
- 12.6.7.1 Flexographic Printing
- 12.6.7.2 Digital Printing
- 12.6.7.3 Litho-Laminated Printing
- 12.6.7.4 Automated Right-Sizing and Box-on-Demand
- 12.6.8 Subsegment Pricing and Adoption Trends
- 12.6.9 Leading Suppliers and Competition
- 12.6.10 Regional Demand and Opportunities
- 12.7 Segment Growth Comparison
- 12.8 Segment Attractiveness and Priority Matrix
Chapter 13 Japan Corrugated Boxes End-Use and Application Market Outlook
- 13.1 End-Use Industry and Customer Demand Structure
- 13.2 Leading Applications and Customer Groups
- 13.3 End-Use Market Size, Share and Forecast
- 13.4 Major End-Use Industry Deep Dives
- 13.4.1 Customer Requirements and Use Cases
- 13.4.2 Demand and Replacement Cycles
- 13.4.3 Technical and Regulatory Considerations
- 13.4.4 Purchasing and Procurement Models
- 13.4.5 Leading Vendors and Distribution Channels
- 13.4.6 Forecast and Commercial Opportunities
- 13.5 Emerging Applications and Cross-Segment Demand
- 13.6 End-Use Industry Investment Priorities
Chapter 14 Japan Corrugated Boxes Geographic Market Outlook, 2025-2035
- 14.1 Domestic Market Distribution and Demand Clusters
- 14.2 State- or Province-Wise Market Size and Forecast, 2025-2035
- 14.3 City and Metropolitan Market Outlook
- 14.4 Industrial, Manufacturing and Commercial Clusters
- 14.5 Geographic Concentration of Key End Users
- 14.6 Local Pricing and Purchasing Differences
- 14.7 Domestic Production Facilities and Capacity Map
- 14.8 Local Infrastructure and Project Pipeline
- 14.9 State-Level Policy and Incentive Differences
- 14.10 Subnational Investment Hotspots and Opportunities
- 14.11 Distribution and Logistics Networks
- 14.12 Domestic Competitive Footprint
Chapter 15 Japan Corrugated Boxes Technology, Innovation and Sustainability Outlook
- 15.1 Technology Landscape and Maturity
- 15.2 Product, Process and Service Innovation
- 15.3 AI, Automation and Digital Tools in the Industry
- 15.4 Technology Adoption and Performance Benchmarking
- 15.5 Innovation Pipeline and R&D Investment
- 15.6 Patent and Intellectual Property Trends
- 15.7 Energy Efficiency and Resource Management
- 15.8 Sustainability, Recycling and Circularity
- 15.9 Technology Roadmap, 2025-2035
- 15.10 Risks of Obsolescence and Technology Substitution
Chapter 16 Japan Corrugated Boxes Market Key Strategic Imperatives
- 16.1 Growth and Market Entry Priorities
- 16.2 High-Return Products and Segments
- 16.3 Pricing, Profitability and Cost Optimization
- 16.4 Technology Investment and Product Differentiation
- 16.5 Supply Chain Localization and Resilience
- 16.6 Distribution and Customer Acquisition
- 16.7 Partnership, Acquisition and Capacity Strategy
- 16.8 Regional Expansion Priorities
- 16.9 Short-, Medium- and Long-Term Actions
Chapter 17 Competition Outlook
- 17.1 Industry Competition Characteristics
- 17.2 Market Structure and Concentration
- 17.3 Market Share and Competitive Positioning, 2025
- 17.4 Company-Wise Revenue and Product Benchmarking
- 17.5 Production and Service Capacity Benchmarking
- 17.6 Technology, Pricing and Differentiation
- 17.7 Regional Footprint and Distribution Strength
- 17.8 Mergers, Acquisitions and Strategic Alliances
- 17.9 New Entrants and Competitive Threats
- 17.10 Porter's Five Forces and Industry Attractiveness
- 17.11 Competitive Outlook, 2025-2035
Chapter 18 Company Profiles
- 18.1 Company Coverage and Selection Criteria
- 18.2 Rengo Co., Ltd.
- 18.2.1 Business Description
- 18.2.2 Company Ownership and Geographic Presence
- 18.2.3 Product and Service Portfolio
- 18.2.4 Manufacturing and Operating Footprint
- 18.2.5 Production Capacity and Expansion Plans
- 18.2.6 Financial Performance and Investment
- 18.2.7 Market Share and Competitive Position
- 18.2.8 Technology and Innovation Capabilities
- 18.2.9 Strategic Alliances or Partnerships
- 18.2.10 Recent Developments
- 18.2.11 Growth Strategy and Outlook
- 18.3 Oji Holdings Corporation (Oji Container, Mori Shigyo)
- 18.4 Tomoku Co., Ltd.
- 18.5 Dynapac Co., Ltd.
- 18.6 Daio Package Co., Ltd. (Daio Paper)
- 18.7 Ohmura Shigyo Co., Ltd.
- 18.8 Chuoh Pack Industry Co., Ltd.
- 18.9 Itoh Corrugated Industrial Co., Ltd.
- 18.10 Kariya Shiki Co., Ltd.
- 18.11 Other Relevant Market Participants
Note: Every listed company is profiled on the structure shown under the first company. The company list is preliminary and may change based on research findings, market developments, data availability and client requirements.
Chapter 19 Disclaimer
- 19.1 Research and Forecast Disclaimer
- 19.2 Data Source and Estimation Limitations
Note: The depth of individual sections depends on data availability for this market. Volume, capacity, trade and other unit-based metrics are included where applicable.