Food plants, hotels and plastic bans set UAE pack demand
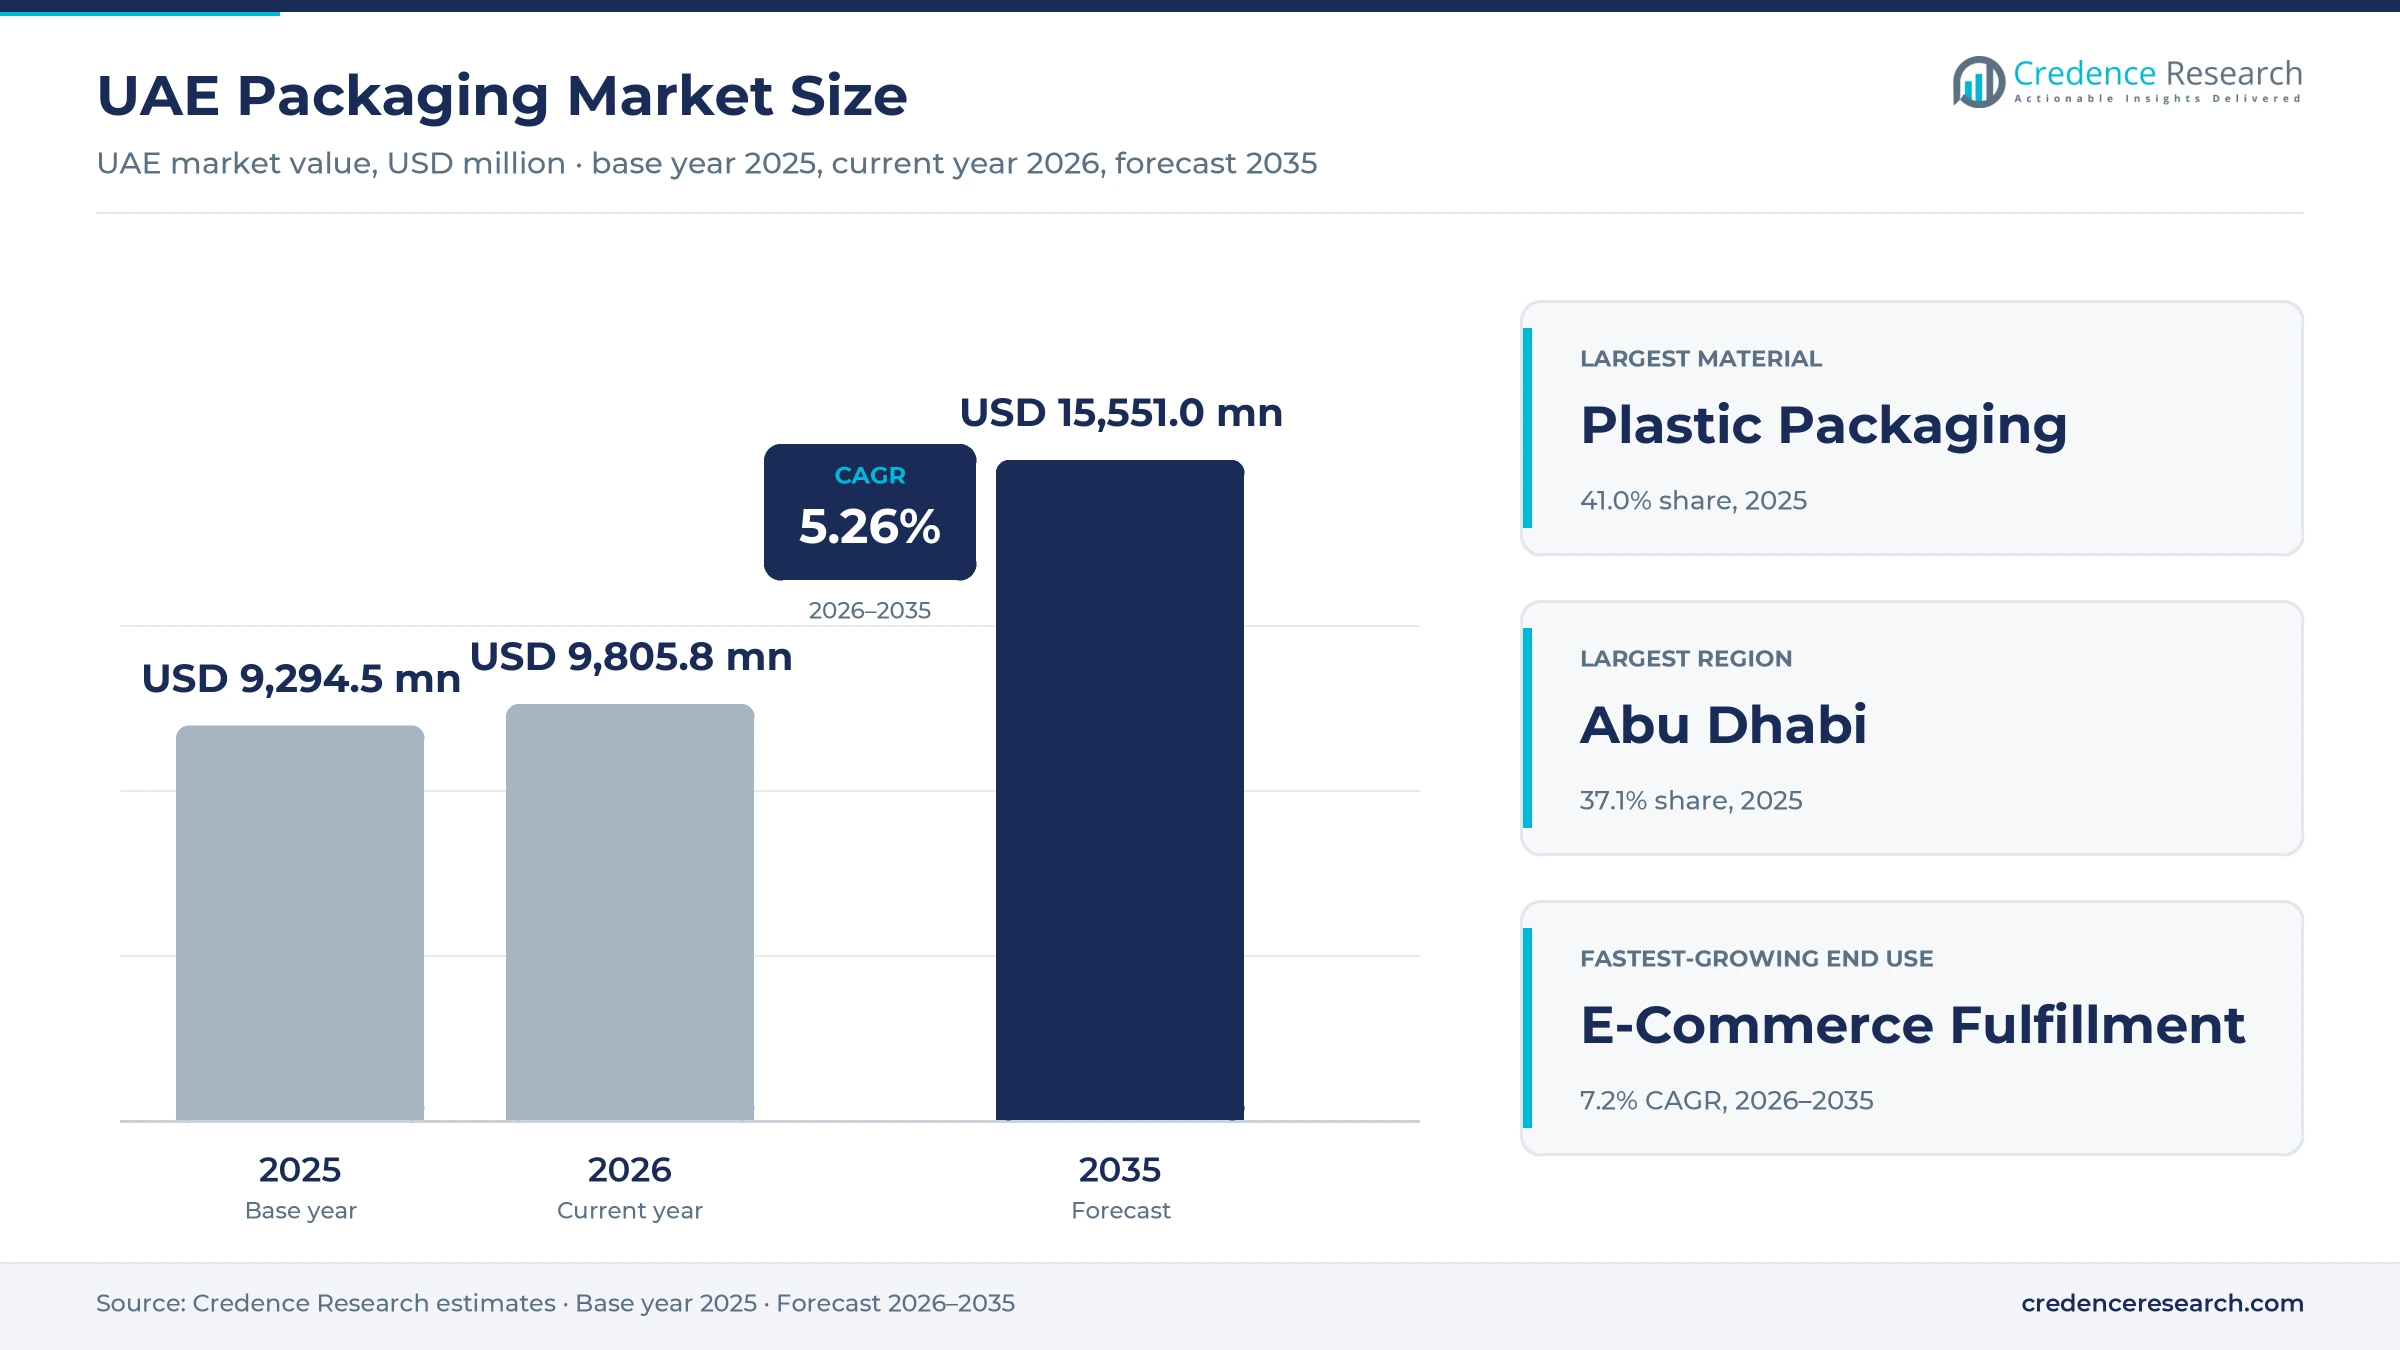
The UAE packaging market was valued at USD 9.29 billion in 2025 and is projected to increase from USD 9.81 billion in 2026 to USD 15.55 billion by 2035, registering a CAGR of 5.26% during 2026–2035. Spending rises with food processing that the government wants to expand, with hotel and restaurant consumption from record visitor numbers, and with federal and emirate bans that force brands to redesign single-use items. Abu Dhabi held the largest regional share, 37.1% in 2025, because its industrial plants and zones buy large volumes of transit, bulk and food packs. Dubai, with the larger population, converter base and visitor demand, is the fastest-growing region at 5.6% a year. Plastic remains the main material, but paper and paperboard gain share because the second phase of the federal single-use ban took effect on Jan. 1, 2026. New local capacity for recycled PET, containerboard and bio-based resin is due by 2028, which will change where converters buy their raw materials.
Food, hotel and industrial buyers shape what UAE converters make
The market counts the value of primary, secondary and tertiary packaging sold to users in the UAE, including plastic, paper and paperboard, metal, glass, wood, bioplastic and composite packs in rigid, flexible and semi-rigid formats. Manufacturing brand owners buy mostly under direct supply contracts, while retail and hospitality buyers and contract packers also buy through distributors and online packaging stores.
Packaging machinery, labels sold separately and empty packs imported already filled with goods are outside the scope. The value chain runs from resin, board and metal suppliers through local converters and global specialists to distributors, fillers, retailers, hotels and restaurants, and then to recyclers that collect used packs.
UAE Packaging Market Insights
- The UAE packaging market grows from USD 9.29 billion in 2025 to USD 15.55 billion by 2035 at a 5.26% CAGR as local food output, hotel volumes and plastic bans change demand.
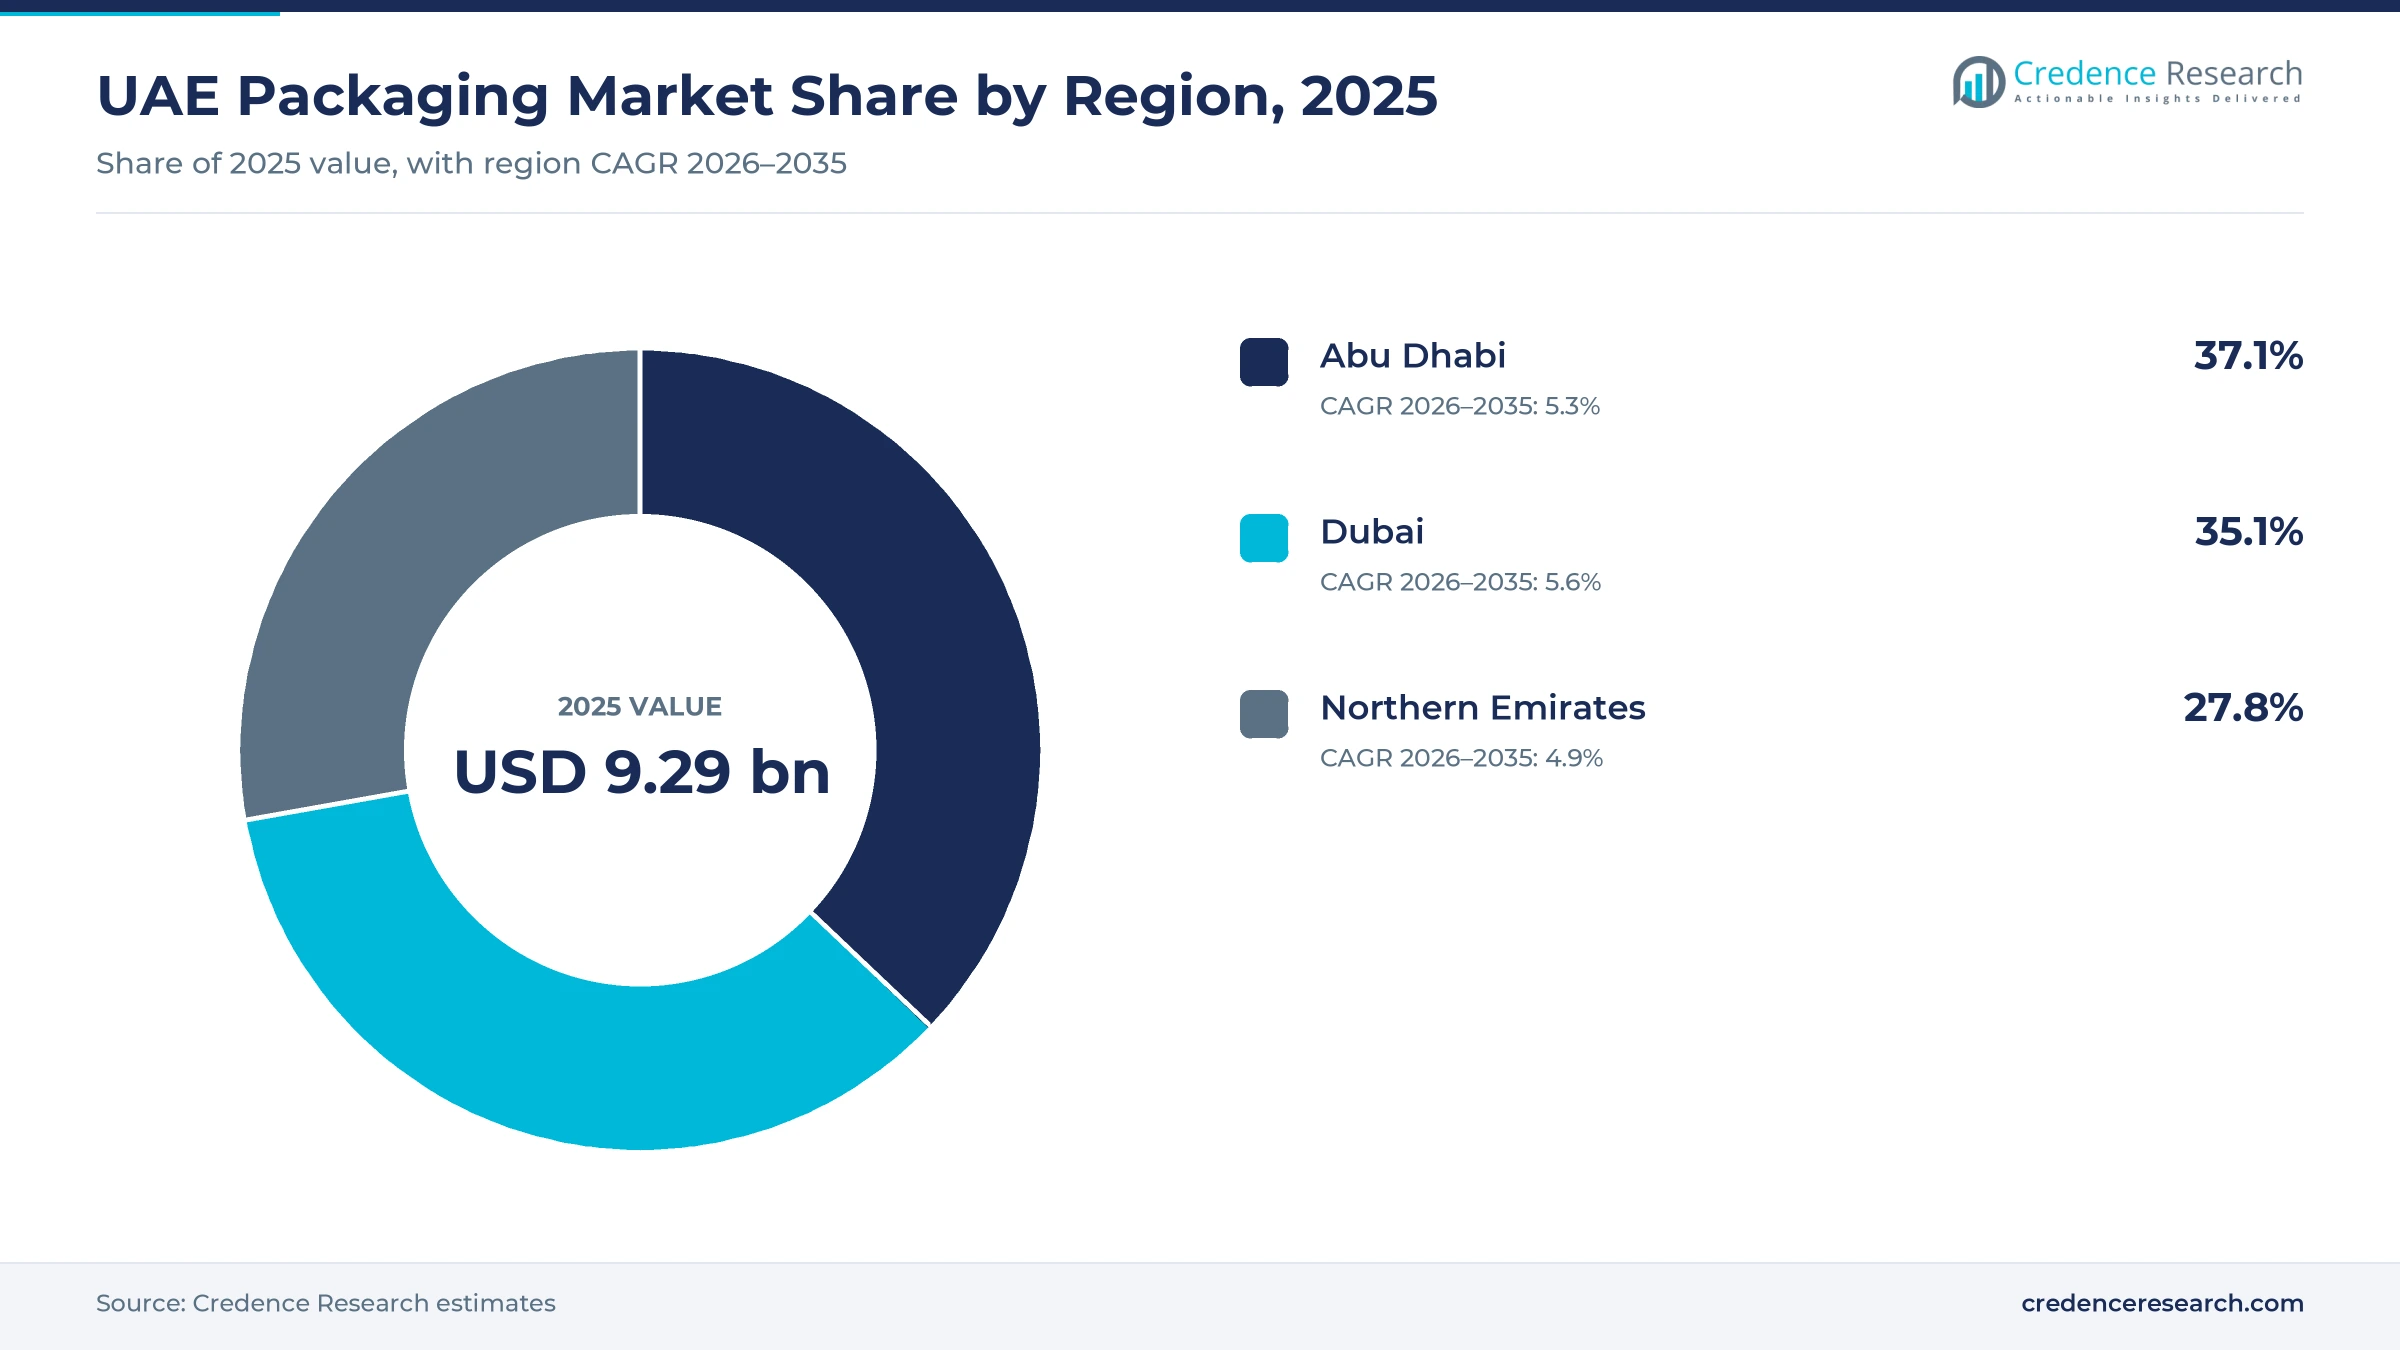
- Abu Dhabi held the largest regional share at 37.1% in 2025 on its industrial base, while Dubai, with the larger population, grows fastest at 5.6% a year.
- Plastic packaging led materials with 41.0% in 2025, while paper and paperboard grows fastest at 6.3% a year to 2035.
- The second phase of the federal single-use plastic ban took effect on Jan. 1, 2026, covering cups, lids, cutlery, plates, straws and foam food boxes.
- Al Bayader International agreed in June 2026 to add up to 30,000 tons a year of food packaging capacity at National Industries Park by early 2028.
Plastic leads while paper and e-commerce packs grow fastest
Plastic holds the largest share as paper grows fastest
Based on material type, the market is categorized into plastic packaging, paper and paperboard packaging, metal packaging, glass packaging and wood, bioplastic and composite packaging. Plastic Packaging led with 41.0% of 2025 value because bottled water, dairy and takeaway food rely on PET and polyolefin packs, and Hotpack opened a 500,000 sq ft PET plant at National Industries Park in November 2022, according to Gulf News. Paper and Paperboard Packaging grows fastest at 6.3% a year as Star Paper Mills prepared a USD 54 million, 135,000-ton containerboard mill in KEZAD, presented at ProPaper 2025. Local fiber from that mill will make paper substitutes cheaper for UAE converters.
Rigid packs lead while flexible formats grow fastest
Based on product type, the market is categorized into rigid packaging, flexible packaging and semi-rigid packaging. Rigid Packaging led with 52.0% of 2025 value because water, juice and dairy bottlers, beverage cans and corrugated shipping cases all use rigid formats, and Arabian Packaging alone runs more than 100,000 tons a year of corrugated capacity in Jebel Ali. Flexible Packaging grows fastest at 5.8% a year as converters such as Amber Packaging Industries make high-barrier, ovenable and recyclable mono-material films for food and medicine. Lighter pouches and films cut freight costs for food that is imported in bulk and repacked locally.
Food and beverage leads as e-commerce packs grow fastest
Based on end-use industry, the market is categorized into food and beverage, pharmaceutical and healthcare, personal care and cosmetics, e-commerce fulfillment and agricultural and industrial products. Food and Beverage led with 52.0% of 2025 value because the state producer EKTIFA plans 140 new locally made food items over 2026 and 2027 and milk output of 300,000 liters a day by 2029, up from 130,000, according to Gulf News in April 2026. E-Commerce Fulfillment grows fastest at 7.2% a year as UAE online sales reached AED 42.2 billion in 2025, or 15.7% of retail sales, according to EZDubai, the Dubai South logistics zone. Each online order needs its own shipper, void filler and mailer.
Direct contracts lead as online packaging stores grow fastest
Based on sales channel, the market is categorized into direct manufacturer contracts, packaging distributors and digital packaging stores. Direct Manufacturer Contracts led with 62.0% of 2025 value because dairy, juice and water fillers buy packaging together with filling lines and service, and Tetra Pak launched its Factory OS automation portfolio at Gulfood Manufacturing in November 2025. Digital Packaging Stores grow fastest at 7.6% a year as restaurants and small retailers order online, with Hotpack running an e-commerce store covering all GCC countries and Falcon Pack outlets in Khalifa City, Nadd Al Hamar and Kalba listed on the talabat delivery app.
| Segment Group | Leading Sub-segment | Share, 2025 | Fastest-growing Sub-segment | CAGR, 2026–2035 |
|---|---|---|---|---|
| By Material Type | Plastic Packaging | 41.0% | Paper and Paperboard Packaging | 6.3% |
| By Product Type | Rigid Packaging | 52.0% | Flexible Packaging | 5.8% |
| By End-Use Industry | Food and Beverage | 52.0% | E-Commerce Fulfillment | 7.2% |
| By Sales Channel | Direct Manufacturer Contracts | 62.0% | Digital Packaging Stores | 7.6% |
Carton prices separate bulk foodservice from branded packs
Foodservice packaging in the UAE is priced per carton of 500 or 1,000 pieces, so buyers compare cost per unit rather than pack price. A plain single wall cup bought by the carton costs about AED 0.08 each, while a similar cup bought in a 50-piece retail pack costs about six times as much, which keeps restaurants on direct and online trade channels. Printed cups carry a large premium because short runs need plates and setup. Paperboard and resin costs move prices most, and the 2026 ban on plastic cups and lids has pushed demand toward paper items that cost more per unit, so value grows faster than volume.
| Product | Typical price or fee | Basis |
|---|---|---|
| Hotpack 7 oz white single wall paper cups, 1,000 pieces | AED 75.00 | Hotpack webstore lists, November 2026 |
| Hotpack 4 oz white lids for paper cups, 1,000 pieces | AED 63.00 | Hotpack webstore lists, November 2026 |
| Hotpack single wall customizable paper cups, 1,000 pieces | From AED 1,350.00 | Hotpack webstore lists, November 2026 |
| Hotpack 9 oz paper cups, 50 pieces at retail | AED 24.38 including VAT | Carrefour UAE lists, November 2026 |
Request a Free Sample
Fill in your details and we'll send you a free sample report.
- Sample data tables & charts
- Research methodology
Local food output, hotel volumes and bans lift demand
Domestic food processing raises local packing volumes
The government wants more food processed at home, and every new local line needs bottles, cartons, trays and films. The UAE imports more than 90% of its food, and Economy Minister Abdulla bin Touq Al Marri said in January 2026 that food processing leads the national cluster strategy, with more than 50 companies in the first food cluster, according to Gulf News. The wider factory base is large, with manufacturing value added of about USD 51.8 billion in 2024, or 9.4% of GDP, according to the World Bank. Local dairy, sauces and baked goods replace imports that arrived already packed. Converters close to food zones in Abu Dhabi and Dubai gain the most, because fillers want short lead times and printed packs in Arabic.
Hotel and restaurant consumption needs constant replenishment
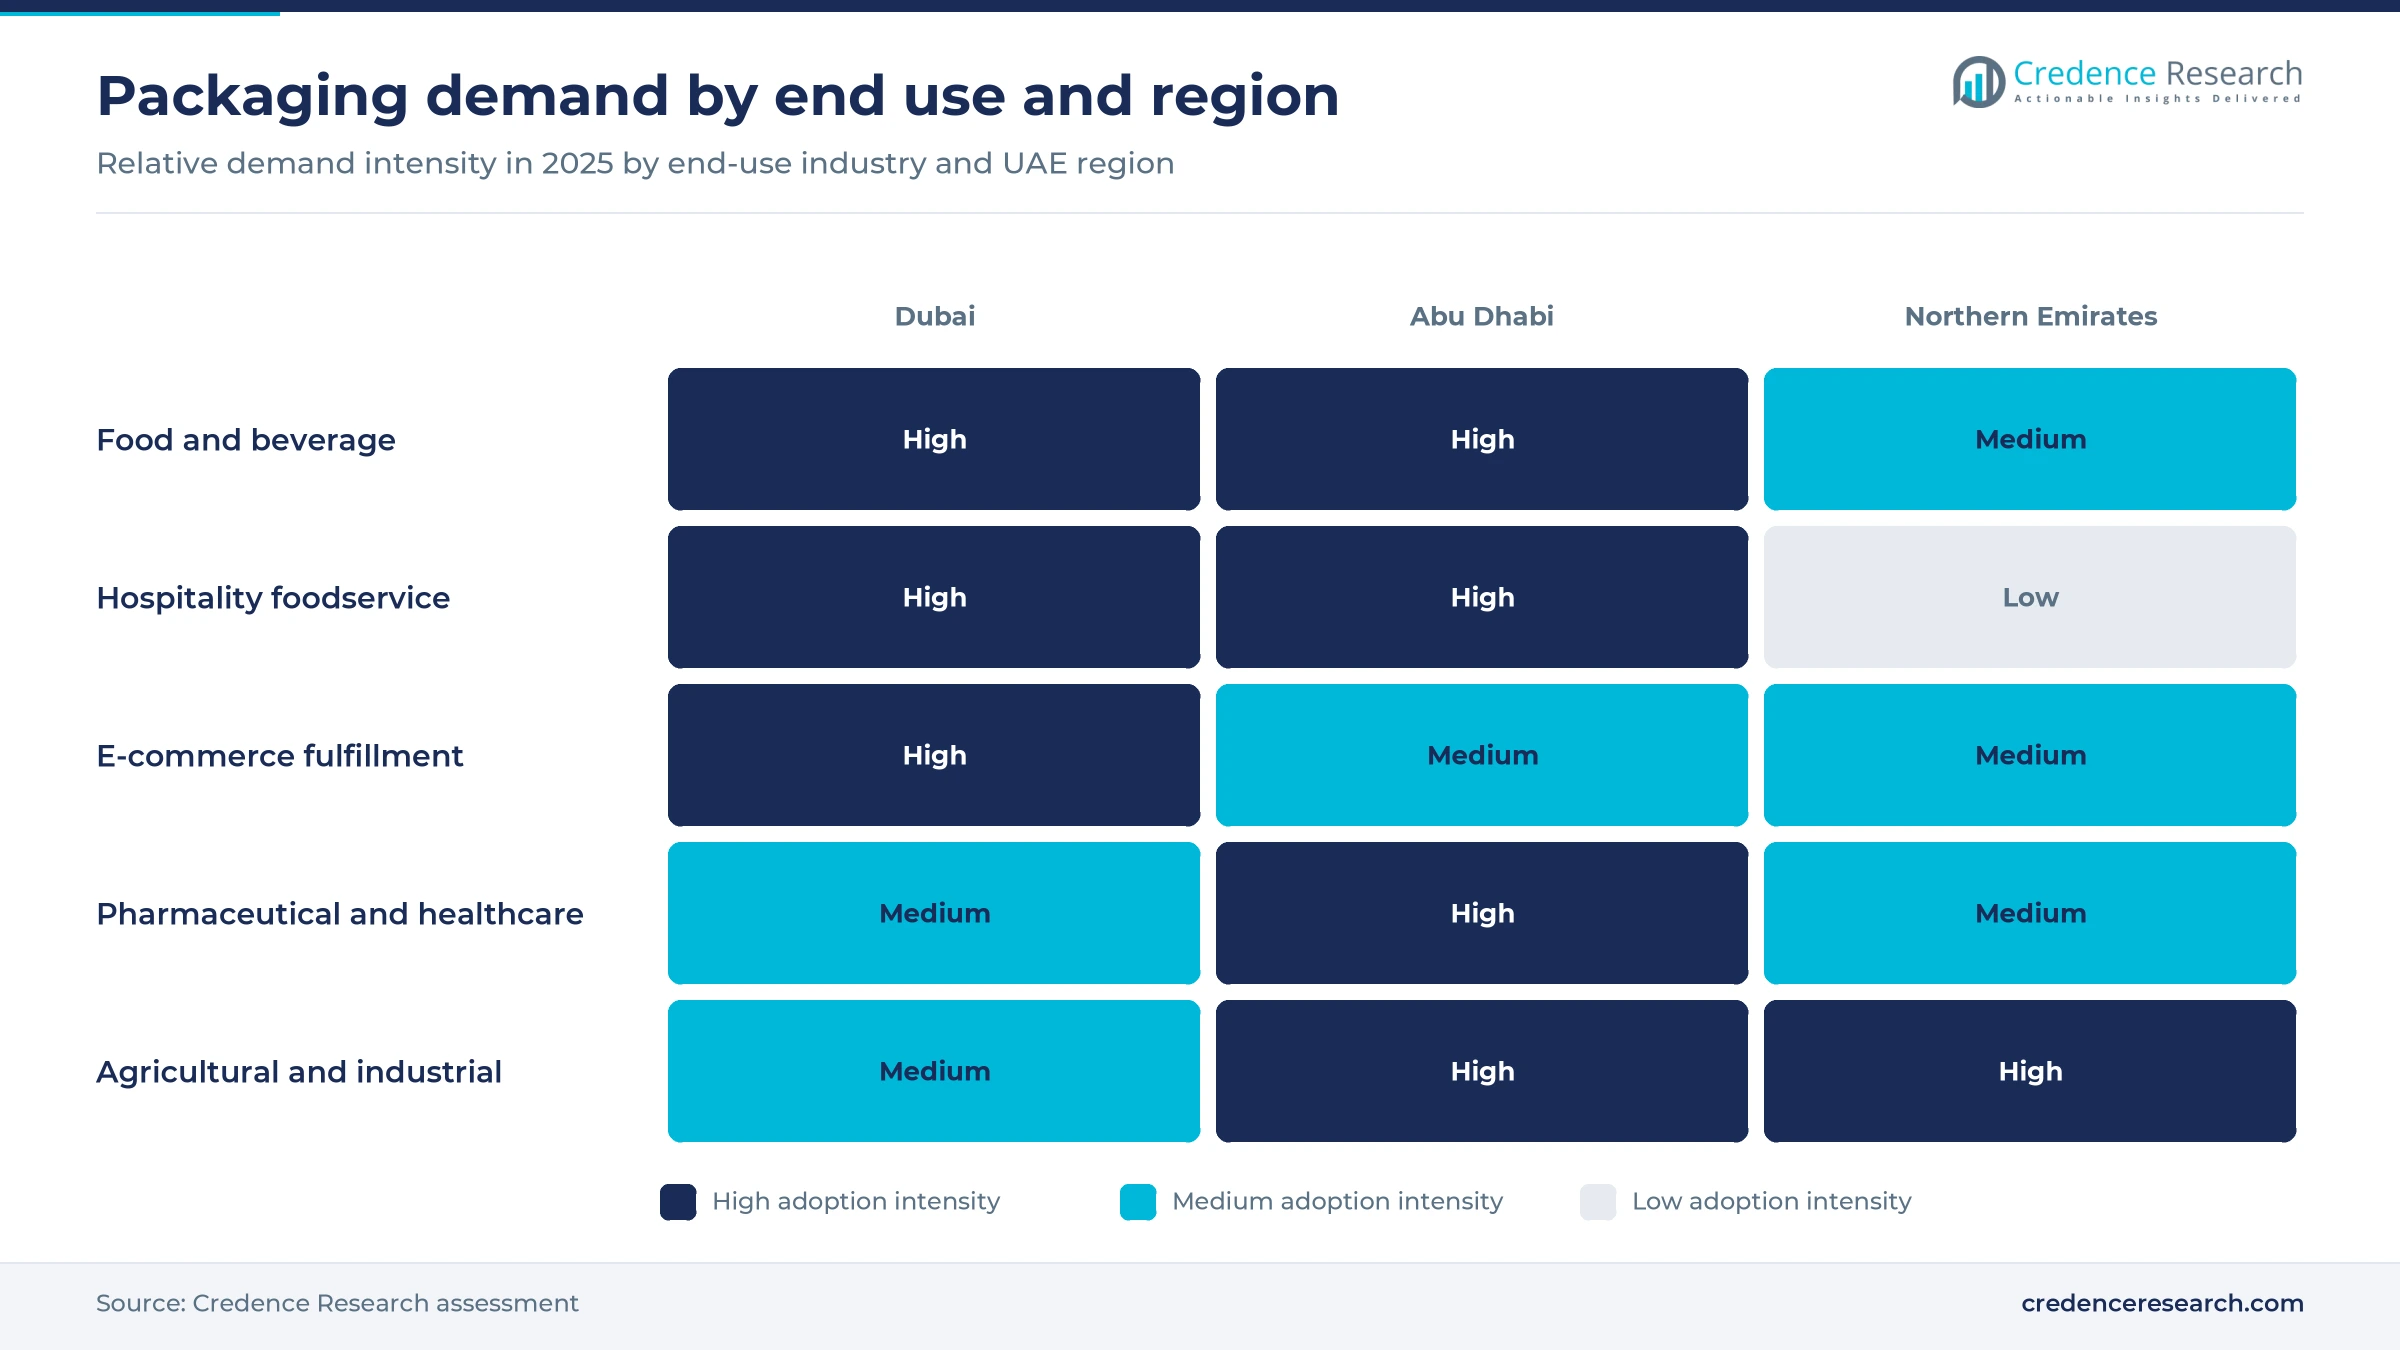
Hospitality is a steady buyer of cups, containers, bags and portion packs, because every occupied room and meal uses packaging that is thrown away. Dubai received 19.59 million international overnight visitors in 2025, with hotel occupancy of 80.7% across the emirate, according to the Department of Economy and Tourism reported by Gulf News. Occupied room nights in Dubai rose 4% to 44.85 million during the year. Abu Dhabi hosted 5.9 million hotel guests in 2025 at 81% occupancy, according to DCT Abu Dhabi. This demand reaches converters through food services contracts, catering and delivery apps. Suppliers that can deliver small, frequent orders of cups, containers and bags at short notice therefore win repeat business from hotel groups.
Plastic bans force product redesign across single-use items
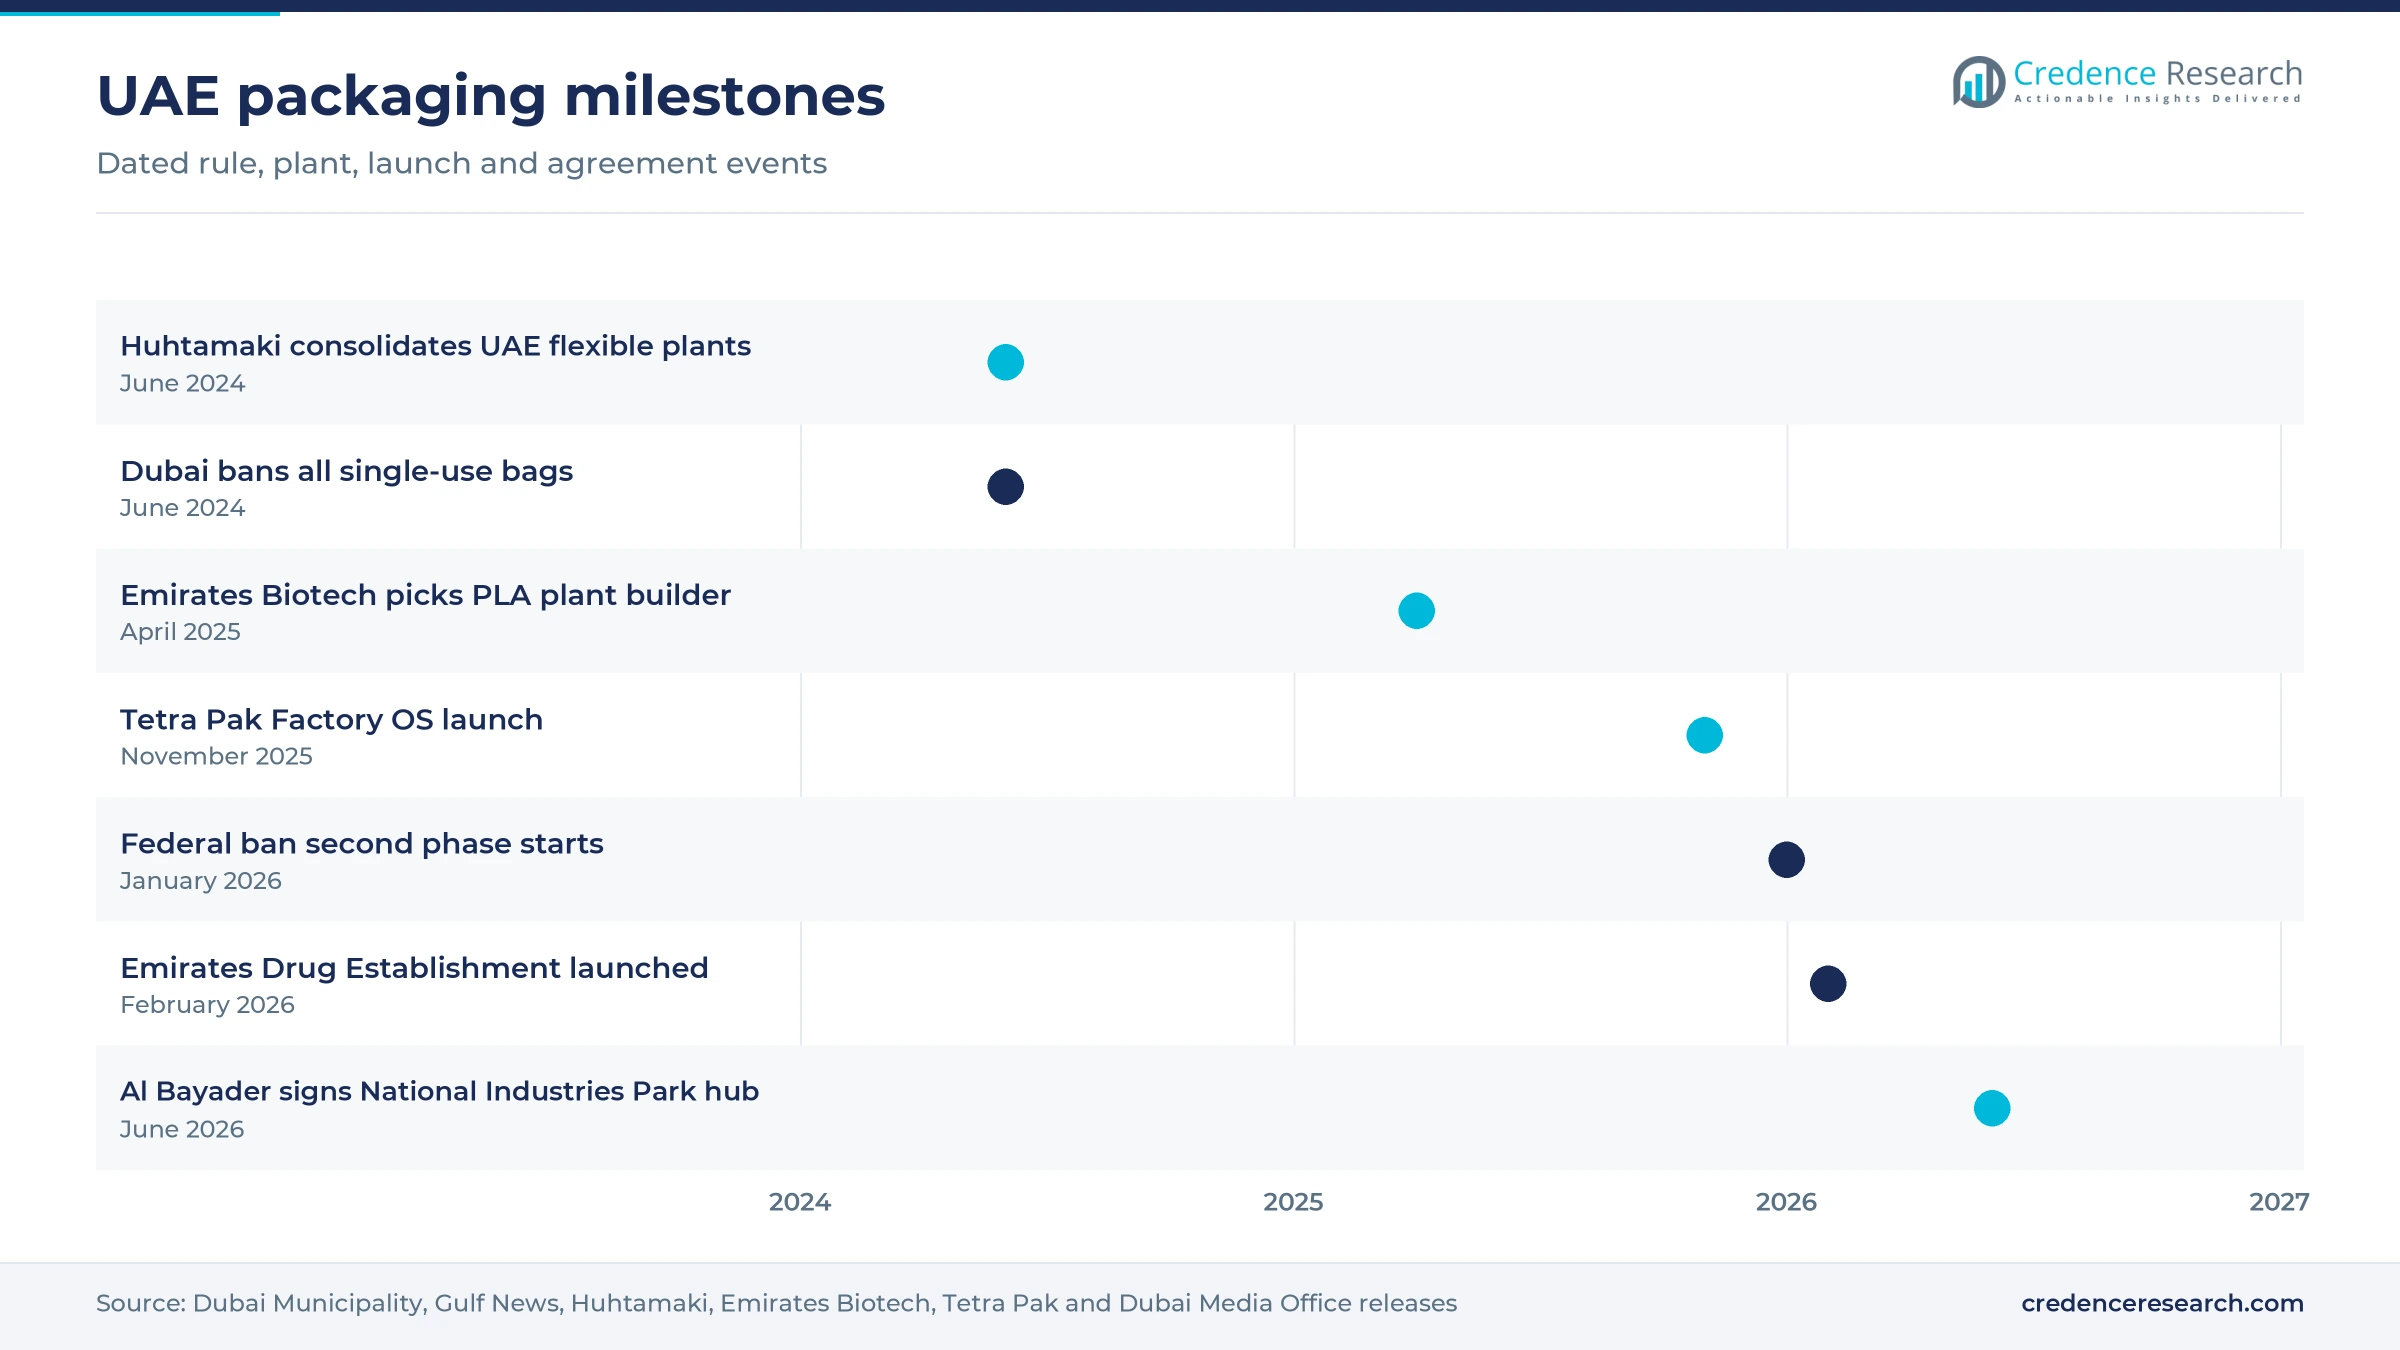
Federal and emirate rules are replacing whole product lines, which creates demand for new materials and formats. Under Ministerial Decision No. 380 of 2022, the second phase that started on Jan. 1, 2026 bans single-use plastic cups and lids, cutlery, plates, straws, stirrers and foam food boxes, and all single-use bags thinner than 50 microns, according to Gulf News. Dubai applied its final phase on Jan. 1, 2026 under Executive Council Resolution No. 124 of 2023, after banning all single-use bags from June 1, 2024. Brands now buy paper, molded fiber and reusable items, which raises the value of each pack. Converters that already make paper formats gain share from those that only make plastic.
Trade hub status adds secondary and tertiary packing
Goods passing through UAE ports and free zones are repacked, palletized and shipped again, and that repacking lifts demand for cases, stretch film and pallets. Non-oil foreign trade rose 26% to more than USD 1 trillion in 2025, with re-exports of Dh830.2 billion, up 15.7%, according to The National. Industrial exports passed Dh262 billion in 2025, and the industrial sector's GDP contribution rose nearly 70% since 2021 under Operation 300bn, according to Khaleej Times. Demand for corrugated boxes and transit packs therefore tracks trade volumes, not only local consumption. Converters near Jebel Ali and KEZAD gain most, because re-export packing needs fast turnaround at the port.
Recycling loops and mega-hubs reshape local supply
Local recycling loops emerge for cartons and bottles
Used packs are starting to return to UAE factories instead of landfill, which gives brands a local source of recycled content. Tetra Pak and Union Paper Mills invested AED 2.5 million in a line that recycles up to 10,000 tons of post-consumer cartons a year, and Dubai-based TERRAX now processes the leftover polyethylene and aluminum layers, according to FoodTechBiz in November 2025. The Environment Agency Abu Dhabi recovered more than 2,000 tons of bottles through more than 100 reverse vending machines by April 2025. Supply of recycled PET feedstock will rise as these schemes scale, cutting the cost of meeting recycled-content targets for bottlers.
Packaging makers shift toward integrated mega-hubs
Large converters are consolidating production, warehousing and online sales on single sites to cut cost and serve the Gulf from one base. Al Bayader International signed with National Industries Park in June 2026 for an AED 180 million complex adding up to 30,000 tons a year of paper and circular plastic packaging, with full operations targeted for early 2028. Hotpack bought Al Huraiz Packaging in Dubai Investment Park in October 2022 and invested AED 100 million to double its corrugated output, according to IndiFoodBev. Hotpack described the plant as its 14th manufacturing plant overall. Scale lets these groups bundle paper, plastic and corrugated items for one buyer.
Bio-based resin capacity opens a local supply route
A local source of bio-based resin is an opening for converters that want ban-compliant products without imported materials. Emirates Biotech plans a plant for polylactic acid with 160,000 tons a year in two phases of 80,000 tons, using Sulzer technology, according to Packaging Insights in December 2024. It chose Samsung E&A in April 2025 to build the plant in KEZAD, with operations expected in early 2028, according to Biofuels Digest. Local resin supply would shorten lead times for compostable cups, films and trays. Converters that qualify PLA grades before 2028 can win the first contracts from hotel groups and food brands.
Pharmaceutical localization opens high-specification demand
Medicines made in the UAE need blister foils, bottles, cartons and inserts that meet strict quality rules, which is an opening for specialist converters. The Emirates Drug Establishment, launched on Feb. 9, 2026, has licensed 37 facilities to produce human pharmaceutical and medical products, according to Gulf News. Amber Packaging Industries says it makes suppository films in-house, the first such production in the Middle East, and holds BRC and ISO certification. Local supply also serves retail pharmacies that stock locally made generics. Suppliers with clean-room lines and pharmaceutical audits can earn higher margins than food converters.
Converter shakeout, fiber gaps and dual SKUs test makers
Plastic bans shrink the converter base
Bans have already removed many small plastic converters, which concentrates supply and strands old equipment. In Abu Dhabi, single-use plastic manufacturers fell from 110 in 2022 to 88 in 2023, while bag use at checkouts fell 95%, according to The National in December 2024. Small firms that cannot fund paper or molded fiber lines lose their main products. Buyers face fewer local suppliers for low-cost items until new capacity opens.
Local fiber supply lags demand for paper packs
Paper packaging grows faster than local fiber supply, so converters still depend on imported board and waste paper. Star Paper Mills plans to source up to 80% of its waste paper domestically and import the rest from countries including the United States and the United Kingdom, according to Packaging MEA. Freight swings on imported board raise costs for paper cups and boxes. Converters manage the gap with long-term board contracts and local recycled fiber.
Consolidation costs weigh on flexible converters
Competition has forced even global specialists to cut sites in the UAE. Huhtamaki said on June 3, 2024 that it would consolidate three flexible packaging plants into its Jebel Ali and Ras Al Khaimah sites, booking about EUR 4 million of costs, according to Packaging Gateway. Smaller flexible converters face the same price pressure without the scale to absorb it. The result is fewer, larger plants and tighter margins on commodity films.
Exemption rules require separate export products
Since Jan. 1, 2026, the federal ban has exempted items made only for export or re-export if they are clearly labeled and not sold in the UAE, according to Gulf News. Bags made from recycled material within the UAE are also exempt, which favors local recyclers. Converters that serve both local and export buyers must therefore run separate product lines, labels and stock. This adds cost and complexity, especially for mid-sized firms that export to Africa and South Asia.
Abu Dhabi leads on industry while Dubai grows fastest
| Region | Value, 2025 (USD billion) | Share, 2025 | CAGR, 2026–2035 |
|---|---|---|---|
| Abu Dhabi | 3.45 | 37.1% | 5.3% |
| Dubai | 3.26 | 35.1% | 5.6% |
| Northern Emirates | 2.58 | 27.8% | 4.9% |
Abu Dhabi holds the largest share through its industrial base
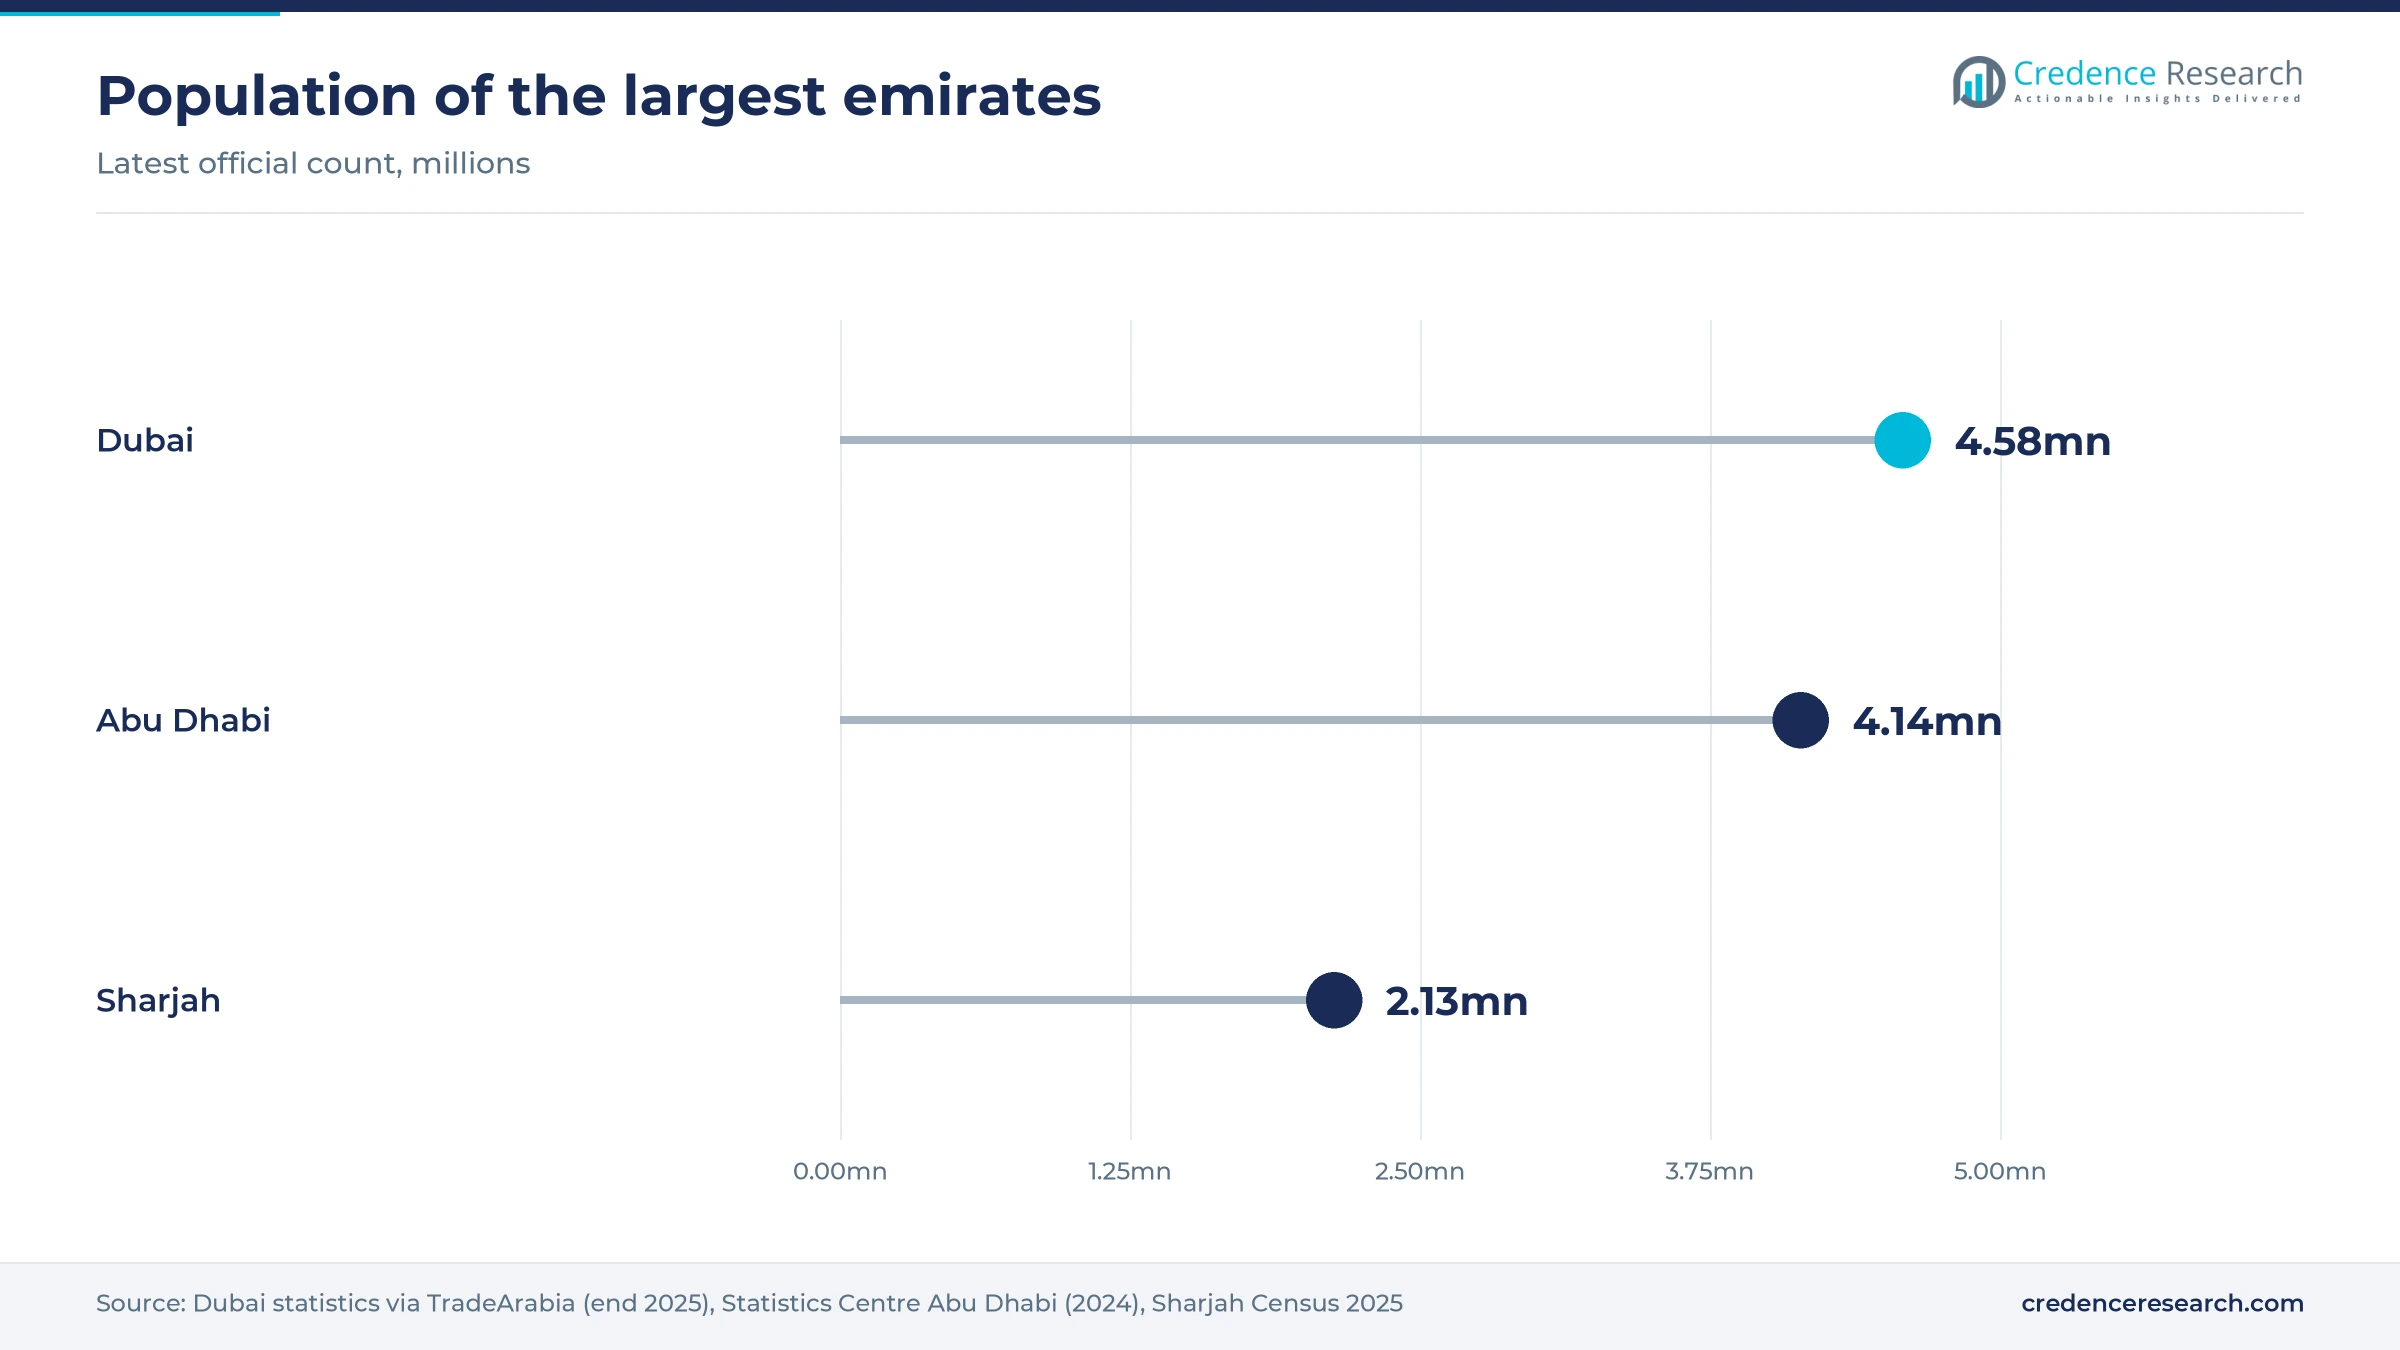
Abu Dhabi held 37.1% of 2025 value and grows at 5.3% a year. Its industrial GDP reached Dh111.6 billion in 2024, up 23% since 2022, and the number of industries rose 19% to 1,104, according to the Abu Dhabi Department of Economic Development as reported by The National. These plants buy pallets, drums, films and cases in bulk, and KEZAD hosts new paper and bio-based resin projects. The Statistics Centre Abu Dhabi put the population at 4.14 million in 2024, so local consumer demand is smaller than Dubai's.
Dubai grows fastest on population, trade and hotels
Dubai held 35.1% of 2025 value and grows at 5.6% a year, the fastest of the three regions. It has the larger population, converter base and visitor demand, and its population passed 4.58 million at the end of 2025, up 7.5% in a year, according to TradeArabia. Jebel Ali and National Industries Park host the largest converters, including Hotpack, Huhtamaki and Arabian Packaging. Hotel demand and online retail add small, frequent orders, so Dubai converters invest in printing, warehousing and same-day delivery.
Northern Emirates serve as a lower-cost production base
The Northern Emirates held 27.8% of 2025 value and grow at 4.9% a year. Sharjah counted 2.13 million residents in its 2025 census, up 51% in ten years, according to Khaleej Times. Ras Al Khaimah Economic Zone hosts Universal Carton Industries, which planned a threefold rise in corrugated capacity to 100,000 tons a year, and Amber Packaging. Lower land and labor costs attract export-oriented converters that supply Dubai fillers and exporters by road, so part of what these plants make serves demand counted in Dubai.
Bans, new hubs and pharma localization marked 2024 to 2026
| Development | Status and market relevance |
|---|---|
| In June 2024, Huhtamaki announced the consolidation of three flexible packaging plants in the UAE into its Jebel Ali and Ras Al Khaimah sites. | Announced; transition from the second half of 2024 |
| In April 2025, Emirates Biotech selected Samsung E&A to build its PLA plant in KEZAD, Abu Dhabi. | Contracted; operations expected in early 2028 |
| In November 2025, Tetra Pak launched its Factory OS automation portfolio at Gulfood Manufacturing in Dubai. | Launched; links filling lines with digital services |
| In February 2026, the Emirates Drug Establishment was launched with 37 licensed pharmaceutical production facilities. | Launched; supports local medicine packaging demand |
| In June 2026, Al Bayader International signed with National Industries Park for an AED 180 million packaging complex. | Signed; construction starts in 2026 |
Mono-material films and carton recycling change pack design
- Mono-material films replace mixed laminates with a single polymer family, so flexible food and medicine packs can be recycled where collection exists and brands can meet future recycled-content rules.
- Carton fiber recovery separates paper fiber from polyethylene and aluminum layers at Union Paper Mills, and the leftover layers now go to a second local recycler instead of landfill.
- Compressed PET cups withstand hot drinks near 100 degrees Celsius, according to Hotpack, which lets PET replace banned foam cups in some hotel and cafe uses.
- Connected filling lines link packaging material supply with machine data and maintenance, which ties dairy, juice and water fillers to one carton supplier for years.
Need a Custom Version of This Report?
Tailor the scope, geography, or segments to your exact requirements.
- Custom geography or segment scope
- Direct access to our analyst team
Integrated converters and global specialists split the shelf
Competition turns on who can switch fastest from banned plastic items to paper and recyclable formats. Hotpack and Al Bayader International use large Dubai hubs to offer a full range of cups, containers, bags and boxes to restaurants and hotels. Falcon Pack reaches small buyers through its own outlets and delivery apps. Tetra Pak ties dairy and juice producers to its cartons through filling lines and service, and works with local recyclers to keep cartons in use. Huhtamaki and Amber Packaging Industries compete for food and pharmaceutical brands on barrier films and certifications. Arabian Packaging competes on corrugated scale for exporters and e-commerce sellers. Price competition is sharpest in commodity foodservice items, while specialist grades are won on quality audits and technical support.
Integrated local groups and global specialists form two tiers
The UAE supply side splits into local integrated groups and global specialists. Hotpack, Al Bayader International and Falcon Pack make paper, plastic and corrugated foodservice items and sell them directly, through distributors and in their own shops and web stores. Arabian Packaging, part of the Al Ghurair group, and Universal Carton Industries supply corrugated cases to food, farm and e-commerce shippers. Tetra Pak and Huhtamaki compete on technology, food safety and global contracts, and margins sit highest in aseptic cartons, high-barrier films and pharmaceutical packs. Entry is easy for commodity items but hard for food-contact and pharmaceutical grades that need audits.
Companies profiled and their roles in this market
| Company | Type | Role in the market |
|---|---|---|
| Tetra Pak | Global carton and filling systems supplier | Partnered with Union Paper Mills on carton recycling and launched Factory OS in November 2025 |
| Hotpack Global | Integrated foodservice packaging maker | Runs a 500,000 sq ft PET plant at National Industries Park and acquired Al Huraiz Packaging |
| Huhtamaki | Global flexible and foodservice packaging maker | Consolidated UAE flexible packaging production into Jebel Ali and Ras Al Khaimah from 2024 |
| Al Bayader International | Integrated foodservice packaging maker | Signed for an AED 180 million complex at National Industries Park in June 2026 |
| Arabian Packaging | Corrugated packaging maker | Operates more than 100,000 tons a year of capacity in Jebel Ali |
| Falcon Pack | Foodservice packaging maker and retailer | Sells through outlets listed on the talabat delivery app across several emirates |
| Amber Packaging Industries | Flexible and pharmaceutical packaging maker | Makes high-barrier films and suppository films with BRC and ISO certification |
Substitution, not volume, decides who gains share
Credence Research's view is that substitution, not volume, will decide who gains share in UAE packaging to 2035. The 2026 bans move spending from cheap plastic items to paper, molded fiber and recyclable formats that cost more per unit, so value grows faster than the number of packs. Integrated groups with Dubai hubs and their own fiber or recycled resin supply are best placed. Global specialists keep the higher-margin carton, barrier film and pharmaceutical work, while small plastic converters face the hardest decade. Paper and paperboard, growing at 6.3% a year, is the material that UAE packaging buyers will add fastest.
Population, trade and plant data anchor the estimate
The report uses 2025 as the base year and 2026 to 2035 as the forecast period. Market values come from the Credence Research model, which builds demand from population, visitor volumes, food and industrial output, and trade data. Segment and regional splits are Credence Research estimates built from World Bank, Statistics Centre Abu Dhabi and Dubai statistics, federal and Dubai Municipality rules, company announcements and published list prices. No interviews or primary surveys were conducted for this edition.
Fiber, recycled resin and online packs gain by 2035
The UAE packaging market is expected to grow from USD 9.81 billion in 2026 to USD 15.55 billion by 2035 at a 5.26% CAGR. Paper and paperboard will gain the most share as bans widen and local containerboard comes online. E-commerce and pharmaceutical packs will grow faster than food packs, though food and beverage stays the largest user. Dubai will add the most new demand as its population and trade rise. By 2035, a larger part of packaging is likely to use fiber and resin recovered within the UAE.
Ban enforcement and new local capacity set the 2035 range
The range of outcomes depends on how fast new local fiber, recycled resin and bio-based resin capacity opens, and on whether visitor numbers keep rising. A downside case assumes delays to the 2028 projects, slower tourism and tighter margins that remove more small converters. The base case assumes steady food plant growth and on-time hub openings. An upside case needs faster local food processing, wider recycled-content rules and strong e-commerce growth, which would lift spending per pack.
| Scenario | CAGR, 2026–2035 | Value, 2035 | What has to hold |
|---|---|---|---|
| Downside | 3.9% | USD 13.79 billion | Fiber and resin projects slip, tourism slows and small converters exit |
| Base | 5.26% | USD 15.55 billion | Food plants expand and new hubs open on schedule by 2028 |
| Upside | 6.5% | USD 17.22 billion | Food processing and online retail grow faster and recycled-content rules widen |
Frequently Asked Questions
How big is the UAE packaging market?
Which material leads UAE packaging?
Which region leads the UAE packaging market?
Which single-use plastic items are banned in the UAE from 2026?
Which end-use industry grows fastest?
What new packaging capacity is planned in the UAE?
Who are the key companies in the UAE packaging market?
What do paper cups cost in the UAE?
Table of Content
Chapter 1 Market Segmentation
- 1.1 Segmentation Framework
- 1.1.1 Product and Service Classification
- 1.1.2 Application and End-Use Classification
- 1.1.3 Technology and Solution Classification
- 1.1.4 Customer and Distribution Channel Classification
- 1.1.5 Geographic Segmentation
- 1.1.6 Market Segment Definitions and Boundaries
- 1.2 By Material Type
- 1.2.1 Plastic Packaging
- 1.2.2 Paper and Paperboard Packaging
- 1.2.3 Metal Packaging
- 1.2.4 Glass Packaging
- 1.2.5 Wood, Bioplastic and Composite Packaging
- 1.3 By Product Type
- 1.3.1 Rigid Packaging
- 1.3.2 Flexible Packaging
- 1.3.3 Semi-Rigid Packaging
- 1.4 By End-Use Industry
- 1.4.1 Food and Beverage
- 1.4.2 Pharmaceutical and Healthcare
- 1.4.3 Personal Care and Cosmetics
- 1.4.4 E-Commerce Fulfillment
- 1.4.5 Agricultural and Industrial Products
- 1.5 By Sales Channel
- 1.5.1 Direct Manufacturer Contracts
- 1.5.2 Packaging Distributors
- 1.5.3 Digital Packaging Stores
Chapter 2 Introduction
- 2.1 Report Objectives and Scope
- 2.2 Product Definition and Industry Terminology
- 2.3 Market Inclusions and Exclusions
- 2.4 Research Process
- 2.4.1 Primary Research and Expert Interviews
- 2.4.2 Secondary Research and Source Review
- 2.4.3 Top-Down and Bottom-Up Estimation
- 2.4.4 Data Triangulation and Verification
- 2.5 Market Size Measurement Basis
- 2.5.1 2025: USD 9.29 billion → 2035: USD 15.55 billion
- 2.6 Historical and Forecast Reference Periods
- 2.6.1 Historical Period: 2018-2025
- 2.6.2 Base Year: 2025
- 2.6.3 Forecast Period: 2025-2035
- 2.7 Research Assumptions and Limitations
Chapter 3 Executive Summary
- 3.1 Market Snapshot and Key Findings
- 3.2 Base-Year Market Size, 2025
- 3.3 Forecast Market Size, 2035
- 3.4 Revenue and Volume Growth Outlook
- 3.5 Key Demand and Supply Indicators
- 3.6 Leading Market Segments
- 3.7 Fastest-Growing Market Opportunities
- 3.8 Regional Performance Highlights
- 3.9 Technology and Industry Transformation
- 3.10 Competitive Landscape Summary
- 3.11 Analyst View and Strategic Implications
Chapter 4 UAE Packaging Market Trends and Developments
- 4.1 Historical Industry Development, 2018-2025
- 4.2 Recent Market Trends and Developments
- 4.3 Demand and Customer Behavior Trends
- 4.4 Technology and Product Innovation
- 4.5 Artificial Intelligence, Automation and Digitalization
- 4.6 Local Manufacturing and Supply Chain Realignment
- 4.7 Industry Partnerships, Mergers and Acquisitions
- 4.8 Sustainability and Circular Economy Developments
- 4.9 Government and Private Sector Investment Trends
- 4.10 Emerging Business Models and Commercialization
- 4.11 Industry Developments and Announcements
Chapter 5 UAE Packaging Market Production, Supply and Demand Analysis
- 5.1 Demand Trend and Consumption Analysis, 2018-2025
- 5.2 Demand Forecast, 2025-2035
- 5.3 Production and Output Trend, 2018-2025
- 5.4 Production and Output Forecast, 2025-2035
- 5.5 Installed Capacity and Capacity Utilization
- 5.6 Company-Wise Production Plants and Statistics
- 5.6.1 Installed Production Capacity
- 5.6.2 Actual Production
- 5.6.3 Planned Capacity and Expansion Targets
- 5.7 Supply Chain Structure and Procurement Trends
- 5.8 Supply-Demand Gap and Bottlenecks
- 5.9 Import Dependence and Sourcing Structure
- 5.10 Contract Manufacturing and Outsourcing
- 5.11 Regional Supply and Demand Concentration
Chapter 6 UAE Packaging Market Pricing Analysis
- 6.1 Pricing Structure and Measurement
- 6.2 Historical Pricing Trends, 2018-2025
- 6.3 Pricing Outlook, 2025-2035
- 6.4 Average Selling Price and Unit Economics
- 6.5 Pricing by Product and Market Segment
- 6.6 Geographic Pricing Differences
- 6.7 Key Input, Energy, Labor and Logistics Costs
- 6.8 Contract Pricing and Purchasing Models
- 6.9 Pricing Sensitivity and Competitive Positioning
- 6.10 Price, Margin and Profitability Implications
Chapter 7 UAE Packaging Market Dynamics
- 7.1 Market Growth Drivers
- 7.1.1 Demand-Side Drivers
- 7.1.2 Technology and Innovation Drivers
- 7.1.3 Infrastructure and Investment Drivers
- 7.1.4 Regulatory and Policy Drivers
- 7.2 Market Restraints
- 7.2.1 Cost and Affordability Constraints
- 7.2.2 Technology and Adoption Barriers
- 7.2.3 Supply Chain and Operational Constraints
- 7.3 Market Challenges
- 7.3.1 Competitive Pressure and Margin Erosion
- 7.3.2 Skills, Infrastructure and Implementation Gaps
- 7.4 Emerging Market Opportunities
- 7.5 Market Dynamics Impact and Time-Horizon Assessment
Chapter 8 UAE Packaging Value Chain Analysis
- 8.1 Industry Value Chain Overview
- 8.2 Upstream Suppliers and Critical Inputs
- 8.3 Technology and Component Providers
- 8.4 Manufacturing or Service Delivery
- 8.5 Distribution, Channel Partners and Integrators
- 8.6 Downstream Applications and End Users
- 8.7 Value Addition and Profit Pools
- 8.8 Vertical Integration and Outsourcing
- 8.9 Supplier Concentration and Risk
- 8.10 Supply Chain Localization and Resilience
Chapter 9 UAE Packaging Market Regulations and Policies
- 9.1 Relevant Laws, Standards and Compliance Frameworks
- 9.2 Product, Service, Safety and Quality Requirements
- 9.3 Government Policies, Incentives and Subsidies
- 9.4 Imports, Exports and Trade Barriers
- 9.5 Public Procurement and Local Content Requirements
- 9.6 Environmental and Sustainability Compliance
- 9.7 Upcoming Policy Changes and Market Implications
Chapter 10 UAE Packaging Market Hotspots and Opportunities
- 10.1 Market Opportunity Mapping and Growth Hotspots
- 10.2 High-Growth Applications and Customer Groups
- 10.3 Underserved Markets and White-Space Opportunities
- 10.4 Emerging Technology and Product Opportunities
- 10.5 New Capacity and Investment Hotspots
- 10.6 Market Entry and Expansion Opportunities
- 10.7 Distribution and Partnership Opportunities
- 10.8 Near-Term and Long-Term Commercial Potential
- 10.9 Opportunity Attractiveness and Execution Risks
Chapter 11 UAE Packaging Market Outlook, 2025-2035
- 11.1 Market Size and Analysis
- 11.1.1 Revenue (Market Measurement: 2025: USD 9.29 billion → 2035: USD 15.55 billion)
- 11.1.2 Market Volume and Quantity Sold
- 11.1.3 Historical Market Size, 2018-2025
- 11.1.4 Base-Year Market Size, 2025
- 11.2 Market Forecast, 2025-2035
- 11.2.1 Revenue Forecast to 2035
- 11.2.2 Volume Forecast to 2035
- 11.2.3 CAGR and Year-on-Year Growth
- 11.2.4 Incremental Revenue Opportunity
- 11.3 Forecast Assumptions and Scenario Analysis
- 11.3.1 Base-Case Forecast
- 11.3.2 Optimistic and Conservative Scenarios
- 11.3.3 Technology, Pricing and Policy Sensitivities
- 11.4 Market Attractiveness and Growth Outlook
Chapter 12 UAE Packaging Market Segmentation and Outlook
- 12.1 Segmentation Summary and Market Shares, 2025
- 12.2 Largest and Fastest-Growing Segments
- 12.3 By Material Type - Market Size and Forecast, 2025-2035
- 12.3.1 Segment Definition and Scope
- 12.3.2 Historical Market Size, 2018-2025
- 12.3.3 Revenue Forecast, 2025-2035
- 12.3.4 Volume Forecast, 2025-2035
- 12.3.5 Base-Year Market Share, 2025
- 12.3.6 Segment CAGR and Growth Drivers
- 12.3.7 Subsegment Market Size and Forecast
- 12.3.7.1 Plastic Packaging
- 12.3.7.2 Paper and Paperboard Packaging
- 12.3.7.3 Metal Packaging
- 12.3.7.4 Glass Packaging
- 12.3.7.5 Wood, Bioplastic and Composite Packaging
- 12.3.8 Subsegment Pricing and Adoption Trends
- 12.3.9 Leading Suppliers and Competition
- 12.3.10 Regional Demand and Opportunities
- 12.4 By Product Type - Market Size and Forecast, 2025-2035
- 12.4.1 Segment Definition and Scope
- 12.4.2 Historical Market Size, 2018-2025
- 12.4.3 Revenue Forecast, 2025-2035
- 12.4.4 Volume Forecast, 2025-2035
- 12.4.5 Base-Year Market Share, 2025
- 12.4.6 Segment CAGR and Growth Drivers
- 12.4.7 Subsegment Market Size and Forecast
- 12.4.7.1 Rigid Packaging
- 12.4.7.2 Flexible Packaging
- 12.4.7.3 Semi-Rigid Packaging
- 12.4.8 Subsegment Pricing and Adoption Trends
- 12.4.9 Leading Suppliers and Competition
- 12.4.10 Regional Demand and Opportunities
- 12.5 By End-Use Industry - Market Size and Forecast, 2025-2035
- 12.5.1 Segment Definition and Scope
- 12.5.2 Historical Market Size, 2018-2025
- 12.5.3 Revenue Forecast, 2025-2035
- 12.5.4 Volume Forecast, 2025-2035
- 12.5.5 Base-Year Market Share, 2025
- 12.5.6 Segment CAGR and Growth Drivers
- 12.5.7 Subsegment Market Size and Forecast
- 12.5.7.1 Food and Beverage
- 12.5.7.2 Pharmaceutical and Healthcare
- 12.5.7.3 Personal Care and Cosmetics
- 12.5.7.4 E-Commerce Fulfillment
- 12.5.7.5 Agricultural and Industrial Products
- 12.5.8 Subsegment Pricing and Adoption Trends
- 12.5.9 Leading Suppliers and Competition
- 12.5.10 Regional Demand and Opportunities
- 12.6 By Sales Channel - Market Size and Forecast, 2025-2035
- 12.6.1 Segment Definition and Scope
- 12.6.2 Historical Market Size, 2018-2025
- 12.6.3 Revenue Forecast, 2025-2035
- 12.6.4 Volume Forecast, 2025-2035
- 12.6.5 Base-Year Market Share, 2025
- 12.6.6 Segment CAGR and Growth Drivers
- 12.6.7 Subsegment Market Size and Forecast
- 12.6.7.1 Direct Manufacturer Contracts
- 12.6.7.2 Packaging Distributors
- 12.6.7.3 Digital Packaging Stores
- 12.6.8 Subsegment Pricing and Adoption Trends
- 12.6.9 Leading Suppliers and Competition
- 12.6.10 Regional Demand and Opportunities
- 12.7 Segment Growth Comparison
- 12.8 Segment Attractiveness and Priority Matrix
Chapter 13 UAE Packaging End-Use and Application Market Outlook
- 13.1 End-Use Industry and Customer Demand Structure
- 13.2 Leading Applications and Customer Groups
- 13.3 End-Use Market Size, Share and Forecast
- 13.4 Major End-Use Industry Deep Dives
- 13.4.1 Customer Requirements and Use Cases
- 13.4.2 Demand and Replacement Cycles
- 13.4.3 Technical and Regulatory Considerations
- 13.4.4 Purchasing and Procurement Models
- 13.4.5 Leading Vendors and Distribution Channels
- 13.4.6 Forecast and Commercial Opportunities
- 13.5 Emerging Applications and Cross-Segment Demand
- 13.6 End-Use Industry Investment Priorities
Chapter 14 UAE Packaging Geographic Market Outlook, 2025-2035
- 14.1 Domestic Market Distribution and Demand Clusters
- 14.2 State- or Province-Wise Market Size and Forecast, 2025-2035
- 14.3 City and Metropolitan Market Outlook
- 14.4 Industrial, Manufacturing and Commercial Clusters
- 14.5 Geographic Concentration of Key End Users
- 14.6 Local Pricing and Purchasing Differences
- 14.7 Domestic Production Facilities and Capacity Map
- 14.8 Local Infrastructure and Project Pipeline
- 14.9 State-Level Policy and Incentive Differences
- 14.10 Subnational Investment Hotspots and Opportunities
- 14.11 Distribution and Logistics Networks
- 14.12 Domestic Competitive Footprint
Chapter 15 UAE Packaging Technology, Innovation and Sustainability Outlook
- 15.1 Technology Landscape and Maturity
- 15.2 Product, Process and Service Innovation
- 15.3 AI, Automation and Digital Tools in the Industry
- 15.4 Technology Adoption and Performance Benchmarking
- 15.5 Innovation Pipeline and R&D Investment
- 15.6 Patent and Intellectual Property Trends
- 15.7 Energy Efficiency and Resource Management
- 15.8 Sustainability, Recycling and Circularity
- 15.9 Technology Roadmap, 2025-2035
- 15.10 Risks of Obsolescence and Technology Substitution
Chapter 16 UAE Packaging Market Key Strategic Imperatives
- 16.1 Growth and Market Entry Priorities
- 16.2 High-Return Products and Segments
- 16.3 Pricing, Profitability and Cost Optimization
- 16.4 Technology Investment and Product Differentiation
- 16.5 Supply Chain Localization and Resilience
- 16.6 Distribution and Customer Acquisition
- 16.7 Partnership, Acquisition and Capacity Strategy
- 16.8 Regional Expansion Priorities
- 16.9 Short-, Medium- and Long-Term Actions
Chapter 17 Competition Outlook
- 17.1 Industry Competition Characteristics
- 17.2 Market Structure and Concentration
- 17.3 Market Share and Competitive Positioning, 2025
- 17.4 Company-Wise Revenue and Product Benchmarking
- 17.5 Production and Service Capacity Benchmarking
- 17.6 Technology, Pricing and Differentiation
- 17.7 Regional Footprint and Distribution Strength
- 17.8 Mergers, Acquisitions and Strategic Alliances
- 17.9 New Entrants and Competitive Threats
- 17.10 Porter's Five Forces and Industry Attractiveness
- 17.11 Competitive Outlook, 2025-2035
Chapter 18 Company Profiles
- 18.1 Company Coverage and Selection Criteria
- 18.2 Tetra Pak
- 18.2.1 Business Description
- 18.2.2 Company Ownership and Geographic Presence
- 18.2.3 Product and Service Portfolio
- 18.2.4 Manufacturing and Operating Footprint
- 18.2.5 Production Capacity and Expansion Plans
- 18.2.6 Financial Performance and Investment
- 18.2.7 Market Share and Competitive Position
- 18.2.8 Technology and Innovation Capabilities
- 18.2.9 Strategic Alliances or Partnerships
- 18.2.10 Recent Developments
- 18.2.11 Growth Strategy and Outlook
- 18.3 Hotpack Global
- 18.4 Huhtamaki
- 18.5 SIG Group
- 18.6 ENPI Group
- 18.7 Al Bayader International
- 18.8 Arabian Packaging
- 18.9 Falcon Pack
- 18.10 Amber Packaging Industries
- 18.11 Gulf East Paper and Plastic Industries
- 18.12 Other Relevant Market Participants
Note: Every listed company is profiled on the structure shown under the first company. The company list is preliminary and may change based on research findings, market developments, data availability and client requirements.
Chapter 19 Disclaimer
- 19.1 Research and Forecast Disclaimer
- 19.2 Data Source and Estimation Limitations
Note: The depth of individual sections depends on data availability for this market. Volume, capacity, trade and other unit-based metrics are included where applicable.