Food, pet food and parcels anchor demand for films
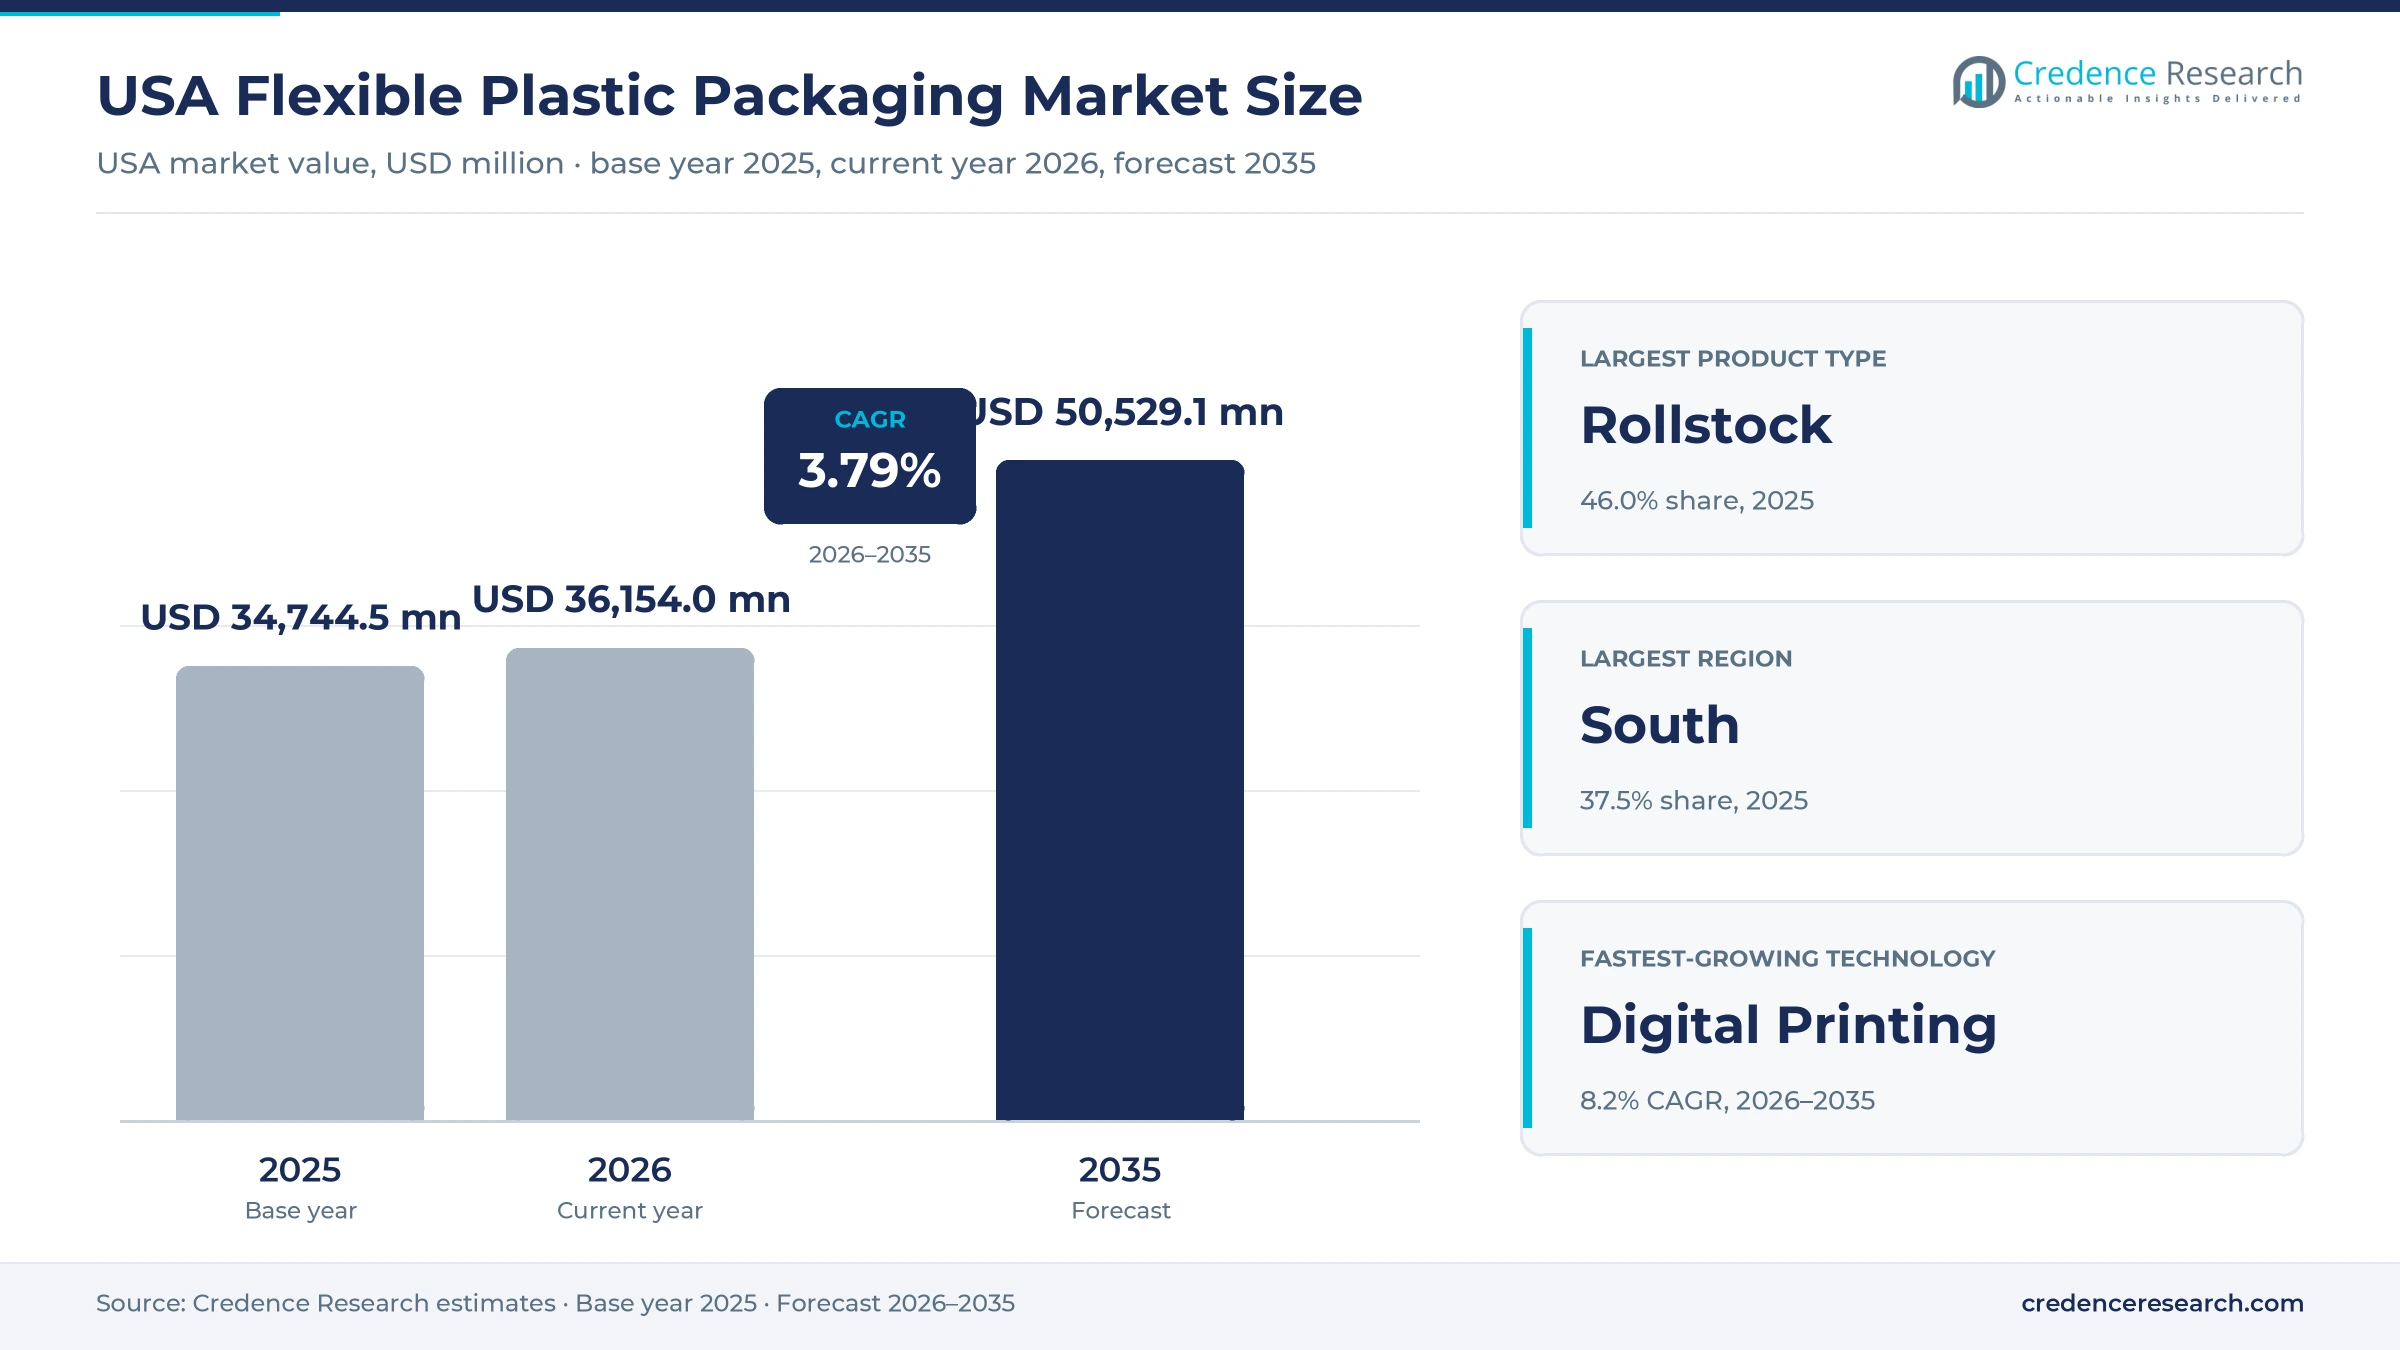
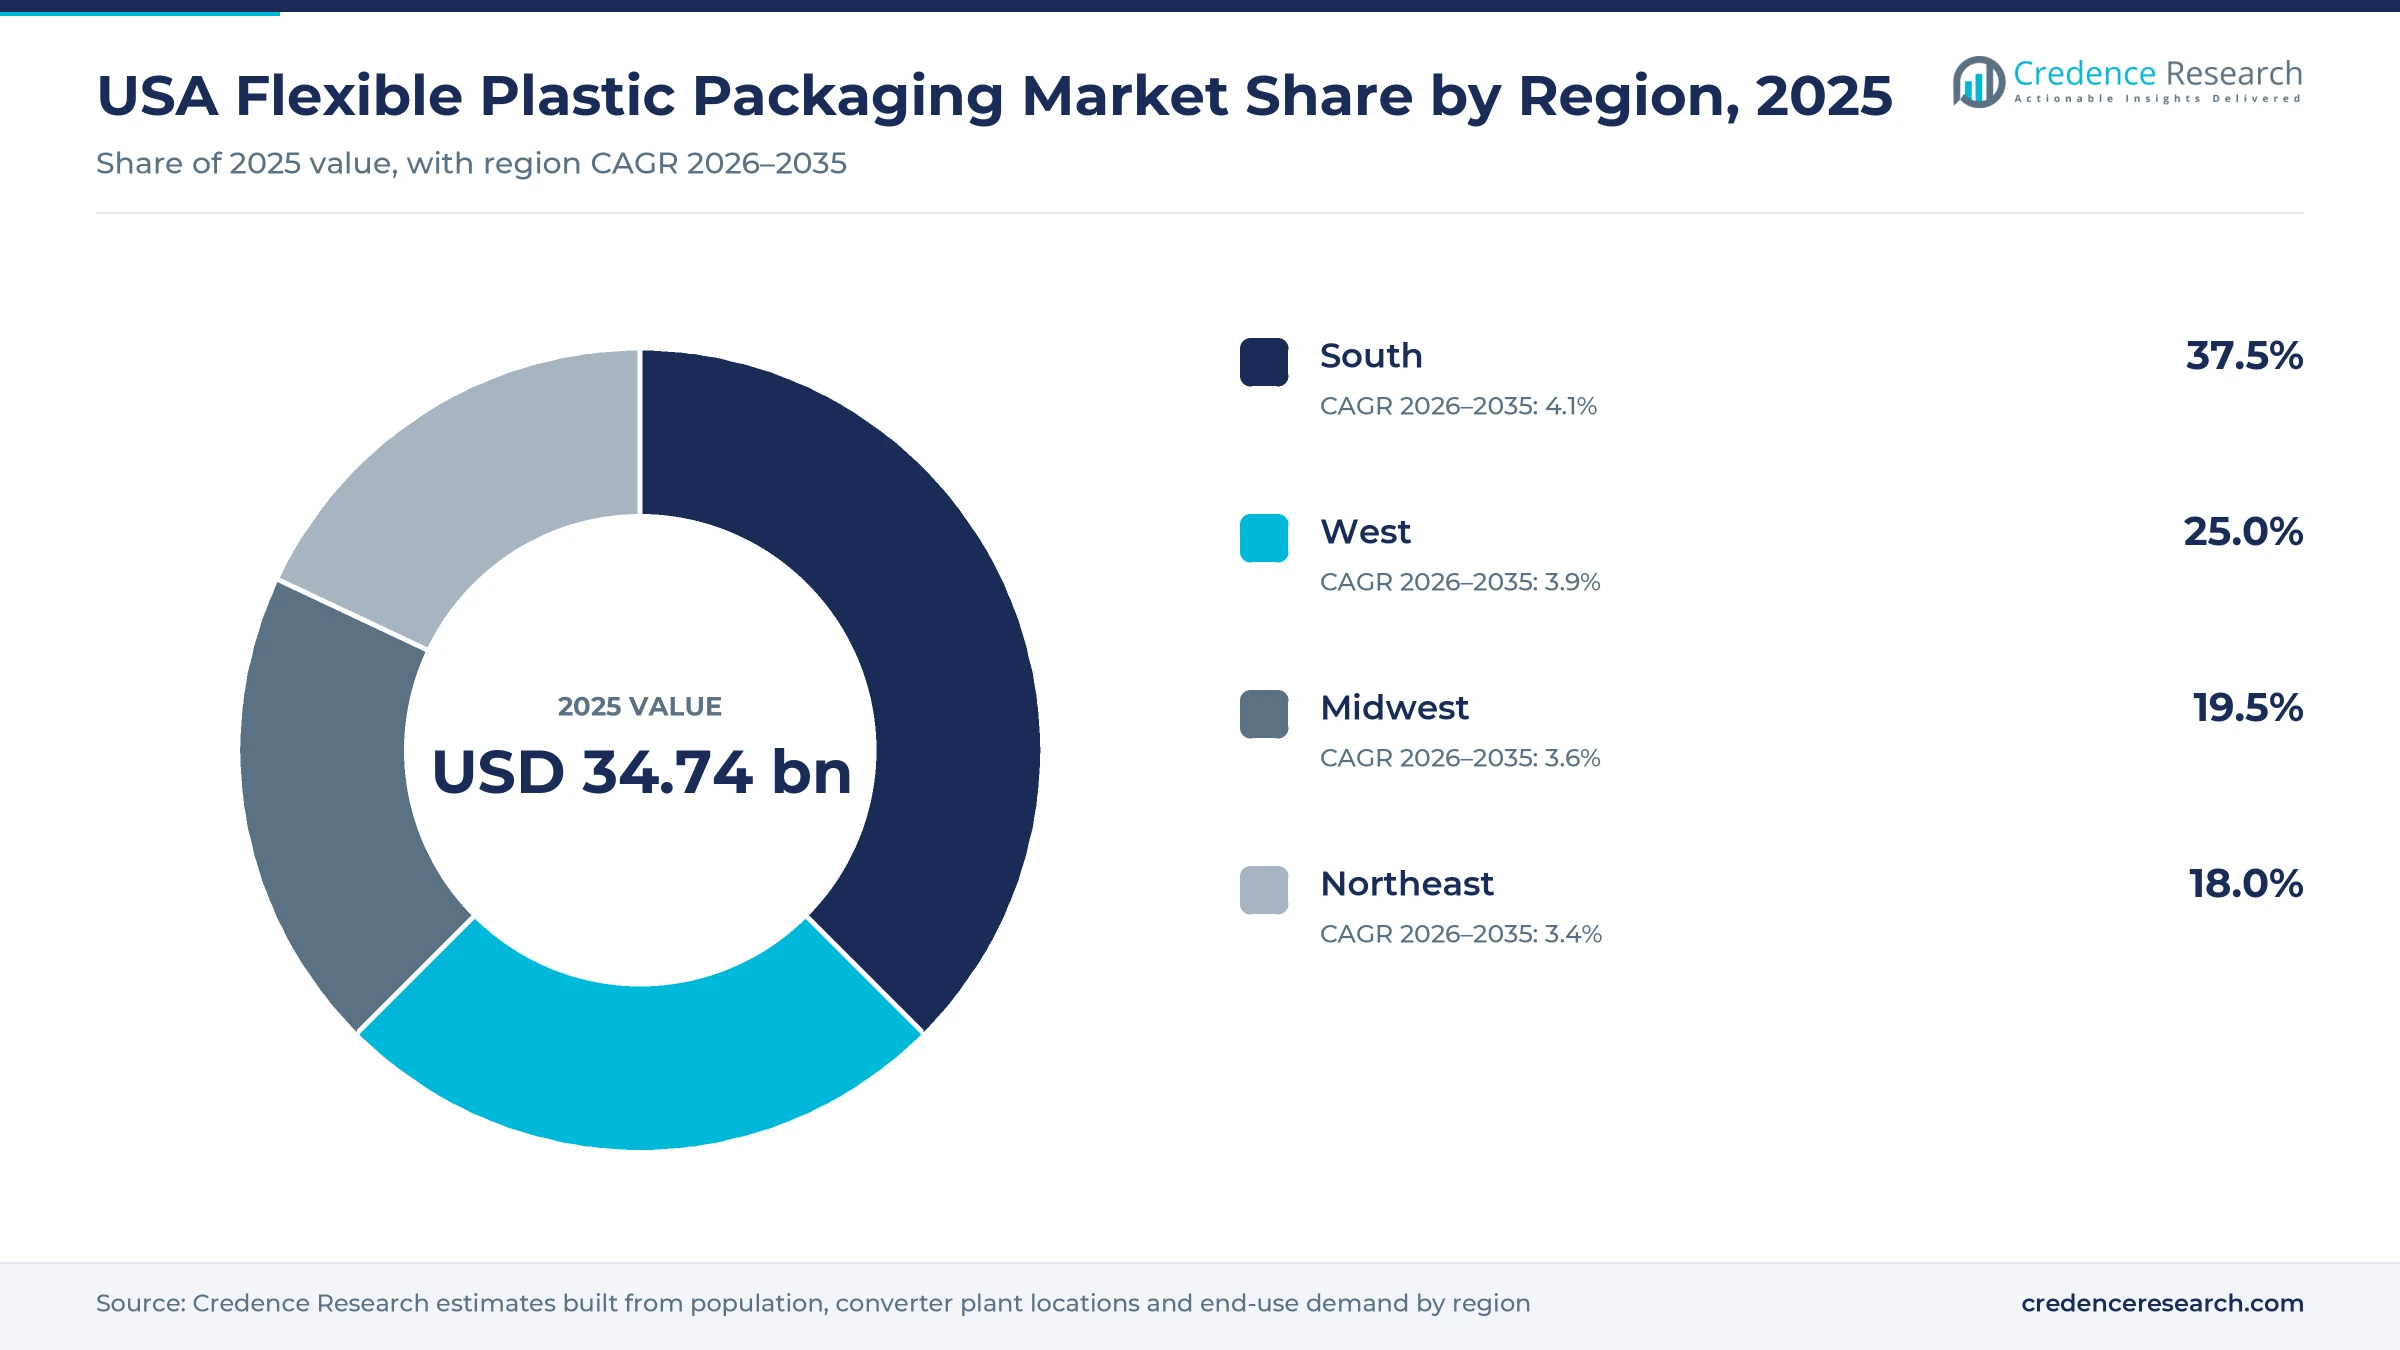
The USA flexible plastic packaging market was valued at USD 34.74 billion in 2025 and is projected to increase from USD 36.15 billion in 2026 to USD 50.53 billion by 2035, registering a CAGR of 3.79% during 2026–2035. Demand comes from food and beverage processors, pet food makers, healthcare product manufacturers and household brands that buy printed rollstock, pouches and bags from domestic converters, and from warehouses that secure loads with stretch and shrink films. The South held the largest regional share, 37.5% in 2025, because it hosts the largest consumer base and a dense belt of food, protein and film plants. The South is also the fastest-growing region at 4.1% a year. A resin price shock in 2026, tied to the Middle East conflict and shipping disruption in the Strait of Hormuz, raised converter costs and pushed price increases through to brand owners. California's packaging producer responsibility rules, in effect since May 1, 2026, are speeding the move to recycle-ready mono-material structures.
Converted films, pouches and bags form one estimate
The estimate measures the value of plastic-based flexible packaging sold by converters to buyers in the United States, including printed and unprinted rollstock, preformed pouches, bags and liners, and stretch and shrink films. Most volume is bought under annual or multi-year supply contracts between brand owners and converters, while small brands order short runs online and distributors serve warehouses and contract packagers.
The estimate excludes paper-only bags, aluminum foil sold without a plastic layer, rigid containers and the resin itself, which is counted only in the finished package. The value chain runs from polyethylene, polypropylene, polyester and nylon resin producers through film extruders and converters that print, laminate, slit and make pouches, to fillers that pack food, pet food, medical and household goods.
USA Flexible Plastic Packaging Market Insights
- The USA flexible plastic packaging market was valued at USD 34.74 billion in 2025 and is projected to reach USD 50.53 billion by 2035, registering a CAGR of 3.79% during 2026–2035.
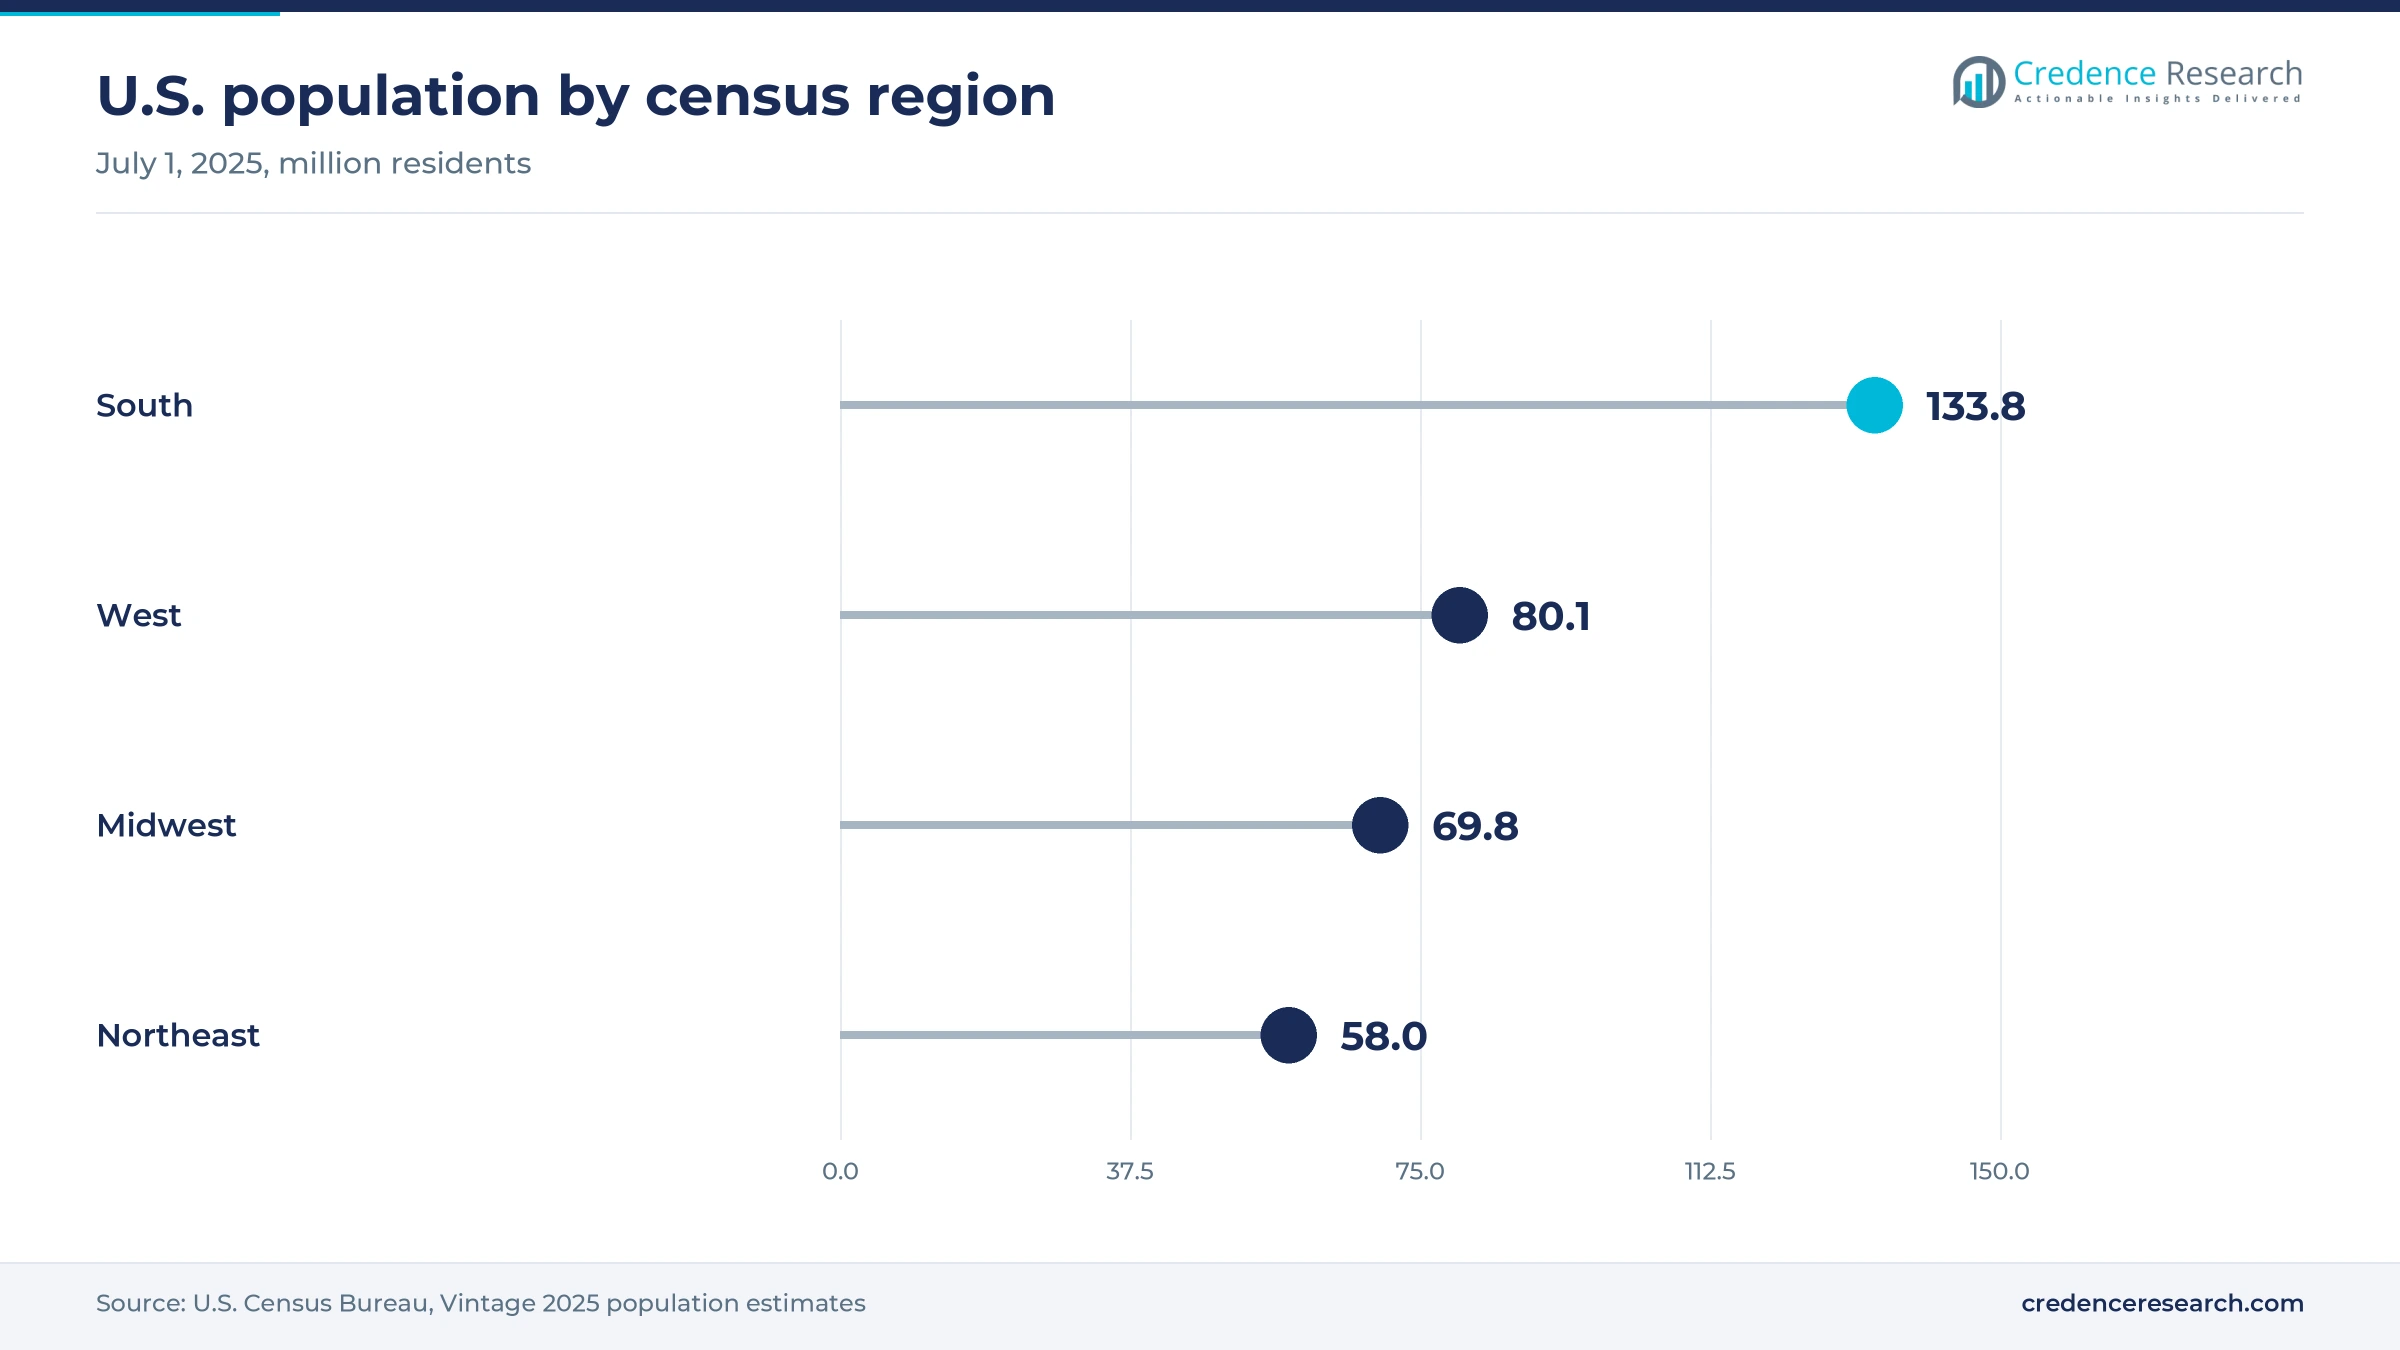
- The South held the largest regional share at 37.5% of 2025 value, because it is home to 39.2% of U.S. residents and a dense base of food and film plants.
- Rollstock led product types with 46.0% of 2025 value, because large food and protein processors fill packs on their own form-fill-seal lines.
- California's packaging producer responsibility rules took effect on May 1, 2026, requiring 25% less single-use plastic and 65% recycling of plastic packaging by 2032.
- Amcor combined with Berry Global on April 30, 2025, and CD&R took Sealed Air private on April 9, 2026, concentrating supply among fewer, larger groups.
Rollstock leads while pouches and digital print gain
Why does rollstock still carry most of the value?
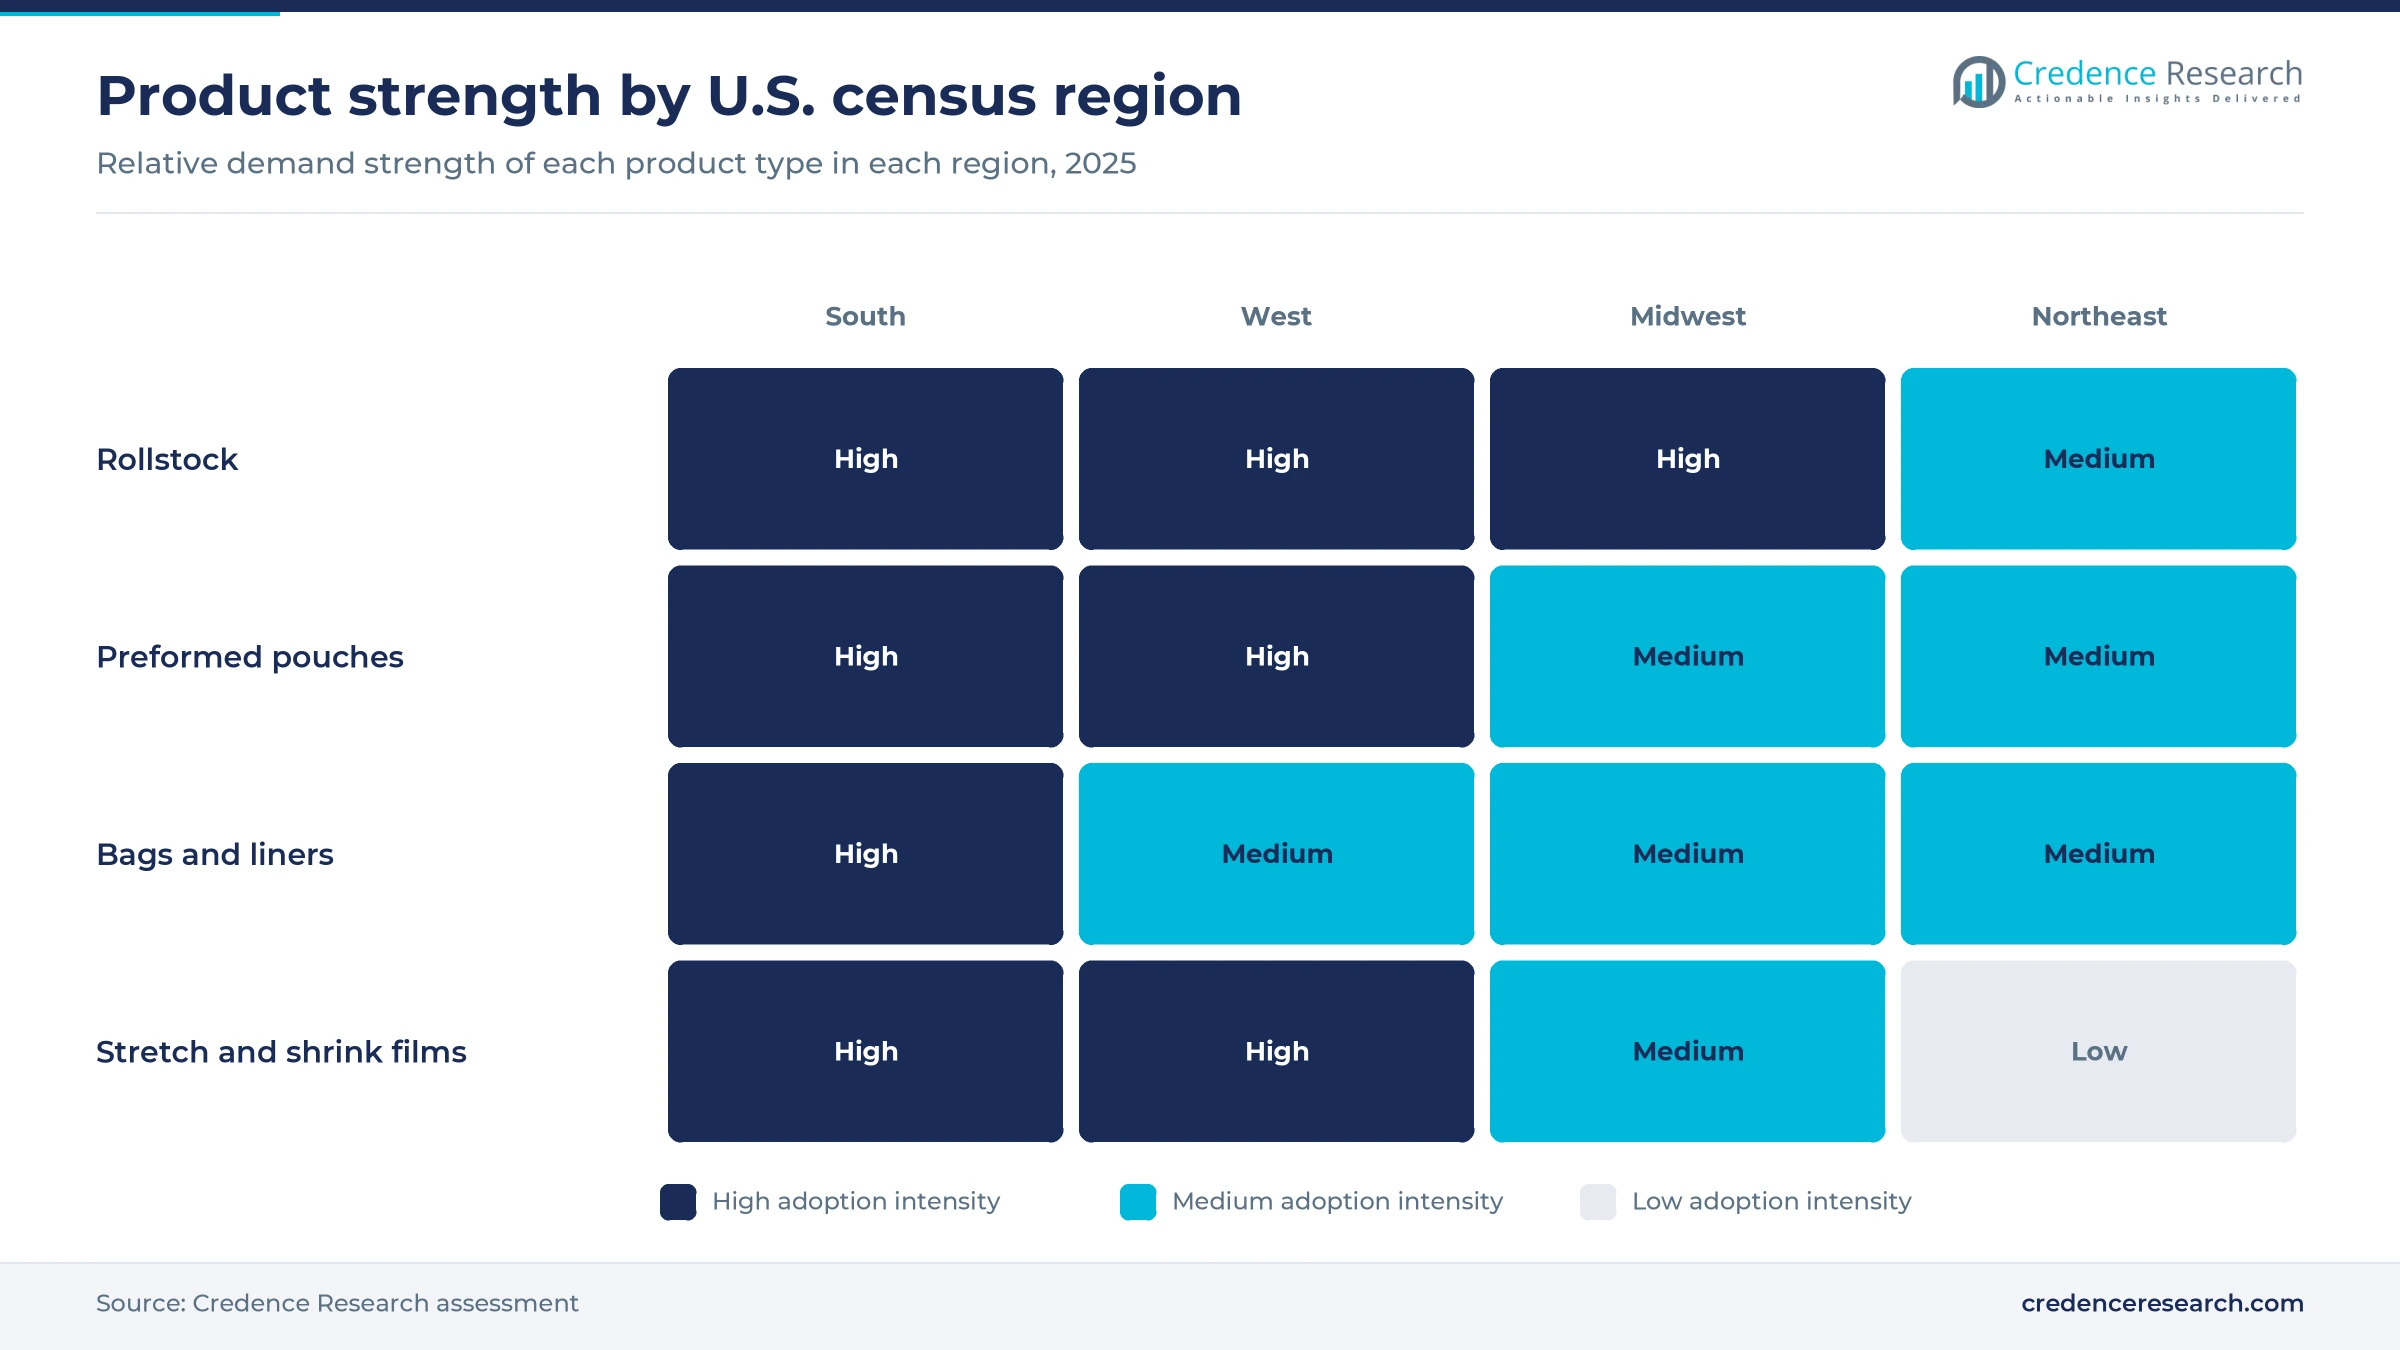
Based on product type, the market is categorized into rollstock, preformed pouches, bags and liners, and stretch and shrink films. Rollstock led with 46.0% of 2025 value, because large food and protein processors fill packs on their own form-fill-seal lines, and Sealed Air launched its Cryovac VPP MonoPro film for vertical form-fill-seal soups, sauces and proteins in November 2025, according to Packaging Insights. Preformed pouches grow fastest at 4.8% a year, as Printpack announced new bag-making machines for stand-up pouches and flat-bottom bags at its Bloomington, Indiana plant on April 18, 2025. Pouch converters win buyers that lack their own filling lines.
How much does food still decide film demand?
Based on application, the market is categorized into food and beverage packaging, pet food packaging, healthcare packaging, household and personal care packaging, and transport and protective packaging. Food and beverage packaging led with 47.0% of 2025 value, because Amcor began one of its largest investments to date on Nov. 11, 2025, adding printing, lamination and converting capacity for North American protein packaging, Packaging Dive reported. Pet food packaging grows fastest at 4.6% a year, as U.S. pet industry spending reached USD 158 billion in 2025, up 3.7%, according to the American Pet Products Association. Large kibble and treat bags need puncture-resistant, reclosable structures that cost more per bag.
Which printing method carries most converter value?
Based on technology, the market is categorized into flexographic printing, rotogravure printing, digital printing and unprinted film conversion. Flexographic printing led with 52.5% of 2025 value, because most U.S. converters print mid and long runs on wide-web flexo presses, and American Packaging Corporation is adding flexographic-printed pouch capacity at Story City, Iowa, with completion due by the end of September 2026, according to Packaging Strategies. Digital printing grows fastest at 8.2% a year, as ePac ran 58 HP Indigo digital presses in June 2024 and was upgrading them to Gen 5 200K models. Short runs and seasonal designs move to digital presses first.
Where do buyers pay for barrier and validation?
Based on price tier, the market is categorized into commodity films, standard printed packaging, high-barrier packaging and specialty validated packaging. Standard printed packaging led with 38.0% of 2025 value, because most snack, bakery and frozen packs need branded print but only moderate barrier, and food, the largest end use noted under drivers, buys them in the highest volumes. High-barrier packaging grows fastest at 4.9% a year, as Winpak reported modified atmosphere packaging volumes up 7% in the first quarter of 2025, driven by meat. Barrier structures earn higher prices per square meter than plain printed film.
| Segment Group | Leading Sub-segment | Share, 2025 | Fastest-growing Sub-segment | CAGR, 2026–2035 |
|---|---|---|---|---|
| By Product Type | Rollstock | 46.0% | Preformed pouches | 4.8% |
| By Application | Food and beverage packaging | 47.0% | Pet food packaging | 4.6% |
| By Technology | Flexographic printing | 52.5% | Digital printing | 8.2% |
| By Price Tier | Standard printed packaging | 38.0% | High-barrier packaging | 4.9% |
Resin pass-through clauses set converter prices
Converters price most contract business per thousand units, per pound or per square meter of finished film, with a resin index clause that resets prices monthly or quarterly. That structure moved fast in 2026, because producer prices for plastics packaging film and sheet rose from 185.7 in March to 217.5 in July, according to Bureau of Labor Statistics data published by FRED. Converters with index clauses recovered costs within one or two cycles. Smaller converters that quote fixed prices on spot resin carried the loss, and buyers now push for caps, collars and shorter contracts.
| Price item | Typical price or fee | Basis |
|---|---|---|
| Plastics packaging film and sheet, producer price index | 212.3 in Sept. 2026, up about 17% year on year | BLS via FRED, October 2026 |
| Polyethylene contract index moves, spring 2026 | 10 to 30 cents per pound per round, vs. 3 to five cents normally | Supply Chain Dive, May 2026 |
| Printed flexible packaging, converter list prices | About 8% increase in one month | Emerald Packaging via Supply Chain Dive, May 2026 |
| Polyethylene resin, January 2026 contract | About five cents per pound increase | Plastics Technology, February 2026 |
Request a Free Sample
Fill in your details and we'll send you a free sample report.
- Sample data tables & charts
- Research methodology
Food, parcels and barrier investment lift value
Food replenishment and product protection keep lines full
Food is bought every week, so its packaging demand holds steady through economic cycles and gives converters a dependable base load. Food accounted for about 45% of U.S. flexible packaging sales in 2024, according to the Flexible Packaging Association. The association also gives flexible formats about a 20% share of the U.S. packaging market, second only to corrugated. Food and beverage packaging holds 47.0% of 2025 value in this market. Protection matters as much as volume, because barrier films extend shelf life for meat, cheese and snacks and reduce waste at retail. Converters that pair high-speed rollstock with shelf-life testing keep the largest grocery and protein accounts, while buyers gain fewer spoiled units per shipment.
E-commerce fulfillment requirements lift mailer and film use
Online retail adds packaging at each step, because orders move as single parcels that need mailers, cushioning and pallet films rather than bulk cases. U.S. retail e-commerce sales reached USD 340.2 billion in the second quarter of 2026, a 17.1% share of total retail sales, according to the U.S. Census Bureau. That figure was 12.2% higher than in the same quarter a year earlier. Sealed Air, which sells the Bubble Wrap brand, went private under CD&R on April 9, 2026, and remains a leading supplier of protective mailers and cushioning. Fulfillment centers also secure most outbound pallets with stretch and shrink films. Converters with mailer, cushioning and film lines near distribution hubs gain the most from this channel.
Qualified barrier-film investment raises value per pack
Converters are investing in barrier capacity because protein, cheese and prepared-meal buyers pay more for films that extend shelf life and pass qualification tests. Amcor's protein packaging expansion, noted in the segment analysis, adds printing, lamination and converting equipment through the first half of 2026. Winpak bought 44 acres next to its Senoia, Georgia specialty films plant in 2023 for expansion, according to the company. Qualification on the customer's packing line takes months and locks in suppliers, and Amcor said in May 2026 that about 70% of its business runs under contracts, Supply Chain Dive reported. High-barrier packaging grows fastest by price tier at 4.9% a year. Buyers that qualify a second barrier source early gain leverage at contract renewal.
Packaging EPR laws push recycle-ready redesigns
State producer responsibility laws are turning recyclability from a marketing claim into a cost and compliance issue for every brand owner that sells packaged goods. California's rules took effect on May 1, 2026, and require producers to cut single-use plastic by 25%, make all covered packaging recyclable or compostable and recycle 65% of plastic packaging by 2032, according to CalRecycle. Oregon's program started on July 1, 2025, and Colorado aims to lift packaging and paper recycling from 25% to 41% by 2030, Resource Recycling reported. Multilayer laminates that mix polyester, nylon and foil are the hardest to recycle. Converters with mono-material polyethylene and polypropylene structures win redesign projects as brand owners rework their portfolios.
Consolidation, mono-material films and digital runs
Rise of consolidation among large converters
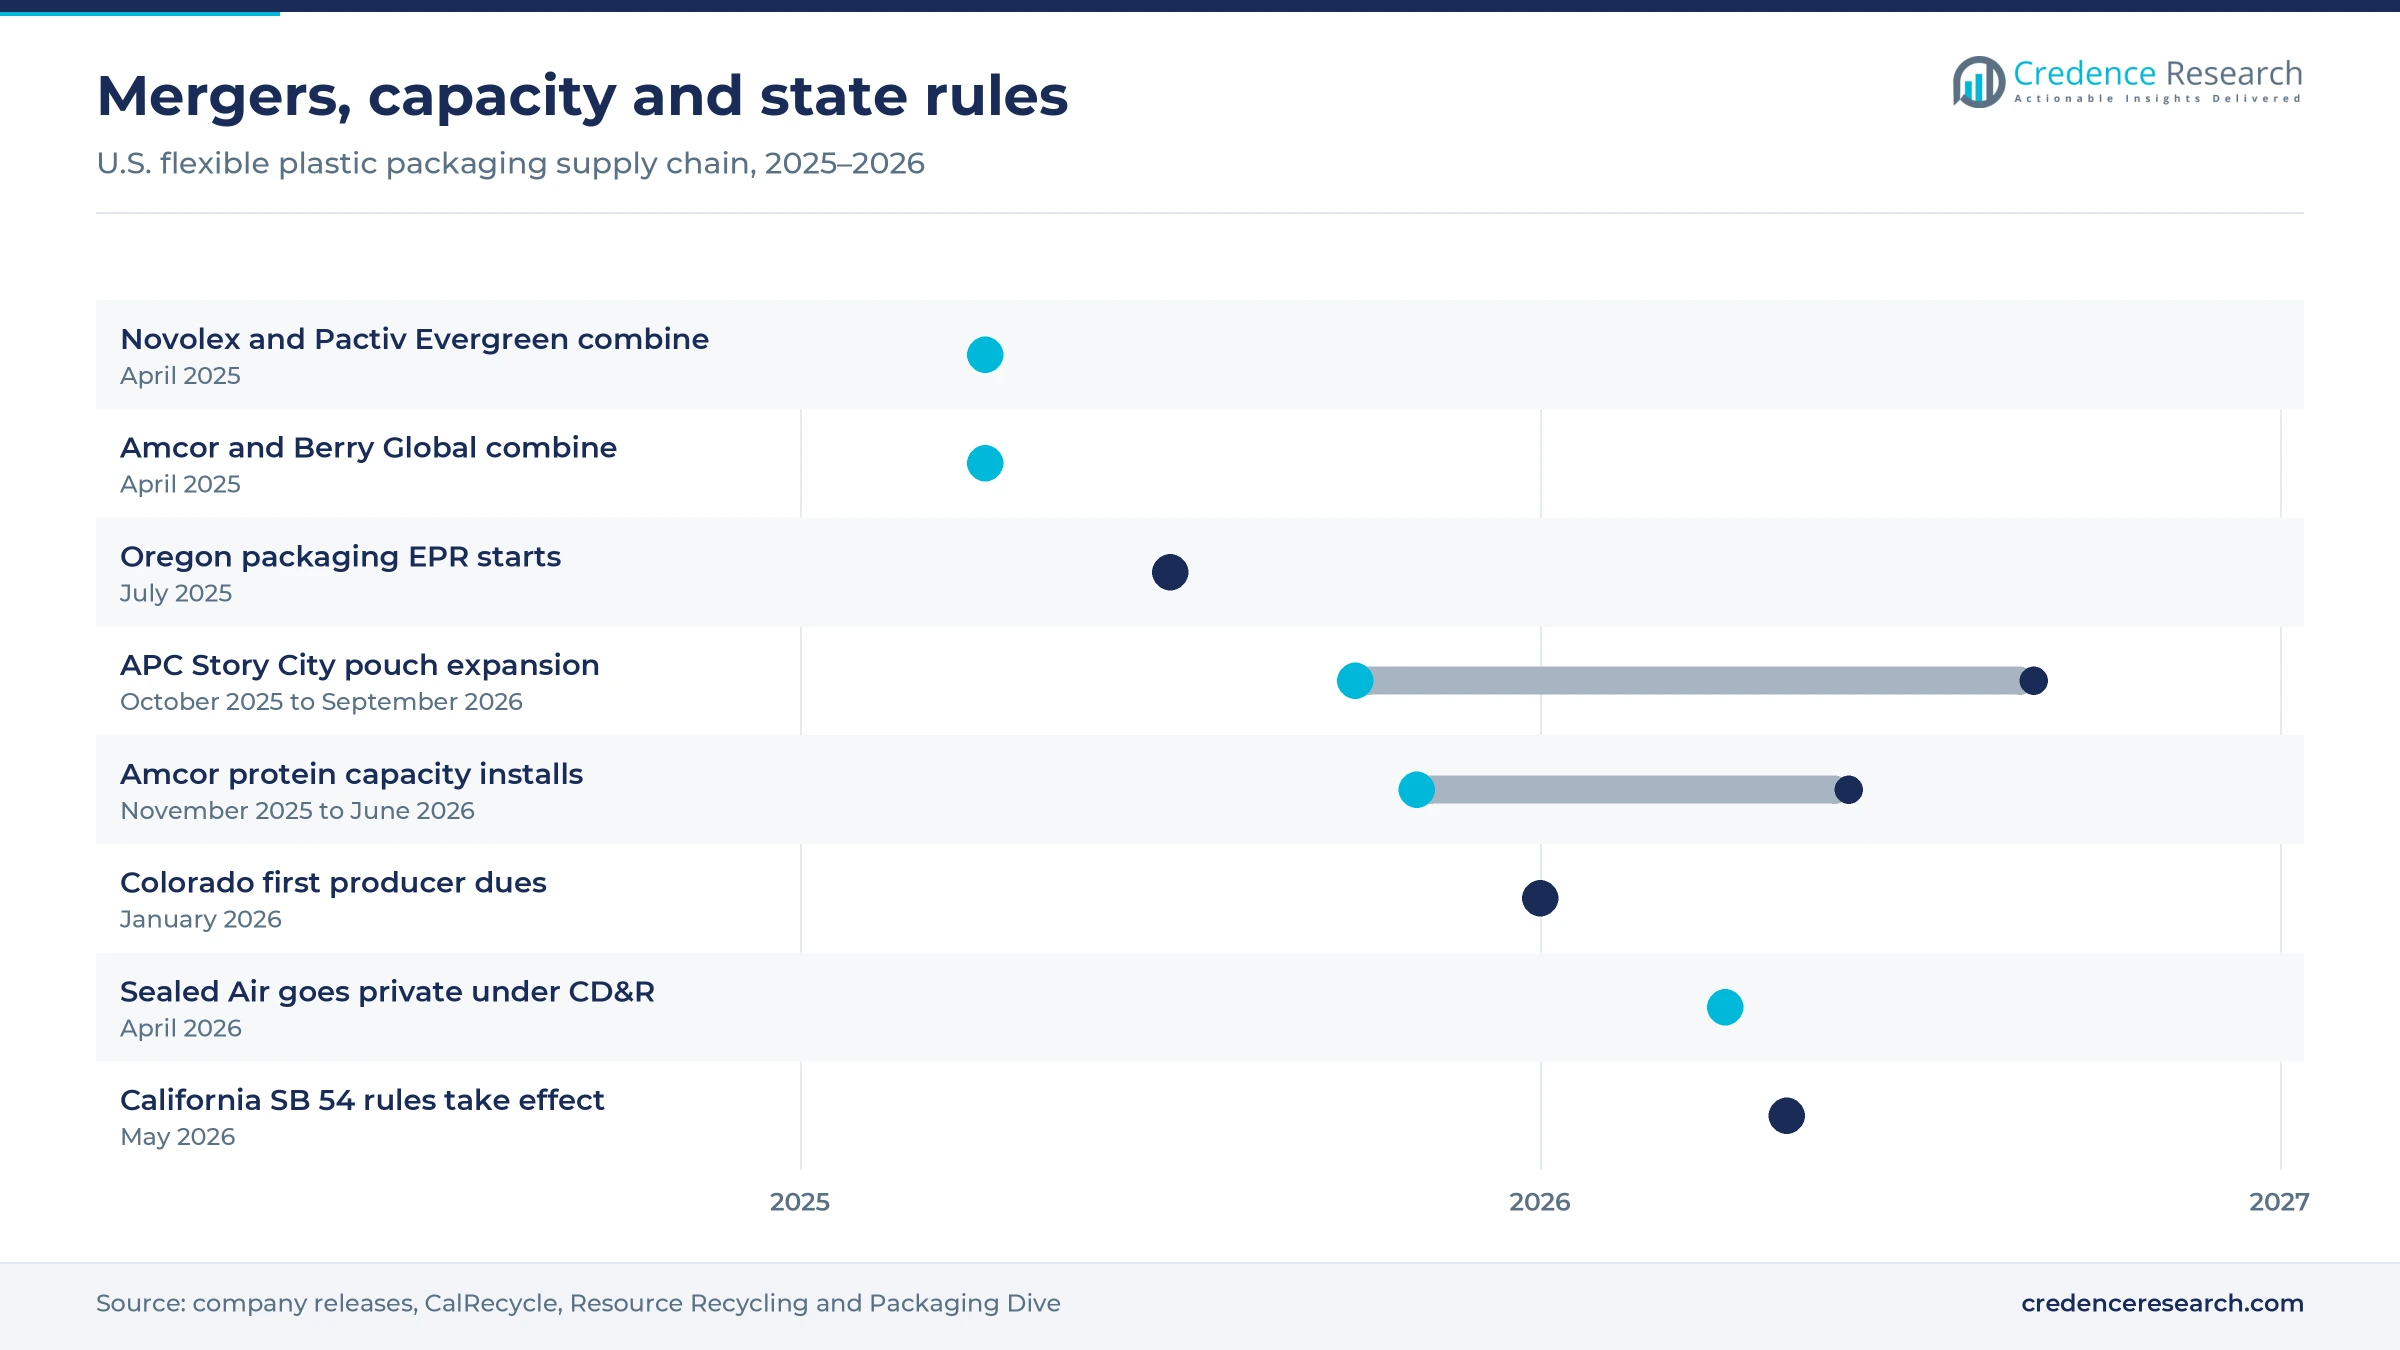
The supply side is consolidating quickly, as large groups buy scale in resin purchasing, film extrusion and customer coverage. Amcor completed its all-stock combination with Berry Global on April 30, 2025, and says it is now the largest maker of polyethylene overwrap films in North America. Novolex closed its combination with Pactiv Evergreen on April 1, 2025, and TOPPAN closed its purchase of Sonoco's thermoformed and flexibles business the same day, now operating it as TOPPAN Packaging Americas. The Flexible Packaging Association counted 34 domestic deals in 2024, up from 31 in 2023. Buyers gain suppliers with wider portfolios but face fewer independent bidders in each film category.
Shift to mono-material polyethylene and polypropylene films
Brand owners are shifting from mixed-material laminates to single-polymer structures that sorting systems and film recyclers can handle. Sealed Air's Cryovac VPP MonoPro rollstock, noted in the segment analysis, uses a monomaterial film with 0% or 10% polyamide and is certified recycle-ready, according to Packaging Insights. Amcor sells its AmPrima recycle-ready polyethylene range in pouches, bags and shrink films, and TOPPAN Packaging Americas presented a session on scaling and validating monomaterial pouches at the Global Pouch Forum held May 27 to 29, 2026, in Clearwater, Florida. These films need tighter process control to match the stiffness, seal strength and barrier of older laminates. Converters with that know-how can charge for redesign and qualification work.
Digital short runs open a premium for small brands
Digital printing opens a profitable niche in short runs, because small and mid-sized brands need custom pouches in quantities too small for plate-based presses. ePac operated 11 U.S. plants and expected to serve 4,500 to 5,000 customers in 2024, according to Packaging Strategies. It announced a new high-capacity plant in Phoenix on Feb. 19, 2026, along with expanded operations in Atlanta and Philadelphia. Digital printing grows fastest by technology at 8.2% a year, from a small base. Brand owners also use digital runs for seasonal designs, test markets and regional editions. Converters that combine online ordering with fast turnaround can price above long-run flexo work.
Recycled-content films open a new supply niche
Recycled content opens a new product line for converters that can secure clean post-consumer resin and qualify it for food and consumer goods. PureCycle and TOPPAN Packaging Americas produced a snack bar wrapper with more than 30% recycled polypropylene content, announced on Feb. 18, 2026. Novolex runs two plastic film recycling centers, which gives it its own feedstock for bags and films. California's 65% recycling target for plastic packaging, noted above, creates a durable pull for such films. Recycled resin remains scarcer and more variable than virgin grades. Suppliers that lock in feedstock contracts and food-contact clearances first can sell recycled-content films at a premium.
Resin shock, producer fees and paper substitution
Why did the 2026 resin shock squeeze converters?
The 2026 Middle East conflict turned resin from a stable input into the largest risk for converters. The Middle East supplied about 40% of global polyethylene exports in 2025, a share that left buyers worldwide exposed to the shipping disruption. Dow estimated that about half of global ethylene and polyethylene supply was offline or constrained in May 2026, Supply Chain Dive reported. Dow's chief operating officer suggested a six- to 18-month recovery, which points to normal resin markets only in 2027. Contract pass-through clauses protect large converters, while small converters on spot resin absorb losses until their prices reset.
Producer fees add cost to every package sold
EPR programs add a fee on each unit of packaging sold, and hard-to-recycle films often carry the highest rates. Oregon's program collected USD 167.9 million in producer fees from 2,909 producers, according to Waste Dive's review of its 2025 annual report. Colorado's first annual producer dues came due on Jan. 1, 2026. Brand owners now ask converters for fee-reducing designs, and suppliers without recycle-ready options risk losing accounts at the next redesign.
Paper substitution removes some plastic formats
Retailers and converters are moving some protective and carry formats from plastic to paper, which removes volume from the plastic side of the market. Amazon replaced 95% of plastic air pillows in its North American delivery packaging with paper filler, avoiding nearly 15 billion pillows a year, the company said in June 2024. ProAmpac bought International Paper's bag converting operations in California, Oregon and Texas on Oct. 17, 2025. Plastic converters defend volume where barrier and moisture resistance matter most.
Tariff changes cloud cross-border film supply
Film, foil and resin cross the Canadian and Mexican borders constantly, so tariff changes can raise costs without warning. Winpak said in April 2025 that its products were exempt from U.S. tariffs under USMCA except foil-based products, while some suppliers had already raised prices citing tariffs. The company began a roadmap to expand manufacturing in the United States, Canada and Mexico. Buyers that source foil-containing structures across borders face the widest cost uncertainty.
The South leads on population and plant density
| Region | Value, 2025 (USD billion) | Share, 2025 | CAGR, 2026–2035 |
|---|---|---|---|
| South | 13.03 | 37.5% | 4.1% |
| West | 8.69 | 25.0% | 3.9% |
| Midwest | 6.78 | 19.5% | 3.6% |
| Northeast | 6.25 | 18.0% | 3.4% |
Why does the South lead film demand?
The South held 37.5% of 2025 value and grows fastest at 4.1% a year, because it has the largest and fastest-growing population and a dense base of food, protein and film plants. The South had 133.8 million residents in 2025, equal to 39.2% of the U.S. total, and the region grew 6.0% since 2020, according to the Census Bureau. Winpak's Senoia, Georgia, expansion site and ePac's enlarged Atlanta operation, both noted above, put new capacity close to that demand.
The West tests recycle-ready designs first
The West held 25.0% of 2025 value and grows at 3.9% a year, supported by large consumer markets in California and fast-growing states such as Arizona. California's producer responsibility rules, described above, make the region the first large test of recycle-ready designs, because national brands must meet them to keep selling there. ePac chose Phoenix for its new high-capacity plant in February 2026, and ProAmpac's October 2025 purchase added bag plants in California and Oregon. Western converters therefore gain redesign work earlier than plants in other regions.
Midwest converters serve dairy, meat and cereal plants
The Midwest held 19.5% of 2025 value and grows at 3.6% a year, slower than the South, as its population grew only 1.1% since 2020, according to the Census Bureau. The region remains a converting hub, because Amcor runs its North American flexibles business from Oshkosh, Wisconsin, American Packaging Corporation is expanding pouch capacity in Story City, Iowa and Printpack makes pet care bags in Bloomington, Indiana. Dairy, meat and cereal plants nearby buy rollstock and barrier films in steady volumes.
Healthcare work lifts value in the Northeast
The Northeast held 18.0% of 2025 value and grows at 3.4% a year, the slowest pace, as its population grew 0.7% since 2020. Healthcare packaging gives the region a higher-value mix, because Winpak runs its Control Group healthcare business in Norwood, New Jersey and bought a nearby Northvale building in 2024 for future expansion, according to the company. Validated sterile pouches for these buyers sell at the top of the price range, and requalification costs make device makers slow to switch suppliers.
Mergers, capacity and state rules, 2025–2026
| Development | Status and market relevance |
|---|---|
| In April 2025, Amcor completed its all-stock combination with Berry Global, widening its U.S. film, shrink and pouch portfolio. | Largest North American overwrap film maker |
| In April 2025, TOPPAN Holdings closed its purchase of Sonoco's thermoformed and flexibles packaging business, now TOPPAN Packaging Americas. | Japanese group enters U.S. flexibles at scale |
| In April 2026, CD&R completed its acquisition of Sealed Air, taking the Cryovac and Bubble Wrap owner private. | Ownership change at a top protein supplier |
| In May 2026, CalRecycle approved California packaging producer responsibility regulations, effective immediately. | Sets 2032 targets for plastic packaging |
Print and lamination methods set pack cost and value
- Flexographic presses print most mid and long runs with water-based or solvent flexographic printing inks and quick plate changes, which keeps cost per impression low.
- Gravure printing uses engraved cylinders on rotogravure printing machines for the longest runs and the most consistent images, serving snack, confectionery and coffee brands.
- Digital presses print without plates, which suits short runs, seasonal designs and variable data for small and mid-sized brands.
- Lamination and coextrusion combine layers with lamination adhesives or in one extrusion step, and mono-material designs now replace polyester and foil layers with oriented polyethylene or polypropylene.
Need a Custom Version of This Report?
Tailor the scope, geography, or segments to your exact requirements.
- Custom geography or segment scope
- Direct access to our analyst team
Film groups and regional converters split supply
Competition in the USA flexible plastic packaging market runs on resin purchasing scale, barrier know-how, print quality and the ability to qualify new structures on customer lines. Amcor, enlarged by Berry Global, offers the widest range from shrink films to retort pouches. Sealed Air leads in protein shrink bags and protective mailers under the Cryovac and Bubble Wrap brands, and now operates as a private company. TOPPAN Packaging Americas, ProAmpac and Printpack serve snack, pet food and consumer brands with printed rollstock and pouches. American Packaging Corporation competes in rotogravure and flexo printed packaging from its Wisconsin and Iowa plants. Winpak focuses on protein, dairy and healthcare films, Novolex on bags and foodservice films, and Hood Packaging on plastic and multiwall bags. ePac serves small brands with digital short runs. Buyers shortlist suppliers on qualification record, delivery reliability and resin pass-through terms.
Extrusion scale and qualification records set entry barriers
Supply is split between a few large groups with their own film extrusion and a long tail of regional and specialty converters. Amcor, TOPPAN Packaging Americas, Sealed Air and Novolex run national networks that extrude, print and convert, while Printpack, American Packaging Corporation, Winpak and Hood Packaging compete on service in specific end uses. The deal count noted under trends shows that mid-sized firms keep selling to larger groups. Entry barriers are press and extrusion capital, customer qualification and resin purchasing scale. Margins sit with converters that hold barrier know-how and index-linked contracts, rather than with commodity film makers.
Companies profiled and their roles in this market
| Company | Type | Role in the market |
|---|---|---|
| Amcor | Full-line converter | Rollstock, pouches, shrink and overwrap films, combined with Berry Global since 2025 |
| ProAmpac | Full-line converter | Printed rollstock, pouches and bags for food, pet and retail brands |
| Sealed Air | Food and protective specialist | Cryovac shrink bags, barrier films and Bubble Wrap protective mailers |
| TOPPAN Packaging Americas (TOPPAN Holdings) | Full-line converter | Former Sonoco flexibles business serving snack, coffee and pet food brands |
| Printpack | Converter | Rollstock, stand-up pouches and pet care bags from U.S. plants |
| American Packaging Corporation | Converter | Rotogravure and flexo printed rollstock and preformed pouches |
| Winpak | Barrier film specialist | Specialty films, modified atmosphere films and healthcare packaging |
| Novolex | Bag and film maker | Plastic bags, liners and foodservice films, combined with Pactiv Evergreen |
| Hood Packaging | Bag and film maker | Plastic film, plastic bags and multiwall bags from Madison, Mississippi |
| ePac Flexible Packaging | Digital converter | Digitally printed pouches and rollstock in short runs for small brands |
Value per pack, not tonnage, will drive growth
Credence Research's view is that the USA flexible plastic packaging market will grow through value per pack more than through tonnage. Food and protein demand keep volumes steady, while EPR rules and brand commitments push buyers toward recycle-ready barrier films that cost more to develop and qualify. Rollstock keeps the largest share at 46.0% of 2025 value, but preformed pouches and digital printing gain faster. The 2026 resin shock showed that index-linked contracts protect margins. Winners will be converters with mono-material barrier know-how, plants in the South and West, and the balance sheets to absorb resin swings.
Trade, price and population data anchor the estimate
The report uses 2025 as the base year on a calendar basis, and market values come from the Credence Research model. That model combines trade association data on U.S. flexible packaging sales and end uses, producer price indexes for plastics packaging film and sheet, Census Bureau population and e-commerce statistics, pet industry spending data, state EPR program reports and company releases. Segment splits, regional shares and regional growth rates are Credence Research estimates. Sources used are government statistics, trade association reports, company releases and trade press, and no interviews or surveys were used.
Food, pet food and barrier films carry value to 2035
Flexible plastic packaging sales in the United States are expected to reach USD 50.53 billion by 2035, a 3.79% CAGR during 2026–2035, as food and pet food demand hold their base and e-commerce, healthcare and barrier films add value. Rollstock remains the largest product type, while preformed pouches and digital printing gain share. The South keeps its lead and remains the fastest-growing of the four census regions. More mid-sized converters are likely to join larger groups, and most multilayer laminates will be redesigned for recyclability before 2032. A longer resin shock or faster paper substitution would pull growth toward the downside case.
Resin costs and redesign pace set the range
In the base case, value grows from the 2026 level along the central forecast as resin prices ease in 2027 and EPR redesigns proceed on schedule. The downside case assumes a longer resin shock, faster substitution by paper in protective and carry formats, and fee-driven cuts in packaging per unit. The upside case adds faster pet food and e-commerce growth, quicker adoption of recycle-ready barrier films and wider use of digital short runs, which would lift value per pack.
| Scenario | CAGR, 2026–2035 | Value, 2035 | What has to hold |
|---|---|---|---|
| Downside | 2.8% | USD 46.31 billion | Resin prices stay high into 2028 and paper replaces more protective formats |
| Base | 3.79% | USD 50.53 billion | Resin normalizes in 2027 and EPR redesigns follow state deadlines |
| Upside | 4.6% | USD 54.15 billion | Pet food, e-commerce and recycle-ready barrier films grow faster than expected |
Frequently Asked Questions
How big is the USA flexible plastic packaging market?
Which product type leads the market?
Which region holds the largest share?
How did the 2026 resin shock affect packaging prices?
How do state EPR laws affect flexible packaging?
How does e-commerce affect demand for flexible films?
Who are the main companies in this market?
Which application grows fastest?
Table of Content
Chapter 1 Market Segmentation
- 1.1 Segmentation Framework
- 1.1.1 Product and Service Classification
- 1.1.2 Application and End-Use Classification
- 1.1.3 Technology and Solution Classification
- 1.1.4 Customer and Distribution Channel Classification
- 1.1.5 Geographic Segmentation
- 1.1.6 Market Segment Definitions and Boundaries
- 1.2 By Product Type
- 1.2.1 Rollstock
- 1.2.2 Preformed pouches
- 1.2.3 Bags and liners
- 1.2.4 Stretch and shrink films
- 1.3 By Application
- 1.3.1 Food and beverage packaging
- 1.3.2 Pet food packaging
- 1.3.3 Healthcare packaging
- 1.3.4 Household and personal care packaging
- 1.3.5 Transport and protective packaging
- 1.4 By Technology
- 1.4.1 Flexographic printing
- 1.4.2 Rotogravure printing
- 1.4.3 Digital printing
- 1.4.4 Unprinted film conversion
- 1.5 By Price Tier
- 1.5.1 Commodity films
- 1.5.2 Standard printed packaging
- 1.5.3 High-barrier packaging
- 1.5.4 Specialty validated packaging
Chapter 2 Introduction
- 2.1 Report Objectives and Scope
- 2.2 Product Definition and Industry Terminology
- 2.3 Market Inclusions and Exclusions
- 2.4 Research Process
- 2.4.1 Primary Research and Expert Interviews
- 2.4.2 Secondary Research and Source Review
- 2.4.3 Top-Down and Bottom-Up Estimation
- 2.4.4 Data Triangulation and Verification
- 2.5 Market Size Measurement Basis
- 2.5.1 2025: USD 34.74 billion → 2035: USD 50.53 billion
- 2.6 Historical and Forecast Reference Periods
- 2.6.1 Historical Period: 2018-2025
- 2.6.2 Base Year: 2025
- 2.6.3 Forecast Period: 2025-2035
- 2.7 Research Assumptions and Limitations
Chapter 3 Executive Summary
- 3.1 Market Snapshot and Key Findings
- 3.2 Base-Year Market Size, 2025
- 3.3 Forecast Market Size, 2035
- 3.4 Revenue and Volume Growth Outlook
- 3.5 Key Demand and Supply Indicators
- 3.6 Leading Market Segments
- 3.7 Fastest-Growing Market Opportunities
- 3.8 Regional Performance Highlights
- 3.9 Technology and Industry Transformation
- 3.10 Competitive Landscape Summary
- 3.11 Analyst View and Strategic Implications
Chapter 4 USA Flexible Plastic Packaging Market Trends and Developments
- 4.1 Historical Industry Development, 2018-2025
- 4.2 Recent Market Trends and Developments
- 4.3 Demand and Customer Behavior Trends
- 4.4 Technology and Product Innovation
- 4.5 Artificial Intelligence, Automation and Digitalization
- 4.6 Local Manufacturing and Supply Chain Realignment
- 4.7 Industry Partnerships, Mergers and Acquisitions
- 4.8 Sustainability and Circular Economy Developments
- 4.9 Government and Private Sector Investment Trends
- 4.10 Emerging Business Models and Commercialization
- 4.11 Industry Developments and Announcements
Chapter 5 USA Flexible Plastic Packaging Market Production, Supply and Demand Analysis
- 5.1 Demand Trend and Consumption Analysis, 2018-2025
- 5.2 Demand Forecast, 2025-2035
- 5.3 Production and Output Trend, 2018-2025
- 5.4 Production and Output Forecast, 2025-2035
- 5.5 Installed Capacity and Capacity Utilization
- 5.6 Company-Wise Production Plants and Statistics
- 5.6.1 Installed Production Capacity
- 5.6.2 Actual Production
- 5.6.3 Planned Capacity and Expansion Targets
- 5.7 Supply Chain Structure and Procurement Trends
- 5.8 Supply-Demand Gap and Bottlenecks
- 5.9 Import Dependence and Sourcing Structure
- 5.10 Contract Manufacturing and Outsourcing
- 5.11 Regional Supply and Demand Concentration
Chapter 6 USA Flexible Plastic Packaging Market Pricing Analysis
- 6.1 Pricing Structure and Measurement
- 6.2 Historical Pricing Trends, 2018-2025
- 6.3 Pricing Outlook, 2025-2035
- 6.4 Average Selling Price and Unit Economics
- 6.5 Pricing by Product and Market Segment
- 6.6 Geographic Pricing Differences
- 6.7 Key Input, Energy, Labor and Logistics Costs
- 6.8 Contract Pricing and Purchasing Models
- 6.9 Pricing Sensitivity and Competitive Positioning
- 6.10 Price, Margin and Profitability Implications
Chapter 7 USA Flexible Plastic Packaging Market Dynamics
- 7.1 Market Growth Drivers
- 7.1.1 Demand-Side Drivers
- 7.1.2 Technology and Innovation Drivers
- 7.1.3 Infrastructure and Investment Drivers
- 7.1.4 Regulatory and Policy Drivers
- 7.2 Market Restraints
- 7.2.1 Cost and Affordability Constraints
- 7.2.2 Technology and Adoption Barriers
- 7.2.3 Supply Chain and Operational Constraints
- 7.3 Market Challenges
- 7.3.1 Competitive Pressure and Margin Erosion
- 7.3.2 Skills, Infrastructure and Implementation Gaps
- 7.4 Emerging Market Opportunities
- 7.5 Market Dynamics Impact and Time-Horizon Assessment
Chapter 8 USA Flexible Plastic Packaging Value Chain Analysis
- 8.1 Industry Value Chain Overview
- 8.2 Upstream Suppliers and Critical Inputs
- 8.3 Technology and Component Providers
- 8.4 Manufacturing or Service Delivery
- 8.5 Distribution, Channel Partners and Integrators
- 8.6 Downstream Applications and End Users
- 8.7 Value Addition and Profit Pools
- 8.8 Vertical Integration and Outsourcing
- 8.9 Supplier Concentration and Risk
- 8.10 Supply Chain Localization and Resilience
Chapter 9 USA Flexible Plastic Packaging Market Regulations and Policies
- 9.1 Relevant Laws, Standards and Compliance Frameworks
- 9.2 Product, Service, Safety and Quality Requirements
- 9.3 Government Policies, Incentives and Subsidies
- 9.4 Imports, Exports and Trade Barriers
- 9.5 Public Procurement and Local Content Requirements
- 9.6 Environmental and Sustainability Compliance
- 9.7 Upcoming Policy Changes and Market Implications
Chapter 10 USA Flexible Plastic Packaging Market Hotspots and Opportunities
- 10.1 Market Opportunity Mapping and Growth Hotspots
- 10.2 High-Growth Applications and Customer Groups
- 10.3 Underserved Markets and White-Space Opportunities
- 10.4 Emerging Technology and Product Opportunities
- 10.5 New Capacity and Investment Hotspots
- 10.6 Market Entry and Expansion Opportunities
- 10.7 Distribution and Partnership Opportunities
- 10.8 Near-Term and Long-Term Commercial Potential
- 10.9 Opportunity Attractiveness and Execution Risks
Chapter 11 USA Flexible Plastic Packaging Market Outlook, 2025-2035
- 11.1 Market Size and Analysis
- 11.1.1 Revenue (Market Measurement: 2025: USD 34.74 billion → 2035: USD 50.53 billion)
- 11.1.2 Market Volume and Quantity Sold
- 11.1.3 Historical Market Size, 2018-2025
- 11.1.4 Base-Year Market Size, 2025
- 11.2 Market Forecast, 2025-2035
- 11.2.1 Revenue Forecast to 2035
- 11.2.2 Volume Forecast to 2035
- 11.2.3 CAGR and Year-on-Year Growth
- 11.2.4 Incremental Revenue Opportunity
- 11.3 Forecast Assumptions and Scenario Analysis
- 11.3.1 Base-Case Forecast
- 11.3.2 Optimistic and Conservative Scenarios
- 11.3.3 Technology, Pricing and Policy Sensitivities
- 11.4 Market Attractiveness and Growth Outlook
Chapter 12 USA Flexible Plastic Packaging Market Segmentation and Outlook
- 12.1 Segmentation Summary and Market Shares, 2025
- 12.2 Largest and Fastest-Growing Segments
- 12.3 By Product Type - Market Size and Forecast, 2025-2035
- 12.3.1 Segment Definition and Scope
- 12.3.2 Historical Market Size, 2018-2025
- 12.3.3 Revenue Forecast, 2025-2035
- 12.3.4 Volume Forecast, 2025-2035
- 12.3.5 Base-Year Market Share, 2025
- 12.3.6 Segment CAGR and Growth Drivers
- 12.3.7 Subsegment Market Size and Forecast
- 12.3.7.1 Rollstock
- 12.3.7.2 Preformed pouches
- 12.3.7.3 Bags and liners
- 12.3.7.4 Stretch and shrink films
- 12.3.8 Subsegment Pricing and Adoption Trends
- 12.3.9 Leading Suppliers and Competition
- 12.3.10 Regional Demand and Opportunities
- 12.4 By Application - Market Size and Forecast, 2025-2035
- 12.4.1 Segment Definition and Scope
- 12.4.2 Historical Market Size, 2018-2025
- 12.4.3 Revenue Forecast, 2025-2035
- 12.4.4 Volume Forecast, 2025-2035
- 12.4.5 Base-Year Market Share, 2025
- 12.4.6 Segment CAGR and Growth Drivers
- 12.4.7 Subsegment Market Size and Forecast
- 12.4.7.1 Food and beverage packaging
- 12.4.7.2 Pet food packaging
- 12.4.7.3 Healthcare packaging
- 12.4.7.4 Household and personal care packaging
- 12.4.7.5 Transport and protective packaging
- 12.4.8 Subsegment Pricing and Adoption Trends
- 12.4.9 Leading Suppliers and Competition
- 12.4.10 Regional Demand and Opportunities
- 12.5 By Technology - Market Size and Forecast, 2025-2035
- 12.5.1 Segment Definition and Scope
- 12.5.2 Historical Market Size, 2018-2025
- 12.5.3 Revenue Forecast, 2025-2035
- 12.5.4 Volume Forecast, 2025-2035
- 12.5.5 Base-Year Market Share, 2025
- 12.5.6 Segment CAGR and Growth Drivers
- 12.5.7 Subsegment Market Size and Forecast
- 12.5.7.1 Flexographic printing
- 12.5.7.2 Rotogravure printing
- 12.5.7.3 Digital printing
- 12.5.7.4 Unprinted film conversion
- 12.5.8 Subsegment Pricing and Adoption Trends
- 12.5.9 Leading Suppliers and Competition
- 12.5.10 Regional Demand and Opportunities
- 12.6 By Price Tier - Market Size and Forecast, 2025-2035
- 12.6.1 Segment Definition and Scope
- 12.6.2 Historical Market Size, 2018-2025
- 12.6.3 Revenue Forecast, 2025-2035
- 12.6.4 Volume Forecast, 2025-2035
- 12.6.5 Base-Year Market Share, 2025
- 12.6.6 Segment CAGR and Growth Drivers
- 12.6.7 Subsegment Market Size and Forecast
- 12.6.7.1 Commodity films
- 12.6.7.2 Standard printed packaging
- 12.6.7.3 High-barrier packaging
- 12.6.7.4 Specialty validated packaging
- 12.6.8 Subsegment Pricing and Adoption Trends
- 12.6.9 Leading Suppliers and Competition
- 12.6.10 Regional Demand and Opportunities
- 12.7 Segment Growth Comparison
- 12.8 Segment Attractiveness and Priority Matrix
Chapter 13 USA Flexible Plastic Packaging End-Use and Application Market Outlook
- 13.1 End-Use Industry and Customer Demand Structure
- 13.2 Leading Applications and Customer Groups
- 13.3 End-Use Market Size, Share and Forecast
- 13.4 Major End-Use Industry Deep Dives
- 13.4.1 Customer Requirements and Use Cases
- 13.4.2 Demand and Replacement Cycles
- 13.4.3 Technical and Regulatory Considerations
- 13.4.4 Purchasing and Procurement Models
- 13.4.5 Leading Vendors and Distribution Channels
- 13.4.6 Forecast and Commercial Opportunities
- 13.5 Emerging Applications and Cross-Segment Demand
- 13.6 End-Use Industry Investment Priorities
Chapter 14 USA Flexible Plastic Packaging Geographic Market Outlook, 2025-2035
- 14.1 Domestic Market Distribution and Demand Clusters
- 14.2 State- or Province-Wise Market Size and Forecast, 2025-2035
- 14.3 City and Metropolitan Market Outlook
- 14.4 Industrial, Manufacturing and Commercial Clusters
- 14.5 Geographic Concentration of Key End Users
- 14.6 Local Pricing and Purchasing Differences
- 14.7 Domestic Production Facilities and Capacity Map
- 14.8 Local Infrastructure and Project Pipeline
- 14.9 State-Level Policy and Incentive Differences
- 14.10 Subnational Investment Hotspots and Opportunities
- 14.11 Distribution and Logistics Networks
- 14.12 Domestic Competitive Footprint
Chapter 15 USA Flexible Plastic Packaging Technology, Innovation and Sustainability Outlook
- 15.1 Technology Landscape and Maturity
- 15.2 Product, Process and Service Innovation
- 15.3 AI, Automation and Digital Tools in the Industry
- 15.4 Technology Adoption and Performance Benchmarking
- 15.5 Innovation Pipeline and R&D Investment
- 15.6 Patent and Intellectual Property Trends
- 15.7 Energy Efficiency and Resource Management
- 15.8 Sustainability, Recycling and Circularity
- 15.9 Technology Roadmap, 2025-2035
- 15.10 Risks of Obsolescence and Technology Substitution
Chapter 16 USA Flexible Plastic Packaging Market Key Strategic Imperatives
- 16.1 Growth and Market Entry Priorities
- 16.2 High-Return Products and Segments
- 16.3 Pricing, Profitability and Cost Optimization
- 16.4 Technology Investment and Product Differentiation
- 16.5 Supply Chain Localization and Resilience
- 16.6 Distribution and Customer Acquisition
- 16.7 Partnership, Acquisition and Capacity Strategy
- 16.8 Regional Expansion Priorities
- 16.9 Short-, Medium- and Long-Term Actions
Chapter 17 Competition Outlook
- 17.1 Industry Competition Characteristics
- 17.2 Market Structure and Concentration
- 17.3 Market Share and Competitive Positioning, 2025
- 17.4 Company-Wise Revenue and Product Benchmarking
- 17.5 Production and Service Capacity Benchmarking
- 17.6 Technology, Pricing and Differentiation
- 17.7 Regional Footprint and Distribution Strength
- 17.8 Mergers, Acquisitions and Strategic Alliances
- 17.9 New Entrants and Competitive Threats
- 17.10 Porter's Five Forces and Industry Attractiveness
- 17.11 Competitive Outlook, 2025-2035
Chapter 18 Company Profiles
- 18.1 Company Coverage and Selection Criteria
- 18.2 Amcor
- 18.2.1 Business Description
- 18.2.2 Company Ownership and Geographic Presence
- 18.2.3 Product and Service Portfolio
- 18.2.4 Manufacturing and Operating Footprint
- 18.2.5 Production Capacity and Expansion Plans
- 18.2.6 Financial Performance and Investment
- 18.2.7 Market Share and Competitive Position
- 18.2.8 Technology and Innovation Capabilities
- 18.2.9 Strategic Alliances or Partnerships
- 18.2.10 Recent Developments
- 18.2.11 Growth Strategy and Outlook
- 18.3 ProAmpac
- 18.4 Sealed Air
- 18.5 TOPPAN Packaging Americas (TOPPAN Holdings)
- 18.6 Printpack
- 18.7 American Packaging Corporation
- 18.8 Winpak
- 18.9 Novolex
- 18.10 Hood Packaging
- 18.11 ePac Flexible Packaging
- 18.12 Other Relevant Market Participants
Note: Every listed company is profiled on the structure shown under the first company. The company list is preliminary and may change based on research findings, market developments, data availability and client requirements.
Chapter 19 Disclaimer
- 19.1 Research and Forecast Disclaimer
- 19.2 Data Source and Estimation Limitations
Note: The depth of individual sections depends on data availability for this market. Volume, capacity, trade and other unit-based metrics are included where applicable.