
Australia agricultural packaging rides record farm output
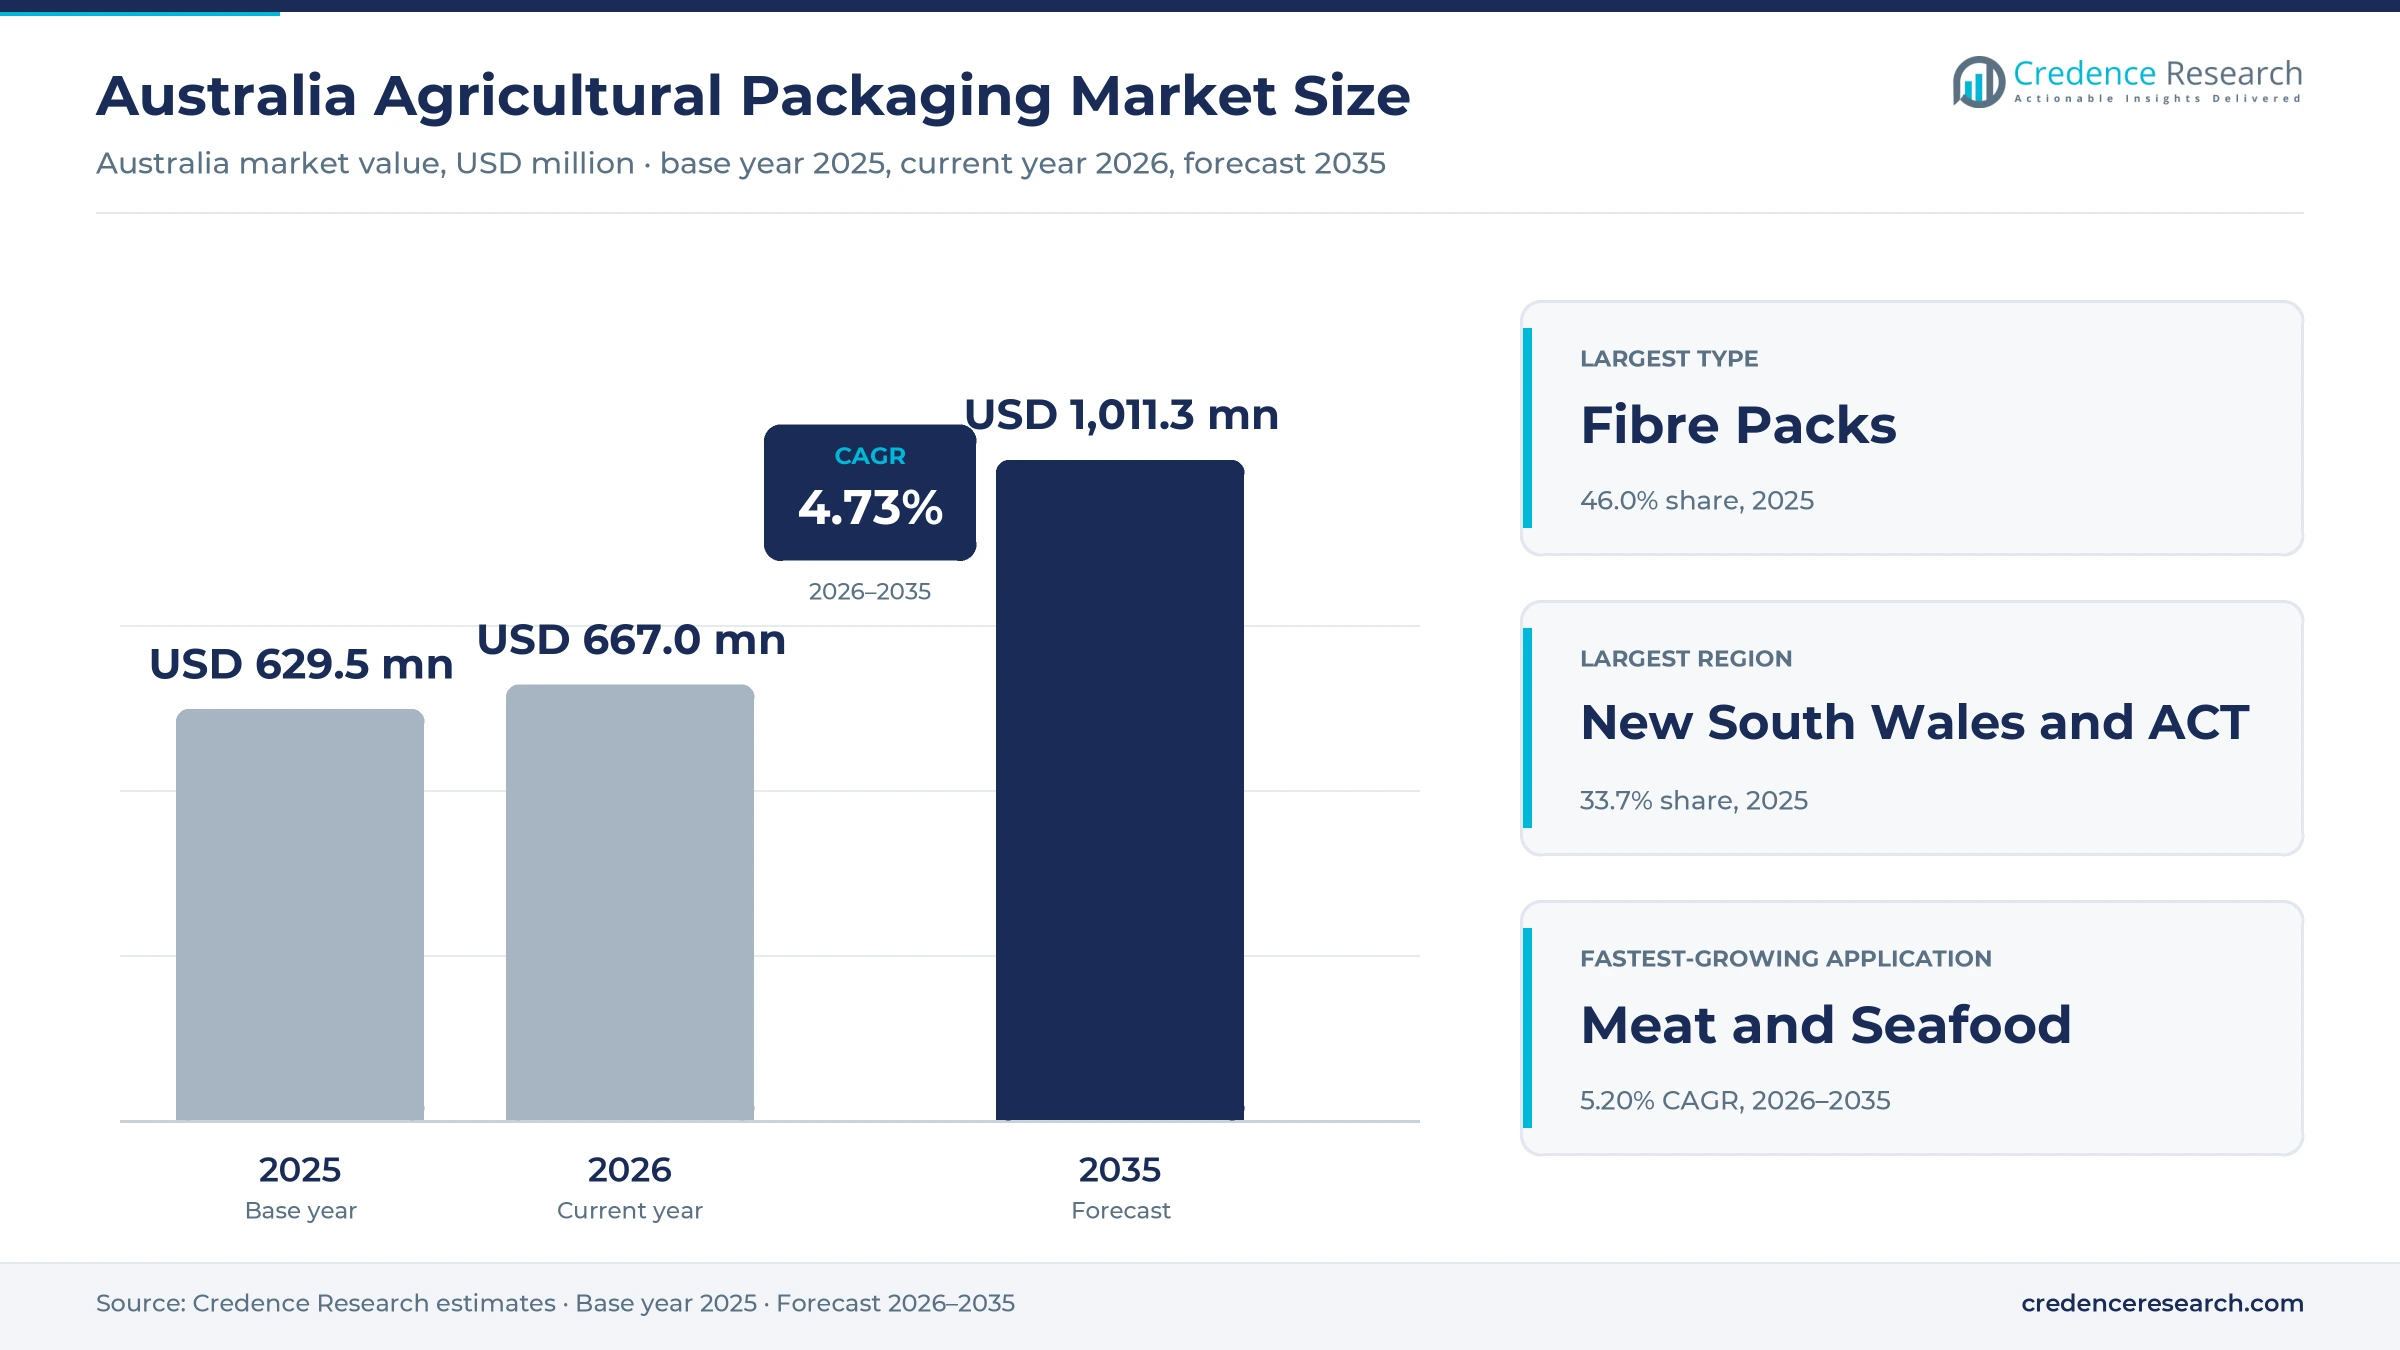
The Australia agricultural packaging market was valued at USD 629.5 million in 2025 and is projected to increase from USD 667.0 million in 2026 to USD 1.01 billion by 2035, registering a CAGR of 4.73% during 2026–2035. Demand comes from horticulture growers and packing sheds, red meat and seafood processors, grain and seed handlers, and makers of fertilizer and crop protection products. New South Wales and Australian Capital Territory held the largest regional share, 33.7% in 2025, while Western Australia and South Australia is the fastest-growing zone at 5.14% a year as western and southern grain harvests expand. Corrugated cartons carry most produce and boxed meat, flexible films and woven sacks protect proteins, grain and inputs, and rigid drums and crates hold chemicals and reusable produce flows. Ownership changed across the supply base in 2025 and 2026, as Amcor merged with Berry Global, Abbe agreed to buy the eastern Australian corrugated plants of Oji Fibre Solutions and Sealed Air became a private company.
Which farm and processing packs does the estimate count?
The estimate counts packaging bought for fresh produce, for first-processor meat and seafood, for grain, seed and fertilizer, and for agricultural chemicals in Australia. Growers and packing sheds buy cartons, punnets, bins and liners, while beef, lamb and seafood processors buy cartons, vacuum bags and barrier films. Input packers fill woven sacks, bulk bags, drums and jerry cans, usually under direct contracts or through rural merchants.
Retail-ready packs for further-processed foods, beverage packaging, household consumer packs and grain moved in bulk without packaging fall outside the estimate. The value chain runs from paper mills and resin suppliers through converters and distributors to farms, packhouses, abattoirs and input formulators.
Australia Agricultural Packaging Market Insights
- The market grows from USD 629.5 million in 2025 to USD 1.01 billion by 2035 at a 4.73% CAGR, led by export protein, horticulture and larger grain crops.
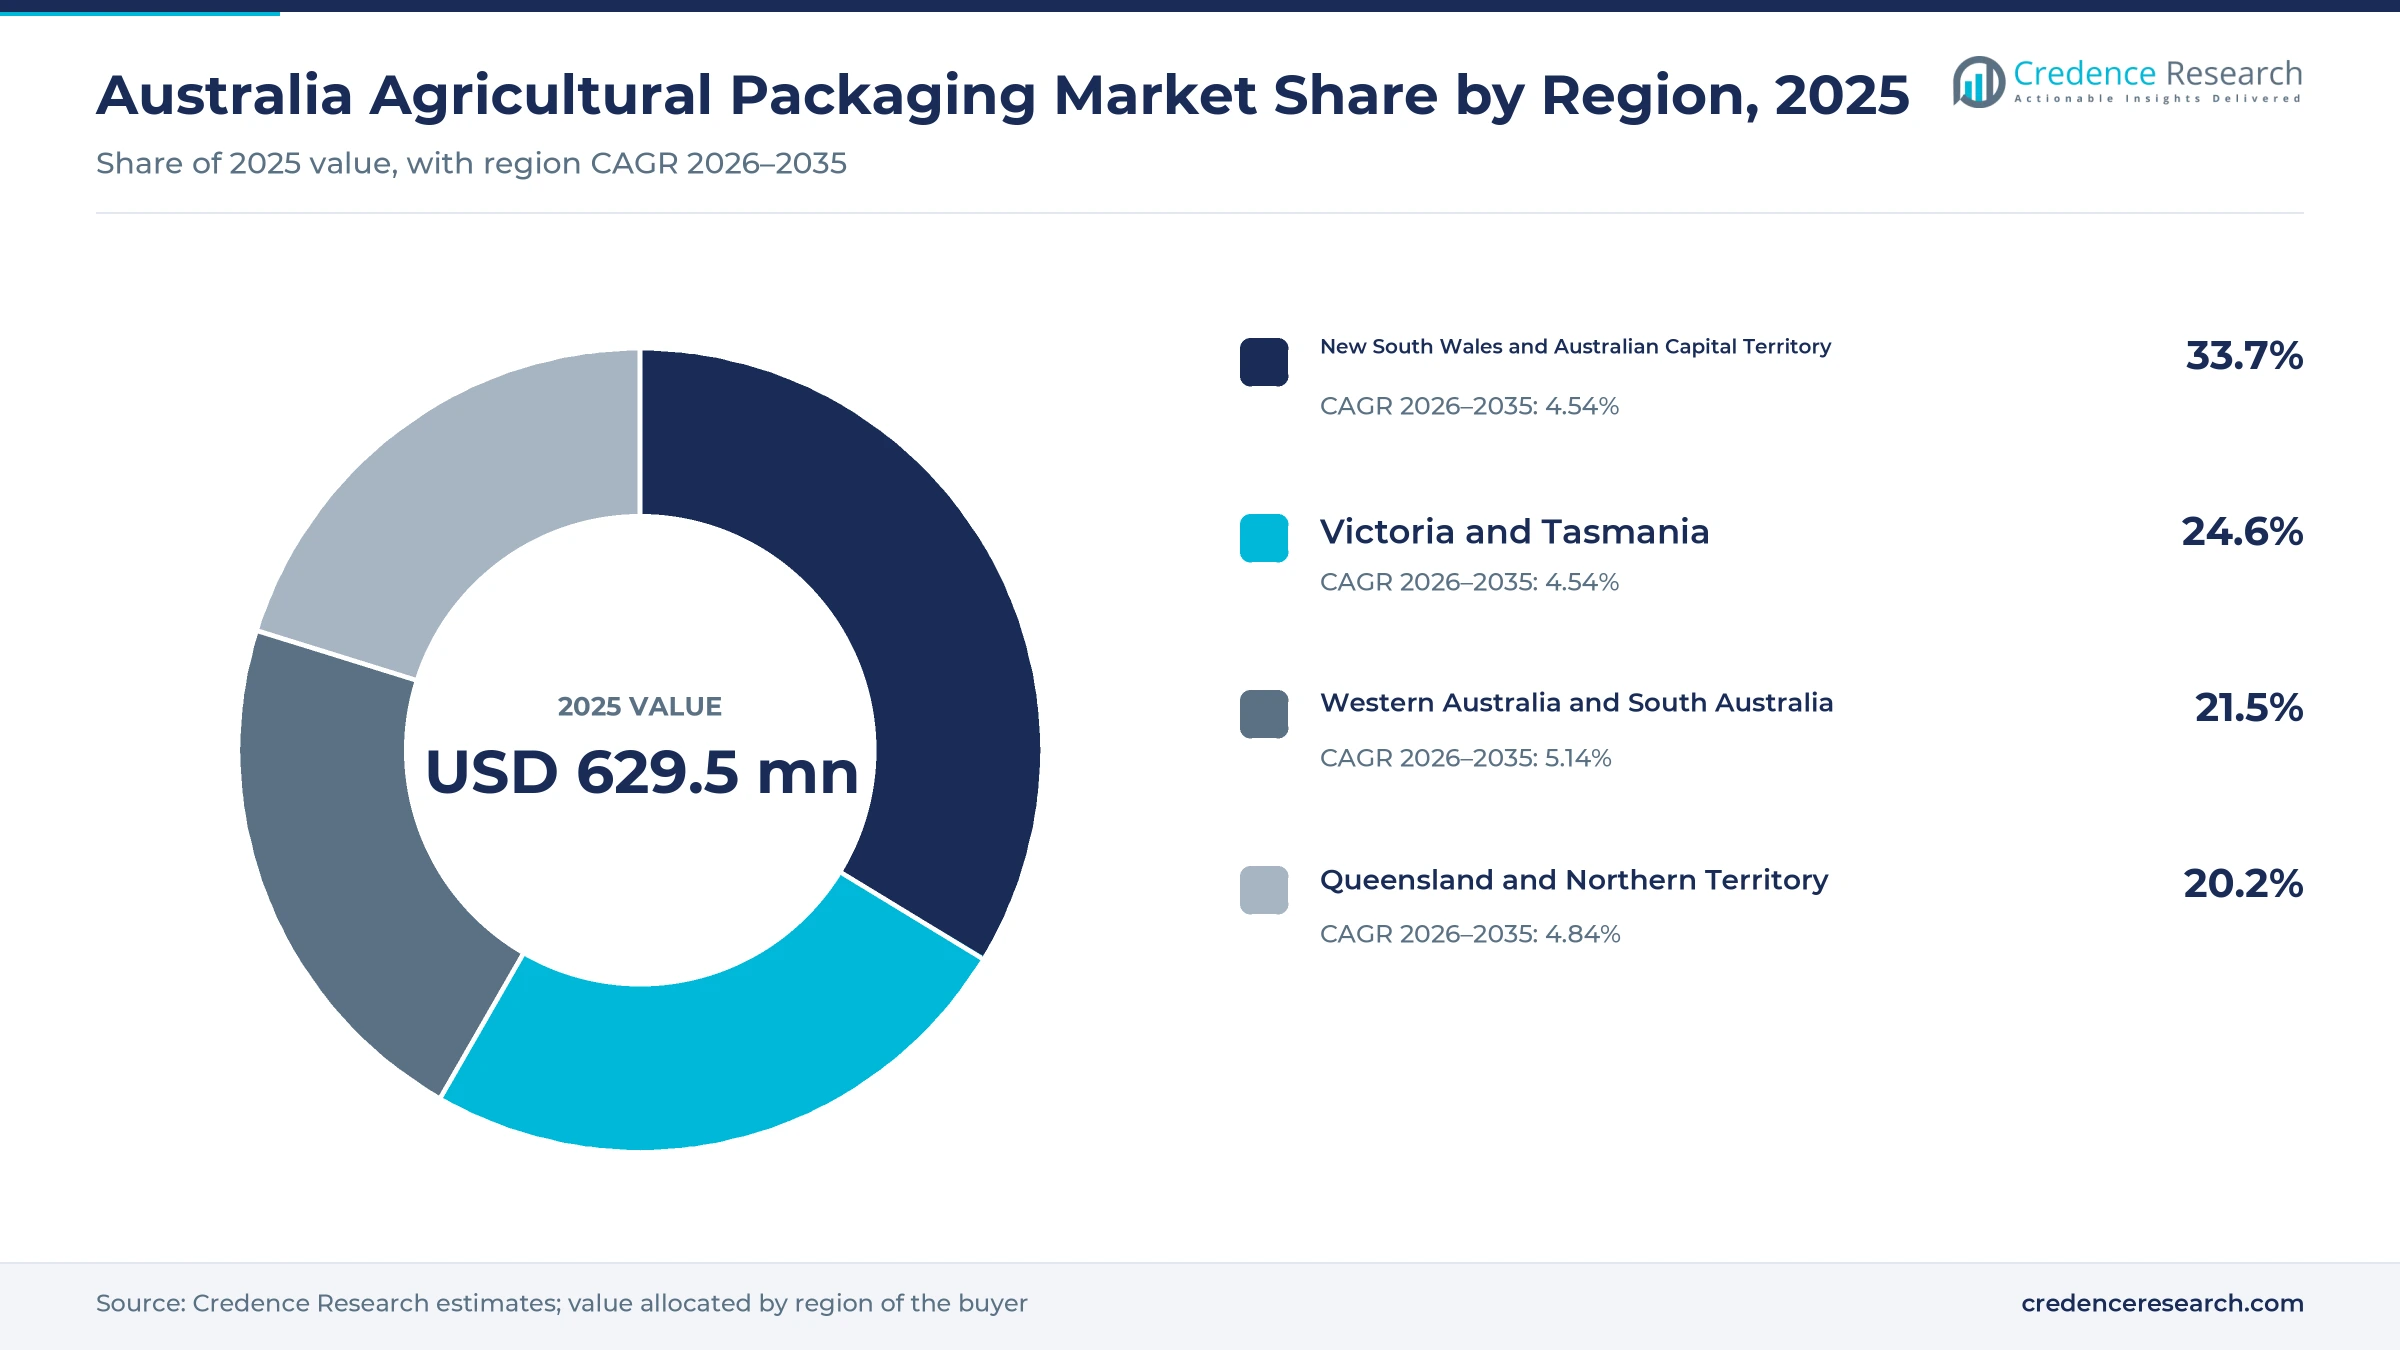
- New South Wales and Australian Capital Territory held 33.7% of 2025 value, ahead of Victoria and Tasmania at 24.6%, on mixed cropping, beef and horticulture output.
- Fibre Packs held 46.0% of 2025 value, while Flexible Packs grow fastest at 5.23% a year through 2035.
- Australian beef exports rose 15% to 1,545,784 metric tons in 2025, according to Meat & Livestock Australia, which lifted demand for barrier bags and cartons.
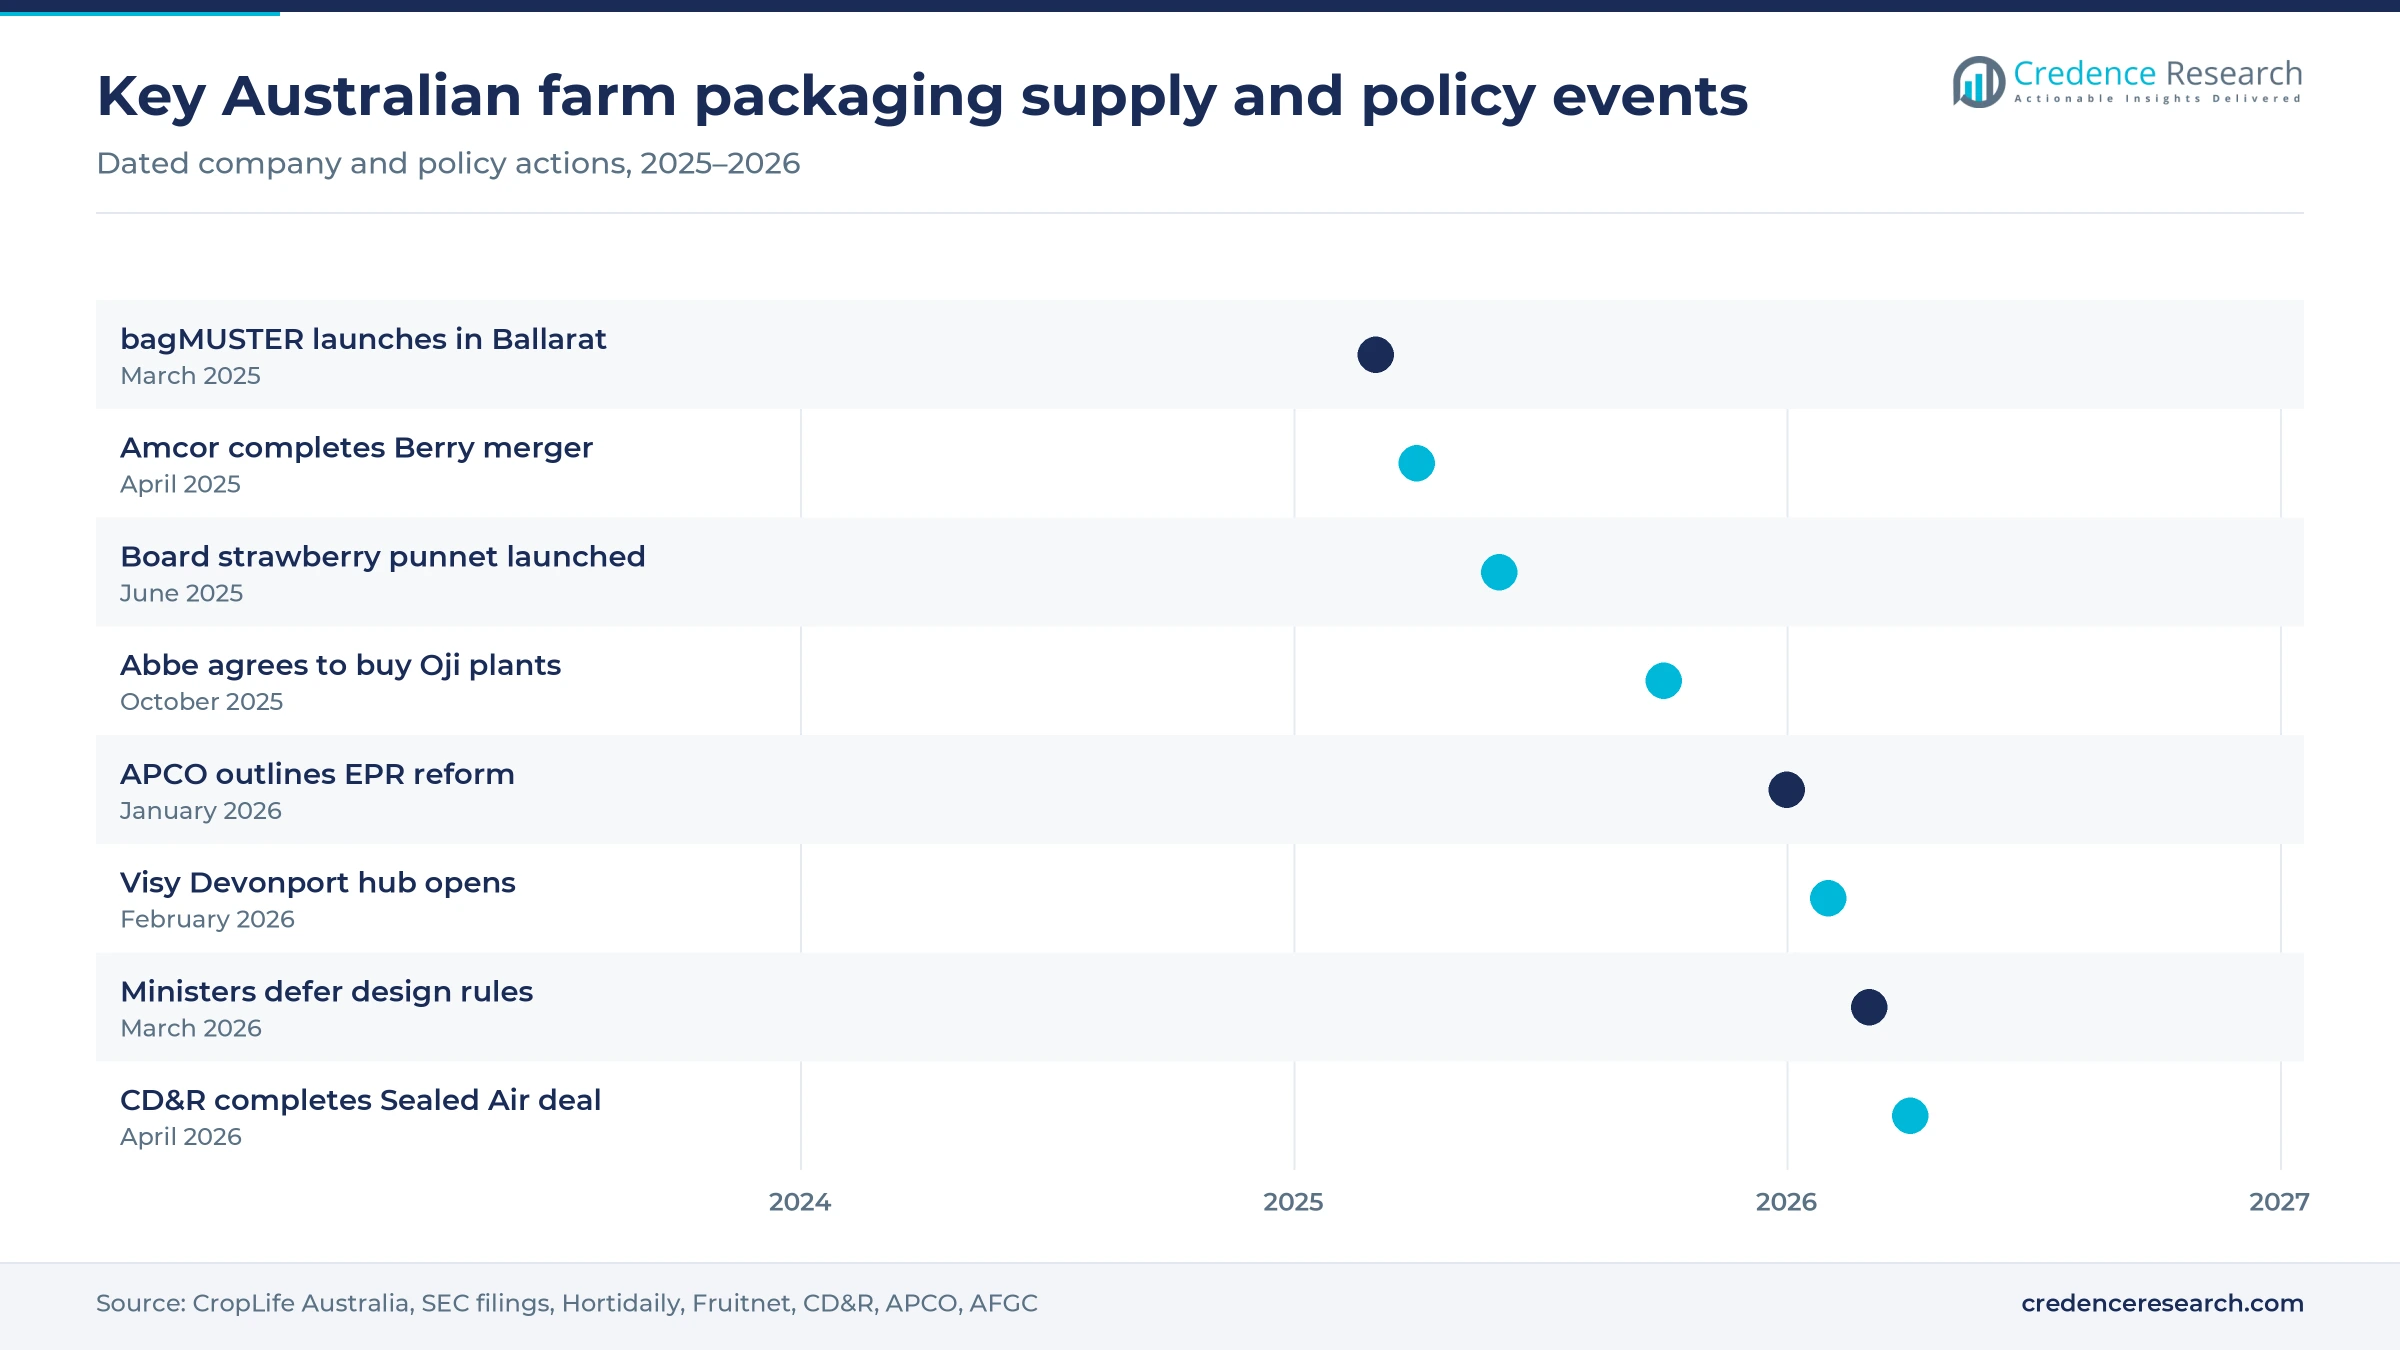
- Abbe agreed in October 2025 to buy Oji Fibre Solutions' eastern Australian corrugated operations, while CD&R completed its Sealed Air acquisition in April 2026.
Fiber cartons and produce packs hold most of the value
Why do fiber cartons lead while flexible packs grow fastest?
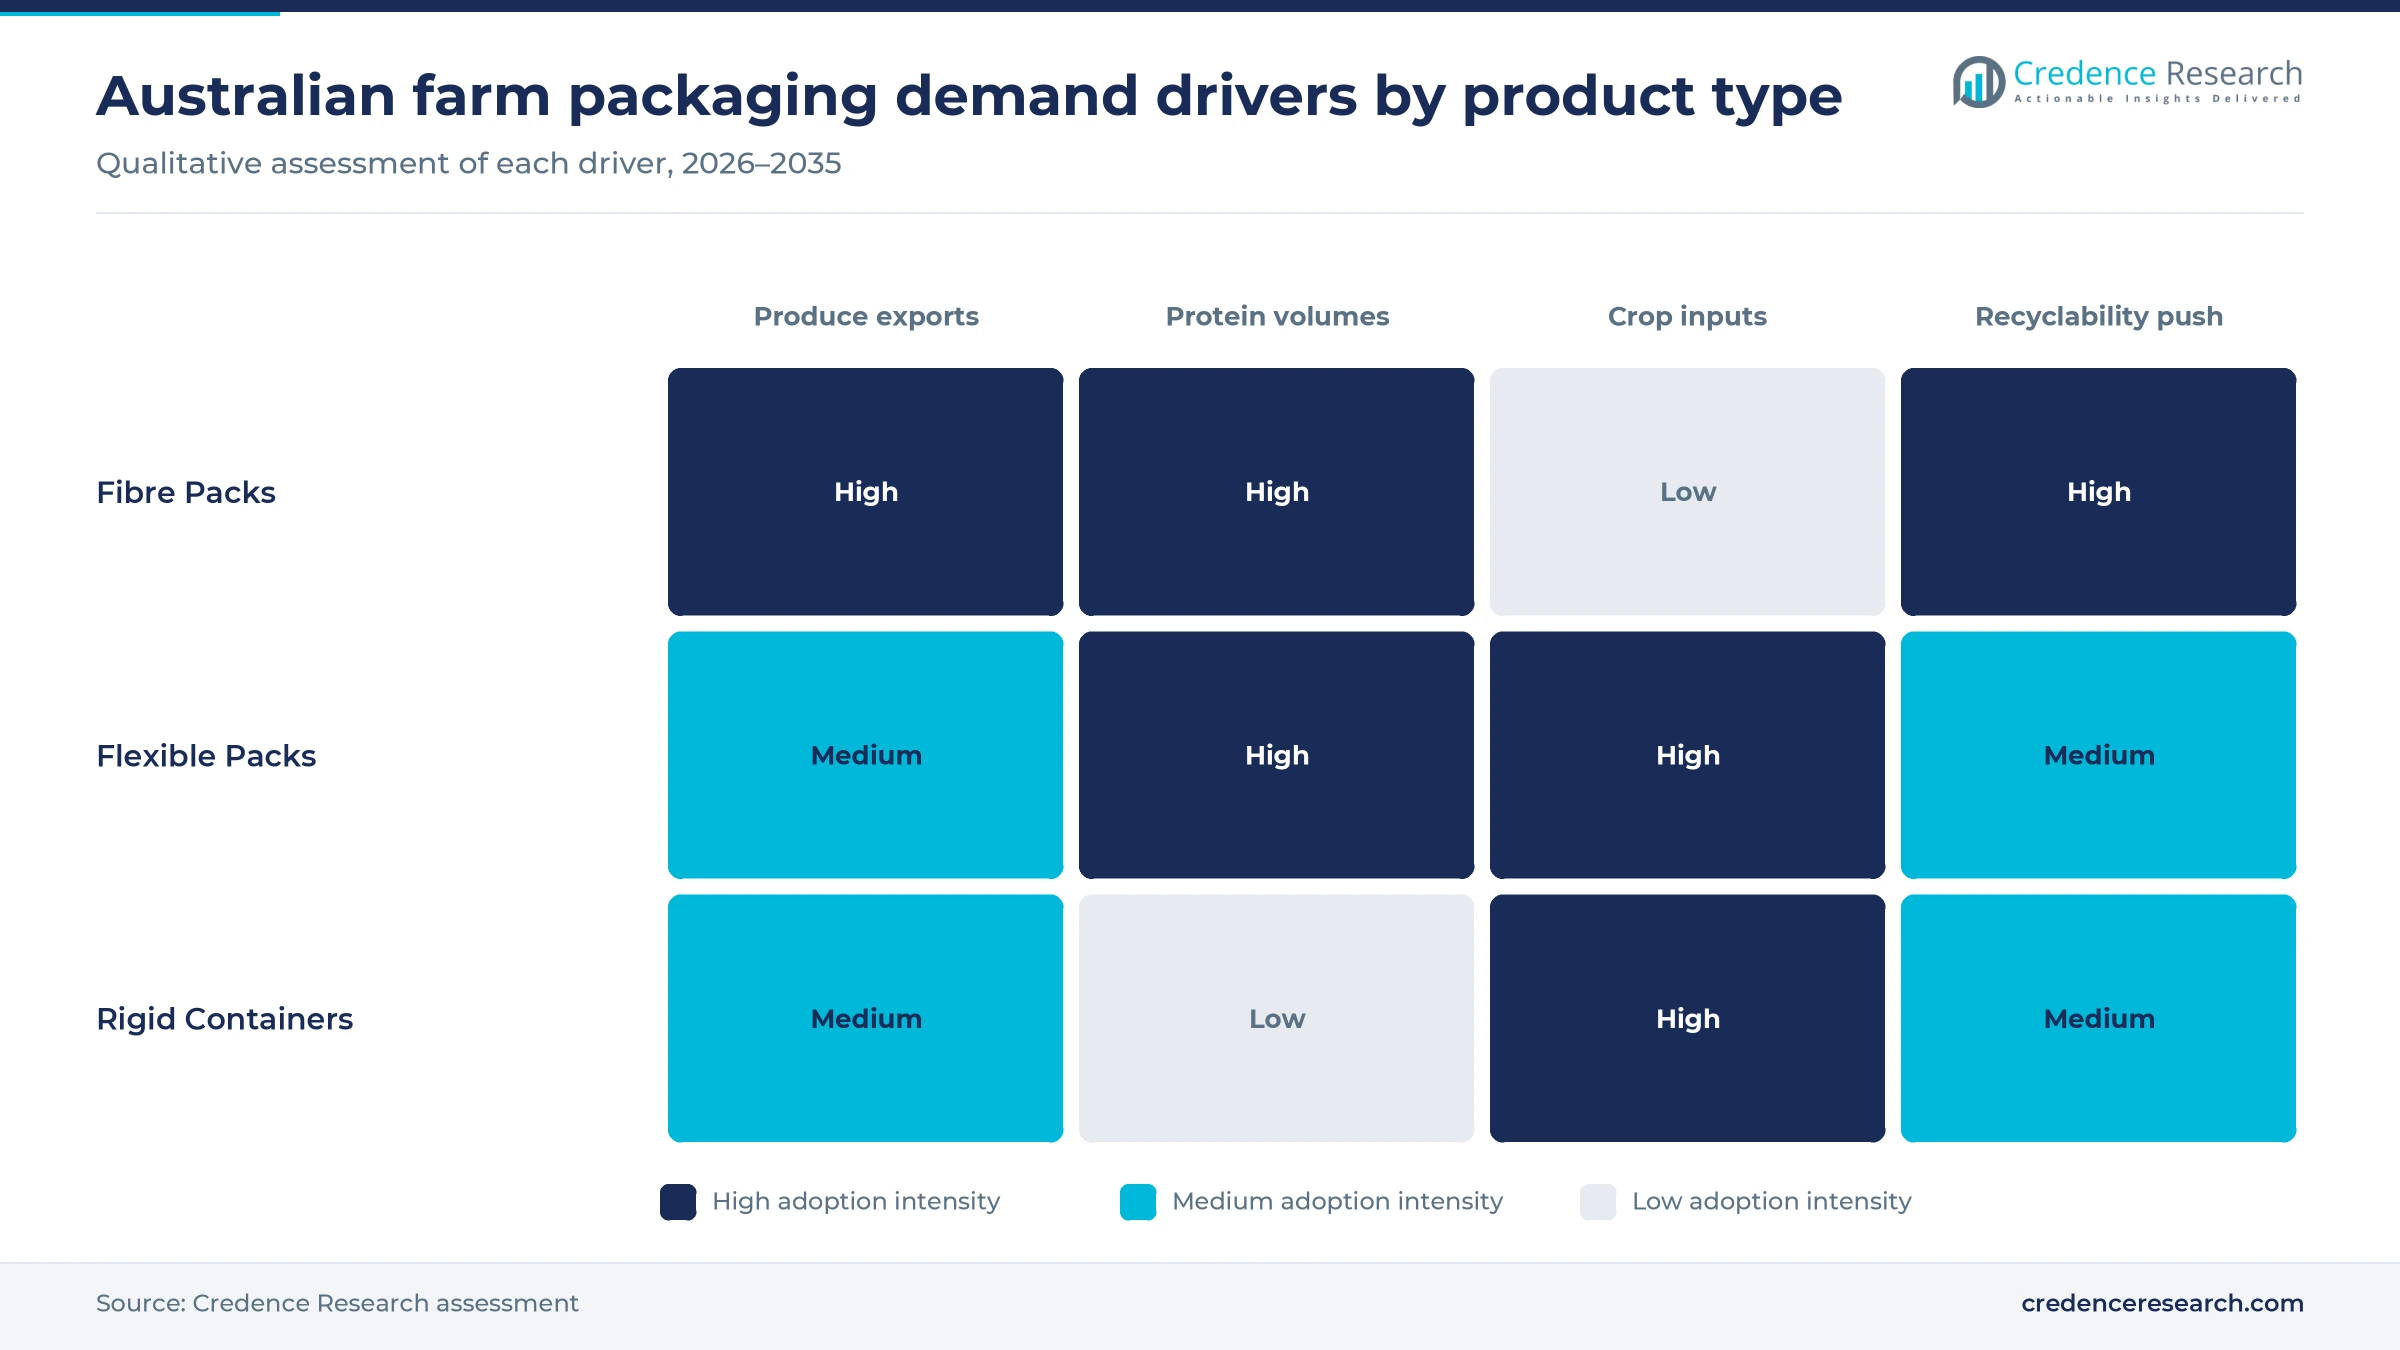
Based on product type, the market is categorized into Flexible Packs, Fibre Packs and Rigid Containers. In the Australia agricultural packaging market, Fibre Packs led with a 46.0% share of 2025 value, because corrugated cartons carry most fruit, vegetables and boxed meat from farm to port. Visy opened an 8,500-square-meter hub in Devonport on Feb. 24, 2026 to supply cardboard to Tasmanian berry and produce growers, Fruitnet reported. Flexible Packs grow fastest at 5.23% a year as vacuum bags and barrier films follow export beef, with grainfed beef exports up 20% to 449,292 metric tons in 2025, according to Meat & Livestock Australia.
Why does fresh produce lead while meat and seafood grow fastest?
Based on application, the market is categorized into Fresh Produce Packaging, First-Processor Meat and Seafood Packaging, Grain, Seed and Fertiliser Packaging, and Agri-Chemical Packaging. Fresh Produce Packaging led with a 41.0% share of 2025 value, because horticulture is packed in many small units, and ABARES forecast a record A$19.2 billion of horticultural production for 2025-26 in September 2025. First-Processor Meat and Seafood Packaging grows fastest at 5.20% a year as processing volumes rise. Cattle slaughter reached 9.28 million head in 2025, the highest since 1978, according to Meat & Livestock Australia, and aquaculture was valued at an estimated A$2.31 billion in 2024-25, the Department of Agriculture, Fisheries and Forestry said.
Why do direct contracts lead while rural merchants grow fastest?
Based on sales channel, the market is categorized into Direct Manufacturer Contracts, Specialist Packaging Distributors and Rural Merchant Networks. Direct Manufacturer Contracts led with a 52.0% share of 2025 value, because large processors and retailers buy under multi-year supply deals. Pact Group's contract to own, wash and store the Woolworths produce crate pool is worth more than A$50 million a year and runs to 2033, PKN Packaging News reported in July 2023. Rural Merchant Networks grow fastest at 5.52% a year as farm retailers pair input sales with take-back services, and bagMUSTER began its first phase at the Nutrien Ag Solutions branch in Ballarat in March 2025, according to CropLife Australia.
| Segment Group | Leading Sub-segment | Share, 2025 | Fastest-growing Sub-segment | CAGR, 2026–2035 |
|---|---|---|---|---|
| By Product Type | Fibre Packs | 46.0% | Flexible Packs | 5.23% |
| By Application | Fresh Produce Packaging | 41.0% | First-Processor Meat and Seafood Packaging | 5.20% |
| By Sales Channel | Direct Manufacturer Contracts | 52.0% | Rural Merchant Networks | 5.52% |
Request a Free Sample
Fill in your details and we'll send you a free sample report.
- Sample data tables & charts
- Research methodology
Record crops, beef and produce exports lift pack volumes
Horticulture packaging diversifies with record produce value
Horticulture is the largest source of packaging demand in Australian farming, and its value and product range keep widening. Hort Innovation reported that production reached a record A$18.4 billion in 2024/25, up 6% on the previous year. Fruit rose to A$7.3 billion and vegetables to A$6 billion, while nuts climbed to a record A$1.7 billion, so packers now need punnets, cartons, bulk bins and nut bags in very different sizes. Exports add further variety, because fresh horticulture exports rose 13% to A$3.5 billion in 2024/25 and almonds alone reached A$1.3 billion. As a result, Fresh Produce Packaging held 41.0% of 2025 value, and growers increasingly specify packs by crop, market and shelf life rather than by one standard box.
Protein protection grows with record beef processing
Record cattle processing has raised the volume of cartons, liners and vacuum bags that first processors buy. Meat & Livestock Australia reported beef production of 2.87 million metric tons in 2025, 12% above 2024 and the largest on record. Shipments rose with it, because beef exports reached 1,545,784 metric tons in 2025, up 15%, with China up 41% and the United States taking 453,292 metric tons. Long sea voyages to those markets depend on high-barrier films and vacuum formats that protect chilled cuts. Japan and South Korea also took more beef, with volumes up 4% and 10%. First-Processor Meat and Seafood Packaging therefore grows at 5.20% a year, the fastest of the four applications.
Sack modernization follows record grain and pulse crops
Larger harvests and new stewardship programs are pushing seed, grain and fertilizer sacks toward recyclable woven and bulk formats. ABARES forecast a winter crop of 66.3 million metric tons for 2025-26, the second largest on record, with barley at a record 15.7 million metric tons and lentils at a record 1.9 million metric tons. Inputs follow the crop, and ABARES estimated that farms need about 2.9 million metric tons of urea between November 2025 and October 2026. CropLife Australia launched bagMUSTER on March 6, 2025, a free take-back program for seed, pesticide and other farm input bags. Single-material polypropylene woven sacks suit that recycling route, so pack makers are redesigning sacks around it.
Box and film suppliers consolidate and add regional reach
Suppliers are consolidating and adding regional sites, which improves service to packing sheds far from capital cities. Abbe agreed in October 2025 to acquire the Queensland, New South Wales and Victorian corrugated operations of Oji Fibre Solutions, including distribution and erecting sites in Far North Queensland and the Sunraysia region, with completion expected on Nov. 1, 2025. In flexible formats, Amcor completed its merger with Berry Global on April 30, 2025, and PKN Packaging News said its Australian business now sits within a wider film, rigid and closure portfolio. CD&R announced a US$10.3 billion deal for Sealed Air on Nov. 17, 2025 and completed it on April 9, 2026. Larger, closer suppliers shorten lead times for harvest peaks, which supports Fibre Packs in particular.
Fiber punnets, crate pools and EPR reshape pack choices
Shift from plastic punnets to board and pooled crates
Retailers and growers are moving produce out of single-use plastic into board punnets and pooled crates. Perfection Fresh and Detpak launched a board strawberry punnet at Hort Connections on June 4, 2025, with 87% less plastic and Coles stocking it from July, Hortidaily reported. Reusable crates are scaling in parallel, because the Pact-operated Woolworths produce pool replaces waxed cardboard and expanded polystyrene boxes, and each crate is designed for about 140 trips before recycling, PKN Packaging News reported. Pact and Morrison & Co then formed Viscount Reuse in December 2023, when Morrison took a 50% stake in the crate pooling business. As a result, fiber and pooled formats are taking share from polystyrene and plastic clamshells in fresh produce.
Rise of producer responsibility in national packaging policy
Packaging policy is moving toward producer responsibility, which will shape material choices for farm packs. PKN Packaging News reported in September 2024, citing data from the Australian Packaging Covenant Organisation (APCO), that 56% of the 7 million metric tons of packaging placed on the market in 2022 was recovered, while plastic packaging lagged far behind that rate. On Jan. 13, 2026, APCO outlined reforms built on extended producer responsibility and noted that Australia produces more than 1.3 million metric tons of plastic packaging a year. Federal consultation from Sept. 27 to Oct. 28, 2024 covered mandatory recycling labels and bans on PFAS and oxo-degradable plastics. Pack makers therefore favor mono-material films and recyclable fiber in new farm designs.
Opportunity in doubling horticulture exports by 2031
Export growth gives pack makers a chance to sell higher-specification cartons, liners and cold-chain packs. Hort Innovation launched Strategy 2031 in September 2026 with a goal of doubling horticulture exports to A$7 billion, Freshplaza reported, after exports grew 126% over the past decade. China is the main prize, because Hort Innovation reported 58% growth in shipments to China in 2024/25, while India, Vietnam and Japan also grew. Citrus exports reached a record A$569.7 million in the same year. Exporters investing in export cold chain capacity need cartons that survive refrigerated sea freight, so suppliers that test packs for long voyages can win contracts with export packhouses.
Opportunity in recovered farm plastics and container take-back
Stewardship programs give suppliers a growing stream of recovered plastic and a route to recycled-content packs. Agsafe's drumMUSTER program has recycled more than 47 million agricultural chemical containers since 1999 and diverted more than 50,000 metric tons from landfill through more than 700 locations, the program says. CropLife Australia expects bagMUSTER to divert up to 45,000 metric tons of single-use bags a year at full scale, with hundreds of collection points planned. Makers of agrochemical drums and jerry cans can use this recovered resin and offer verified take-back to brand owners. Rural Merchant Networks, growing at 5.52% a year, already sell the eligible products, which makes them natural partners for collection.
Fertilizer shocks and stalled rules test suppliers
Fertilizer supply shock through the Strait of Hormuz
Fertilizer supply became volatile in 2026, which disrupts the volume and timing of sack and bulk bag orders. ABARES reported that the United Arab Emirates, Saudi Arabia and Qatar supplied 23%, 17% and 17% of Australian urea imports in 2023 to 2025, all shipped through the Strait of Hormuz. Middle East urea prices peaked on April 22, 2026 and Geelong prices on May 7, 2026. Packers serving fertilizer and crop input suppliers face stop-start runs, so flexible capacity and safety stock matter more.
Stalled national rules delay new material investment
Unclear national rules make it hard for suppliers to commit capital to new materials. Environment ministers met on March 27, 2026 but did not agree on national packaging design rules or a regulatory model, according to the Australian Food and Grocery Council, and officials were asked to draft an intergovernmental agreement later in 2026. Existing state obligations continue, so national buyers face different requirements across jurisdictions. Film and sack makers may therefore delay recyclable-format lines until the rules are set.
Lower sheep meat output trims protein pack volumes
Sheep meat volumes fell in 2025, which offsets part of the gain from record beef. Meat & Livestock Australia reported that lamb production fell 5.2% to 597,068 metric tons and mutton production fell 13% to 258,757 metric tons, as lamb slaughter dropped 7% to 24.6 million head. Processors that specialize in sheep meat therefore needed fewer cartons, liners and bags. Suppliers with mixed beef and sheep customers can rebalance capacity, while sheep-focused plants face lower utilization.
Scarce recycled resin limits film and sack makers
Recycled resin remains scarce, which makes it hard for film and sack makers to meet content targets. PKN Packaging News reported, citing APCO data for 2022, that only 6% of plastic packaging was made from recycled plastic against an average 20% target, and that Australia was well short of its 2025 targets. Farm films and woven sacks are often soiled, so clean feedstock costs more to prepare. Suppliers can respond through take-back schemes and mono-material designs that are easier to reprocess.
New South Wales leads while western grain zones grow
| Region | Value, 2025 (USD million) | Share, 2025 | CAGR, 2026–2035 |
|---|---|---|---|
| New South Wales and Australian Capital Territory | 212.1 | 33.7% | 4.54% |
| Victoria and Tasmania | 154.9 | 24.6% | 4.54% |
| Western Australia and South Australia | 135.3 | 21.5% | 5.14% |
| Queensland and Northern Territory | 127.2 | 20.2% | 4.84% |
New South Wales and the ACT lead on mixed farm output
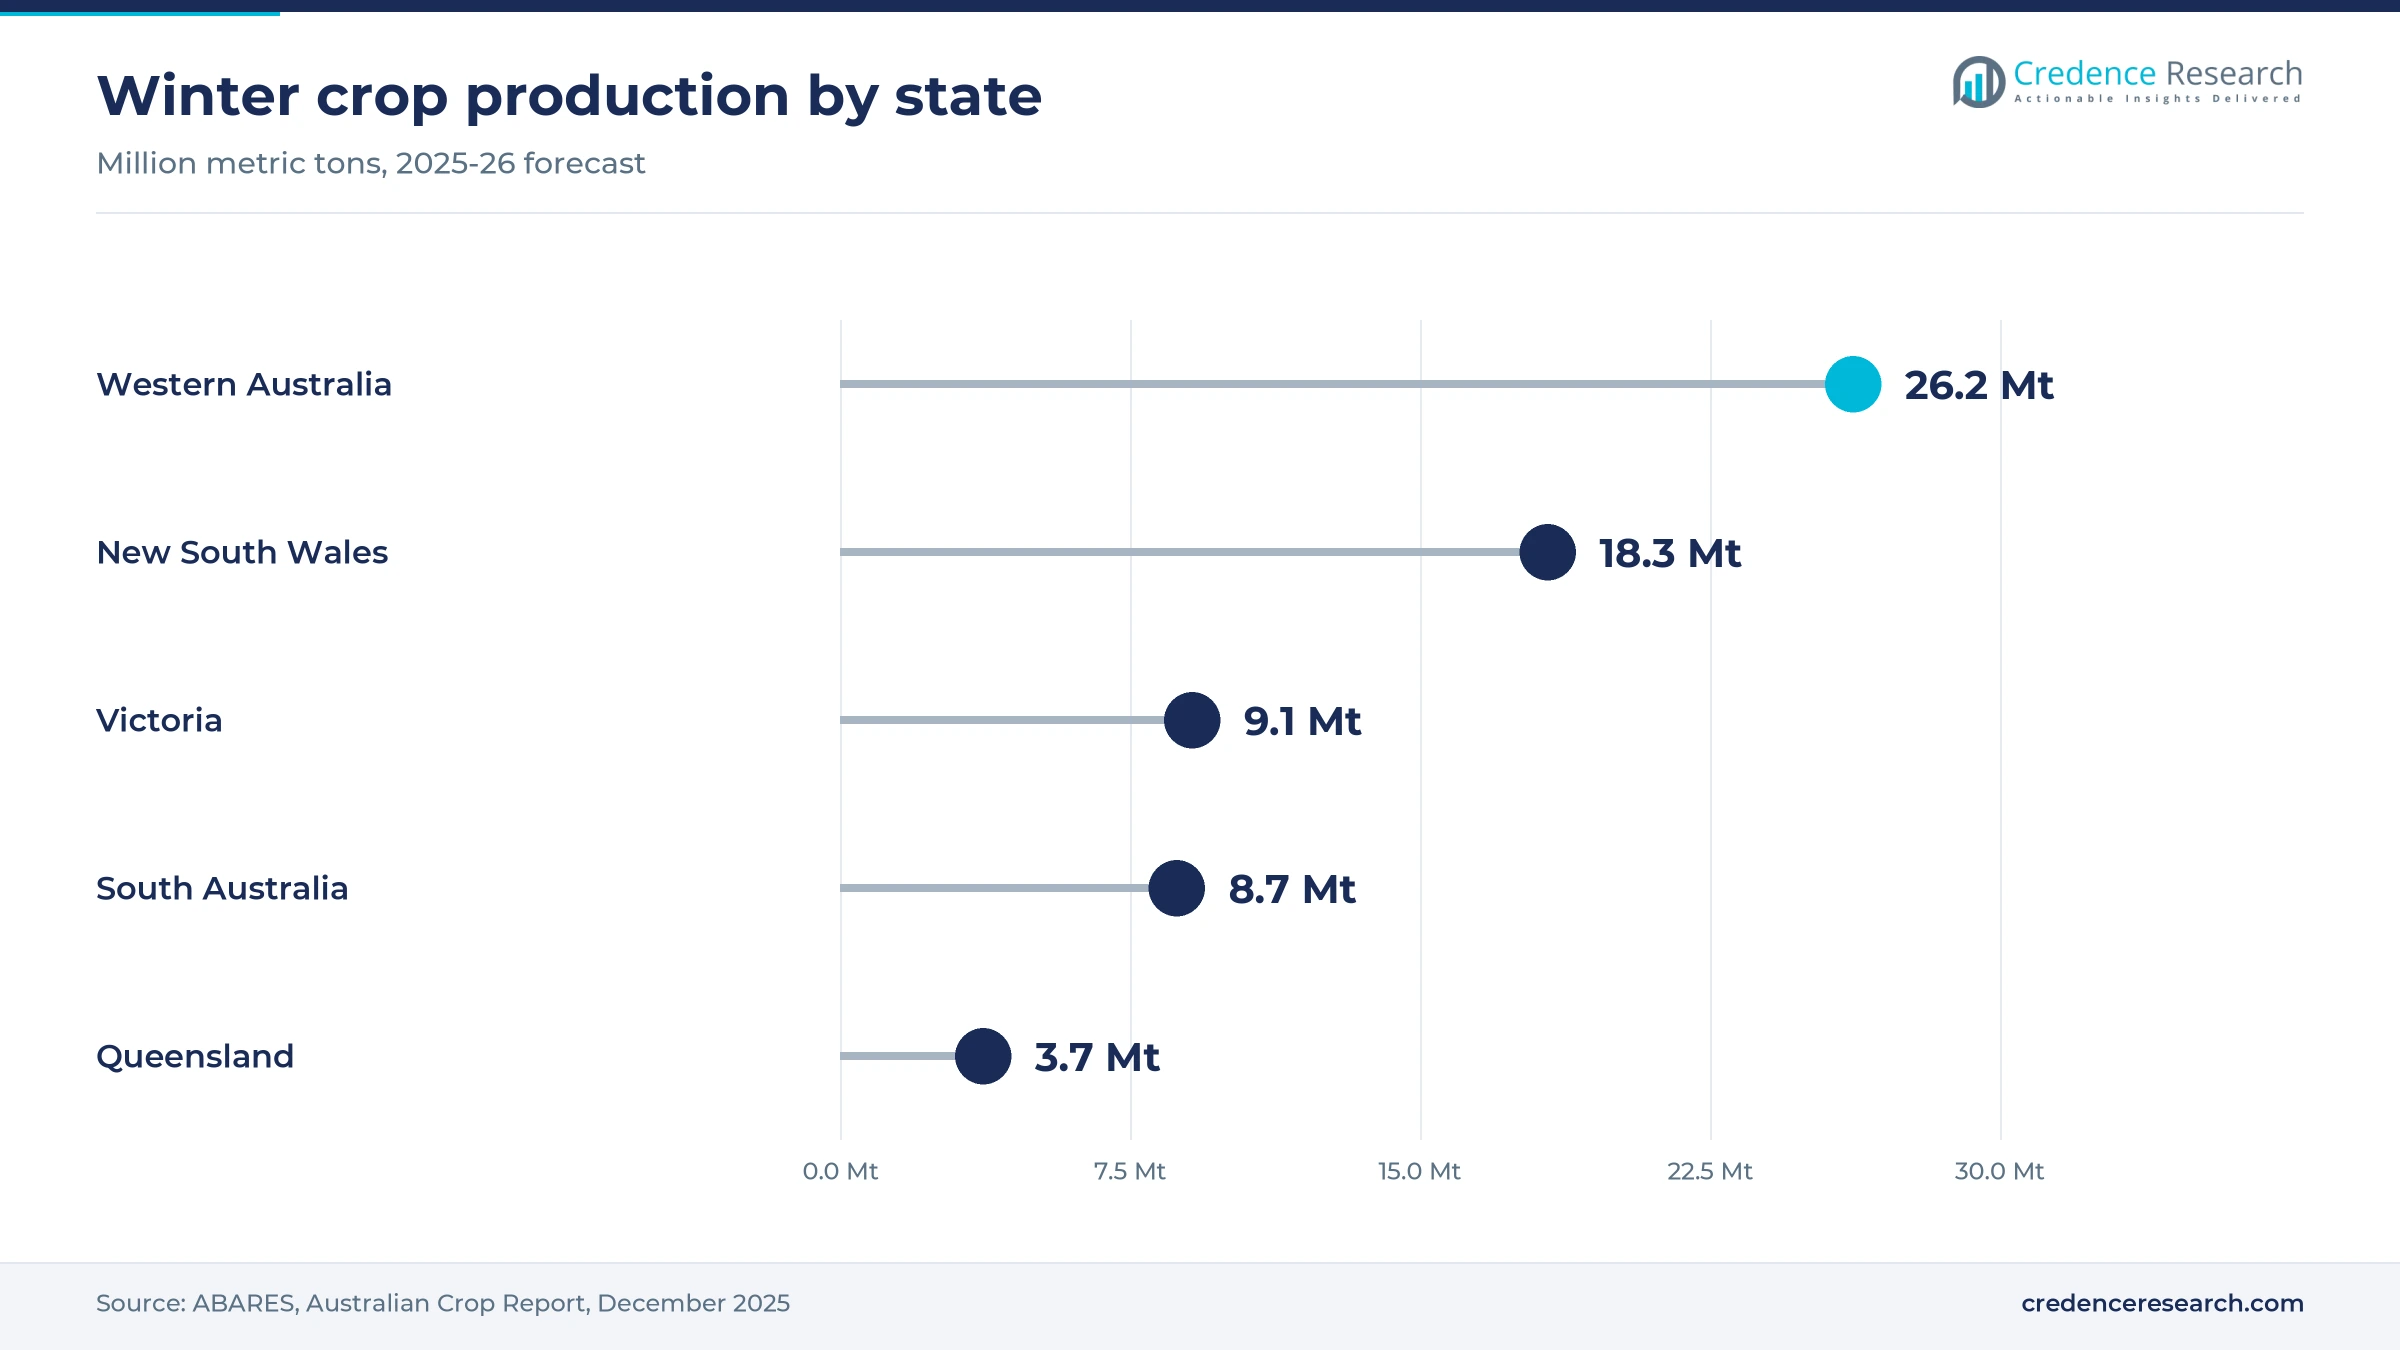
New South Wales and the Australian Capital Territory held a 33.7% regional share of 2025 value and grow at 4.54% a year. The zone combines cropping, beef, horticulture and processing, and ABARES forecast a New South Wales winter crop of 18.3 million metric tons in 2025-26, down 10% after a large prior season. Abbe's purchase of Oji Fibre Solutions' New South Wales corrugated operations adds box capacity for inland growers. The deal also includes a distribution and erecting site in the Sunraysia region, which serves growers on both sides of the state border.
Victoria and Tasmania pair cropping with new box supply
Victoria and Tasmania held a 24.6% regional share of 2025 value and grow at 4.54% a year. ABARES forecast a Victorian winter crop of 9.1 million metric tons in 2025-26, above the prior season, and bagMUSTER began its first phase in rural Victoria in March 2025. Tasmania gained local box supply when Visy opened its Devonport hub for berry and produce growers, breweries and dairy, with federal agriculture minister Julie Collins at the opening. Salmonids rank first among aquaculture species by value, according to the Department of Agriculture, Fisheries and Forestry.
Western Australia and South Australia grow fastest on grain
Western Australia and South Australia held a 21.5% regional share of 2025 value and grow at 5.14% a year, the fastest of the four zones. ABARES forecast a Western Australian winter crop of 26.2 million metric tons for 2025-26, up 14% and the largest of any state, while South Australia rose 63% to 8.7 million metric tons. Large grain volumes lift demand for seed bags, fertilizer sacks and bulk input packs, even though most export grain moves in bulk. This zone therefore gains share as cropping recovers in the south and west.
Queensland and the Northern Territory lean on beef and the north
Queensland and the Northern Territory held a 20.2% regional share of 2025 value and grow at 4.84% a year. ABARES forecast a Queensland winter crop of 3.7 million metric tons for 2025-26, down 1%, so grain packs matter less here than beef and horticulture. Abbe's deal includes a distribution and erecting site in Far North Queensland, which brings carton assembly closer to northern growers and shortens delivery times during harvest peaks.
Mergers and new hubs reshaped supply in 2025 and 2026
| Development | Status and market relevance |
|---|---|
| In March 2025, CropLife Australia and Agsafe launched bagMUSTER in Ballarat, a free take-back program for farm input bags. | Phase one in rural Victoria; national rollout planned |
| In April 2025, Amcor completed its merger with Berry Global, enlarging its flexible and rigid packaging portfolio. | Completed April 30, 2025 |
| In October 2025, Abbe agreed to acquire the Australian corrugated operations of Oji Fibre Solutions in three eastern states. | Completion expected Nov. 1, 2025 |
| In February 2026, Visy opened an 8,500-square-meter packaging hub in Devonport, Tasmania. | Operating; supplies produce growers, breweries and dairy |
| In April 2026, CD&R completed its acquisition of Sealed Air, owner of the Cryovac brand. | Completed; Sealed Air is now privately held |
Barrier films, board punnets and recyclable sacks advance
- Windowed board punnets combine a 240-gram fill with three large viewing windows and ventilation holes, which let berry packers cut plastic sharply in the Detpak design.
- Pooled washable crates replace waxed cartons and polystyrene boxes in the Woolworths produce chain, which removes single-use packaging from each trip.
- Barrier vacuum bags protect chilled beef on long voyages to the United States, China, Japan and South Korea, the four largest export markets in 2025.
- Recycled-resin trays are being introduced by SEE Australia, which plans to move its Australian-made Cryovac tray range to resins made through advanced recycling.
- Logo-marked chemical drums link each container to a participating manufacturer, so drumMUSTER can accept cleaned containers from 1 to 205 liters.
Need a Custom Version of This Report?
Tailor the scope, geography, or segments to your exact requirements.
- Custom geography or segment scope
- Direct access to our analyst team
Fiber, film and crate specialists compete for contracts
Competition splits into fiber box makers, flexible film suppliers, crate poolers and container makers, and few firms cover every pack type. Visy and Abbe compete for produce cartons, and Abbe's purchase of Oji Fibre Solutions' corrugated plants in three eastern states widens its reach to regional packing sheds. Amcor, enlarged by its April 2025 merger with Berry Global, and Sealed Air Australia, owned by CD&R since April 2026, compete in bags, films and trays for meat processors, where shelf life on export voyages matters most. Pact Group competes in rigid formats and through Viscount Reuse, its crate pooling joint venture with Morrison & Co. Rivalry centers on recyclable designs, regional service during harvest peaks and multi-year supply contracts with processors and retailers. Stewardship programs also favor suppliers that can show their packs are collected and reprocessed.
Companies profiled and their roles in this market
| Company | Type | Role in the market |
|---|---|---|
| Visy Industries | Fiber packaging manufacturer | Devonport, Tasmania hub opened Feb. 24, 2026 for berry and produce growers |
| Abbe | Corrugated manufacturer | Agreed in October 2025 to buy Oji Fibre Solutions corrugated operations in Queensland, New South Wales and Victoria |
| Amcor | Flexible and rigid packaging supplier | Australian business within a portfolio enlarged by the Berry Global merger of April 30, 2025 |
| Sealed Air Australia | Protein packaging supplier | Cryovac trays made in Australia; parent acquired by CD&R on April 9, 2026 |
| Pact Group | Rigid packaging and reuse | Woolworths produce crate pool to 2033; Viscount Reuse joint venture with Morrison & Co |
Export protein and produce will set the growth pace
Credence Research's view is that export protein and horticulture will set the pace of growth to 2035, while policy decides which materials win. Record beef output of 2.87 million metric tons in 2025 and horticulture exports of A$3.5 billion show where volume is building. The main risks are input supply, as the 2026 urea disruption showed, and the lack of agreed national packaging rules. Suppliers best placed are those with regional plants, recyclable mono-material designs and links to stewardship schemes such as drumMUSTER and bagMUSTER. Buyers will reward packs that survive long voyages and can be shown to be recovered after use.
How the estimate and its scope were built
The report uses 2025 as the base year, 2026 as the first forecast year and 2035 as the final year. Market values come from the Credence Research model, and segment and regional splits are Credence Research estimates. The scope covers packaging for fresh produce, first-processor meat and seafood, grain, seed and fertilizer, and agricultural chemicals. As a cross-check, horticultural production value, beef output and input volumes were combined with assumed packaging cost ratios, which are analytical assumptions. Sources are ABARES and Hort Innovation statistics, Meat & Livestock Australia data, company filings and announcements, stewardship program data and trade press, all opened during this update. No interviews or surveys were used to build these estimates.
Meat, seafood and flexible formats gain share to 2035
Through 2035, the market should grow steadily as export protein, horticulture and larger grain crops lift pack volumes. First-Processor Meat and Seafood Packaging and Flexible Packs gain the most share, helped by beef exports and barrier formats. Hort Innovation's goal of A$7 billion in horticulture exports by 2031 would add demand for export-grade cartons. National packaging reform, still under discussion in 2026, is likely to favor recyclable fiber and mono-material films. The Australia agricultural packaging market reaches USD 1.01 billion by 2035, with Western Australia and South Australia gaining share as western and southern cropping expands.
Frequently Asked Questions
How big is the Australia agricultural packaging market?
What does the market include?
Which product type leads the market?
Which application grows fastest?
Which region holds the largest share?
How is packaging policy affecting suppliers?
Who are the main companies in the market?
What is the biggest challenge for the market?
Table of Content
Chapter 1 Market Segmentation
- 1.1 Segmentation Framework
- 1.1.1 Product and Service Classification
- 1.1.2 Application and End-Use Classification
- 1.1.3 Technology and Solution Classification
- 1.1.4 Customer and Distribution Channel Classification
- 1.1.5 Geographic Segmentation
- 1.1.6 Market Segment Definitions and Boundaries
- 1.2 By Product Type
- 1.2.1 Fibre Packs
- 1.2.2 Flexible Packs
- 1.2.3 Rigid Containers
- 1.3 By Application
- 1.3.1 Fresh Produce Packaging
- 1.3.2 First-Processor Meat and Seafood Packaging
- 1.3.3 Grain, Seed and Fertiliser Packaging
- 1.3.4 Agri-Chemical Packaging
- 1.4 By Sales Channel
- 1.4.1 Direct Manufacturer Contracts
- 1.4.2 Specialist Packaging Distributors
- 1.4.3 Rural Merchant Networks
Chapter 2 Introduction
- 2.1 Report Objectives and Scope
- 2.2 Product Definition and Industry Terminology
- 2.3 Market Inclusions and Exclusions
- 2.4 Research Process
- 2.4.1 Primary Research and Expert Interviews
- 2.4.2 Secondary Research and Source Review
- 2.4.3 Top-Down and Bottom-Up Estimation
- 2.4.4 Data Triangulation and Verification
- 2.5 Market Size Measurement Basis
- 2.5.1 2025: USD 629.5 million → 2035: USD 1.01 billion
- 2.6 Historical and Forecast Reference Periods
- 2.6.1 Historical Period: 2018-2025
- 2.6.2 Base Year: 2025
- 2.6.3 Forecast Period: 2025-2035
- 2.7 Research Assumptions and Limitations
Chapter 3 Executive Summary
- 3.1 Market Snapshot and Key Findings
- 3.2 Base-Year Market Size, 2025
- 3.3 Forecast Market Size, 2035
- 3.4 Revenue and Volume Growth Outlook
- 3.5 Key Demand and Supply Indicators
- 3.6 Leading Market Segments
- 3.7 Fastest-Growing Market Opportunities
- 3.8 Regional Performance Highlights
- 3.9 Technology and Industry Transformation
- 3.10 Competitive Landscape Summary
- 3.11 Analyst View and Strategic Implications
Chapter 4 Australia Agricultural Packaging Market Trends and Developments
- 4.1 Historical Industry Development, 2018-2025
- 4.2 Recent Market Trends and Developments
- 4.3 Demand and Customer Behavior Trends
- 4.4 Technology and Product Innovation
- 4.5 Artificial Intelligence, Automation and Digitalization
- 4.6 Local Manufacturing and Supply Chain Realignment
- 4.7 Industry Partnerships, Mergers and Acquisitions
- 4.8 Sustainability and Circular Economy Developments
- 4.9 Government and Private Sector Investment Trends
- 4.10 Emerging Business Models and Commercialization
- 4.11 Industry Developments and Announcements
Chapter 5 Australia Agricultural Packaging Market Production, Supply and Demand Analysis
- 5.1 Demand Trend and Consumption Analysis, 2018-2025
- 5.2 Demand Forecast, 2025-2035
- 5.3 Production and Output Trend, 2018-2025
- 5.4 Production and Output Forecast, 2025-2035
- 5.5 Installed Capacity and Capacity Utilization
- 5.6 Company-Wise Production Plants and Statistics
- 5.6.1 Installed Production Capacity
- 5.6.2 Actual Production
- 5.6.3 Planned Capacity and Expansion Targets
- 5.7 Supply Chain Structure and Procurement Trends
- 5.8 Supply-Demand Gap and Bottlenecks
- 5.9 Import Dependence and Sourcing Structure
- 5.10 Contract Manufacturing and Outsourcing
- 5.11 Regional Supply and Demand Concentration
Chapter 6 Australia Agricultural Packaging Market Pricing Analysis
- 6.1 Pricing Structure and Measurement
- 6.2 Historical Pricing Trends, 2018-2025
- 6.3 Pricing Outlook, 2025-2035
- 6.4 Average Selling Price and Unit Economics
- 6.5 Pricing by Product and Market Segment
- 6.6 Geographic Pricing Differences
- 6.7 Key Input, Energy, Labor and Logistics Costs
- 6.8 Contract Pricing and Purchasing Models
- 6.9 Pricing Sensitivity and Competitive Positioning
- 6.10 Price, Margin and Profitability Implications
Chapter 7 Australia Agricultural Packaging Market Dynamics
- 7.1 Market Growth Drivers
- 7.1.1 Demand-Side Drivers
- 7.1.2 Technology and Innovation Drivers
- 7.1.3 Infrastructure and Investment Drivers
- 7.1.4 Regulatory and Policy Drivers
- 7.2 Market Restraints
- 7.2.1 Cost and Affordability Constraints
- 7.2.2 Technology and Adoption Barriers
- 7.2.3 Supply Chain and Operational Constraints
- 7.3 Market Challenges
- 7.3.1 Competitive Pressure and Margin Erosion
- 7.3.2 Skills, Infrastructure and Implementation Gaps
- 7.4 Emerging Market Opportunities
- 7.5 Market Dynamics Impact and Time-Horizon Assessment
Chapter 8 Australia Agricultural Packaging Value Chain Analysis
- 8.1 Industry Value Chain Overview
- 8.2 Upstream Suppliers and Critical Inputs
- 8.3 Technology and Component Providers
- 8.4 Manufacturing or Service Delivery
- 8.5 Distribution, Channel Partners and Integrators
- 8.6 Downstream Applications and End Users
- 8.7 Value Addition and Profit Pools
- 8.8 Vertical Integration and Outsourcing
- 8.9 Supplier Concentration and Risk
- 8.10 Supply Chain Localization and Resilience
Chapter 9 Australia Agricultural Packaging Market Regulations and Policies
- 9.1 Relevant Laws, Standards and Compliance Frameworks
- 9.2 Product, Service, Safety and Quality Requirements
- 9.3 Government Policies, Incentives and Subsidies
- 9.4 Imports, Exports and Trade Barriers
- 9.5 Public Procurement and Local Content Requirements
- 9.6 Environmental and Sustainability Compliance
- 9.7 Upcoming Policy Changes and Market Implications
Chapter 10 Australia Agricultural Packaging Market Hotspots and Opportunities
- 10.1 Market Opportunity Mapping and Growth Hotspots
- 10.2 High-Growth Applications and Customer Groups
- 10.3 Underserved Markets and White-Space Opportunities
- 10.4 Emerging Technology and Product Opportunities
- 10.5 New Capacity and Investment Hotspots
- 10.6 Market Entry and Expansion Opportunities
- 10.7 Distribution and Partnership Opportunities
- 10.8 Near-Term and Long-Term Commercial Potential
- 10.9 Opportunity Attractiveness and Execution Risks
Chapter 11 Australia Agricultural Packaging Market Outlook, 2025-2035
- 11.1 Market Size and Analysis
- 11.1.1 Revenue (Market Measurement: 2025: USD 629.5 million → 2035: USD 1.01 billion)
- 11.1.2 Market Volume and Quantity Sold
- 11.1.3 Historical Market Size, 2018-2025
- 11.1.4 Base-Year Market Size, 2025
- 11.2 Market Forecast, 2025-2035
- 11.2.1 Revenue Forecast to 2035
- 11.2.2 Volume Forecast to 2035
- 11.2.3 CAGR and Year-on-Year Growth
- 11.2.4 Incremental Revenue Opportunity
- 11.3 Forecast Assumptions and Scenario Analysis
- 11.3.1 Base-Case Forecast
- 11.3.2 Optimistic and Conservative Scenarios
- 11.3.3 Technology, Pricing and Policy Sensitivities
- 11.4 Market Attractiveness and Growth Outlook
Chapter 12 Australia Agricultural Packaging Market Segmentation and Outlook
- 12.1 Segmentation Summary and Market Shares, 2025
- 12.2 Largest and Fastest-Growing Segments
- 12.3 By Product Type - Market Size and Forecast, 2025-2035
- 12.3.1 Segment Definition and Scope
- 12.3.2 Historical Market Size, 2018-2025
- 12.3.3 Revenue Forecast, 2025-2035
- 12.3.4 Volume Forecast, 2025-2035
- 12.3.5 Base-Year Market Share, 2025
- 12.3.6 Segment CAGR and Growth Drivers
- 12.3.7 Subsegment Market Size and Forecast
- 12.3.7.1 Fibre Packs
- 12.3.7.2 Flexible Packs
- 12.3.7.3 Rigid Containers
- 12.3.8 Subsegment Pricing and Adoption Trends
- 12.3.9 Leading Suppliers and Competition
- 12.3.10 Regional Demand and Opportunities
- 12.4 By Application - Market Size and Forecast, 2025-2035
- 12.4.1 Segment Definition and Scope
- 12.4.2 Historical Market Size, 2018-2025
- 12.4.3 Revenue Forecast, 2025-2035
- 12.4.4 Volume Forecast, 2025-2035
- 12.4.5 Base-Year Market Share, 2025
- 12.4.6 Segment CAGR and Growth Drivers
- 12.4.7 Subsegment Market Size and Forecast
- 12.4.7.1 Fresh Produce Packaging
- 12.4.7.2 First-Processor Meat and Seafood Packaging
- 12.4.7.3 Grain, Seed and Fertiliser Packaging
- 12.4.7.4 Agri-Chemical Packaging
- 12.4.8 Subsegment Pricing and Adoption Trends
- 12.4.9 Leading Suppliers and Competition
- 12.4.10 Regional Demand and Opportunities
- 12.5 By Sales Channel - Market Size and Forecast, 2025-2035
- 12.5.1 Segment Definition and Scope
- 12.5.2 Historical Market Size, 2018-2025
- 12.5.3 Revenue Forecast, 2025-2035
- 12.5.4 Volume Forecast, 2025-2035
- 12.5.5 Base-Year Market Share, 2025
- 12.5.6 Segment CAGR and Growth Drivers
- 12.5.7 Subsegment Market Size and Forecast
- 12.5.7.1 Direct Manufacturer Contracts
- 12.5.7.2 Specialist Packaging Distributors
- 12.5.7.3 Rural Merchant Networks
- 12.5.8 Subsegment Pricing and Adoption Trends
- 12.5.9 Leading Suppliers and Competition
- 12.5.10 Regional Demand and Opportunities
- 12.6 Segment Growth Comparison
- 12.7 Segment Attractiveness and Priority Matrix
Chapter 13 Australia Agricultural Packaging End-Use and Application Market Outlook
- 13.1 End-Use Industry and Customer Demand Structure
- 13.2 Leading Applications and Customer Groups
- 13.3 End-Use Market Size, Share and Forecast
- 13.4 Major End-Use Industry Deep Dives
- 13.4.1 Customer Requirements and Use Cases
- 13.4.2 Demand and Replacement Cycles
- 13.4.3 Technical and Regulatory Considerations
- 13.4.4 Purchasing and Procurement Models
- 13.4.5 Leading Vendors and Distribution Channels
- 13.4.6 Forecast and Commercial Opportunities
- 13.5 Emerging Applications and Cross-Segment Demand
- 13.6 End-Use Industry Investment Priorities
Chapter 14 Australia Agricultural Packaging Geographic Market Outlook, 2025-2035
- 14.1 Domestic Market Distribution and Demand Clusters
- 14.2 State- or Province-Wise Market Size and Forecast, 2025-2035
- 14.3 City and Metropolitan Market Outlook
- 14.4 Industrial, Manufacturing and Commercial Clusters
- 14.5 Geographic Concentration of Key End Users
- 14.6 Local Pricing and Purchasing Differences
- 14.7 Domestic Production Facilities and Capacity Map
- 14.8 Local Infrastructure and Project Pipeline
- 14.9 State-Level Policy and Incentive Differences
- 14.10 Subnational Investment Hotspots and Opportunities
- 14.11 Distribution and Logistics Networks
- 14.12 Domestic Competitive Footprint
Chapter 15 Australia Agricultural Packaging Technology, Innovation and Sustainability Outlook
- 15.1 Technology Landscape and Maturity
- 15.2 Product, Process and Service Innovation
- 15.3 AI, Automation and Digital Tools in the Industry
- 15.4 Technology Adoption and Performance Benchmarking
- 15.5 Innovation Pipeline and R&D Investment
- 15.6 Patent and Intellectual Property Trends
- 15.7 Energy Efficiency and Resource Management
- 15.8 Sustainability, Recycling and Circularity
- 15.9 Technology Roadmap, 2025-2035
- 15.10 Risks of Obsolescence and Technology Substitution
Chapter 16 Australia Agricultural Packaging Market Key Strategic Imperatives
- 16.1 Growth and Market Entry Priorities
- 16.2 High-Return Products and Segments
- 16.3 Pricing, Profitability and Cost Optimization
- 16.4 Technology Investment and Product Differentiation
- 16.5 Supply Chain Localization and Resilience
- 16.6 Distribution and Customer Acquisition
- 16.7 Partnership, Acquisition and Capacity Strategy
- 16.8 Regional Expansion Priorities
- 16.9 Short-, Medium- and Long-Term Actions
Chapter 17 Competition Outlook
- 17.1 Industry Competition Characteristics
- 17.2 Market Structure and Concentration
- 17.3 Market Share and Competitive Positioning, 2025
- 17.4 Company-Wise Revenue and Product Benchmarking
- 17.5 Production and Service Capacity Benchmarking
- 17.6 Technology, Pricing and Differentiation
- 17.7 Regional Footprint and Distribution Strength
- 17.8 Mergers, Acquisitions and Strategic Alliances
- 17.9 New Entrants and Competitive Threats
- 17.10 Porter's Five Forces and Industry Attractiveness
- 17.11 Competitive Outlook, 2025-2035
Chapter 18 Company Profiles
- 18.1 Company Coverage and Selection Criteria
- 18.2 Amcor
- 18.2.1 Business Description
- 18.2.2 Company Ownership and Geographic Presence
- 18.2.3 Product and Service Portfolio
- 18.2.4 Manufacturing and Operating Footprint
- 18.2.5 Production Capacity and Expansion Plans
- 18.2.6 Financial Performance and Investment
- 18.2.7 Market Share and Competitive Position
- 18.2.8 Technology and Innovation Capabilities
- 18.2.9 Strategic Alliances or Partnerships
- 18.2.10 Recent Developments
- 18.2.11 Growth Strategy and Outlook
- 18.3 Visy Industries
- 18.4 Sealed Air Australia
- 18.5 Pact Group
- 18.6 Abbe
- 18.7 Other Relevant Market Participants
Note: Every listed company is profiled on the structure shown under the first company. The company list is preliminary and may change based on research findings, market developments, data availability and client requirements.
Chapter 19 Disclaimer
- 19.1 Research and Forecast Disclaimer
- 19.2 Data Source and Estimation Limitations
Note: The depth of individual sections depends on data availability for this market. Volume, capacity, trade and other unit-based metrics are included where applicable.

