Graded slabs have become the currency of the card hobby
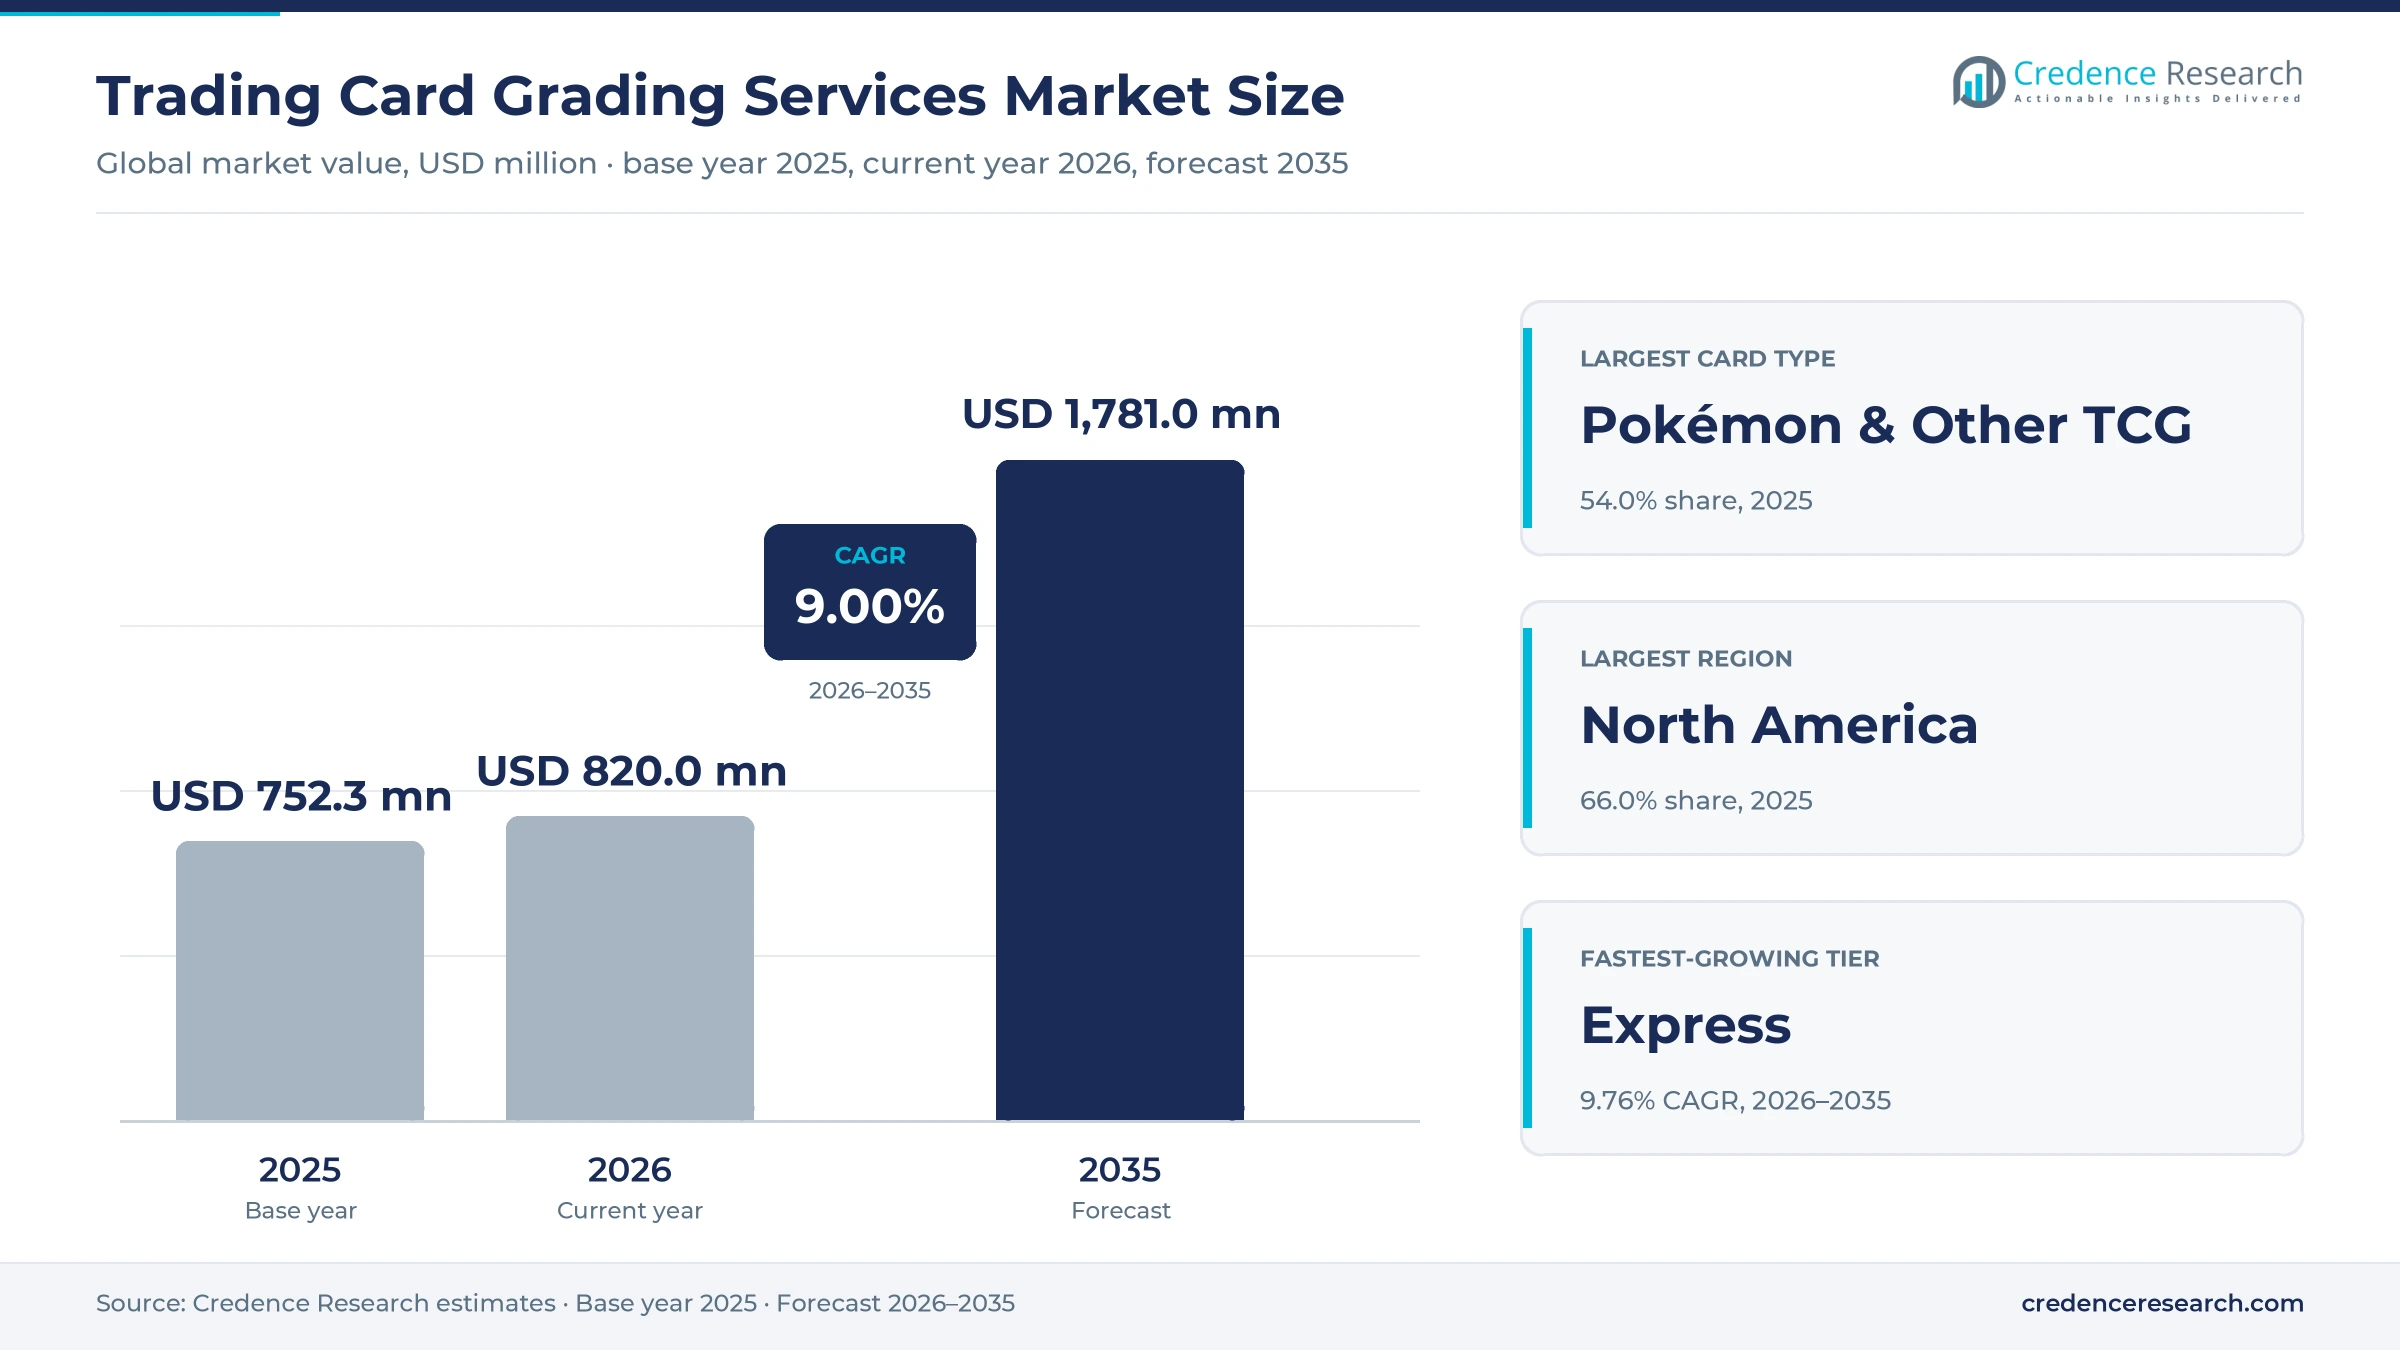
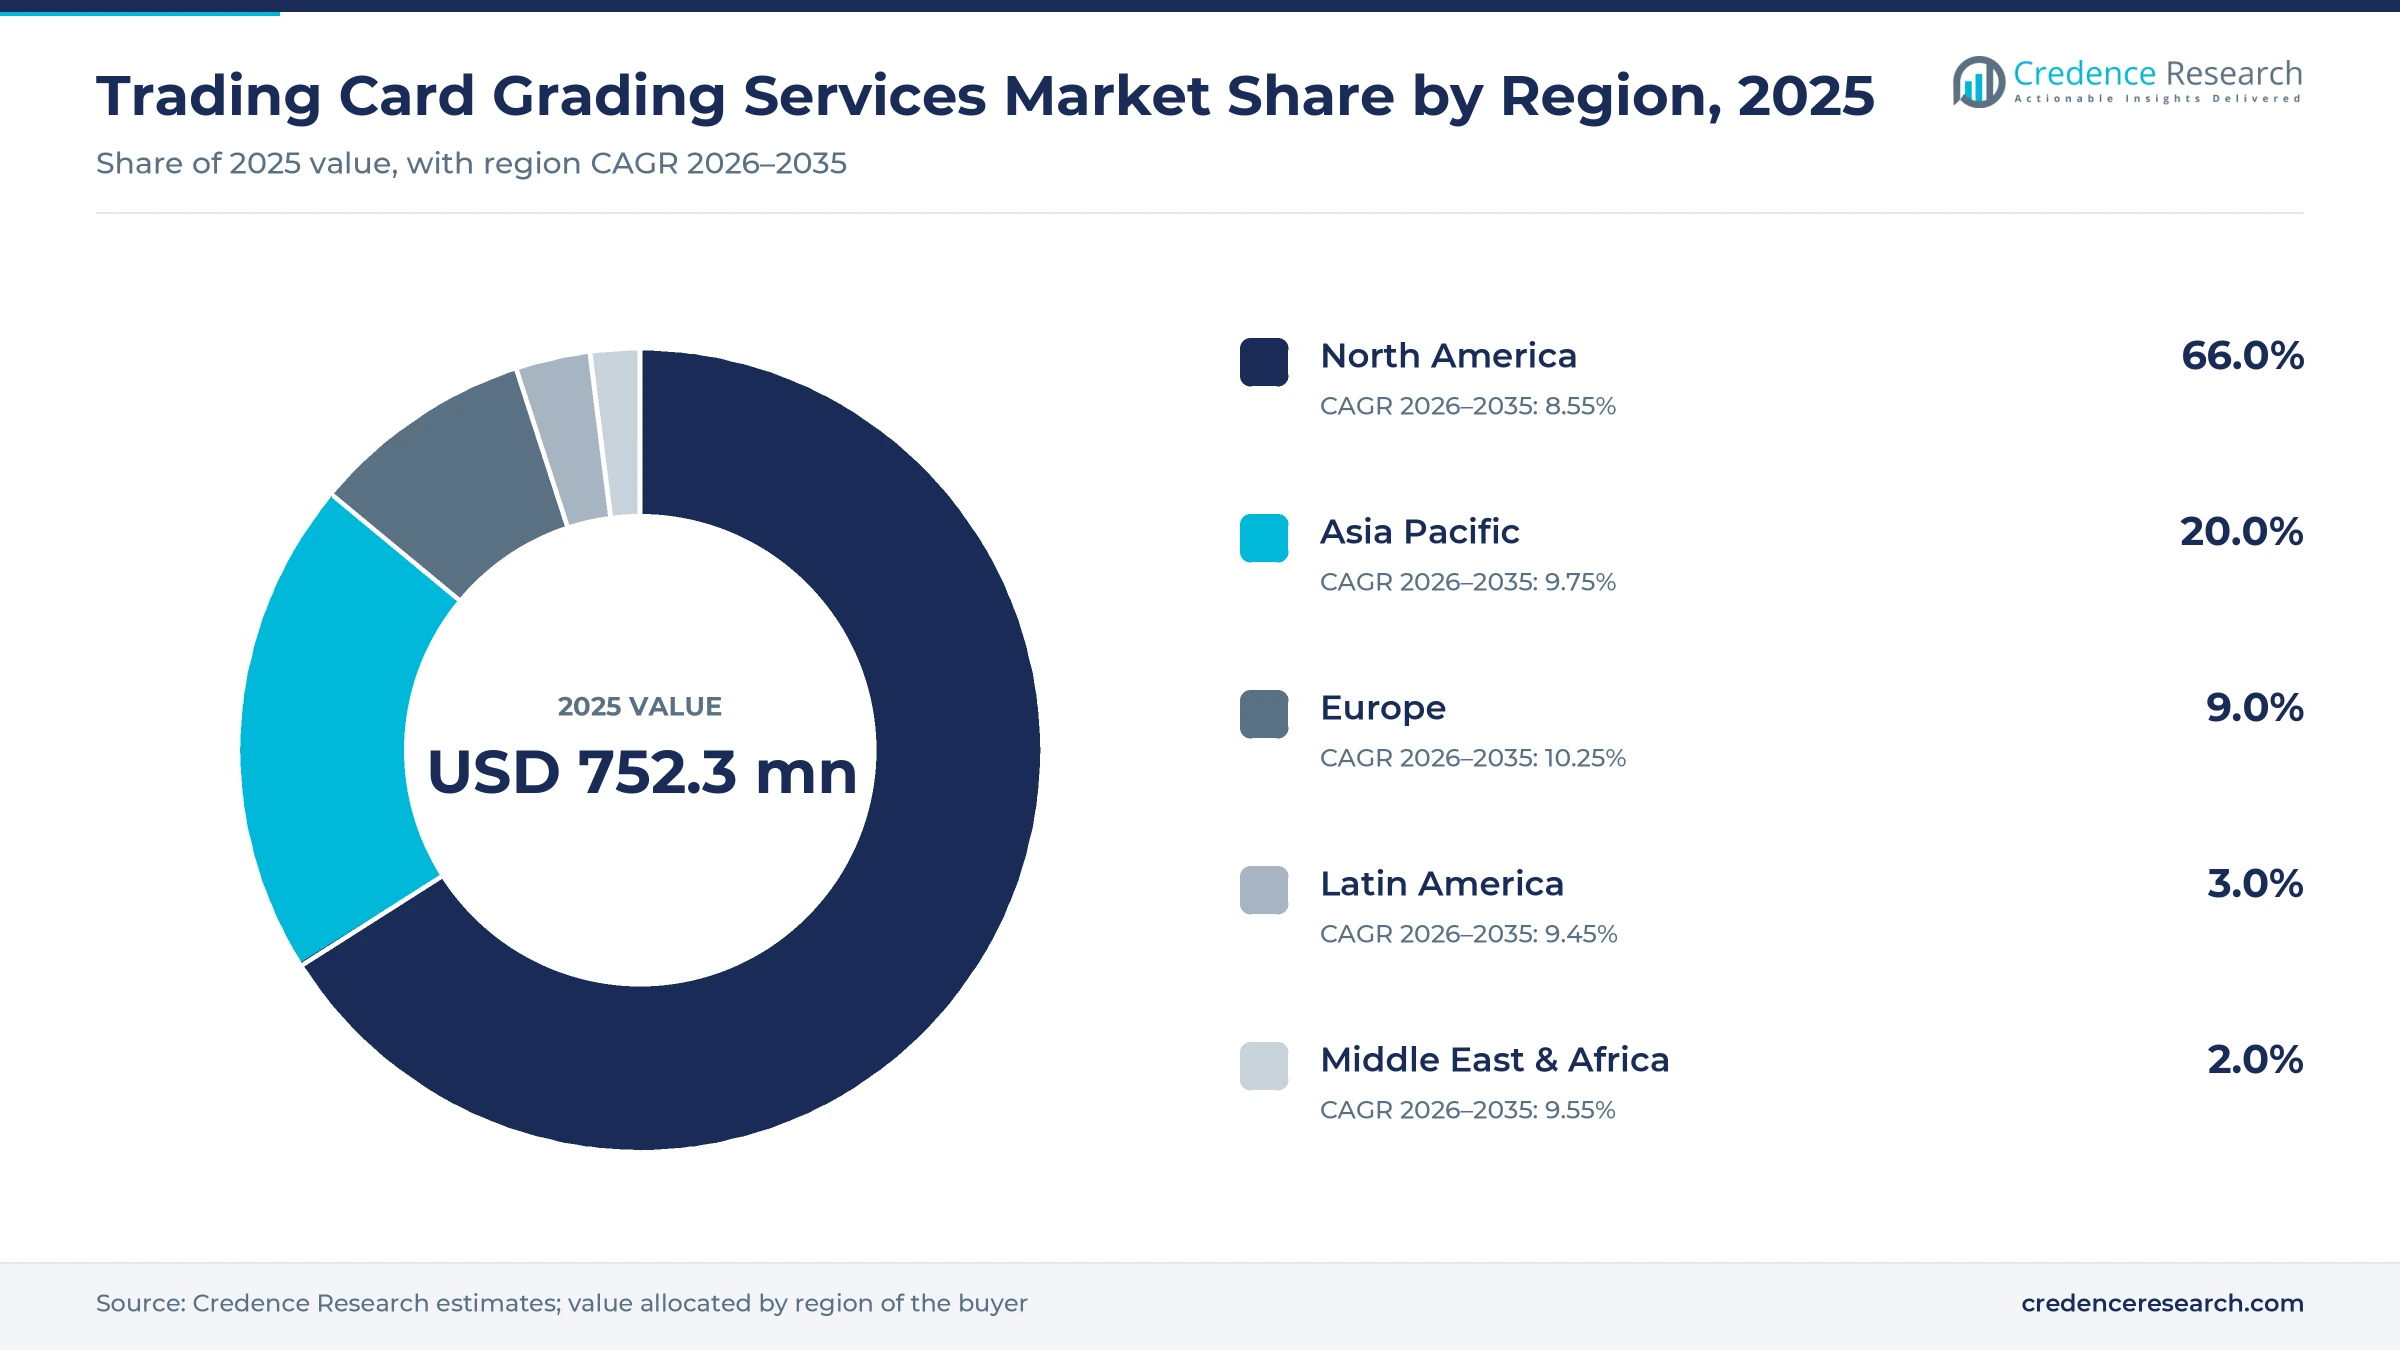
The global trading card grading services market was valued at USD 752.3 million in 2025 and is projected to increase from USD 820.0 million in 2026 to USD 1.78 billion by 2035, registering a CAGR of 9.00% during 2026–2035. Demand comes from hobby collectors, dealers, breakers and retailers who pay independent graders to authenticate a card, score its condition and seal it in a tamper-evident holder before resale. North America held the largest regional share, 66.0% in 2025, because the largest graders run their main facilities in the United States and most graded cards trade through U.S. auction houses and marketplaces. Europe is the fastest-growing region at 10.25% a year as graders open labs inside the region and cut shipping time for collectors there. A major commercial change came in 2026, when the leading grader paused its lowest-cost tiers for five months to clear a backlog of more than 10 million cards. Pokémon cards now generate more submissions than all sports combined.
Which fees count when a collector pays to slab a card?
The trading card grading services market covers fees that independent companies charge to authenticate trading cards, assign a condition grade, encapsulate the card in a sealed holder and record it in a public population report. It includes sports, Pokémon and other trading card game cards and non-sport entertainment cards. Buyers pay per card by service tier, with turnaround time and declared value setting the price.
The scope excludes card manufacturing, the sale of graded cards, auction commissions, vault storage fees and memberships sold without grading. Value is counted at the grader level, including fees collected through retail partners and event submission desks, and add-on fees such as crossover review, autograph authentication and reholdering.
Trading Card Grading Services Market Insights
- The market is valued at USD 752.3 million in 2025 and is projected to reach USD 1.78 billion by 2035, growing at a 9.00% CAGR as graded cards become the default format for resale.
- North America led with 66.0% of 2025 value, while Europe grows fastest at 10.25% a year as graders open labs in Germany and the U.K.
- Pokémon & Other TCG held 54.0% of 2025 value, and major graders handled more than 16.1 million Pokémon cards in 2025, according to GemRate.
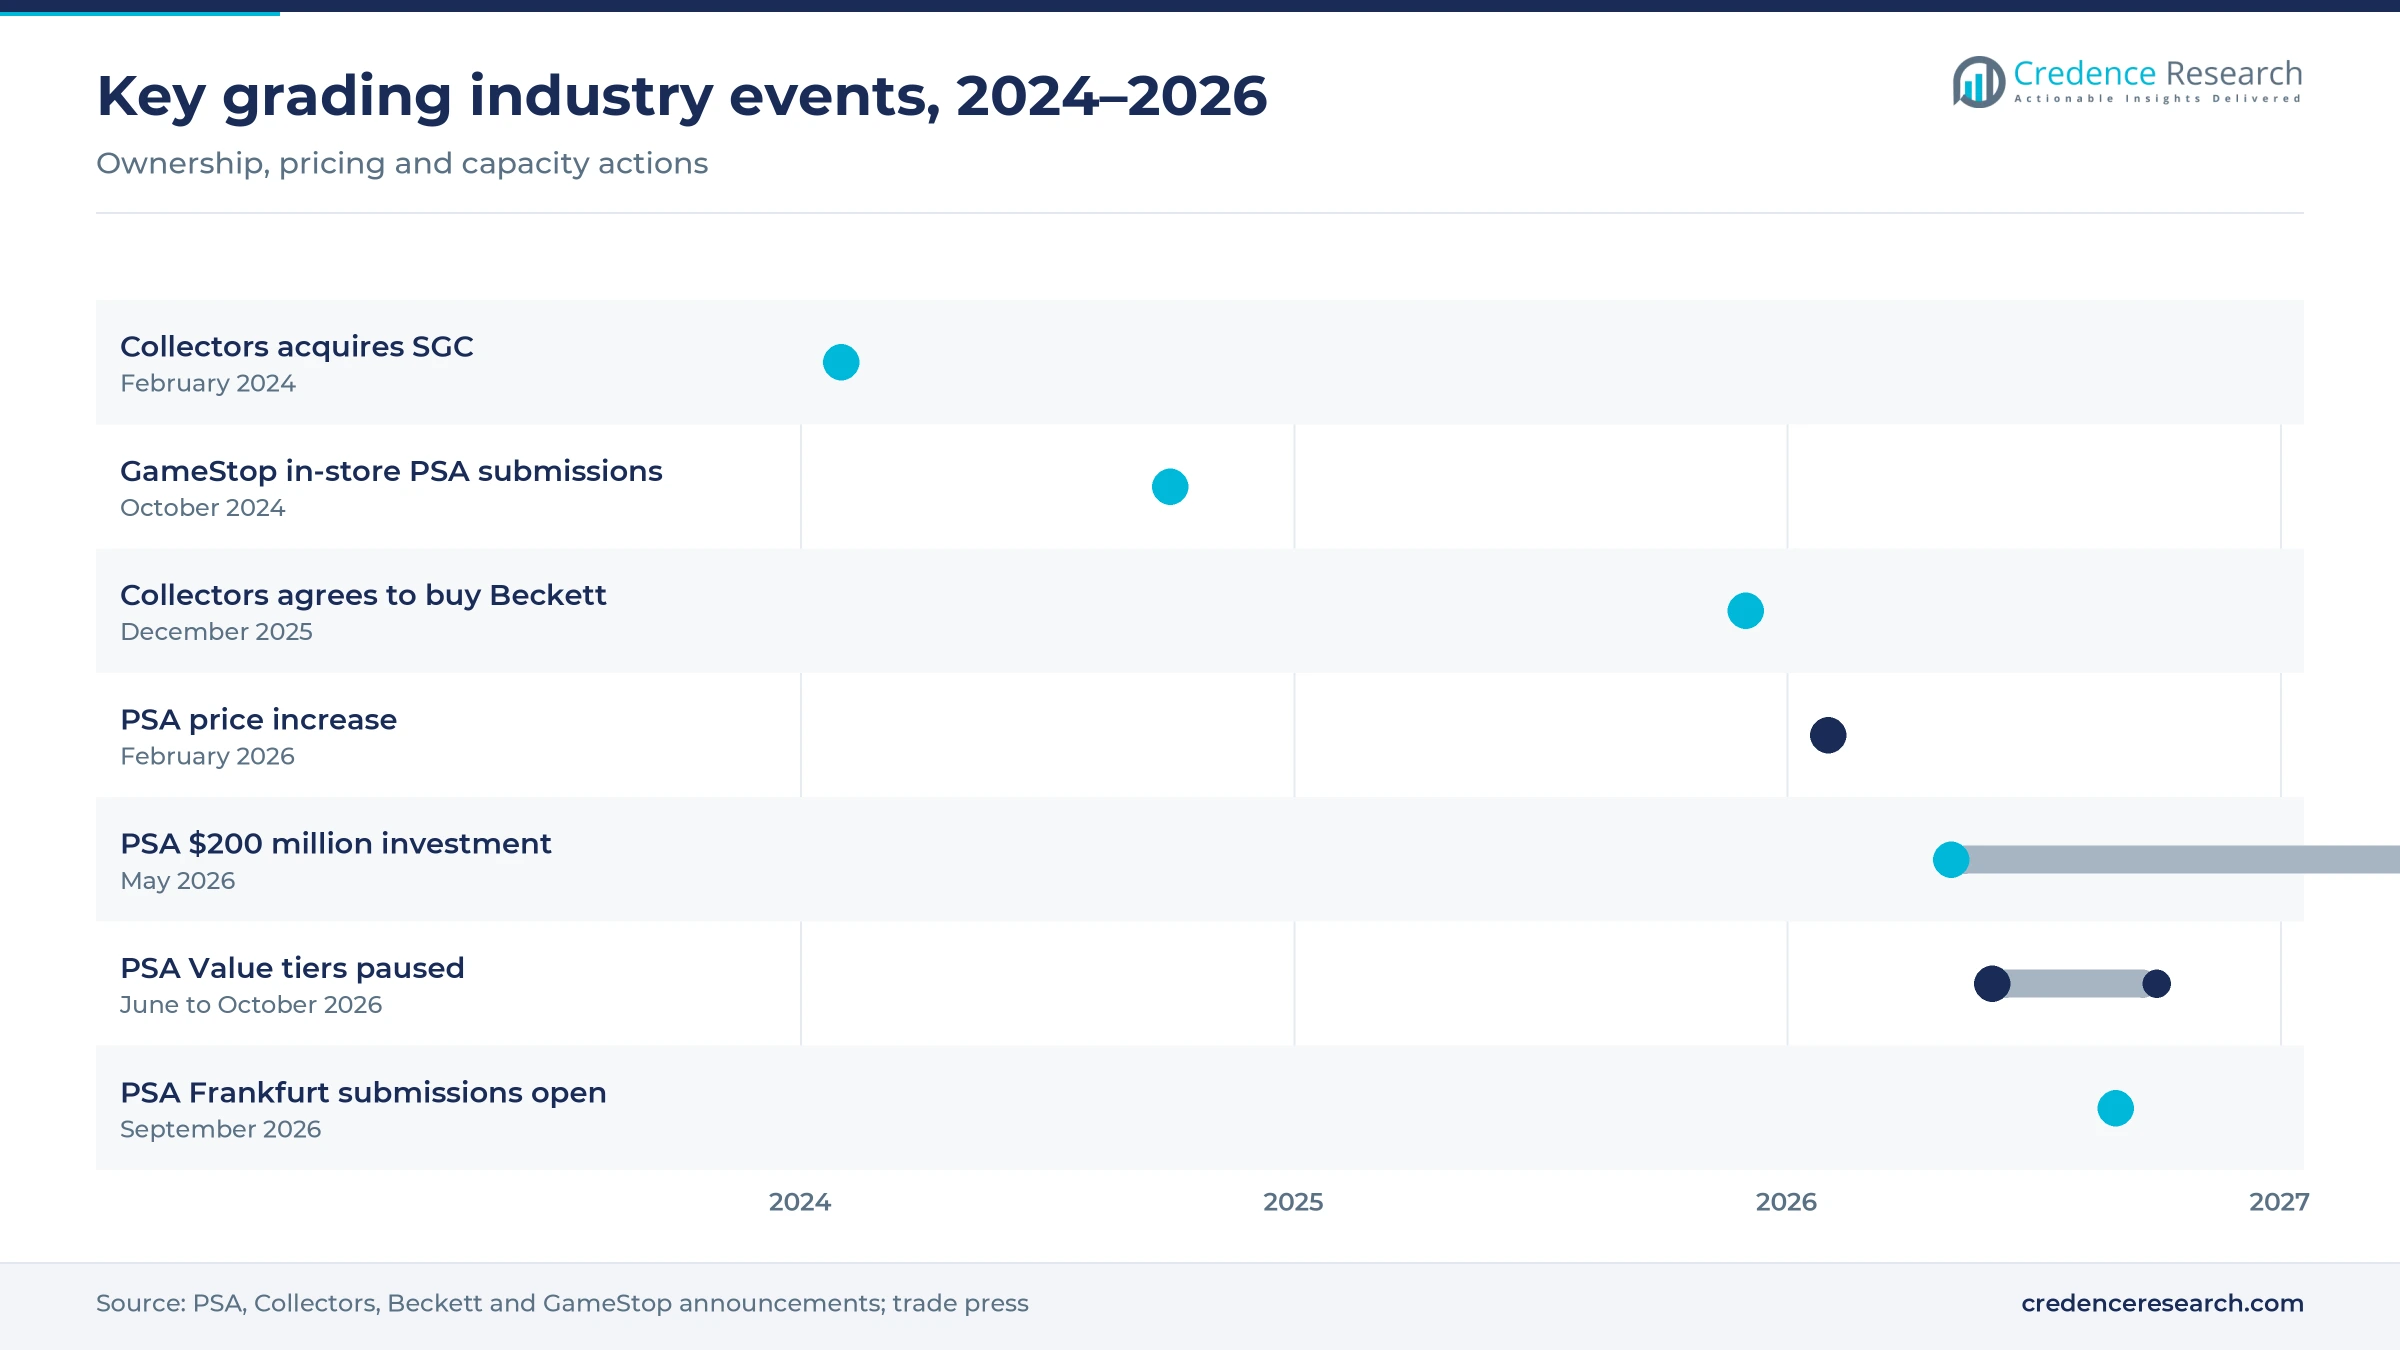
- PSA reopened its Value tier on Oct. 29, 2026 at $39.99 per card after a five-month pause caused by a backlog that peaked near 14 million cards.
- Collectors, the owner of PSA, bought SGC in February 2024 and agreed to buy Beckett on Dec. 15, 2025, leaving CGC and TAG as the main independent rivals.
Pokémon cards and economy tiers carry most grading value
Why do Pokémon and other TCG cards lead grading value?
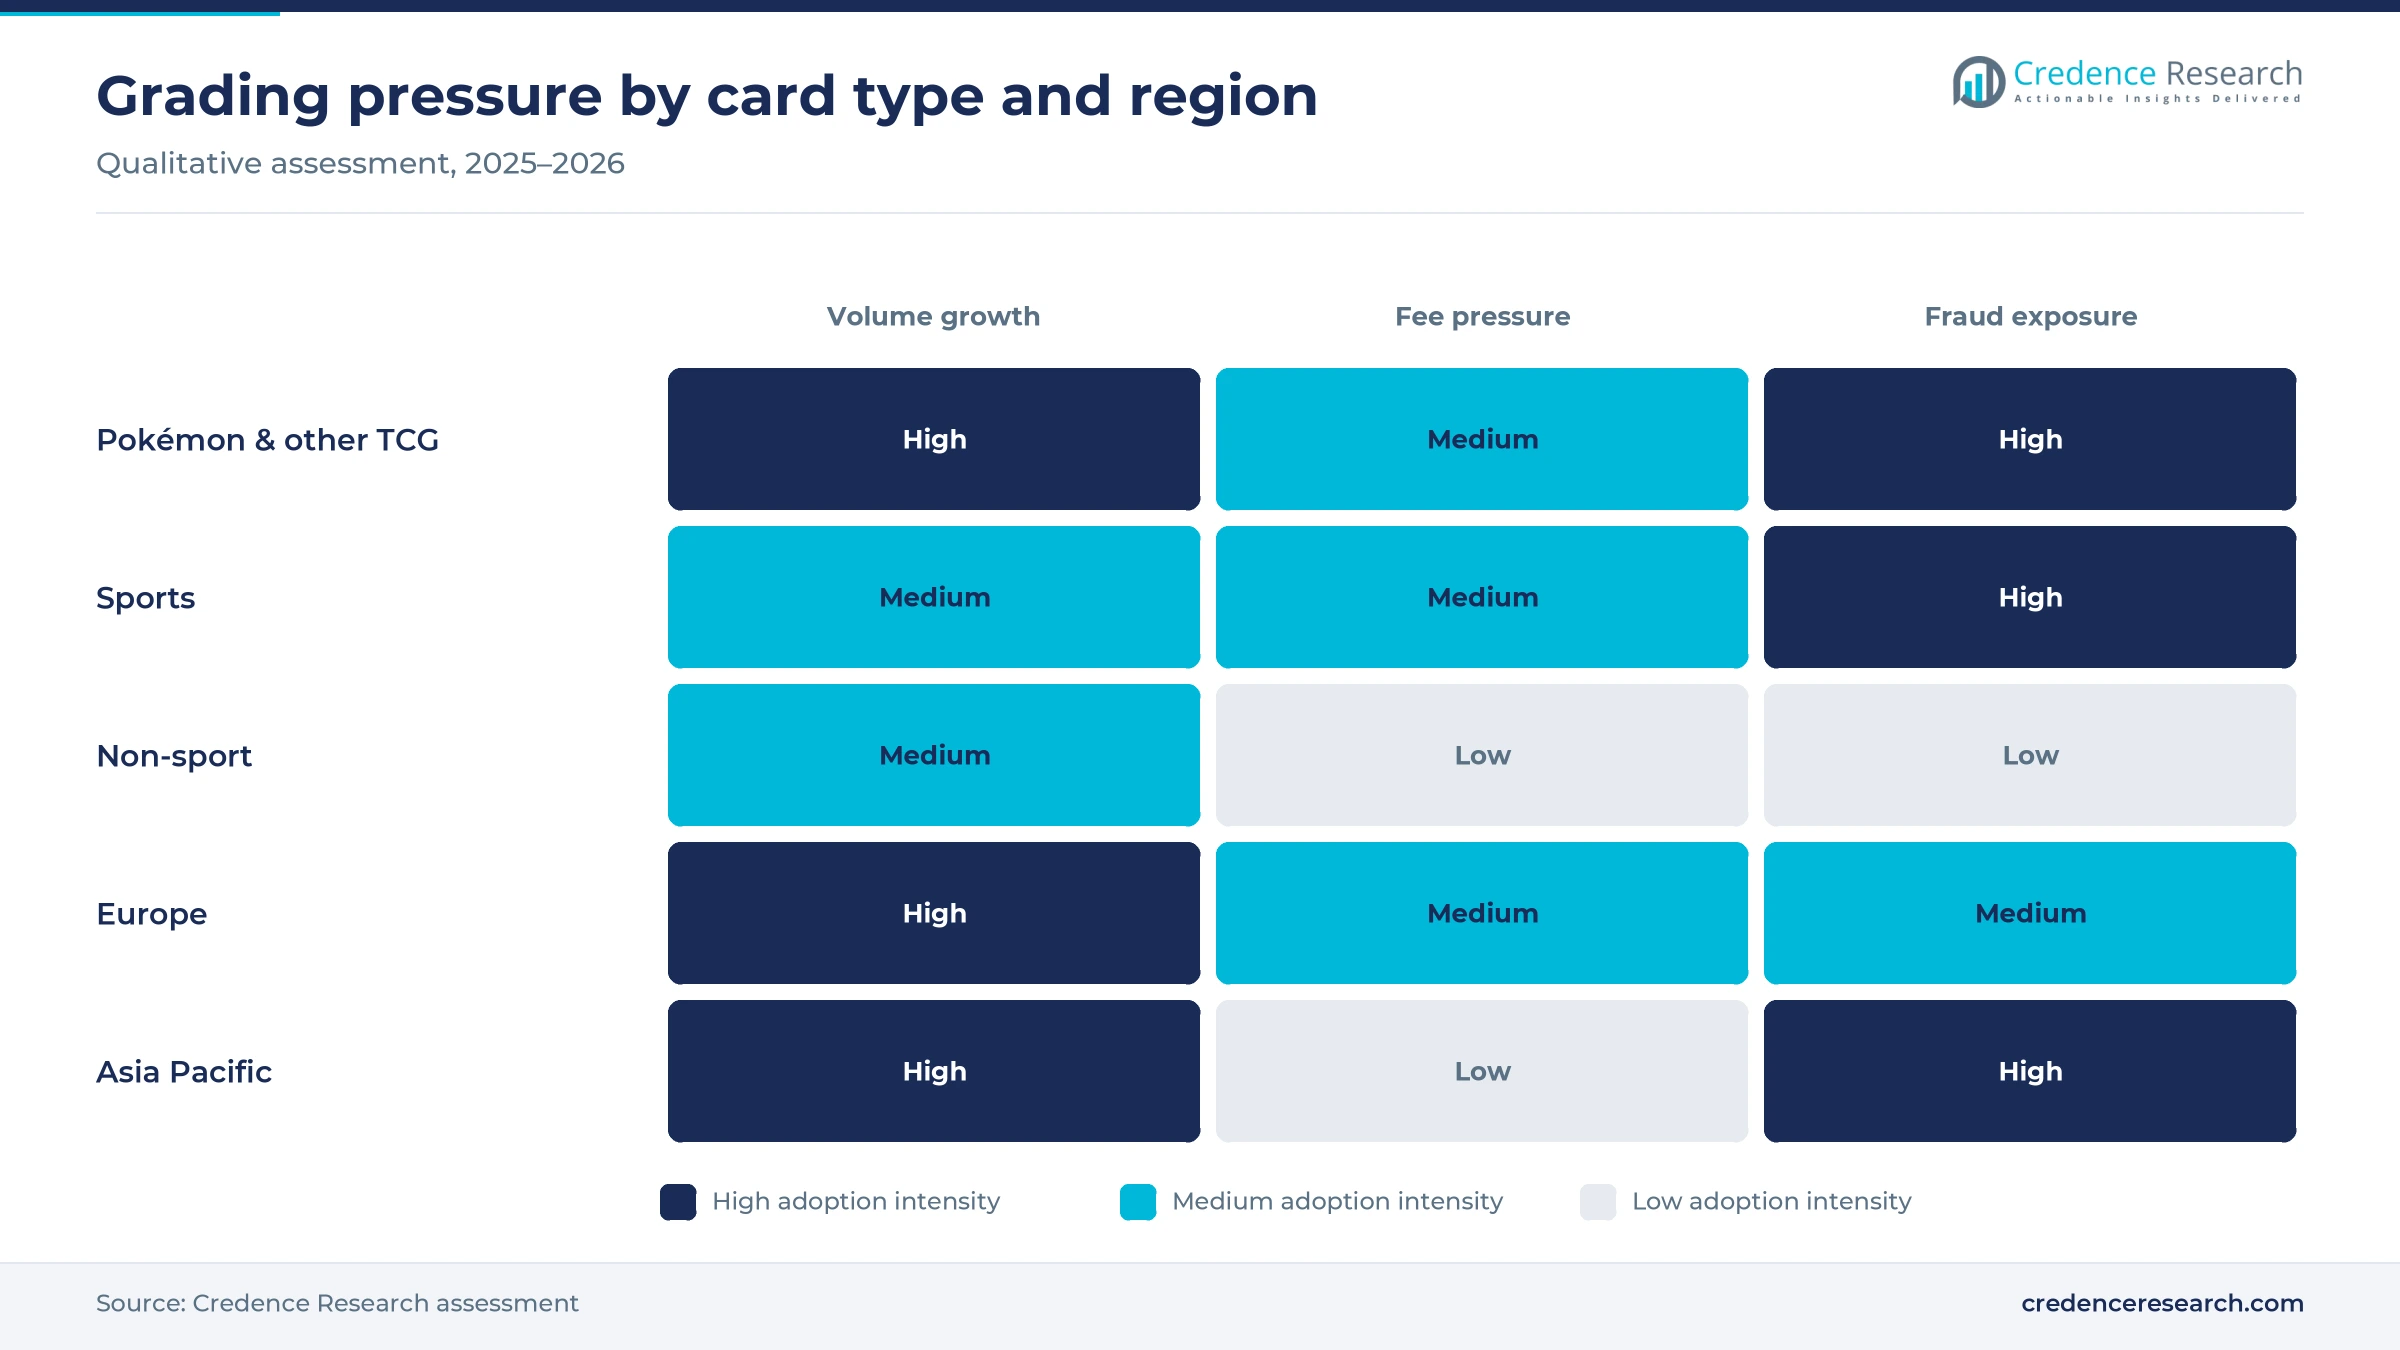
Based on card type, the market is categorized into sports, Pokémon and other TCG, and non-sport cards. Pokémon & Other TCG led with 54.0% of 2025 value because TCG volume now outpaces sports. Major graders handled 16.8 million TCG and non-sport cards in 2025 against 10 million sports cards, with Pokémon alone above 16.1 million, according to GemRate data reported by Cllct. Pokémon & Other TCG also grows fastest at 9.57% a year as print runs widen the base of gradable cards. The Pokémon Company produced about 10 billion cards in the year to March 31, 2026, according to PokeGuardian.
Why do economy tiers lead while express grows fastest?
Based on service tier, the market is categorized into economy, express and premium. Economy led with 58.0% of 2025 value because most submissions are modern cards worth less than a few hundred dollars. GameStop in-store grading starts at $15.99 for TCG cards declared at $200 or less, and TAG X launched at $12 per card. Express grows fastest at 9.76% a year as economy capacity tightens. PSA paused its Value tiers in June 2026, and Beckett paused its Base and Standard tiers on Aug. 5, 2026, according to Sports Collectors Daily.
Why does online direct submission lead the channel mix?
Based on submission channel, the market is categorized into online direct, retail partner and event and dealer channels. Online Direct led with 64.0% of 2025 value because the largest graders take orders through web portals and apps, and PSA added a card scanner linked to mobile submission. Retail Partner grows fastest at 9.95% a year as stores remove order minimums. The GameStop and PSA partnership passed 1 million graded cards in May 2025, according to Cllct, after in-store drop-off began in October 2024.
| Segment Group | Leading Sub-segment | Share, 2025 | Fastest-growing Sub-segment | CAGR, 2026–2035 |
|---|---|---|---|---|
| By Card Type | Pokémon & Other TCG | 54.0% | Pokémon & Other TCG | 9.57% |
| By Service Tier | Economy | 58.0% | Express | 9.76% |
| By Submission Channel | Online Direct | 64.0% | Retail Partner | 9.95% |
Request a Free Sample
Fill in your details and we'll send you a free sample report.
- Sample data tables & charts
- Research methodology
Collector numbers, fraud risk and apps drive submissions
Collectibles participation raises demand for grading
Wider participation in card collecting raises the number of cards that owners want authenticated before they sell, trade or store them. Major graders handled about 20 million cards in 2024, up 16% from 17 million in 2023, according to Sports Illustrated, and the total reached 26.6 million in 2025. In Japan, the domestic trading card market reached about 338 billion yen in the 2025 financial year, up from 88 billion yen in 2017, according to the Japan Toy Association figures cited by SCMP. Pokémon card values rose 100.4% in 2025 through Dec. 19, according to Card Ladder, drawing new buyers into the wider collectibles hobby. In the Credence Research model this adds about 3.33 percentage points to annual growth to 2035.
Authentication improves resale confidence and pricing
Independent authentication gives buyers a trusted record of identity and condition, which narrows price gaps and supports larger sales. A PSA 10 Pikachu Illustrator sold for $16,492,000 at Goldin on Feb. 16, 2026, a sale recognized by Guinness World Records as the most expensive Pokémon card ever sold. PSA reported intercepting more than $200 million in fake and altered cards in its May 2026 fraud report, with counterfeit submissions up 45.3% from a year earlier. PSA also runs the eBay Authenticity Guarantee program and controls the eBay vault, according to Cllct. In the Credence Research model this adds about 2.43 percentage points to annual growth to 2035.
Online submission channels broaden access to grading
Online and app-based submission lets collectors send cards without dealers or show visits, which brings first-time submitters into the market. U.S. retail e-commerce reached $340.2 billion in the second quarter of 2026, or 17.1% of total retail sales, according to the U.S. Census Bureau release of Aug. 18, 2026. PSA added a card scanner to its app that links identification with mobile submission, according to Cllct. GameStop accepts single cards with no form, minimum or membership, and its PSA program passed 1 million graded cards in May 2025. In the Credence Research model this adds about 1.80 percentage points to annual growth to 2035.
Capacity investment lifts grading throughput
New grading capacity converts waiting demand into completed orders, because backlogs have capped revenue in peak years. PSA announced a $200 million infrastructure investment over 18 months on May 14, 2026, adding to $100 million spent since 2021. The company said it graded about 2 million cards in 2020 and more than 19 million in 2025, and that output from January to April 2026 rose about 39%. PSA also reported daily throughput of about 90,000 cards, up from 15,000 a day in 2021, in its February 2026 pricing update. As a result, Online Direct orders clear faster as capacity comes online through 2027.
Ownership consolidation and local labs reshape grading
Ownership consolidation shifts share toward challengers
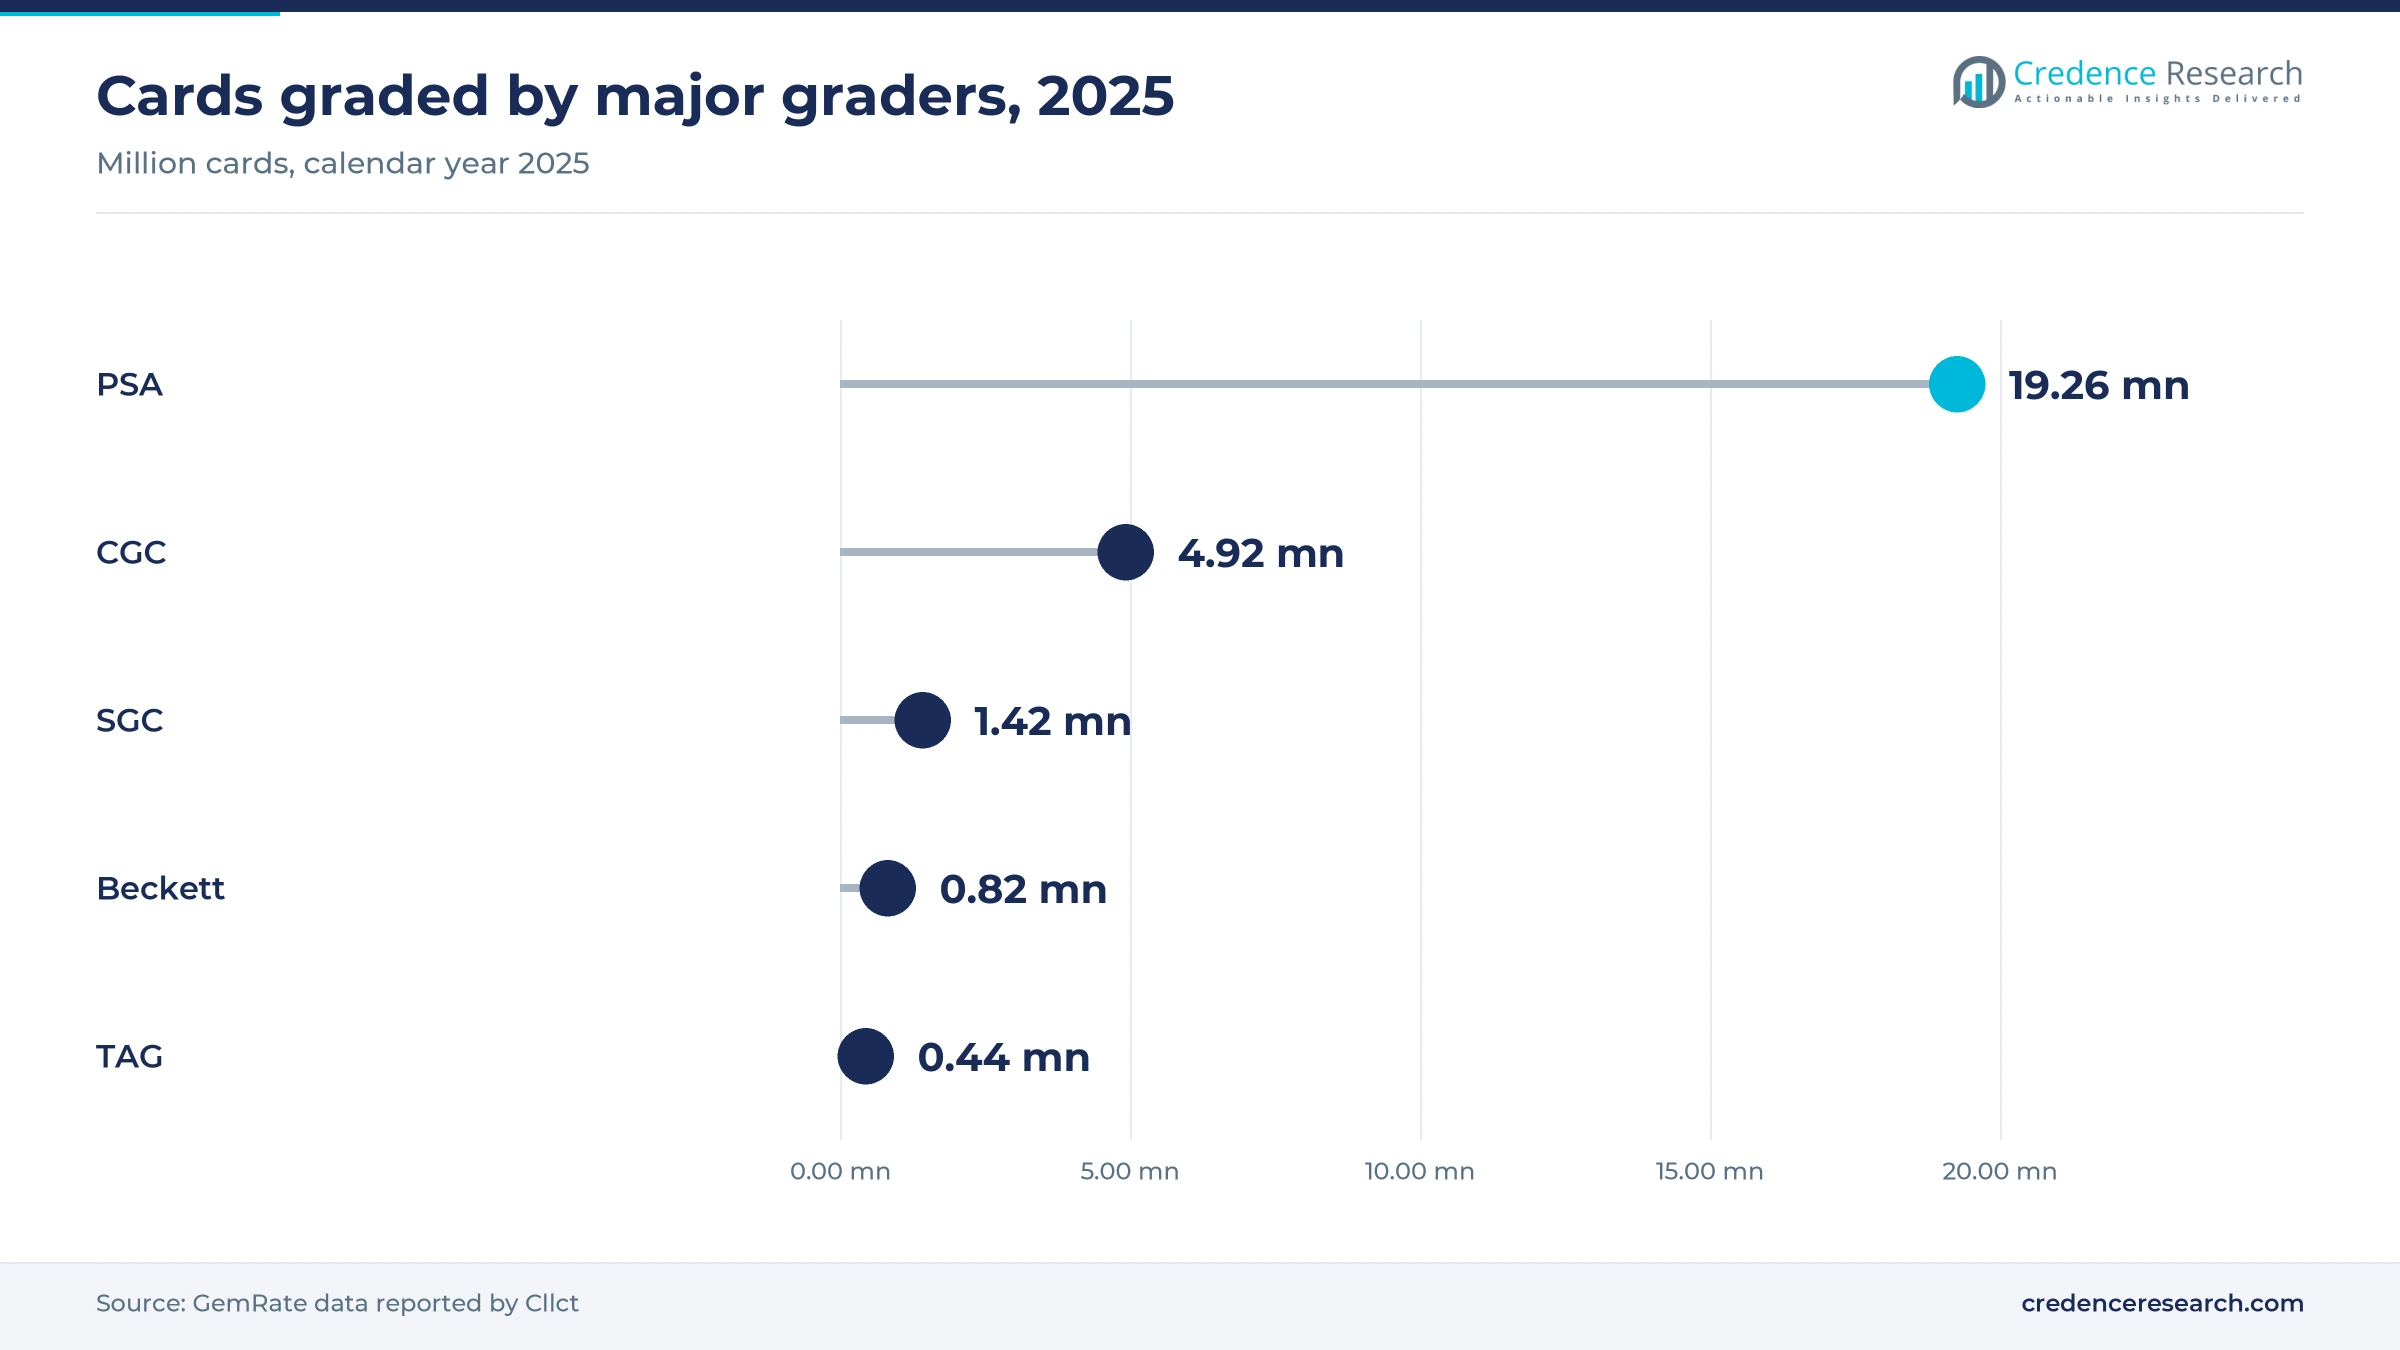
Ownership consolidation is reshaping competition, because one group now owns three of the five largest graders. Collectors acquired SGC in February 2024 and announced its purchase of Beckett on Dec. 15, 2025, and its brands held roughly 80% of 2025 grading volume, according to Cllct. SGC volume then fell 24% in 2025 after the parent said it would scale the brand down. In turn, independent rivals gained ground, with CGC volume up 121% to 4.92 million cards and TAG volume up 83% to more than 440,000 cards. This shift gives collectors fewer independent options while rewarding graders that add TCG capacity quickly.
Rise of regional grading labs near collectors
Graders are moving labs closer to collectors outside the United States, which cuts shipping time, customs exposure and risk. PSA opened submissions at its Frankfurt facility on Sept. 15, 2026, with all global service levels for cards, autographs, tickets and packs, including a new $59.99 Standard tier, according to Sports Illustrated. PSA first began authentication and grading in Japan in July 2023, according to Sports Collectors Digest, and grades Pokémon and Nippon Professional Baseball cards there. CGC runs offices in London, Munich, Dubai, Hong Kong and Shanghai and has named Japan and Canada as expansion goals, according to Cllct. CGC graded more than 2 million cards in the first six months of 2025, which already exceeded its total for all of 2024.
Japan and Asia TCG grading opens new volume
Japan and wider Asia offer an opening for graders because local TCG spending is large and much of it is still ungraded. The Japan Toy Association put the domestic trading card market at about 338 billion yen in the 2025 financial year, and a group of about 20 ruling party lawmakers formed in July 2026 to address counterfeits and resale abuse. A Japanese McDonald's Pikachu promo was graded 58,000 times by PSA in December 2025, according to Sports Illustrated. CGC already operates offices in Hong Kong and Shanghai for regional collectors. Asia Pacific held 20.0% of 2025 value and grows at 9.75% a year in the Credence Research model.
Fraud screening opens a new service opportunity
Fraud screening is an opening for graders because counterfeiters now target mid-priced cards as well as rare vintage cards. PSA said counterfeit Pokémon submissions rose more than 125% in 2025, and trading cards made up 56.3% of the counterfeit items it found, according to ICv2 in May 2026. PSA estimated that about 62% of 1952 Topps Mickey Mantle cards submitted were fake. In Europe, customs authorities detained about 112 million counterfeit items worth 3.8 billion euros in 2024, with toys among the main categories, according to the European Commission. Graders that pair imaging with fraud databases can charge more for verification.
Backlogs, higher fees and fake slabs test grader trust
Grading backlogs delay orders and revenue
Backlogs delay revenue because graders bill most orders only when cards ship back to collectors. PSA paused its Value, Value Bulk, Value Plus and Value Max tiers in June 2026, and its active backlog stood at 12.4 million units on July 28, 2026, according to Sports Collectors Daily. The backlog fell to about 8.2 million units by Oct. 6, 2026, according to CardGrade. Long waits push some collectors to sell raw cards instead, so graders now publish turnaround ranges and add staff.
Rising fees squeeze low-value submissions
Higher fees reduce the number of modern cards worth grading, because the fee can exceed the price gain from a high grade. PSA raised Value Bulk from $21.99 to $24.99 and Value from $27.99 to $32.99 on Feb. 10, 2026. When the Value tier reopened on Oct. 29, 2026, it cost $39.99 with a 90 to 100 business day estimate, according to ICv2. Dealers with bulk modern cards are most affected, and many now pre-screen cards before paying for grading.
Counterfeit slabs undermine trust in grades
Fake holders and altered cards threaten the trust that gives graded cards their premium in resale markets. PSA listed counterfeit slabs, trimmed edges, rebacked vintage cards and fake autographs among the methods it found in its May 2026 fraud report, according to Sports Illustrated. PSA President Ryan Hoge said fraud had moved into cards worth $100 to $300. Buyers of graded cards bear the loss, so graders invest in holder security, certificate lookups and image records.
Market concentration narrows grader choice
Concentration limits choice for collectors and dealers, because one owner sets prices and turnaround for most volume. Collectors brands held about 80% of 2025 grading volume after the SGC and Beckett deals, according to Cllct. SGC volume fell from about 143,000 cards in July 2025 to about 56,000 in September 2025, according to Sports Illustrated. Independent graders such as CGC and TAG gain from this, yet they must fund new capacity fast to absorb demand.
North America leads as Europe adds local grading labs
| Region | Value, 2025 (USD million) | Share, 2025 | CAGR, 2026–2035 |
|---|---|---|---|
| North America | 496.5 | 66.0% | 8.55% |
| Asia Pacific | 150.5 | 20.0% | 9.75% |
| Europe | 67.7 | 9.0% | 10.25% |
| Latin America | 22.6 | 3.0% | 9.45% |
| Middle East & Africa | 15.0 | 2.0% | 9.55% |
North America leads on grader capacity and resale depth
North America held 66.0% of 2025 value and grows at 8.55% a year to 2035. The region leads because PSA grades at sites in New Jersey, Boca Raton, Florida and Plano, Texas, according to PSA and Sports Illustrated, and CGC is headquartered in Sarasota, Florida. U.S. auction houses such as Goldin set record prices for graded cards, which keeps submissions high. Fanatics began its 20-year NFLPA card deal in 2026, according to Sports Illustrated, which supports future football card supply and demand for sports memorabilia grading.
Asia Pacific grows on Japanese and Chinese TCG demand
Asia Pacific held 20.0% of 2025 value and grows at 9.75% a year. Japan anchors the region, with a domestic trading card market of about 338 billion yen in the 2025 financial year, according to the Japan Toy Association. PSA has graded in Japan since July 2023, and CGC runs offices in Hong Kong and Shanghai. Japanese Pokémon promos ranked among the most graded cards worldwide in December 2025, which shows the depth of local demand.
Europe is the fastest-growing region on new local labs
Europe held 9.0% of 2025 value and grows fastest at 10.25% a year. PSA opened Frankfurt submissions on Sept. 15, 2026, removing international shipping for European collectors. CGC grades trading card games in Munich and accepts submissions at events such as MCM London Comic Con. European customs detained about 112 million counterfeit items in 2024, according to the European Commission, which raises the value of independent authentication for buyers in the region.
Latin America builds from Pokémon and soccer collectors
Latin America held 3.0% of 2025 value and grows at 9.45% a year. Pokémon cards are sold in more than 90 countries and regions, according to PokeGuardian. Soccer cards also add a second base of collectors across the region. However, most submissions still travel to U.S. labs, so shipping cost and customs time weigh on volume. Local dealers that consolidate orders for international graders handle much of the regional flow.
Middle East & Africa starts from a small dealer base
Middle East & Africa held 2.0% of 2025 value and grows at 9.55% a year. CGC runs an office in Dubai, according to Cllct, giving Gulf collectors a local drop-off point for submissions. Demand comes mainly from Pokémon, soccer and basketball collectors who buy graded cards through online auctions. Growth depends on more local intake points and lower shipping costs.
Capacity spending and tier changes defined 2026
| Development | Status and market relevance |
|---|---|
| In December 2025, Collectors agreed to acquire Beckett, keeping Beckett grading, magazines and price guide as a separate brand. | Completed; Collectors now owns PSA, SGC and Beckett |
| In May 2026, PSA announced a $200 million infrastructure investment over 18 months and plans to add about 700 staff by the end of 2026. | In progress; lifts grading capacity |
| In August 2026, Beckett paused new online Base and Standard submissions after cards submitted rose 102% in a year. | Temporary; protects turnaround times |
| In September 2026, PSA opened submissions at its Frankfurt facility and renamed its tiers to Standard, Priority, Express and Premier. | Live; serves collectors across Europe |
| In October 2026, PSA reopened its Value tier at $39.99 per card with a 90 to 100 business day estimate. | Live; restores economy access |
Imaging, scanners and fraud checks shape grading work
- Digital imaging reports record every card at intake, and TAG publishes defect maps that show the flaws behind each grade.
- App-based card scanners identify a card from a phone photo and pass it straight into a mobile submission, as in the PSA app.
- Fraud and counterfeit databases compare submissions with known fakes, which helped PSA flag more than $200 million in fake cards.
- Tamper-evident holders carry certificate numbers and security features that buyers can check against the grader's online records.
Need a Custom Version of This Report?
Tailor the scope, geography, or segments to your exact requirements.
- Custom geography or segment scope
- Direct access to our analyst team
PSA scale faces fast-growing CGC and TAG challengers
Competition centers on brand trust at resale, turnaround time and price per card. PSA leads by a wide margin, grading 19.26 million cards in 2025 and holding about 72% of volume, because PSA 10 cards usually sell for the highest prices. Its parent Collectors also owns SGC and Beckett, so the group sets the reference prices for most tiers. CGC Cards is the main independent challenger, with a 25% share of TCG grading in 2025 and offices in Europe, the Middle East and Asia. TAG Grading competes on detailed imaging reports and low-cost grading tiers. Beckett keeps a following for its sub-grades and grew 26% in 2025. Rivals win share when PSA tiers are paused or slow, so spare capacity is a key weapon. Retail partnerships, such as PSA drop-off at GameStop, add a further channel for winning first-time submitters.
Companies profiled and their roles in this market
| Company | Type | Role in the market |
|---|---|---|
| PSA (Collectors) | Market leader | Largest grader of sports and Pokémon cards, with labs in the U.S., Japan and Germany |
| CGC Cards | Independent challenger | Second-largest grader, strong in TCG with offices in London, Munich, Dubai and Hong Kong |
| Beckett | Collectors brand | Grader known for sub-grades, now a separate brand under Collectors |
| SGC | Collectors brand | Sports-focused grader, scaled down to a boutique brand in 2025 |
| TAG Grading | Technology challenger | Imaging-based grader with low-cost TAG X tier and fast volume growth |
Turnaround and fraud detection will decide share
Credence Research's view is that the trading card grading services market will be decided less by demand than by capacity and trust. Submissions grew faster than graders could handle in 2026, so the firm that clears orders on time wins the next buyer. PSA has the scale and the resale premium, yet its paused tiers showed how quickly volume moves to CGC, TAG and Beckett when waits grow. Fraud detection is the second deciding factor, because a single wave of fake holders can erase the premium for a brand. Graders that invest in imaging records, local labs and transparent turnaround data will hold share through 2035.
Volume-and-price model checked against grader data
The report uses 2025 as the base year and forecasts to 2035. Market values come from the Credence Research model, built from published grading volumes by company, public price lists by service tier and estimated tier mixes. Segment, channel and regional splits are Credence Research estimates based on company disclosures, grader locations, retail partner programs and public statistics from the U.S. Census Bureau, the European Commission and the Japan Toy Association. Company announcements, price updates and trade press coverage were used to date events. No interviews or surveys were conducted for this edition of the report.
TCG demand and regional labs extend growth to 2035
The market is expected to grow from USD 820.0 million in 2026 to USD 1.78 billion by 2035 as Pokémon and other TCG cards keep feeding submissions and graders add capacity outside the United States. Economy tiers will remain the volume base, although higher fees after 2026 will push more value into express and premium service. Europe and Asia Pacific will gain share as local labs in Frankfurt, Munich and Tokyo cut shipping time. Fraud screening, imaging records and app-based submission will become standard parts of card grading services, and grader capacity will remain the main limit on growth.
Frequently Asked Questions
How big is the trading card grading services market?
Which card type leads trading card grading?
Which region leads the market?
Which region grows fastest?
Which service tier grows fastest?
Who are the main trading card grading companies?
Why did PSA pause its Value tiers in 2026?
How does counterfeiting affect grading demand?
Table of Content
Chapter 1 Market Segmentation
- 1.1 Segmentation Framework
- 1.1.1 Product and Service Classification
- 1.1.2 Application and End-Use Classification
- 1.1.3 Technology and Solution Classification
- 1.1.4 Customer and Distribution Channel Classification
- 1.1.5 Geographic Segmentation
- 1.1.6 Market Segment Definitions and Boundaries
- 1.2 By Card Type
- 1.2.1 Pokémon & Other TCG
- 1.2.2 Sports
- 1.2.3 Non-Sport
- 1.3 By Service Tier
- 1.3.1 Economy
- 1.3.2 Express
- 1.3.3 Premium
- 1.4 By Submission Channel
- 1.4.1 Online Direct
- 1.4.2 Retail Partner
- 1.4.3 Event & Dealer
Chapter 2 Introduction
- 2.1 Report Objectives and Scope
- 2.2 Product Definition and Industry Terminology
- 2.3 Market Inclusions and Exclusions
- 2.4 Research Process
- 2.4.1 Primary Research and Expert Interviews
- 2.4.2 Secondary Research and Source Review
- 2.4.3 Top-Down and Bottom-Up Estimation
- 2.4.4 Data Triangulation and Verification
- 2.5 Market Size Measurement Basis
- 2.5.1 2025: USD 752.3 million → 2035: USD 1.78 billion
- 2.6 Historical and Forecast Reference Periods
- 2.6.1 Historical Period: 2018-2025
- 2.6.2 Base Year: 2025
- 2.6.3 Forecast Period: 2025-2035
- 2.7 Research Assumptions and Limitations
Chapter 3 Executive Summary
- 3.1 Market Snapshot and Key Findings
- 3.2 Base-Year Market Size, 2025
- 3.3 Forecast Market Size, 2035
- 3.4 Revenue and Volume Growth Outlook
- 3.5 Key Demand and Supply Indicators
- 3.6 Leading Market Segments
- 3.7 Fastest-Growing Market Opportunities
- 3.8 Regional Performance Highlights
- 3.9 Technology and Industry Transformation
- 3.10 Competitive Landscape Summary
- 3.11 Analyst View and Strategic Implications
Chapter 4 Global Trading Card Grading Services Market Trends and Developments
- 4.1 Historical Industry Development, 2018-2025
- 4.2 Recent Market Trends and Developments
- 4.3 Demand and Customer Behavior Trends
- 4.4 Technology and Product Innovation
- 4.5 Artificial Intelligence, Automation and Digitalization
- 4.6 Local Manufacturing and Supply Chain Realignment
- 4.7 Industry Partnerships, Mergers and Acquisitions
- 4.8 Sustainability and Circular Economy Developments
- 4.9 Government and Private Sector Investment Trends
- 4.10 Emerging Business Models and Commercialization
- 4.11 Industry Developments and Announcements
Chapter 5 Global Trading Card Grading Services Market Supply and Demand Analysis
- 5.1 Demand Trend and Consumption Analysis, 2018-2025
- 5.2 Demand Forecast, 2025-2035
- 5.3 Supply Chain Structure and Procurement Trends
- 5.4 Supply-Demand Gap and Bottlenecks
- 5.5 Import Dependence and Sourcing Structure
- 5.6 Regional Supply and Demand Concentration
Chapter 6 Global Trading Card Grading Services Market Pricing Analysis
- 6.1 Pricing Structure and Measurement
- 6.2 Historical Pricing Trends, 2018-2025
- 6.3 Pricing Outlook, 2025-2035
- 6.4 Pricing by Product and Market Segment
- 6.5 Geographic Pricing Differences
- 6.6 Key Input, Energy, Labor and Logistics Costs
- 6.7 Contract Pricing and Purchasing Models
- 6.8 Pricing Sensitivity and Competitive Positioning
- 6.9 Price, Margin and Profitability Implications
Chapter 7 Global Trading Card Grading Services Market Dynamics
- 7.1 Market Growth Drivers
- 7.1.1 Demand-Side Drivers
- 7.1.2 Technology and Innovation Drivers
- 7.1.3 Infrastructure and Investment Drivers
- 7.1.4 Regulatory and Policy Drivers
- 7.2 Market Restraints
- 7.2.1 Cost and Affordability Constraints
- 7.2.2 Technology and Adoption Barriers
- 7.2.3 Supply Chain and Operational Constraints
- 7.3 Market Challenges
- 7.3.1 Competitive Pressure and Margin Erosion
- 7.3.2 Skills, Infrastructure and Implementation Gaps
- 7.4 Emerging Market Opportunities
- 7.5 Market Dynamics Impact and Time-Horizon Assessment
Chapter 8 Global Trading Card Grading Services Value Chain Analysis
- 8.1 Industry Value Chain Overview
- 8.2 Upstream Suppliers and Critical Inputs
- 8.3 Technology and Component Providers
- 8.4 Manufacturing or Service Delivery
- 8.5 Distribution, Channel Partners and Integrators
- 8.6 Downstream Applications and End Users
- 8.7 Value Addition and Profit Pools
- 8.8 Vertical Integration and Outsourcing
- 8.9 Supplier Concentration and Risk
- 8.10 Supply Chain Localization and Resilience
Chapter 9 Global Trading Card Grading Services Market Regulations and Policies
- 9.1 Relevant Laws, Standards and Compliance Frameworks
- 9.2 Product, Service, Safety and Quality Requirements
- 9.3 Government Policies, Incentives and Subsidies
- 9.4 Imports, Exports and Trade Barriers
- 9.5 Public Procurement and Local Content Requirements
- 9.6 Data Protection, AI and Cybersecurity Compliance
- 9.7 Upcoming Policy Changes and Market Implications
Chapter 10 Global Trading Card Grading Services Market Hotspots and Opportunities
- 10.1 Market Opportunity Mapping and Growth Hotspots
- 10.2 High-Growth Applications and Customer Groups
- 10.3 Underserved Markets and White-Space Opportunities
- 10.4 Emerging Technology and Product Opportunities
- 10.5 New Capacity and Investment Hotspots
- 10.6 Market Entry and Expansion Opportunities
- 10.7 Distribution and Partnership Opportunities
- 10.8 Near-Term and Long-Term Commercial Potential
- 10.9 Opportunity Attractiveness and Execution Risks
Chapter 11 Global Trading Card Grading Services Market Outlook, 2025-2035
- 11.1 Market Size and Analysis
- 11.1.1 Revenue (Market Measurement: 2025: USD 752.3 million → 2035: USD 1.78 billion)
- 11.1.2 Historical Market Size, 2018-2025
- 11.1.3 Base-Year Market Size, 2025
- 11.2 Market Forecast, 2025-2035
- 11.2.1 Revenue Forecast to 2035
- 11.2.2 CAGR and Year-on-Year Growth
- 11.2.3 Incremental Revenue Opportunity
- 11.3 Forecast Assumptions and Scenario Analysis
- 11.3.1 Base-Case Forecast
- 11.3.2 Optimistic and Conservative Scenarios
- 11.3.3 Technology, Pricing and Policy Sensitivities
- 11.4 Market Attractiveness and Growth Outlook
Chapter 12 Global Trading Card Grading Services Market Segmentation and Outlook
- 12.1 Segmentation Summary and Market Shares, 2025
- 12.2 Largest and Fastest-Growing Segments
- 12.3 By Card Type - Market Size and Forecast, 2025-2035
- 12.3.1 Segment Definition and Scope
- 12.3.2 Historical Market Size, 2018-2025
- 12.3.3 Revenue Forecast, 2025-2035
- 12.3.4 Base-Year Market Share, 2025
- 12.3.5 Segment CAGR and Growth Drivers
- 12.3.6 Subsegment Market Size and Forecast
- 12.3.6.1 Pokémon & Other TCG
- 12.3.6.2 Sports
- 12.3.6.3 Non-Sport
- 12.3.7 Subsegment Pricing and Adoption Trends
- 12.3.8 Leading Suppliers and Competition
- 12.3.9 Regional Demand and Opportunities
- 12.4 By Service Tier - Market Size and Forecast, 2025-2035
- 12.4.1 Segment Definition and Scope
- 12.4.2 Historical Market Size, 2018-2025
- 12.4.3 Revenue Forecast, 2025-2035
- 12.4.4 Base-Year Market Share, 2025
- 12.4.5 Segment CAGR and Growth Drivers
- 12.4.6 Subsegment Market Size and Forecast
- 12.4.6.1 Economy
- 12.4.6.2 Express
- 12.4.6.3 Premium
- 12.4.7 Subsegment Pricing and Adoption Trends
- 12.4.8 Leading Suppliers and Competition
- 12.4.9 Regional Demand and Opportunities
- 12.5 By Submission Channel - Market Size and Forecast, 2025-2035
- 12.5.1 Segment Definition and Scope
- 12.5.2 Historical Market Size, 2018-2025
- 12.5.3 Revenue Forecast, 2025-2035
- 12.5.4 Base-Year Market Share, 2025
- 12.5.5 Segment CAGR and Growth Drivers
- 12.5.6 Subsegment Market Size and Forecast
- 12.5.6.1 Online Direct
- 12.5.6.2 Retail Partner
- 12.5.6.3 Event & Dealer
- 12.5.7 Subsegment Pricing and Adoption Trends
- 12.5.8 Leading Suppliers and Competition
- 12.5.9 Regional Demand and Opportunities
- 12.6 Segment Growth Comparison
- 12.7 Segment Attractiveness and Priority Matrix
Chapter 13 Global Trading Card Grading Services Geographic Market Outlook, 2025-2035
- 13.1 Regional Market Size and Share, 2025
- 13.2 Regional Market Forecast, 2025-2035
- 13.3 Regional Pricing, Production and Demand Differences
- 13.4 North America
- 13.4.1 United States
- 13.4.2 Canada
- 13.4.3 Mexico
- 13.5 Europe
- 13.5.1 Germany
- 13.5.2 France
- 13.5.3 Italy
- 13.5.4 United Kingdom
- 13.5.5 Spain
- 13.5.6 Poland
- 13.5.7 Russia
- 13.5.8 Netherlands
- 13.5.9 Belgium
- 13.5.10 Sweden
- 13.5.11 Denmark
- 13.5.12 Norway
- 13.5.13 Rest of Europe
- 13.6 Asia Pacific
- 13.6.1 China
- 13.6.2 India
- 13.6.3 Japan
- 13.6.4 South Korea
- 13.6.5 Thailand
- 13.6.6 Indonesia
- 13.6.7 Vietnam
- 13.6.8 Malaysia
- 13.6.9 Australia
- 13.6.10 Rest of Asia Pacific
- 13.7 Latin America
- 13.7.1 Brazil
- 13.7.2 Argentina
- 13.7.3 Colombia
- 13.7.4 Chile
- 13.7.5 Rest of Latin America
- 13.8 Middle East
- 13.8.1 Saudi Arabia
- 13.8.2 United Arab Emirates
- 13.8.3 Turkey
- 13.8.4 Israel
- 13.8.5 Iran
- 13.8.6 Rest of the Middle East
- 13.9 Africa
- 13.9.1 South Africa
- 13.9.2 Egypt
- 13.9.3 Nigeria
- 13.9.4 Morocco
- 13.9.5 Rest of Africa
- 13.10 Regional Investment, Policy and Supply Chain Differences
- 13.11 Regional Competitive Landscape
- 13.12 Geographic Growth Hotspots
Chapter 14 Global Trading Card Grading Services Technology, Innovation and Sustainability Outlook
- 14.1 Technology Landscape and Maturity
- 14.2 Product, Process and Service Innovation
- 14.3 AI, Automation and Digital Tools in the Industry
- 14.4 Technology Adoption and Performance Benchmarking
- 14.5 Innovation Pipeline and R&D Investment
- 14.6 Energy Efficiency and Resource Management
- 14.7 Sustainability, Recycling and Circularity
- 14.8 Technology Roadmap, 2025-2035
- 14.9 Risks of Obsolescence and Technology Substitution
Chapter 15 Global Trading Card Grading Services Market Key Strategic Imperatives
- 15.1 Growth and Market Entry Priorities
- 15.2 High-Return Products and Segments
- 15.3 Pricing, Profitability and Cost Optimization
- 15.4 Technology Investment and Product Differentiation
- 15.5 Supply Chain Localization and Resilience
- 15.6 Distribution and Customer Acquisition
- 15.7 Partnership, Acquisition and Capacity Strategy
- 15.8 Regional Expansion Priorities
- 15.9 Short-, Medium- and Long-Term Actions
Chapter 16 Competition Outlook
- 16.1 Industry Competition Characteristics
- 16.2 Market Structure and Concentration
- 16.3 Market Share and Competitive Positioning, 2025
- 16.4 Company-Wise Revenue and Product Benchmarking
- 16.5 Production and Service Capacity Benchmarking
- 16.6 Technology, Pricing and Differentiation
- 16.7 Regional Footprint and Distribution Strength
- 16.8 Mergers, Acquisitions and Strategic Alliances
- 16.9 New Entrants and Competitive Threats
- 16.10 Porter's Five Forces and Industry Attractiveness
- 16.11 Competitive Outlook, 2025-2035
Chapter 17 Company Profiles
- 17.1 Company Coverage and Selection Criteria
- 17.2 PSA (Collectors)
- 17.2.1 Business Description
- 17.2.2 Company Ownership and Geographic Presence
- 17.2.3 Product and Service Portfolio
- 17.2.4 Manufacturing and Operating Footprint
- 17.2.5 Financial Performance and Investment
- 17.2.6 Market Share and Competitive Position
- 17.2.7 Technology and Innovation Capabilities
- 17.2.8 Strategic Alliances or Partnerships
- 17.2.9 Recent Developments
- 17.2.10 Growth Strategy and Outlook
- 17.3 CGC Cards
- 17.4 Beckett
- 17.5 SGC
- 17.6 TAG Grading
- 17.7 Other Relevant Market Participants
Note: Every listed company is profiled on the structure shown under the first company. The company list is preliminary and may change based on research findings, market developments, data availability and client requirements.
Chapter 18 Disclaimer
- 18.1 Research and Forecast Disclaimer
- 18.2 Data Source and Estimation Limitations
Note: The depth of individual sections depends on data availability for this market. Volume, capacity, trade and other unit-based metrics are included where applicable.