Cards and adult toy buyers are reshaping collecting
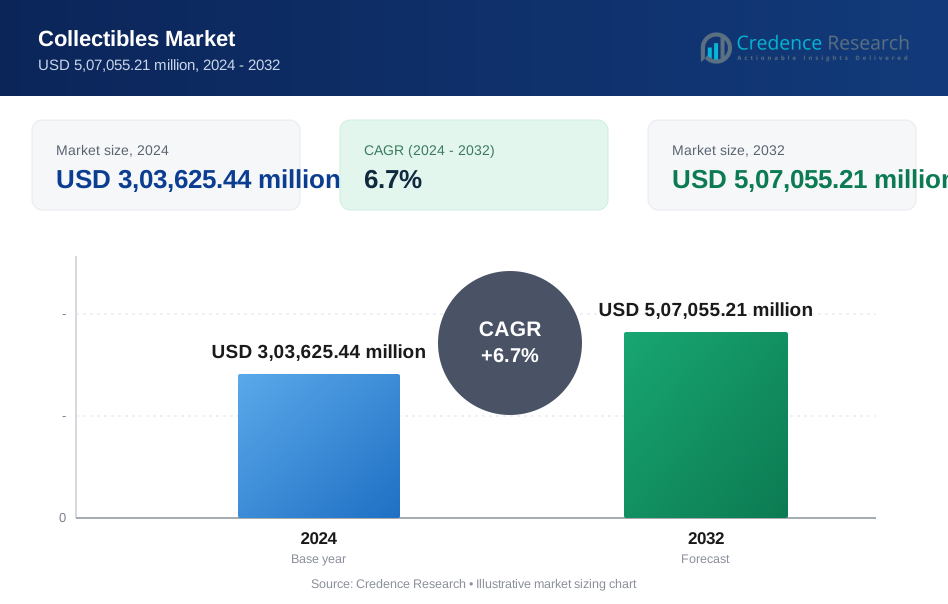
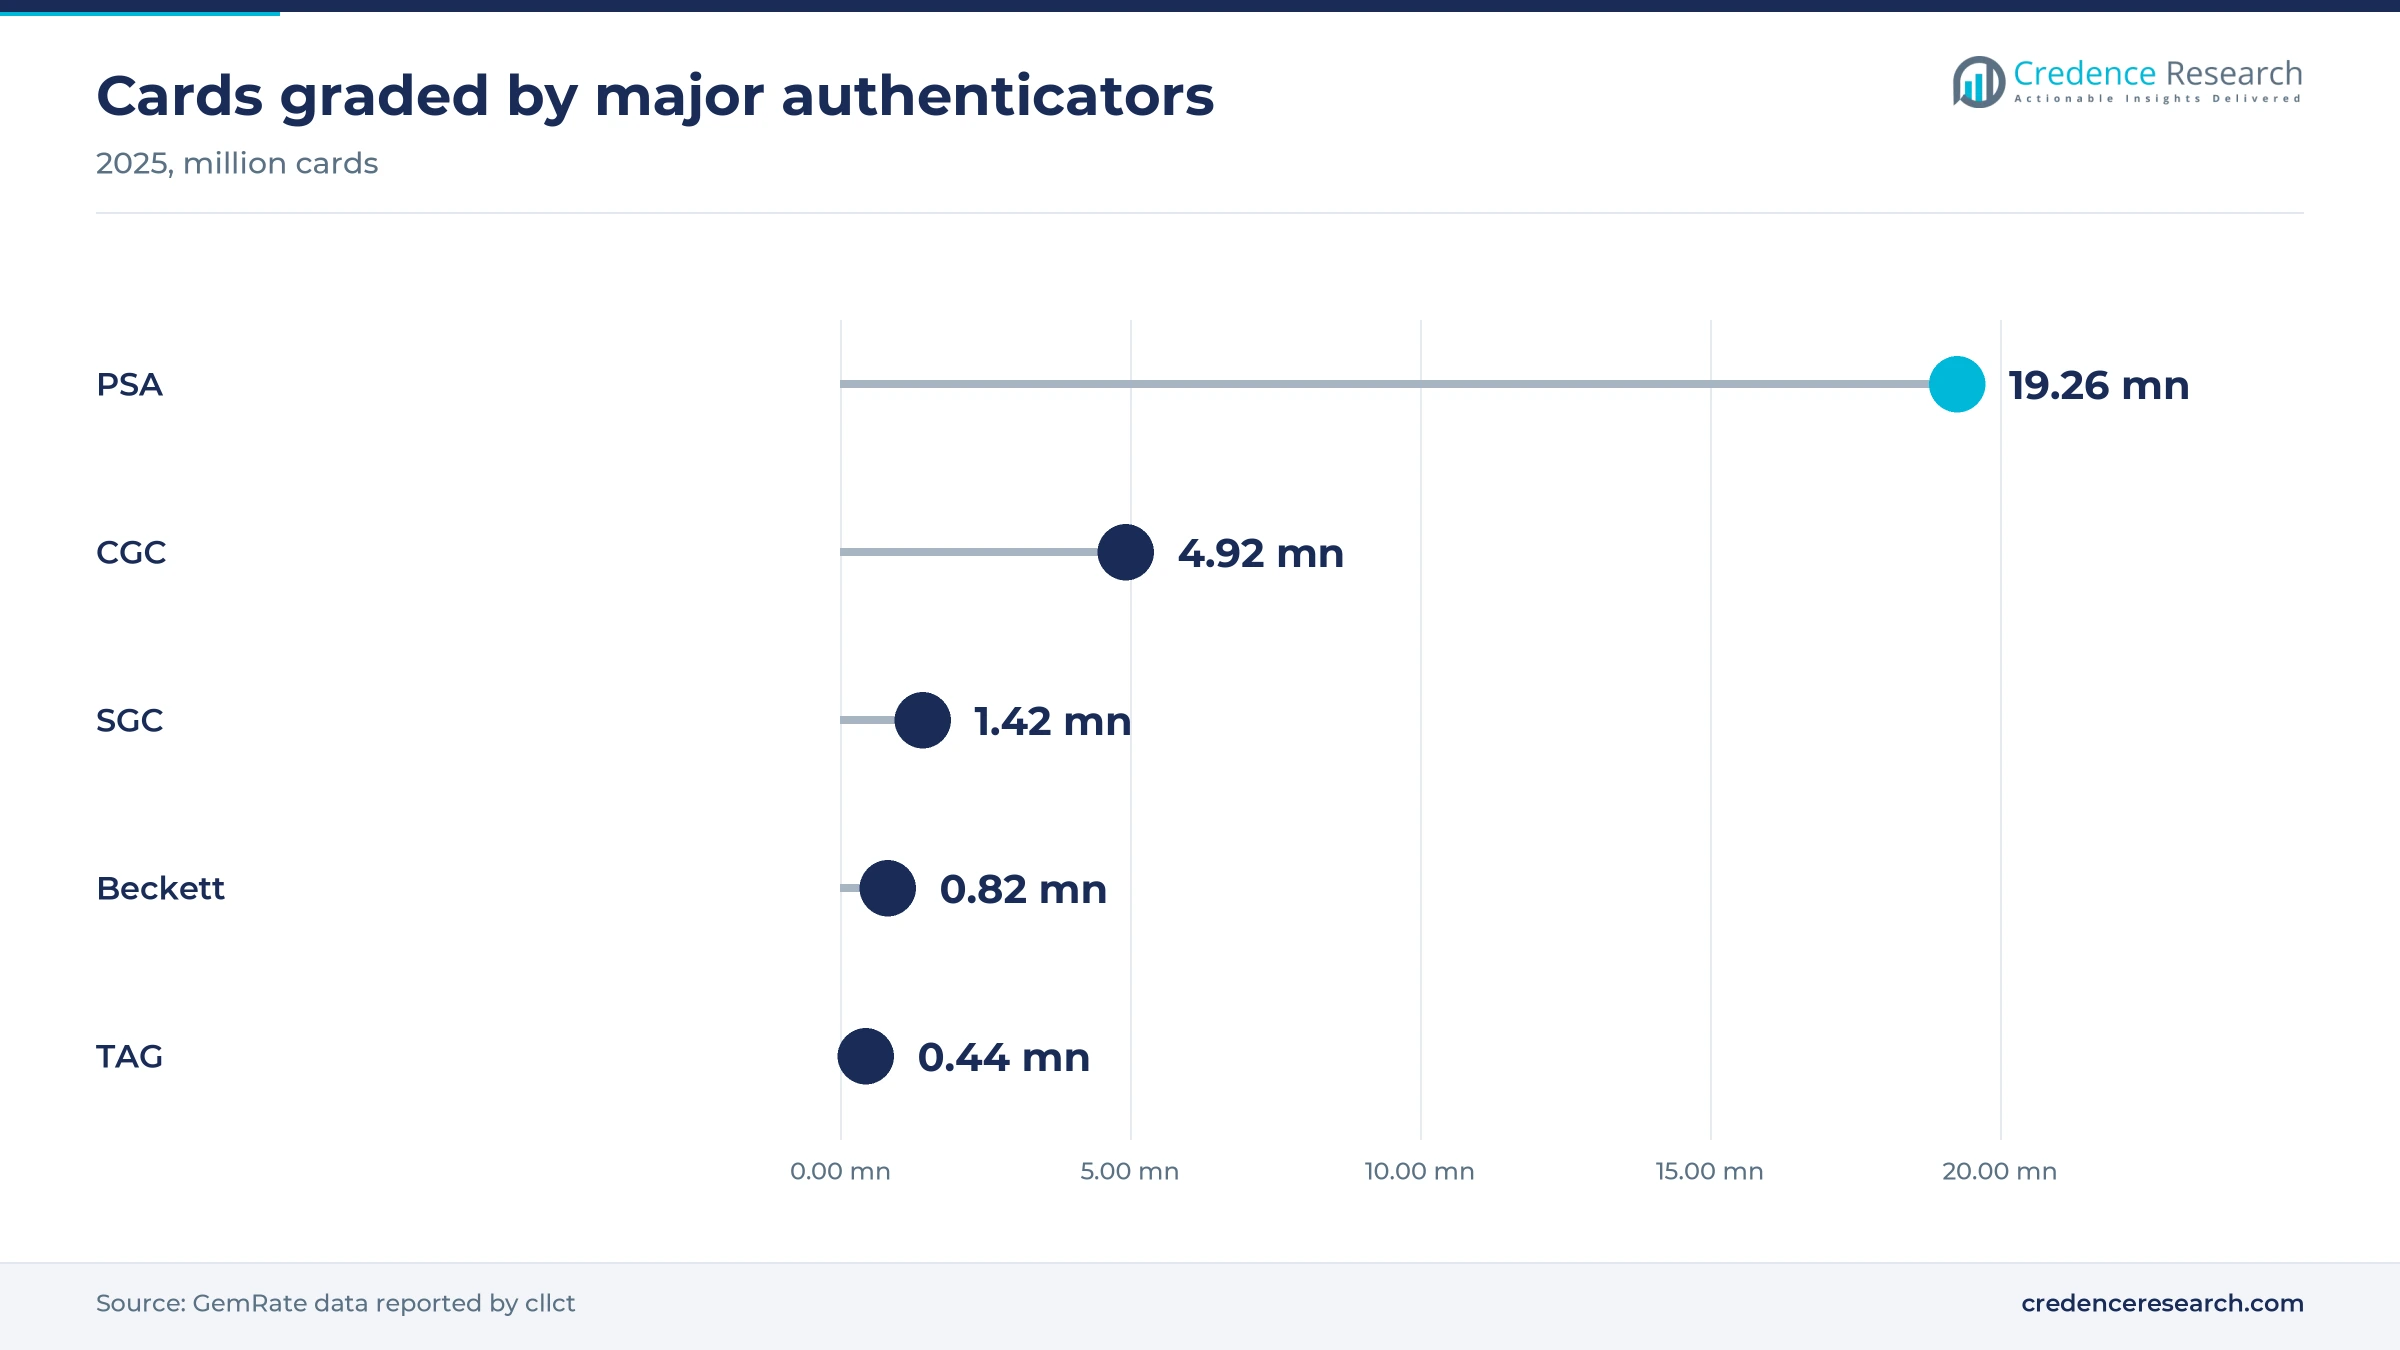
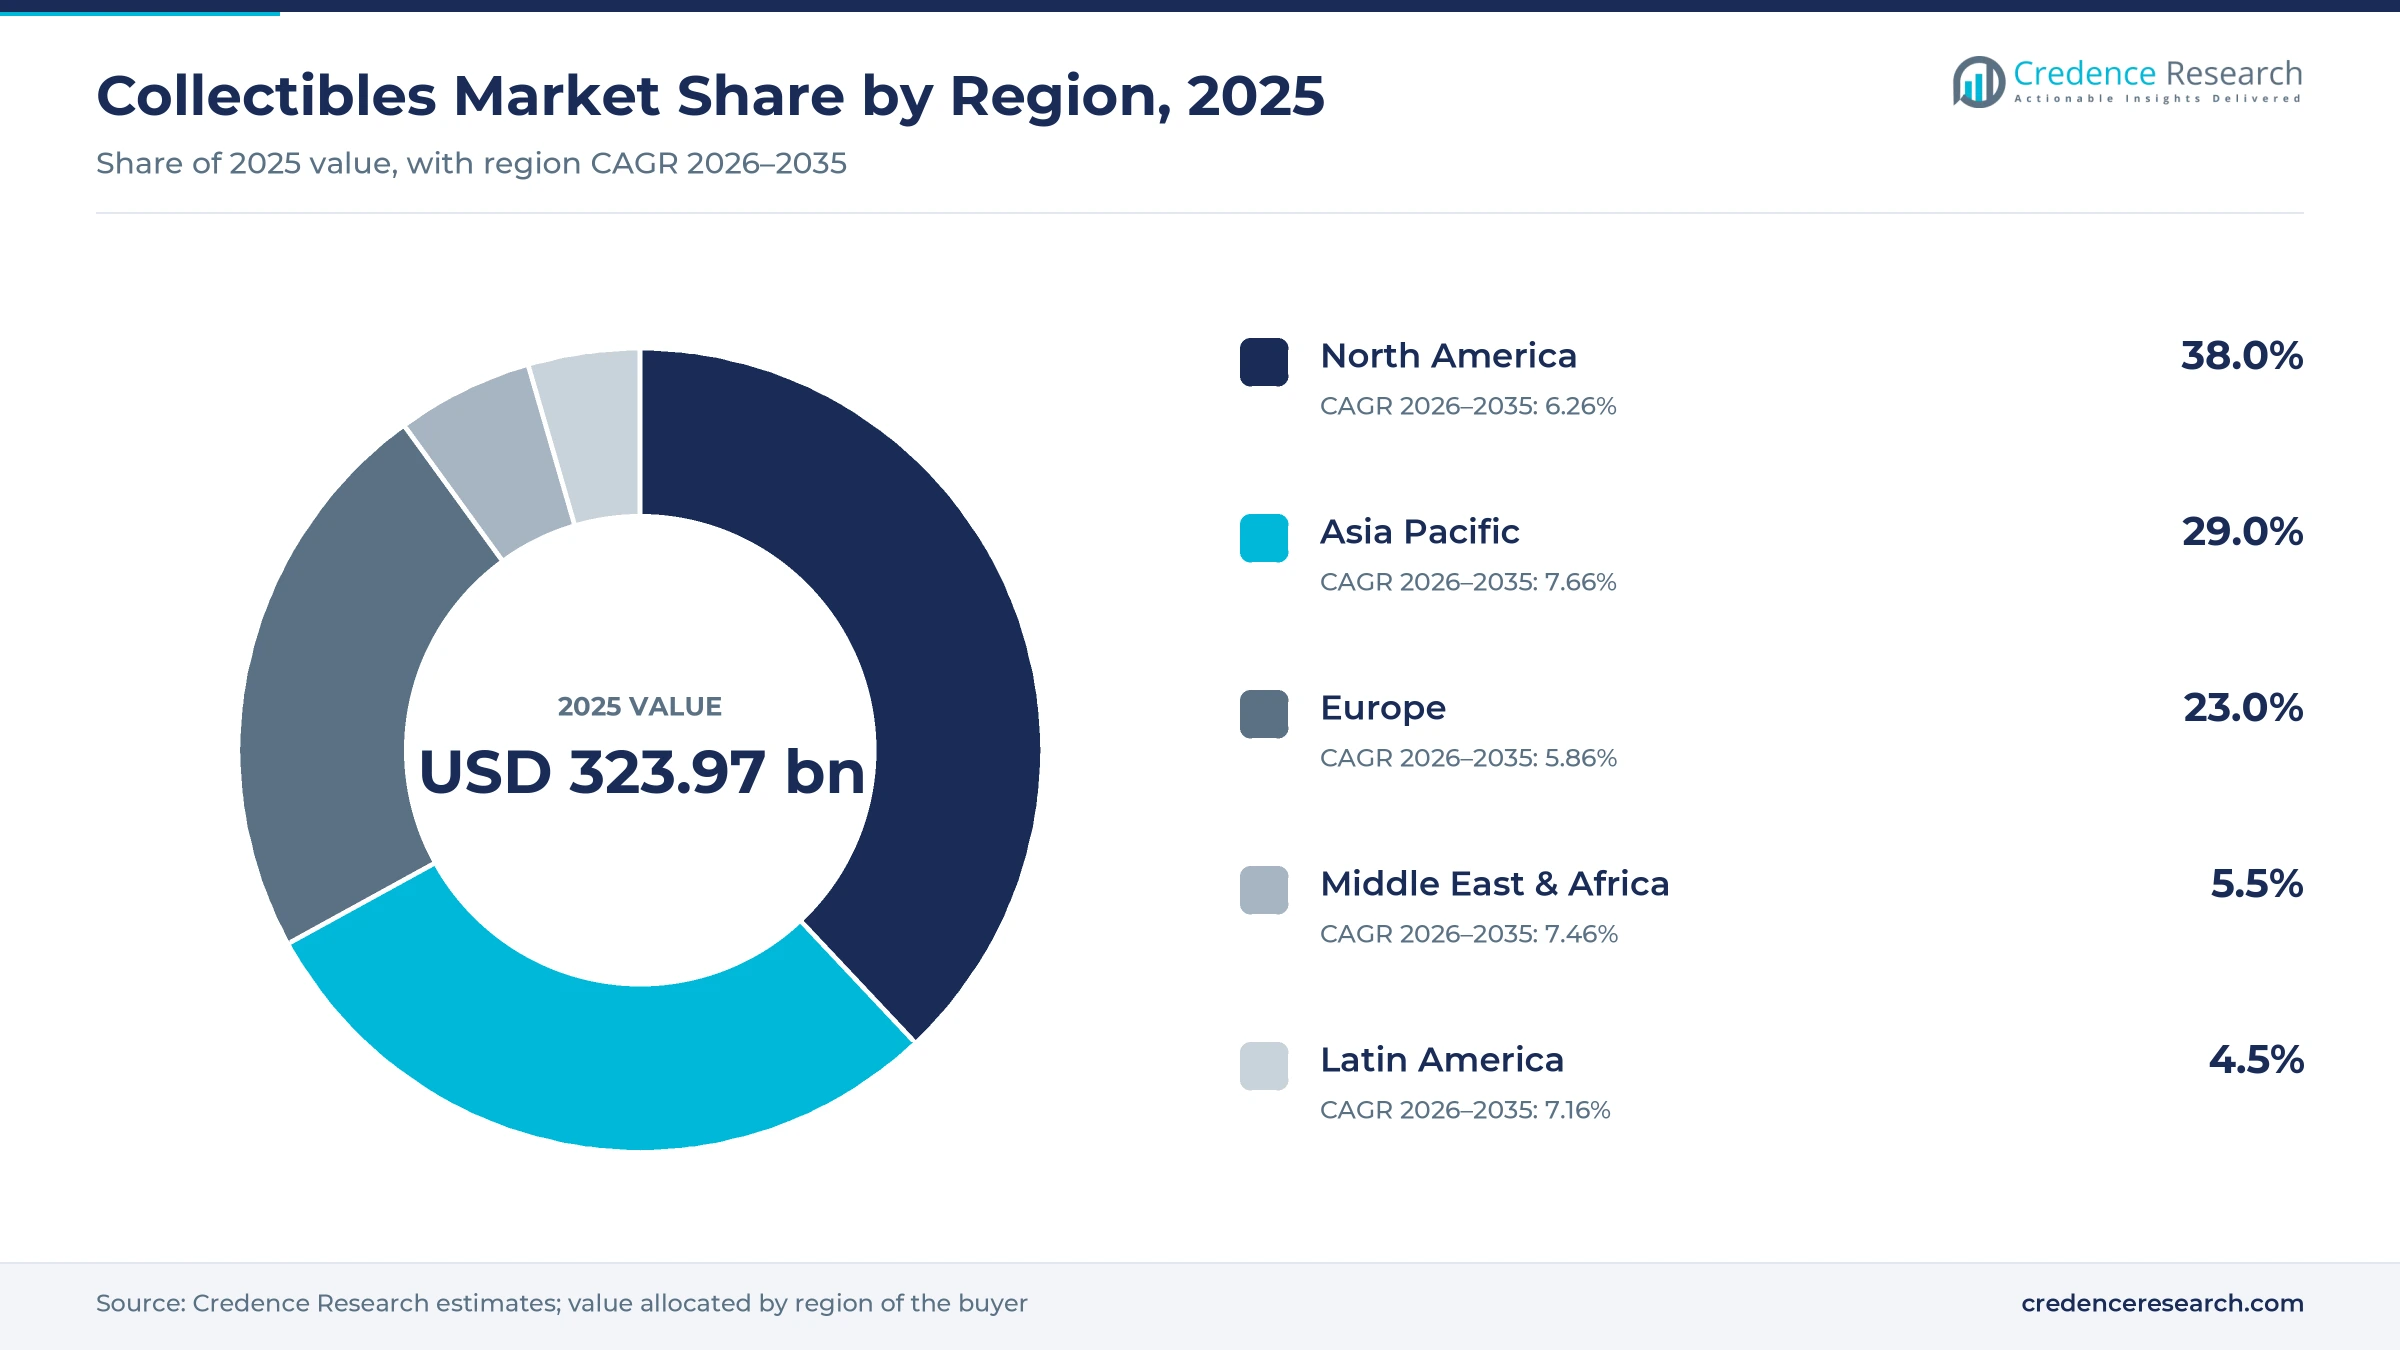
The global collectibles market was valued at USD 323.97 billion in 2025 and is projected to increase from USD 345.67 billion in 2026 to USD 619.65 billion by 2035, registering a CAGR of 6.70% during 2026–2035. Demand comes from adult buyers of licensed toys, trading card players, coin and stamp hobbyists, art and antiques buyers, and investors seeking rare physical assets. North America held the largest regional share, 38.0% in 2025, because the United States anchors art sales, card grading and the largest online marketplaces. Asia Pacific is the fastest-growing region at 7.66% a year, helped by designer toys from China and strong card demand. Collectibles reached almost 19% of global toy dollar sales in 2025, according to The Toy Association, after sales rose 32% in a year. One commercial change stands out, as Collectors, the parent of PSA, bought Beckett's grading business in December 2025 and now handles roughly 80% of cards graded by the major authenticators.
What counts as a collectible, and how do buyers purchase these items?
Collectible items are objects bought for rarity, condition, history or fan attachment rather than for everyday use. This report counts art and antiques, coins and currency, trading cards, toys and action figures, sports memorabilia, comics, stamps and autographs. Buyers purchase them from toy and hobby stores, online marketplaces and auction houses, and they often pay separately for grading, authentication or storage.
The value excludes ordinary toys sold for play, bullion bought only for metal content, and collector real estate or cars sold at the same auction events. The chain runs from licensors and publishers through retailers, graders and resale platforms, and a single item may therefore trade several times after its first sale.
Collectibles Market Insights
- The global collectibles market is estimated at USD 323.97 billion in 2025 and is projected to reach USD 619.65 billion by 2035, a 6.70% CAGR over 2026–2035.
- North America held 38.0% of collectibles value in 2025, supported by United States art sales, card grading volume and large online resale platforms.
- Art & Antiques held 31.0% of 2025 value, while Trading Cards are projected to grow fastest at 8.71% a year through 2035.
- Card games and non-sports items overtook sports cards in grading during 2025, with 16.8 million cards against 10 million, according to GemRate data reported by cllct.
- Collectors' December 2025 purchase of Beckett's grading business concentrated card authentication, which makes grading capacity and price central competitive issues for sellers and buyers alike.
Art leads value while trading cards set the growth pace
Art holds the most value, but cards are climbing fastest
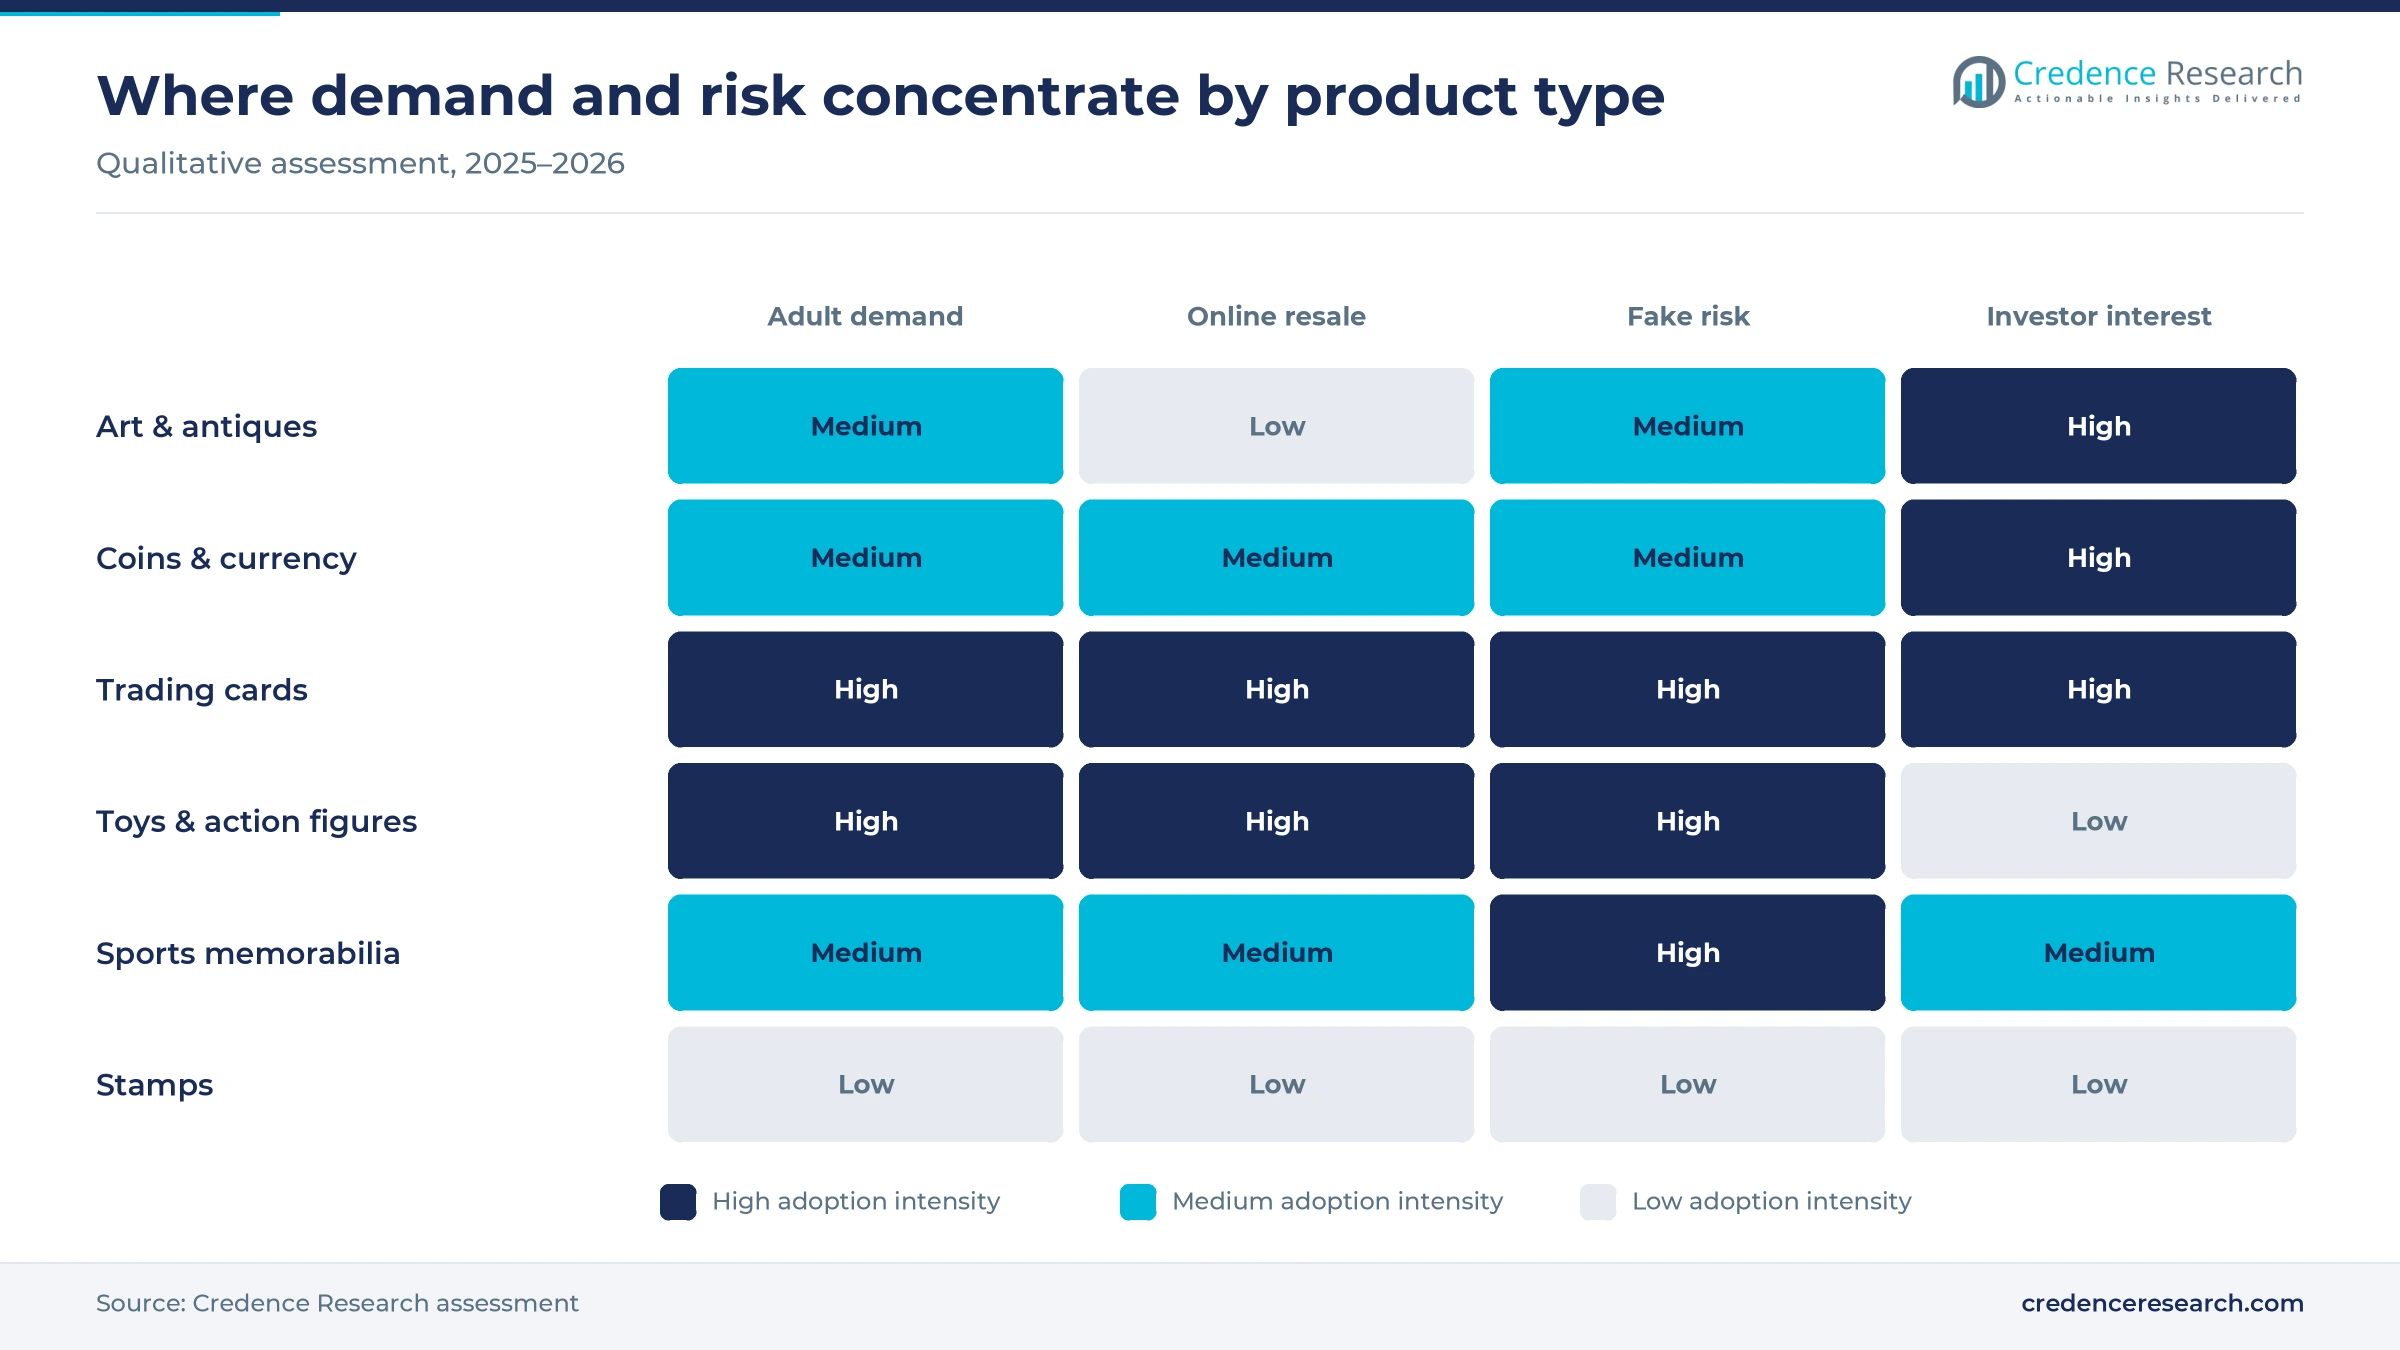
Based on product type, the market is categorized into art and antiques, coins and currency, trading cards, toys and action figures, sports memorabilia, comics, stamps, autographs and others. Art & Antiques led with 31.0% of 2025 value because single works carry high prices, and global art sales reached USD 59.6 billion in 2025, according to Art Basel and UBS. Trading Cards grow fastest at 8.71% a year as PSA alone graded 19.26 million cards in 2025, up 26%, according to GemRate data. Coins drew fresh attention when 232 final penny sets sold at Stack's Bowers Galleries on Dec. 12, 2025, according to AOL.
Low ticket prices drive volume while premium items gain
Based on price range, the market is categorized into mass collectibles, premium collectibles and ultra-premium collectibles. Mass Collectibles led with 46.0% of 2025 value because low prices support repeat buying, as Pop Mart's more than 400 million units sold in 2025 show. Panini stickers cost just GBP 1.25 per packet in the U.K., according to Al Jazeera. Premium Collectibles grow fastest at 7.17% a year as luxury categories rose 22% at Sotheby's and 17% at Christie's in 2025, according to The Art Newspaper. Ultra-premium sales remain lumpy, shown by the USD 14.75 million paid for the Citizen Kane sled at Heritage Auctions, according to cllct.
Individual buyers dominate as hobbyist participation widens
Based on end user, the market is categorized into individual collectors, investors, hobbyists and museums and institutions. Individual Collectors led with 52.0% of 2025 value because personal purchases dominate transaction counts, with art alone recording about 41.5 million transactions in 2025, according to Art Basel and UBS. Hobbyists grow fastest at 7.55% a year as adult and card games, trading cards and collectible figures ranked among the fastest-growing toy segments, according to The Toy Association. Institutions buy far less often, although the National Museum of American History announced acquisitions on April 19, 2026, that included an original Superman IV painting.
Stores keep the lead as online marketplaces close the gap
Based on sales channel, the market is categorized into offline stores, online marketplaces, auction houses and others. Offline Stores led with 44.0% of 2025 value because shoppers still buy packs and figures in person, and Pop Mart ran more than 700 stores worldwide at the end of 2025, according to TechNode. Online Marketplaces grow fastest at 8.06% a year as eBay reported triple-digit growth in Pokémon card merchandise volume for three straight quarters through September 2025, according to cllct. Goldin, which eBay acquired in 2024, adds an online auction route for high-value cards and memorabilia.
| Segment Group | Leading Sub-segment | Share, 2025 | Fastest-growing Sub-segment | CAGR, 2026–2035 |
|---|---|---|---|---|
| By Product Type | Art & Antiques | 31.0% | Trading Cards | 8.71% |
| By Price Range | Mass Collectibles | 46.0% | Premium Collectibles | 7.17% |
| By End User | Individual Collectors | 52.0% | Hobbyists | 7.55% |
| By Sales Channel | Offline Stores | 44.0% | Online Marketplaces | 8.06% |
Request a Free Sample
Fill in your details and we'll send you a free sample report.
- Sample data tables & charts
- Research methodology
Adult buyers, franchises and rarity lift collector spending
Adult buyers are lifting collectible toy sales worldwide
Adult spending is a leading source of new demand because grown buyers now purchase toys for themselves as well as for children. The Toy Association published figures in January 2026 showing collectibles sales up 32% in 2025, taking the category to almost 19% of toy dollar sales across 12 tracked countries. Nearly 40% of European consumers bought toys for themselves or another adult during 2025, the same release said. All 12 tracked countries grew for the first time in that series, which ended three straight years of decline. As a result, toy shelves once planned around children now carry limited figures, blind boxes and trading cards aimed at older collectors with their own spending power.
Pokémon and Labubu show the pull of franchise IP
Entertainment franchises turn ordinary merchandise into repeat purchases, and that effect drives volume across the mass tier. The Pokémon Company said about 10 billion cards were produced in the fiscal year ended March 31, 2026, taking lifetime output past 85 billion cards across more than 90 countries and regions, according to PokeGuardian. Pop Mart disclosed in February 2026 that it sold more than 100 million Labubu units in 2025, within over 400 million units across all its characters, according to TechNode. Licensed toys reached 37% of global toy sales in 2025, a record share, and Pokémon ranked as the top property, The Toy Association reported. This pull also reaches action figures, where fans often buy by character rather than by age group.
Rarity and provenance attract alternative-asset buyers
Buyers who treat rare objects as stores of value add a second layer of demand, although returns differ sharply by category. Knight Frank's Luxury Investment Index fell 0.4% in 2025 but stood 38.6% higher over 10 years. Within its April 2026 commentary, major fine art auction sales rose 11% and a Patek Philippe watch index gained 12.1%, while fine wine fell 2.5%. A Kobe Bryant and Michael Jordan Dual Logoman card sold for USD 12.93 million at Heritage Auctions in 2025, a public auction record for a sports card, according to cllct. Because results vary this widely, buyers increasingly favor rarity, provenance and relative value over momentum, as ThinkAdvisor noted in April 2026.
Scanning tools and online bidding widen collector access
Digital tools have lowered the cost of identifying, pricing and buying items, which brings casual owners into the market. eBay said on its Oct. 28, 2026, earnings call that collectibles were its largest growth contributor in the third quarter, and that its AI card scanning tool had passed 130 million scans. Heritage Auctions passed 2 million registered online bidders in May 2025, according to cllct. Art remains slower to move, since online sales of USD 9.2 billion made up only 15% of art sales in 2025, according to Art Basel and UBS. This gap suggests further room in higher-value categories, where buyers still expect physical inspection and trusted intermediaries before committing large sums to a purchase.
Card games and live selling are changing how items trade
Collectibles market trends shift toward trading card games
The clearest collectibles market trend of the past two years is the shift from sports cards toward trading card games. GemRate data reported by cllct show major graders handled about 26.6 million cards in 2025, with card games and non-sports items at 16.8 million against 10 million sports cards. Pokémon alone accounted for more than 16.1 million cards, about 60% of the total. Sports Illustrated reported that sports card grading fell 12% in 2025, while card game and non-sports grading rose 95%. CGC benefited most, as its volume rose 121% to 4.92 million cards and gave it about 25% of card game grading. In turn, grading capacity has become a competitive issue for every company that sells or resells these cards.
Live selling emerges as a new collector channel
Live video selling is on the rise because collectors want to see items, ask questions and bid in real time. eBay said on its October 2026 earnings call that eBay Live had another record quarter, with merchandise volume growth well into triple digits. The company also added multistreaming to YouTube, Facebook, Instagram and Twitch, along with AI moderation of chat, audio and video. Card Ladder data cited by cllct showed that eBay held about 76% of September 2025 trading card sales across the three platforms it compared, against about 14% at Fanatics Collect and about 10% at Goldin. These gaps show how strongly card liquidity has gathered on the largest platform.
World Cup and league licenses open a sports card opportunity
Sports licensing offers publishers and retailers a clear opportunity, especially around major events. Panini's 2026 FIFA World Cup album holds 980 stickers and sells in about 130 countries, and Al Jazeera estimated in April 2026 that a buyer may need more than 1,000 packets to finish it. CardPulse reported in June 2026 that packs had sold out across Spain while Panini printed around the clock. Fanatics licenses for NFL cards took effect in April 2026, according to Sports Collectors Daily, which adds a new flagship product to the licensed sports merchandise chain. Retailers and breakers that secure early allocation therefore stand to gain the most from these event-driven buying cycles.
Authentication and Gulf sales create fresh openings for sellers
Authentication services and new auction venues offer a second opportunity for sellers. eBay said its Authenticity Guarantee passed 20 million inspected items in July 2026 and launched for U.S. coins in August 2026, covering eligible graded coins and raw U.S. coins priced at USD 500 or more. Extending it to lower-priced cards lifted eligible U.S. sold items by more than 20%. Sotheby's first Abu Dhabi Collectors' Week in December 2025 drew bidders from 35 countries, with luxury watches such as a Patek Philippe Star Caliber 2000 set reaching USD 11.9 million. Together these moves bring new buyers into categories where trust once limited participation.
Fakes, duties and grading costs test buyer confidence
Counterfeits undermine trust in fast-selling lines
Fakes undermine buyer trust because many purchases are made from photos or from unfamiliar sellers. U.S. Customs and Border Protection seized 11,134 counterfeit Labubu dolls at Seattle on Aug. 26, 2025, with a suggested retail value of more than USD 500,000. Europol's 2025 review of Operation LUDUS counted nearly 50 million illicit toys worth close to EUR 150 million across its editions. Brand owners and marketplaces carry much of the enforcement cost, so inspection programs remain the main defense.
Duty changes raise the cost of cross-border parcels
Cross-border trade became costlier after the United States ended its USD 800 duty-free threshold for low-value parcels on Aug. 29, 2025, according to Canadian Stamp News. Postal shipments faced a country duty rate or a flat USD 80 to USD 200 charge during a six-month transition. Stamps usually remain tariff-exempt, yet mixed parcels can still attract fees. More than half of art dealers also reported higher indirect costs from taxes, duties and administration, according to Art Basel and UBS, which squeezes small sellers first.
Rising grading fees and longer waits squeeze card owners
Grading has become a cost and timing bottleneck for card owners. PSA raised its Value Bulk price from USD 21.99 to USD 24.99 on Feb. 10, 2026, months after a September 2025 increase, according to Cardlines and it lengthened Value Plus turnaround from 40 to 45 business days. Lower-value cards may therefore no longer justify the cost of submission. Sports Illustrated suggested that turnaround times may be one reason collectors are spreading submissions across rival graders, which supports competition but complicates price comparison.
Concentration and price swings carry long-term risk
Market power and price volatility both worry buyers with long holding periods. Collectors' purchase of Beckett left it with roughly 80% of cards graded by the major authenticators, and Sports Illustrated reported that one congressman raised monopoly concerns. Digital assets show how fast sentiment can turn, since CryptoSlam data cited by Cointelegraph put 2025 NFT sales at USD 5.63 billion, down about 37% from 2024. Sellers holding speculative stock face the largest losses, so diversified inventories and transparent price data matter more.
North America leads as Asia Pacific gains ground
| Region | Value, 2025 (USD billion) | Share, 2025 | CAGR, 2026–2035 |
|---|---|---|---|
| North America | 123.11 | 38.0% | 6.26% |
| Asia Pacific | 93.95 | 29.0% | 7.66% |
| Europe | 74.51 | 23.0% | 5.86% |
| Middle East & Africa | 17.82 | 5.5% | 7.46% |
| Latin America | 14.58 | 4.5% | 7.16% |
North America leads on art sales and card grading
North America held 38.0% of 2025 value and grows at 6.26% a year, the result of deep art, card and resale activity. The United States accounted for 44% of global art sales in 2025, or USD 26.0 billion, according to Art Basel and UBS. GameStop began accepting PSA submissions at select stores in October 2024 and reached 1 million graded cards by May 2025, according to cllct. Canada and Mexico also sit among the 12 toy markets that all grew during 2025.
Asia Pacific grows fastest on designer toys and cards
Asia Pacific held 29.0% of 2025 value and grows fastest at 7.66% a year, because toy and card demand offsets a softer art market. China's art sales rose just over 1% to USD 8.5 billion in 2025, according to Art Basel and UBS, and Christie's reported a 3% decline in spending by Asia Pacific buyers. Growth therefore leans on brands such as Pop Mart, which reached more than 100 countries and regions from six supply chain bases by the end of 2025.
Europe combines mature art trade with adult toy buyers
Europe held 23.0% of 2025 value and grows at 5.86% a year, the slowest pace among the regions because art and stamps weigh more heavily in its mix. The U.K. recorded USD 10.5 billion of art sales in 2025, up 2%, according to Art Basel and UBS. Adult toy buying adds newer demand, while eBay expanded its card scanning tool to the U.K. in 2026. Panini sticker shortages in Spain and strong interest in Italy show how event demand travels across the region.
Latin America responds strongly to sticker and toy demand
Latin America held 4.5% of 2025 value and grows at 7.16% a year from a smaller base. Brazil and Mexico are both among the 12 tracked toy markets that grew in 2025, according to The Toy Association. CardPulse reported in June 2026 that World Cup sticker shortages hit markets including Brazil harder than Spain, which points to deep popular demand. Lower incomes keep most spending in the mass tier, so affordable packs and licensed figures matter more than high-value auction lots.
Middle East & Africa builds on new Gulf auction events
Middle East & Africa held 5.5% of 2025 value and grows at 7.46% a year, led by Gulf collectors. Sotheby's Origins sale in Diriyah drew collectors from 45 countries in February 2025, and nearly one-third of lots bought by Saudi buyers, according to Arab News. The Abu Dhabi event followed in December 2025, and nearly a quarter of its bidders came from the UAE. Africa remains a far smaller contributor to the regional value estimated here.
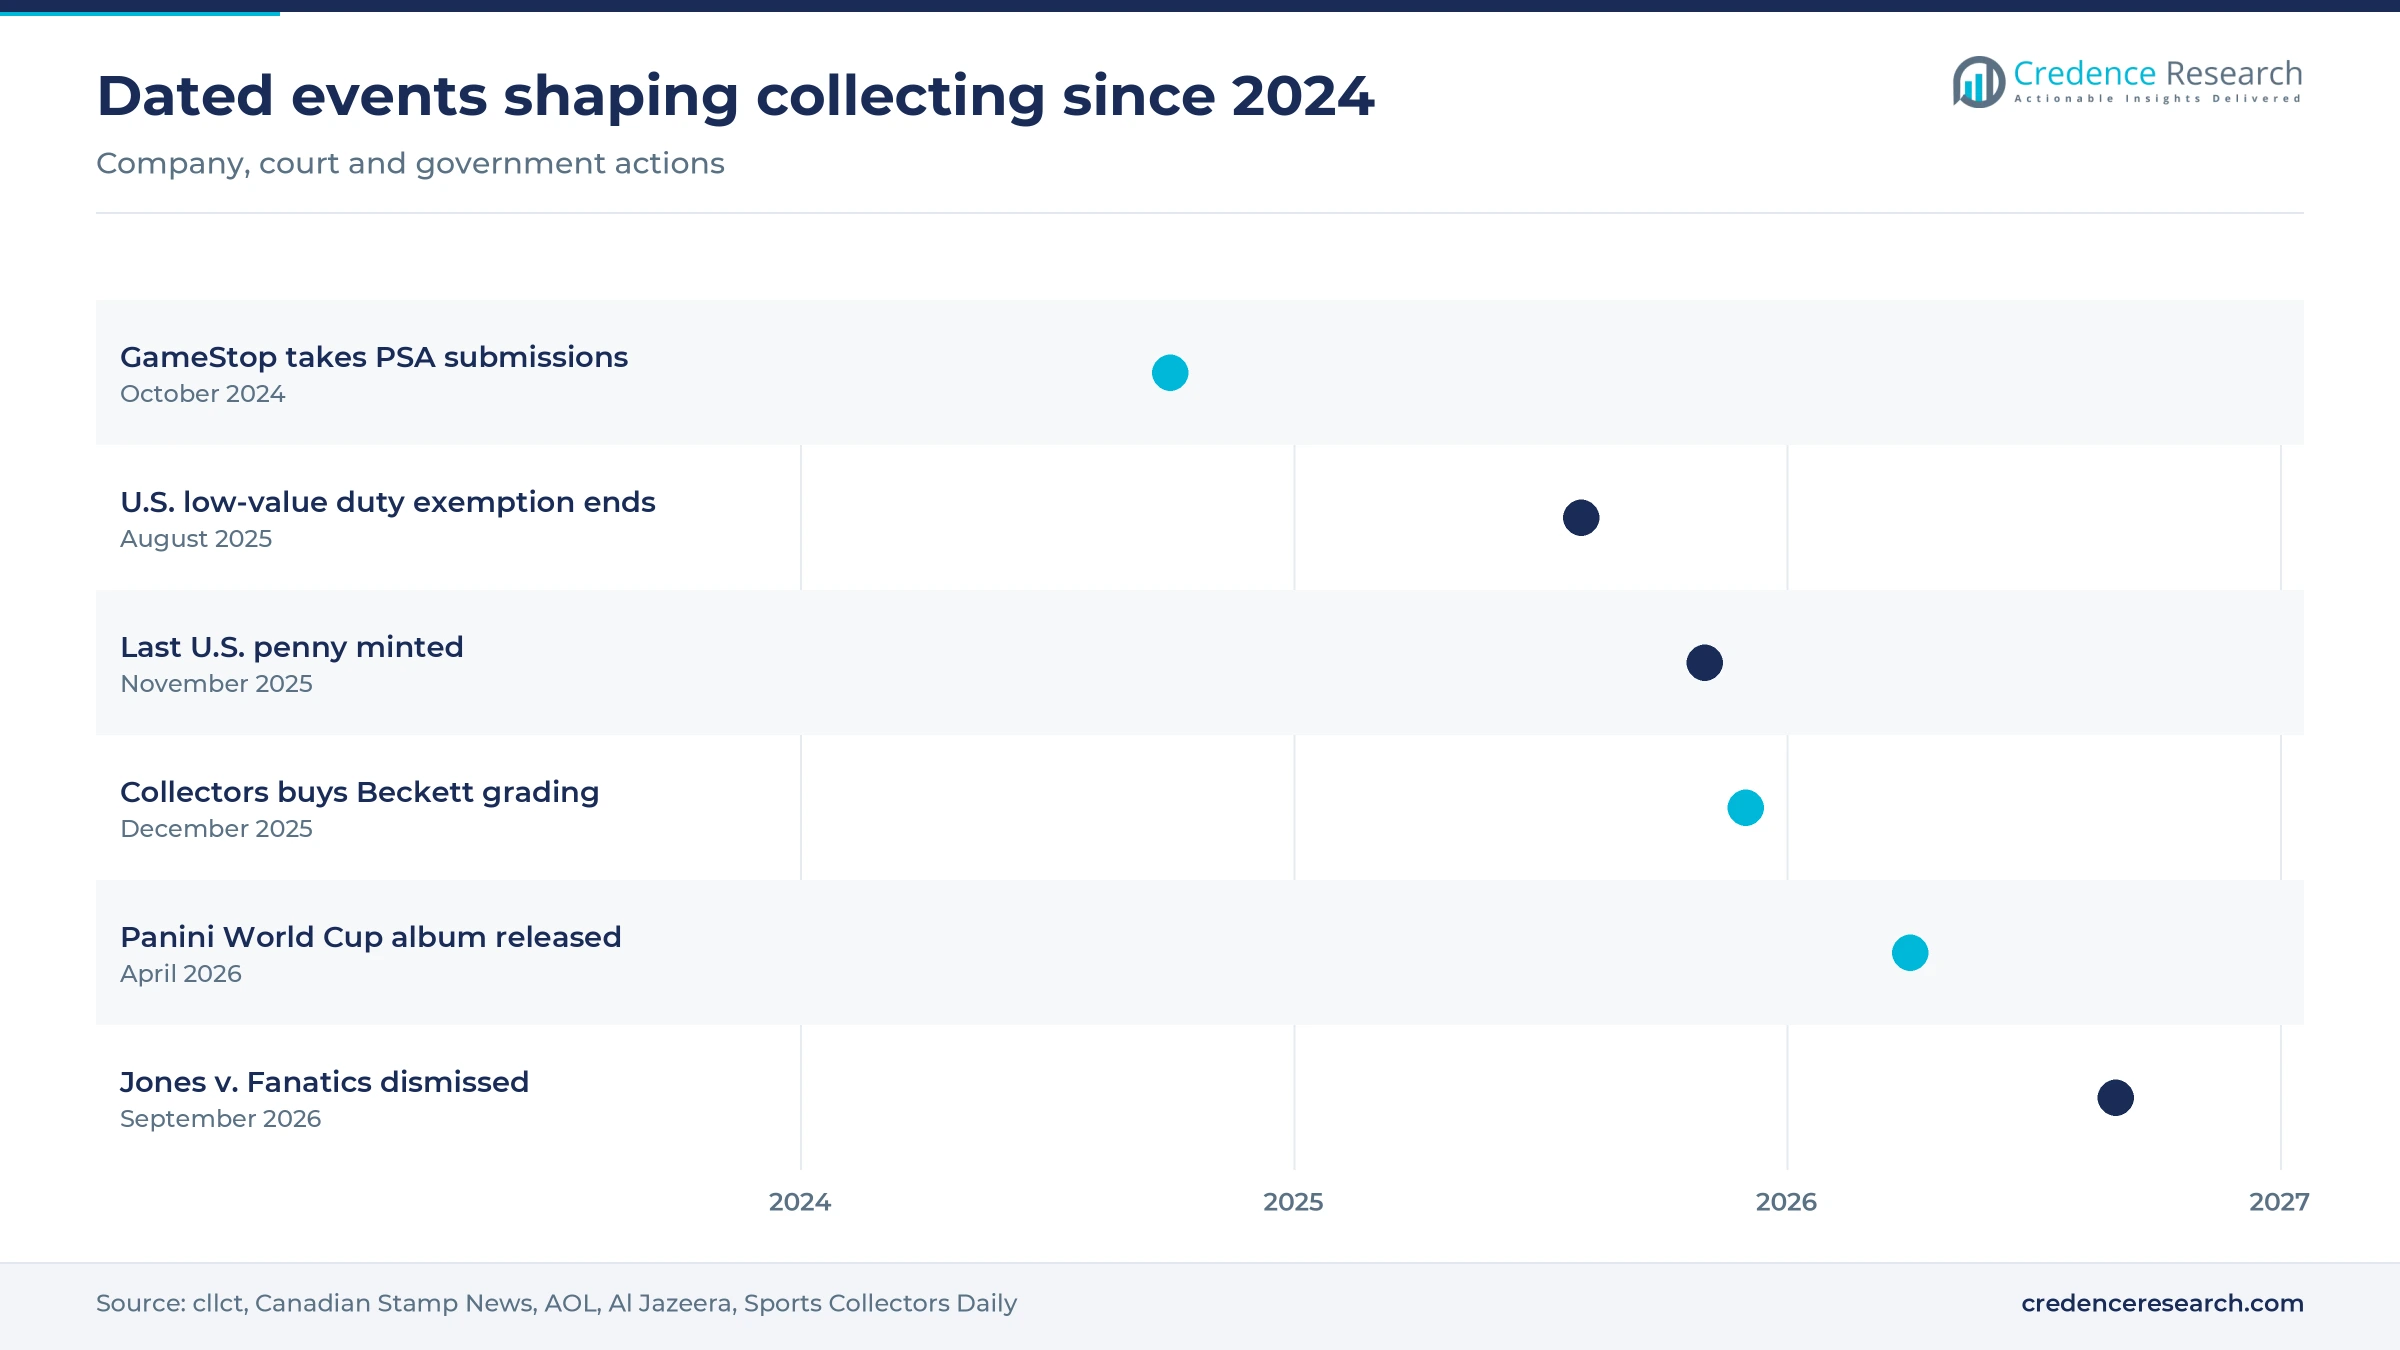
Licenses, grading deals and new sales venues since 2024
| Development | Status and market relevance |
|---|---|
| In October 2024, GameStop began accepting PSA grading submissions at select stores under a partnership announced that May. | The program reached 1 million graded cards in May 2025, which widened retail access to grading. |
| In November 2025, the U.S. Mint in Philadelphia finished minting the penny, and 232 final sets were sold at auction in December. | The sale gave modern coin collecting an unusual burst of public attention. |
| In December 2025, Collectors acquired the grading, media and magazine businesses of Beckett. | The purchase placed PSA, SGC and Beckett under one parent company. |
| In April 2026, fully licensed NFL card rights moved to Fanatics, and Panini released its 980-sticker World Cup album. | Both products lifted sports card and sticker attention ahead of the tournament and the NFL season. |
| In September 2026, Chief U.S. District Judge Laura Taylor Swain dismissed the Jones v. Fanatics collector class action for lack of standing. | The court did not rule on the antitrust claims themselves, and Panini's separate suit continues. |
Scanning and authentication tools are lowering buyer risk
- AI card scanning lets sellers identify and list cards from a phone, and eBay reported more than 130 million scans by October 2026.
- Authenticity inspection adds a physical check before delivery, with eBay now covering lower-priced cards in the U.S. and U.K.
- Vault and grading add-ons give eligible cards bought on eBay optional PSA grading and vault storage, which suits buyers who plan to resell later.
- Digital collectibles remain a volatile branch beside gaming NFTs.
Need a Custom Version of This Report?
Tailor the scope, geography, or segments to your exact requirements.
- Custom geography or segment scope
- Direct access to our analyst team
Auction houses, IP owners and platforms chase collectors
Competition splits into four groups that increasingly overlap with one another. Auction houses such as Sotheby's, Christie's and Heritage Auctions compete for consignments through record prices and online bidding. IP owners and publishers, including The Pokémon Company, Hasbro, Pop Mart, Funko and Panini, compete for shelf space and repeat purchases through character releases. Fanatics now holds NFL card rights and has moved into resale through Fanatics Collect, which puts it against eBay and Goldin. Collectors, through PSA, SGC and Beckett, controls most card authentication among major graders. Tariffs are shaping margins as well, and Funko credited tariff mitigation plans for a 40.2% gross margin in the third quarter of 2025, according to The Toy Book. Hasbro's chief executive said its Final Fantasy crossover for the Magic card game had become the best-selling set in 2025, according to Wargamer, which shows how licensing now drives card game releases.
Companies profiled and their roles in this market
| Company | Type | Role in the market |
|---|---|---|
| Sotheby's | Auction house | Art, watches, handbags and new Gulf sales in Abu Dhabi and Diriyah |
| Christie's | Auction house | Art and luxury sales with a large private sales business |
| Heritage Auctions | Auction house | Coins, comics, cards and entertainment memorabilia |
| Hasbro | IP owner | Magic card game, including the Final Fantasy crossover set |
| Funko | Toy maker | Licensed figures, with tariff mitigation plans since 2025 |
| Pop Mart | Toy maker and retailer | Labubu and other designer toys through more than 700 stores |
| The Pokémon Company | IP owner | Pokémon Trading Card Game, the largest graded card category |
| Collectors (PSA) | Authenticator | PSA, SGC and Beckett grading services |
| eBay | Marketplace | Card resale, eBay Live, Goldin, TCGplayer and Authenticity Guarantee |
| Fanatics | Publisher and marketplace | NFL card rights and Fanatics Collect resale |
| Panini | Publisher | FIFA World Cup sticker albums sold in about 130 countries |
| Stack's Bowers Galleries | Auction house | Numismatic sales, including the final U.S. penny sets |
Trust services will decide who captures the next buyers
Credence Research's view is that trust services will decide which companies capture the next wave of buyers. New collectors now arrive through toys and card games, and many of them buy low-priced items where a fake or a poor grade is costly relative to the purchase. Platforms that bundle inspection, grading and storage therefore hold an advantage over sellers competing on price alone. The main risk is concentration, because one parent now controls most card grading. Rival graders, including CGC, are likely to keep gaining volume if fees and waits continue to rise.
How the 2025 value and category splits were estimated
The report uses 2025 as the base year and 2035 as the forecast year. The 2025 value comes from the Credence Research model and brings the earlier 2024 estimate forward at the same growth rate, followed by a check against public data. Regional and segment splits are Credence Research estimates built from these public sources. Sources are company releases and earnings calls, auction results, trade press and public agency documents, and no interviews or surveys were conducted for this update.
Value nearly doubles by 2035 as cards and toys scale
The market is projected to rise from USD 345.67 billion in 2026 to USD 619.65 billion by 2035. Trading Cards and licensed toys should provide much of the added value, while art keeps the largest single share through its high unit prices. Asia Pacific is set to narrow the gap with North America as designer toy brands extend overseas. Growth will not be even, since franchise cycles can fade quickly, as the NFT decline showed. Sellers with reliable authentication, broad licensing and global logistics should therefore hold up best through those cycles.
Frequently Asked Questions
How big is the collectibles market?
What are the main collectibles market trends?
Which collectibles are performing best for investors?
What are the current collectible toy market trends?
Which region leads the collectibles market?
Do antiques and art count as collectibles?
Which companies lead the collectibles market?
What are the main challenges for collectors and sellers?
Table of Content
Chapter 1 Market Segmentation
- 1.1 Segmentation Framework
- 1.1.1 Product and Service Classification
- 1.1.2 Application and End-Use Classification
- 1.1.3 Technology and Solution Classification
- 1.1.4 Customer and Distribution Channel Classification
- 1.1.5 Geographic Segmentation
- 1.1.6 Market Segment Definitions and Boundaries
- 1.2 By Product Type
- 1.2.1 Art & Antiques
- 1.2.2 Coins & Currency
- 1.2.3 Trading Cards
- 1.2.4 Toys & Action Figures
- 1.2.5 Sports Memorabilia
- 1.2.6 Comics
- 1.2.7 Stamps
- 1.2.8 Autographs
- 1.2.9 Others
- 1.3 By Price Range
- 1.3.1 Mass Collectibles
- 1.3.2 Premium Collectibles
- 1.3.3 Ultra-Premium Collectibles
- 1.4 By End User
- 1.4.1 Individual Collectors
- 1.4.2 Hobbyists
- 1.4.3 Investors
- 1.4.4 Museums & Institutions
- 1.5 By Sales Channel
- 1.5.1 Offline Stores
- 1.5.2 Online Marketplaces
- 1.5.3 Auction Houses
- 1.5.4 Others
Chapter 2 Introduction
- 2.1 Report Objectives and Scope
- 2.2 Product Definition and Industry Terminology
- 2.3 Market Inclusions and Exclusions
- 2.4 Research Process
- 2.4.1 Primary Research and Expert Interviews
- 2.4.2 Secondary Research and Source Review
- 2.4.3 Top-Down and Bottom-Up Estimation
- 2.4.4 Data Triangulation and Verification
- 2.5 Market Size Measurement Basis
- 2.5.1 2025: USD 323.97 billion → 2035: USD 619.65 billion
- 2.6 Historical and Forecast Reference Periods
- 2.6.1 Historical Period: 2018-2025
- 2.6.2 Base Year: 2025
- 2.6.3 Forecast Period: 2025-2035
- 2.7 Research Assumptions and Limitations
Chapter 3 Executive Summary
- 3.1 Market Snapshot and Key Findings
- 3.2 Base-Year Market Size, 2025
- 3.3 Forecast Market Size, 2035
- 3.4 Revenue and Volume Growth Outlook
- 3.5 Key Demand and Supply Indicators
- 3.6 Leading Market Segments
- 3.7 Fastest-Growing Market Opportunities
- 3.8 Regional Performance Highlights
- 3.9 Technology and Industry Transformation
- 3.10 Competitive Landscape Summary
- 3.11 Analyst View and Strategic Implications
Chapter 4 Global Collectibles Market Trends and Developments
- 4.1 Historical Industry Development, 2018-2025
- 4.2 Recent Market Trends and Developments
- 4.3 Demand and Customer Behavior Trends
- 4.4 Technology and Product Innovation
- 4.5 Artificial Intelligence, Automation and Digitalization
- 4.6 Local Manufacturing and Supply Chain Realignment
- 4.7 Industry Partnerships, Mergers and Acquisitions
- 4.8 Sustainability and Circular Economy Developments
- 4.9 Government and Private Sector Investment Trends
- 4.10 Emerging Business Models and Commercialization
- 4.11 Industry Developments and Announcements
Chapter 5 Global Collectibles Market Production, Supply and Demand Analysis
- 5.1 Demand Trend and Consumption Analysis, 2018-2025
- 5.2 Demand Forecast, 2025-2035
- 5.3 Production and Output Trend, 2018-2025
- 5.4 Production and Output Forecast, 2025-2035
- 5.5 Installed Capacity and Capacity Utilization
- 5.6 Company-Wise Production Plants and Statistics
- 5.6.1 Installed Production Capacity
- 5.6.2 Actual Production
- 5.6.3 Planned Capacity and Expansion Targets
- 5.7 Supply Chain Structure and Procurement Trends
- 5.8 Supply-Demand Gap and Bottlenecks
- 5.9 Import Dependence and Sourcing Structure
- 5.10 Contract Manufacturing and Outsourcing
- 5.11 Regional Supply and Demand Concentration
Chapter 6 Global Collectibles Market Pricing Analysis
- 6.1 Pricing Structure and Measurement
- 6.2 Historical Pricing Trends, 2018-2025
- 6.3 Pricing Outlook, 2025-2035
- 6.4 Average Selling Price and Unit Economics
- 6.5 Pricing by Product and Market Segment
- 6.6 Geographic Pricing Differences
- 6.7 Key Input, Energy, Labor and Logistics Costs
- 6.8 Contract Pricing and Purchasing Models
- 6.9 Pricing Sensitivity and Competitive Positioning
- 6.10 Price, Margin and Profitability Implications
Chapter 7 Global Collectibles Market Dynamics
- 7.1 Market Growth Drivers
- 7.1.1 Demand-Side Drivers
- 7.1.2 Technology and Innovation Drivers
- 7.1.3 Infrastructure and Investment Drivers
- 7.1.4 Regulatory and Policy Drivers
- 7.2 Market Restraints
- 7.2.1 Cost and Affordability Constraints
- 7.2.2 Technology and Adoption Barriers
- 7.2.3 Supply Chain and Operational Constraints
- 7.3 Market Challenges
- 7.3.1 Competitive Pressure and Margin Erosion
- 7.3.2 Skills, Infrastructure and Implementation Gaps
- 7.4 Emerging Market Opportunities
- 7.5 Market Dynamics Impact and Time-Horizon Assessment
Chapter 8 Global Collectibles Value Chain Analysis
- 8.1 Industry Value Chain Overview
- 8.2 Upstream Suppliers and Critical Inputs
- 8.3 Technology and Component Providers
- 8.4 Manufacturing or Service Delivery
- 8.5 Distribution, Channel Partners and Integrators
- 8.6 Downstream Applications and End Users
- 8.7 Value Addition and Profit Pools
- 8.8 Vertical Integration and Outsourcing
- 8.9 Supplier Concentration and Risk
- 8.10 Supply Chain Localization and Resilience
Chapter 9 Global Collectibles Market Regulations and Policies
- 9.1 Relevant Laws, Standards and Compliance Frameworks
- 9.2 Product, Service, Safety and Quality Requirements
- 9.3 Government Policies, Incentives and Subsidies
- 9.4 Imports, Exports and Trade Barriers
- 9.5 Public Procurement and Local Content Requirements
- 9.6 Environmental and Sustainability Compliance
- 9.7 Upcoming Policy Changes and Market Implications
Chapter 10 Global Collectibles Market Hotspots and Opportunities
- 10.1 Market Opportunity Mapping and Growth Hotspots
- 10.2 High-Growth Applications and Customer Groups
- 10.3 Underserved Markets and White-Space Opportunities
- 10.4 Emerging Technology and Product Opportunities
- 10.5 New Capacity and Investment Hotspots
- 10.6 Market Entry and Expansion Opportunities
- 10.7 Distribution and Partnership Opportunities
- 10.8 Near-Term and Long-Term Commercial Potential
- 10.9 Opportunity Attractiveness and Execution Risks
Chapter 11 Global Collectibles Market Outlook, 2025-2035
- 11.1 Market Size and Analysis
- 11.1.1 Revenue (Market Measurement: 2025: USD 323.97 billion → 2035: USD 619.65 billion)
- 11.1.2 Market Volume and Quantity Sold
- 11.1.3 Historical Market Size, 2018-2025
- 11.1.4 Base-Year Market Size, 2025
- 11.2 Market Forecast, 2025-2035
- 11.2.1 Revenue Forecast to 2035
- 11.2.2 Volume Forecast to 2035
- 11.2.3 CAGR and Year-on-Year Growth
- 11.2.4 Incremental Revenue Opportunity
- 11.3 Forecast Assumptions and Scenario Analysis
- 11.3.1 Base-Case Forecast
- 11.3.2 Optimistic and Conservative Scenarios
- 11.3.3 Technology, Pricing and Policy Sensitivities
- 11.4 Market Attractiveness and Growth Outlook
Chapter 12 Global Collectibles Market Segmentation and Outlook
- 12.1 Segmentation Summary and Market Shares, 2025
- 12.2 Largest and Fastest-Growing Segments
- 12.3 By Product Type - Market Size and Forecast, 2025-2035
- 12.3.1 Segment Definition and Scope
- 12.3.2 Historical Market Size, 2018-2025
- 12.3.3 Revenue Forecast, 2025-2035
- 12.3.4 Volume Forecast, 2025-2035
- 12.3.5 Base-Year Market Share, 2025
- 12.3.6 Segment CAGR and Growth Drivers
- 12.3.7 Subsegment Market Size and Forecast
- 12.3.7.1 Art & Antiques
- 12.3.7.2 Coins & Currency
- 12.3.7.3 Trading Cards
- 12.3.7.4 Toys & Action Figures
- 12.3.7.5 Sports Memorabilia
- 12.3.7.6 Comics
- 12.3.7.7 Stamps
- 12.3.7.8 Autographs
- 12.3.7.9 Others
- 12.3.8 Subsegment Pricing and Adoption Trends
- 12.3.9 Leading Suppliers and Competition
- 12.3.10 Regional Demand and Opportunities
- 12.4 By Price Range - Market Size and Forecast, 2025-2035
- 12.4.1 Segment Definition and Scope
- 12.4.2 Historical Market Size, 2018-2025
- 12.4.3 Revenue Forecast, 2025-2035
- 12.4.4 Volume Forecast, 2025-2035
- 12.4.5 Base-Year Market Share, 2025
- 12.4.6 Segment CAGR and Growth Drivers
- 12.4.7 Subsegment Market Size and Forecast
- 12.4.7.1 Mass Collectibles
- 12.4.7.2 Premium Collectibles
- 12.4.7.3 Ultra-Premium Collectibles
- 12.4.8 Subsegment Pricing and Adoption Trends
- 12.4.9 Leading Suppliers and Competition
- 12.4.10 Regional Demand and Opportunities
- 12.5 By End User - Market Size and Forecast, 2025-2035
- 12.5.1 Segment Definition and Scope
- 12.5.2 Historical Market Size, 2018-2025
- 12.5.3 Revenue Forecast, 2025-2035
- 12.5.4 Volume Forecast, 2025-2035
- 12.5.5 Base-Year Market Share, 2025
- 12.5.6 Segment CAGR and Growth Drivers
- 12.5.7 Subsegment Market Size and Forecast
- 12.5.7.1 Individual Collectors
- 12.5.7.2 Hobbyists
- 12.5.7.3 Investors
- 12.5.7.4 Museums & Institutions
- 12.5.8 Subsegment Pricing and Adoption Trends
- 12.5.9 Leading Suppliers and Competition
- 12.5.10 Regional Demand and Opportunities
- 12.6 By Sales Channel - Market Size and Forecast, 2025-2035
- 12.6.1 Segment Definition and Scope
- 12.6.2 Historical Market Size, 2018-2025
- 12.6.3 Revenue Forecast, 2025-2035
- 12.6.4 Volume Forecast, 2025-2035
- 12.6.5 Base-Year Market Share, 2025
- 12.6.6 Segment CAGR and Growth Drivers
- 12.6.7 Subsegment Market Size and Forecast
- 12.6.7.1 Offline Stores
- 12.6.7.2 Online Marketplaces
- 12.6.7.3 Auction Houses
- 12.6.7.4 Others
- 12.6.8 Subsegment Pricing and Adoption Trends
- 12.6.9 Leading Suppliers and Competition
- 12.6.10 Regional Demand and Opportunities
- 12.7 Segment Growth Comparison
- 12.8 Segment Attractiveness and Priority Matrix
Chapter 13 Global Collectibles End-Use and Application Market Outlook
- 13.1 End-Use Industry and Customer Demand Structure
- 13.2 Leading Applications and Customer Groups
- 13.3 End-Use Market Size, Share and Forecast
- 13.4 Major End-Use Industry Deep Dives
- 13.4.1 Customer Requirements and Use Cases
- 13.4.2 Demand and Replacement Cycles
- 13.4.3 Technical and Regulatory Considerations
- 13.4.4 Purchasing and Procurement Models
- 13.4.5 Leading Vendors and Distribution Channels
- 13.4.6 Forecast and Commercial Opportunities
- 13.5 Emerging Applications and Cross-Segment Demand
- 13.6 End-Use Industry Investment Priorities
Chapter 14 Global Collectibles Geographic Market Outlook, 2025-2035
- 14.1 Regional Market Size and Share, 2025
- 14.2 Regional Market Forecast, 2025-2035
- 14.3 Regional Pricing, Production and Demand Differences
- 14.4 North America
- 14.4.1 United States
- 14.4.2 Canada
- 14.4.3 Mexico
- 14.5 Europe
- 14.5.1 Germany
- 14.5.2 France
- 14.5.3 Italy
- 14.5.4 United Kingdom
- 14.5.5 Spain
- 14.5.6 Poland
- 14.5.7 Russia
- 14.5.8 Netherlands
- 14.5.9 Belgium
- 14.5.10 Sweden
- 14.5.11 Denmark
- 14.5.12 Norway
- 14.5.13 Rest of Europe
- 14.6 Asia Pacific
- 14.6.1 China
- 14.6.2 India
- 14.6.3 Japan
- 14.6.4 South Korea
- 14.6.5 Thailand
- 14.6.6 Indonesia
- 14.6.7 Vietnam
- 14.6.8 Malaysia
- 14.6.9 Australia
- 14.6.10 Rest of Asia Pacific
- 14.7 Latin America
- 14.7.1 Brazil
- 14.7.2 Argentina
- 14.7.3 Colombia
- 14.7.4 Chile
- 14.7.5 Rest of Latin America
- 14.8 Middle East
- 14.8.1 Saudi Arabia
- 14.8.2 United Arab Emirates
- 14.8.3 Turkey
- 14.8.4 Israel
- 14.8.5 Iran
- 14.8.6 Rest of the Middle East
- 14.9 Africa
- 14.9.1 South Africa
- 14.9.2 Egypt
- 14.9.3 Nigeria
- 14.9.4 Morocco
- 14.9.5 Rest of Africa
- 14.10 Regional Investment, Policy and Supply Chain Differences
- 14.11 Regional Competitive Landscape
- 14.12 Geographic Growth Hotspots
Chapter 15 Global Collectibles Technology, Innovation and Sustainability Outlook
- 15.1 Technology Landscape and Maturity
- 15.2 Product, Process and Service Innovation
- 15.3 AI, Automation and Digital Tools in the Industry
- 15.4 Technology Adoption and Performance Benchmarking
- 15.5 Innovation Pipeline and R&D Investment
- 15.6 Patent and Intellectual Property Trends
- 15.7 Energy Efficiency and Resource Management
- 15.8 Sustainability, Recycling and Circularity
- 15.9 Technology Roadmap, 2025-2035
- 15.10 Risks of Obsolescence and Technology Substitution
Chapter 16 Global Collectibles Market Key Strategic Imperatives
- 16.1 Growth and Market Entry Priorities
- 16.2 High-Return Products and Segments
- 16.3 Pricing, Profitability and Cost Optimization
- 16.4 Technology Investment and Product Differentiation
- 16.5 Supply Chain Localization and Resilience
- 16.6 Distribution and Customer Acquisition
- 16.7 Partnership, Acquisition and Capacity Strategy
- 16.8 Regional Expansion Priorities
- 16.9 Short-, Medium- and Long-Term Actions
Chapter 17 Competition Outlook
- 17.1 Industry Competition Characteristics
- 17.2 Market Structure and Concentration
- 17.3 Market Share and Competitive Positioning, 2025
- 17.4 Company-Wise Revenue and Product Benchmarking
- 17.5 Production and Service Capacity Benchmarking
- 17.6 Technology, Pricing and Differentiation
- 17.7 Regional Footprint and Distribution Strength
- 17.8 Mergers, Acquisitions and Strategic Alliances
- 17.9 New Entrants and Competitive Threats
- 17.10 Porter's Five Forces and Industry Attractiveness
- 17.11 Competitive Outlook, 2025-2035
Chapter 18 Company Profiles
- 18.1 Company Coverage and Selection Criteria
- 18.2 Sotheby's
- 18.2.1 Business Description
- 18.2.2 Company Ownership and Geographic Presence
- 18.2.3 Product and Service Portfolio
- 18.2.4 Manufacturing and Operating Footprint
- 18.2.5 Production Capacity and Expansion Plans
- 18.2.6 Financial Performance and Investment
- 18.2.7 Market Share and Competitive Position
- 18.2.8 Technology and Innovation Capabilities
- 18.2.9 Strategic Alliances or Partnerships
- 18.2.10 Recent Developments
- 18.2.11 Growth Strategy and Outlook
- 18.3 Christie's
- 18.4 Heritage Auctions
- 18.5 Hasbro
- 18.6 Funko
- 18.7 Pop Mart
- 18.8 The Pokémon Company
- 18.9 Collectors (PSA)
- 18.10 eBay
- 18.11 Fanatics
- 18.12 Panini
- 18.13 Stack's Bowers Galleries
- 18.14 Other Relevant Market Participants
Note: Every listed company is profiled on the structure shown under the first company. The company list is preliminary and may change based on research findings, market developments, data availability and client requirements.
Chapter 19 Disclaimer
- 19.1 Research and Forecast Disclaimer
- 19.2 Data Source and Estimation Limitations
Note: The depth of individual sections depends on data availability for this market. Volume, capacity, trade and other unit-based metrics are included where applicable.