
| REPORT ATTRIBUTE | DETAILS |
|---|---|
| Historical Period | 2019-2022 |
| Base Year | 2023 |
| Forecast Period | 2024-2032 |
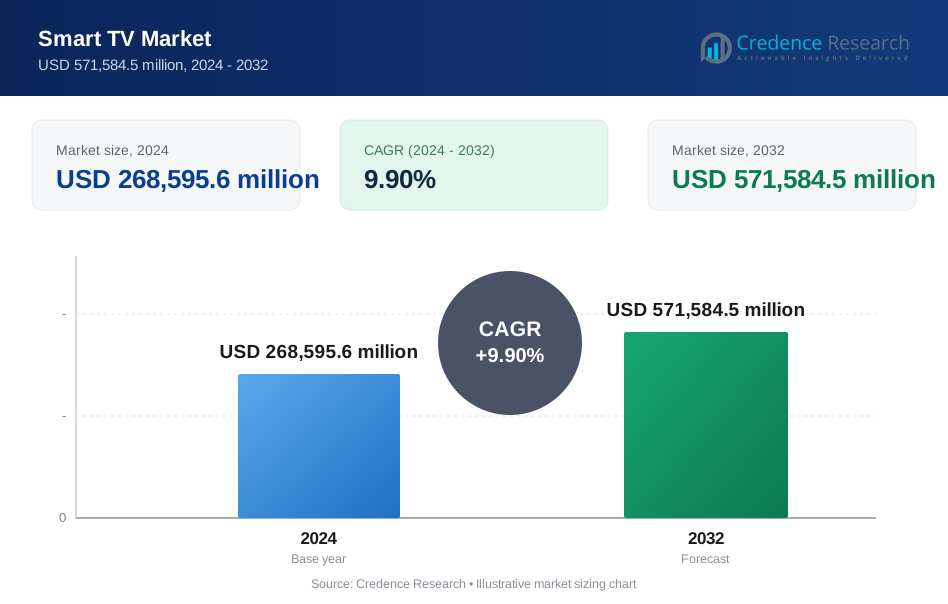
| Smart TV Market Size 2024 | USD 268,595.6 Million |
| Smart TV Market, CAGR | 9.90% |
| Smart TV Market Size 2032 | USD 571,584.5 Million |
Market Overview
The Smart TV market is projected to grow from USD 268,595.6 million in 2024 to USD 571,584.5 million by 2032, achieving a compound annual growth rate (CAGR) of 9.90%.
The Smart TV market is propelled by advancements in technology and increasing consumer demand for enhanced viewing experiences. Key drivers include the integration of artificial intelligence and machine learning for personalized content recommendations, as well as the proliferation of streaming services and high-definition content. Trends such as the adoption of 4K and 8K resolutions, smart home integration, and the growing popularity of voice-controlled interfaces are further fueling market expansion. Additionally, the rise in disposable incomes and the trend towards larger screen sizes are contributing to the robust growth of the Smart TV sector.
The Smart TV market is characterized by significant regional activity, with key players establishing strong positions across various geographies. In North America, major companies such as LG Electronics Inc., Samsung Electronics Co. Ltd., and Sony Corporation dominate, driven by advanced technology adoption and high consumer demand. Europe sees robust participation from Philips N.V., Panasonic Corporation, and TCL Electronics Holdings Limited, reflecting the region's focus on innovation and energy efficiency. In Asia-Pacific, Haier Inc., Hisense International, and Toshiba Visual Solutions lead due to the region's large consumer base and competitive pricing. Each region's market is shaped by local preferences and technological advancements, creating a dynamic global landscape.
Market Drivers
Rising Demand for Connected Entertainment
The growing popularity of streaming services such as Netflix, Disney+, and Hulu has significantly increased the demand for smart TVs. For instance, streaming services have become a significant part of our daily lives. On average, Americans are dedicating a substantial three hours and nine minutes each day to streaming digital media. This engagement translates to over 21 hours per week equivalent to the commitment of a part-time job. An overwhelming 99% of U.S. households now subscribe to at least one or more streaming services.These platforms offer extensive libraries of on-demand content that can be seamlessly accessed through smart TVs connected to the internet. As consumers seek more flexible and personalized viewing experiences, smart TVs provide an ideal gateway to these services. Additionally, the trend of cord-cutting—where consumers, particularly younger demographics, opt to abandon traditional pay-TV subscriptions in favor of streaming options—further drives the market. Smart TVs address this shift by offering diverse entertainment options without the need for a cable box.
Technological Advancements and Improved User Experience
Technological innovations in smart TVs have greatly enhanced the user experience. For instance, manufacturers are incorporating innovations such as 8K resolution, HDR (High Dynamic Range), and AI-powered voice assistants to enhance the viewing experience and attract consumers. The continuous advancements in technology have led to the development of more sophisticated and feature-rich smart TVs. Voice control capabilities and user-friendly interfaces have also become standard, making navigation and content discovery more intuitive. Furthermore, many smart TVs are now optimized for gaming, with low input lag and compatibility with high-performance gaming consoles, catering to the growing mainstream popularity of video games.
Integration with Smart Home Ecosystems
Smart TVs are increasingly becoming integral components of smart home ecosystems. For instance, the integration of smart TVs with advanced control mechanisms and Building Management Systems (BMS) is a key trend in the market. They are designed to work seamlessly with voice assistants and other smart home devices, allowing users to control their televisions through voice commands and integrate them into broader home automation routines. This enhanced connectivity not only provides added convenience but also fosters a more interconnected and immersive entertainment experience. As smart home technology evolves, the ability of smart TVs to integrate into these systems becomes a significant driver of market growth.
Affordability and Increased Value Proposition
The competitive nature of the smart TV market has led to falling prices, making these advanced devices more accessible to a wider audience. With a broad range of features and price points available, consumers can find smart TVs that fit their budgets and needs. Beyond traditional television functionalities, smart TVs offer additional features such as web browsing, social media access, and gaming capabilities. This multifaceted value proposition entices consumers to upgrade from standard TVs, as smart TVs provide a comprehensive and enhanced entertainment experience at an increasingly affordable price.
Market Trends
Integration of Artificial Intelligence and Cloud Gaming
Artificial Intelligence (AI) is increasingly shaping the smart TV landscape by enhancing personalization and content recommendations. For instance, Samsung’s 2024 8K TVs feature a new processor, the NQ8 AI Gen3, which contains an on-device AI engine (Neural Processing Unit) that’s two times faster and has 8 times as many neural networks as the one used in last year’s 8K TVs. Moreover, 39.4% of Americans already use AI-empowered voice assistants, and the technology is growing more popular every day. AI-driven algorithms now analyze user viewing habits and preferences to suggest content that aligns with individual tastes. This includes advanced voice search capabilities utilizing natural language processing, which makes searching for content more intuitive. AI also tailors recommendations based on contextual factors such as the time of day, user profiles, and even local weather conditions, creating a more personalized viewing experience. Additionally, the integration of cloud gaming services, like Google Stadia and Microsoft xCloud, is revolutionizing the gaming experience on smart TVs. By allowing users to access high-end games directly through their TVs without the need for dedicated gaming consoles, smart TVs are expanding their functionality and appeal to a broader audience. This evolution not only enhances entertainment options but also positions smart TVs as central hubs for both viewing and gaming experiences.
Advancements in Smart TV Operating Systems and Display Technologies
The growth and competition among smart TV operating systems are driving significant innovation in the market. Major players such as LG (webOS), Samsung (Tizen), and Google (Android TV) are developing and refining their respective platforms, leading to improved features, user interface designs, and a broader range of available applications. Tizen is the leading TV streaming platform worldwide among smart TVs in use, with a market share of about 13 percent as of year-end 2020, followed by WebOS from LG. Android TV was the fastest-growing streaming OS in the US in 2022. This competition fosters continuous advancements and enhances the overall user experience. Concurrently, emerging display technologies are redefining the visual capabilities of smart TVs. Innovations like MicroLED displays offer superior brightness, contrast, and viewing angles compared to traditional LED TVs, while foldable and rollable displays provide flexible design options and space-saving solutions. Additionally, evolving form factors, such as curved screens and modular components, are anticipated to offer more customizable and immersive viewing experiences. As smart TVs integrate more deeply with smart home ecosystems and voice assistants, they increasingly serve as central hubs for managing home automation and security, further enhancing their value and functionality. These trends collectively push the boundaries of smart TV technology, making them more versatile and integral to modern digital lifestyles.
Market Challenges Analysis
Privacy Concerns and Security Vulnerabilities
Privacy concerns and data security issues pose significant challenges for the smart TV market. Smart TVs collect extensive user data, including viewing habits, app usage, and potentially even voice interactions. This raises concerns about how such data is handled and the potential for misuse, which can deter privacy-conscious consumers from purchasing these devices. Additionally, the connectivity of smart TVs makes them vulnerable to cyberattacks. Hackers may exploit these vulnerabilities to access user data or hijack the TV for malicious purposes. Addressing these concerns requires manufacturers to prioritize robust security measures and implement regular software updates to safeguard user data. Transparent privacy policies and user control over data settings are essential to build consumer trust and mitigate privacy risks.
Interoperability Issues and Technological Obsolescence
The proliferation of diverse smart TV operating systems often leads to interoperability and app compatibility issues. Apps developed for one platform may not be available on others, limiting user choices and functionalities and potentially frustrating consumers. Furthermore, the rapid pace of technological advancements results in frequent upgrade cycles, making smart TVs prone to becoming outdated quickly. This can deter consumers from investing in new models if they fear that their purchase will soon be obsolete. To address these challenges, industry-wide collaboration is needed to establish common standards for app development and content delivery, which can enhance interoperability. Manufacturers should also focus on sustainable practices, such as designing modular components and offering extended software support, to lengthen the lifespan of smart TVs and provide better value for consumers. Offering a range of products at various price points can also accommodate different budget levels, making advanced features more accessible and mitigating the impact of rising costs.
Market Segmentation Analysis:
By Resolution:
The Smart TV Market is segmented by resolution, with notable variations in consumer preferences and market demand. 4K UHD TVs lead the segment, driven by their superior picture quality and affordability. They offer four times the resolution of Full HD TVs, providing a more immersive viewing experience, which is increasingly popular among consumers seeking high-definition content. 8K TVs, while still in the early stages of widespread adoption, are gaining traction due to their cutting-edge technology and superior resolution, which offers an even more enhanced viewing experience. Full HD TVs and HDTVs cater to more budget-conscious consumers, offering decent picture quality at a lower price point. Although these resolutions are becoming less common as 4K and 8K options become more accessible, they still represent a significant portion of the market due to their affordability and adequacy for various viewing needs.
By Operating System:
The Smart TV Market is also segmented by operating system, with each platform offering distinct features and user experiences. Android TV dominates the market due to its extensive app ecosystem and seamless integration with Google services, appealing to a broad range of users. Tizen, used primarily by Samsung, is known for its user-friendly interface and robust app offerings, making it a strong competitor in the market. WebOS, developed by LG, is recognized for its intuitive navigation and smart features, enhancing the user experience. Roku offers a streamlined and accessible platform with a strong emphasis on content discovery and ease of use. The Other category includes various operating systems from different manufacturers, each providing unique functionalities and catering to niche market segments. The diversity in operating systems reflects the growing demand for tailored smart TV experiences and advanced functionalities.
Segments:
Based on Resolution:
- 4K UHD TV
- HDTV
- Full HD TV
- 8K TV
Based on Operating System:
- Android TV
- Tizen
- WebOS
- Roku
- Other
Based on Screen Size:
- Light
- Below 32 inches
- 32 to 45 inches
- 46 to 55 inches
- 56 to 65 inches
- Above 65 inches
Based on Screen Type:
- Flat
- Curved
Based on the Geography:
- North America
- US
- Canada
- Mexico
- Europe
- Germany
- France
- UK
- Italy
- Spain
- Rest of Europe
- Asia Pacific
- China
- Japan
- India
- South Korea
- South-east Asia
- Rest of Asia Pacific
- Latin America
- Brazil
- Argentina
- Rest of Latin America
- Middle East & Africa
- GCC Countries
- South Africa
- Rest of the Middle East and Africa
Regional Analysis
Asia Pacific
Asia Pacific leads the market with a commanding 40% market share, driven by rapid technological advancements, increasing disposable incomes, and a growing middle-class population. Countries like China, Japan, and South Korea are at the forefront of smart TV manufacturing and adoption, with local brands like Xiaomi, TCL, and Samsung capturing substantial market shares. The region's robust digital infrastructure and high-speed internet penetration contribute to the widespread adoption of smart TVs. Additionally, the popularity of streaming services and the increasing demand for connected home entertainment systems further fuel market growth in Asia Pacific. The region's market is characterized by intense competition, leading to innovative features and competitive pricing strategies.
North America
The market benefits from high consumer awareness, advanced digital ecosystems, and a strong preference for premium, large-screen TVs. Major players like Samsung, LG, and Vizio dominate the North American market, offering a wide range of smart TV options catering to diverse consumer preferences. The region's market is distinguished by the integration of advanced technologies such as AI-powered voice assistants, 8K resolution, and OLED displays. The proliferation of streaming services like Netflix, Amazon Prime, and Disney+ has significantly contributed to smart TV adoption in North America. Furthermore, the trend towards cord-cutting and the shift from traditional cable TV to internet-based content consumption continue to drive market growth.
Key Player Analysis
- Haier Inc.
- Hisense International
- Intex Technologies
- Koninklijke Philips N.V
- LG Electronics Inc
- Panasonic Corporation
- Samsung Electronics Co. Ltd
- Sansui Electric Co. Ltd
- Sony Corporation
- TCL Electronics Holdings Limited
- Toshiba Visual Solutions (TVS Regza Corporation)
Competitive Analysis
The Smart TV market is highly competitive, with leading players leveraging innovation and market positioning to drive growth. Samsung Electronics Co. Ltd. stands out with its advanced display technologies and diverse product range, including QLED and OLED models, enhancing visual quality and user experience. LG Electronics Inc. excels with its OLED technology and webOS platform, offering superior picture quality and a user-friendly interface. Sony Corporation combines high-performance display technologies with its Android TV operating system, delivering a premium viewing experience with robust app support. TCL Electronics Holdings Limited offers competitive pricing and innovative features, making significant inroads in the budget and mid-range segments. Panasonic Corporation and Philips N.V. are noted for their energy-efficient models and strong regional presence. The market is marked by continuous R&D investments and strategic partnerships to enhance product offerings and meet evolving consumer demands.
Recent Developments
- In 2024, Samsung Electronics, the world's leading TV manufacturer, inaugurated its annual Tech Seminar series in Frankfurt, Germany. Dominating the TV industry for 18 consecutive years, Samsung showcased its latest display innovations for 2024.
- In April 2022, Samsung Electronics Co. Ltd launched its Neo QLED 8K smart TV range. This launch included 65-inch and 85-inch screen-sized televisions. Samsung Electronics Co. Ltd also runs promotional offers, enabling consumers to purchase TVs at lower costs, thus increasing the demand for its products.
Market Concentration & Characteristics
The Smart TV market exhibits a moderate to high level of market concentration, dominated by several key players who command significant shares through technological innovation and extensive global reach. Major companies such as Samsung Electronics, LG Electronics, and Sony Corporation lead the market, leveraging their advanced display technologies, proprietary operating systems, and extensive distribution networks to maintain competitive advantages. The market is characterized by rapid technological advancements, including high-resolution displays, AI-driven features, and integration with smart home ecosystems, which drive product differentiation and consumer choice. Additionally, there is a strong emphasis on enhancing user experience through improved interfaces and voice control capabilities. Market players engage in strategic collaborations, continuous R&D, and competitive pricing to address diverse consumer needs and preferences. This dynamic landscape ensures ongoing innovation and growth, with established brands setting benchmarks for technology and quality in the evolving Smart TV sector.
Report Coverage
The research report offers an in-depth analysis based on Resolution, Operating System, Screen Size, Screen Type and Geography. It details leading market players, providing an overview of their business, product offerings, investments, revenue streams, and key applications. Additionally, the report includes insights into the competitive environment, SWOT analysis, current market trends, as well as the primary drivers and constraints. Furthermore, it discusses various factors that have driven market expansion in recent years. The report also explores market dynamics, regulatory scenarios, and technological advancements that are shaping the industry. It assesses the impact of external factors and global economic changes on market growth. Lastly, it provides strategic recommendations for new entrants and established companies to navigate the complexities of the market.
Future Outlook
- The Smart TV market is expected to grow significantly due to increasing consumer demand for high-definition and interactive entertainment experiences.
- Advances in AI and machine learning will enhance personalized content recommendations and improve voice control functionalities.
- Integration with cloud gaming services will expand, enabling users to stream high-quality games directly on their Smart TVs.
- Emerging display technologies, such as MicroLED and OLED, will offer superior picture quality and more flexible design options.
- The development of smart TV operating systems will continue to evolve, offering more seamless and user-friendly interfaces.
- Increased focus on smart home integration will position Smart TVs as central hubs within connected home ecosystems.
- Affordability of advanced features and technologies will rise, making high-end Smart TVs more accessible to a broader audience.
- The proliferation of streaming services will drive demand for Smart TVs with advanced app compatibility and content aggregation capabilities.
- Enhanced security measures will be implemented to address concerns over data privacy and cyber threats.
- Growing interest in sustainable practices will lead to innovations in energy-efficient designs and longer-lasting products.
Request a Free Sample
Fill in your details and we'll send you a free sample report.
- Sample data tables & charts
- Research methodology
Need a Custom Version of This Report?
Tailor the scope, geography, or segments to your exact requirements.
- Custom geography or segment scope
- Direct access to our analyst team
Frequently Asked Questions
What is the current size of the Smart TV Market?
What factors are driving the growth of the Smart TV Market?
What are the key segments within the Smart TV Market?
What are some challenges faced by the Smart TV Market?
Who are the major players in the Smart TV Market?
Table of Content
Chapter 1. Report Introduction
- 1.1 Report Description & Purpose
- 1.1.1 Report Title & Market Definition
- 1.1.2 Unique Selling Propositions (USP) & Key Differentiators
- 1.1.3 Value Proposition for Stakeholders
- 1.2 Research Objectives
- 1.2.1 Market Sizing Objectives (Volume & Revenue)
- 1.2.2 Segmentation Objectives
- 1.2.3 Competitive Intelligence Objectives
- 1.2.4 Forecast & Scenario Objectives
- 1.3 Report Scope
- 1.3.1 Smart TV Scope – Types & Subtypes Covered
- 1.3.2 Geographic Scope – Regions & Countries Covered
- 1.3.3 Historical Period, Base Year & Forecast Period (2024; forecast to 2032)
- 1.3.4 Inclusions & Exclusions
- 1.4 HS Code & Classification Framework
- 1.5 Currency, Units & Pricing Basis
- 1.6 Target Stakeholders
- 1.7 Limitations & Assumptions
Chapter 2. Executive Summary
- 2.1 Global Smart TV Market Snapshot
- 2.1.1 Market Size – Historical (2024) & Forecast (2024-2032) (2024: USD 268,595.6 million → 2032: USD 571,584.5 million)
- 2.1.2 Volume & Revenue – Global Totals
- 2.1.3 Key Market Highlights – Top Five Facts
- 2.2 Smart TV Market Segmentation Snapshot
- 2.2.1 Market Split by Region – 2024 vs. 2032
- 2.3 Competitive Snapshot
- 2.3.1 Top 10 Players by Revenue Share – 2024
- 2.3.2 Top 10 Players by Volume Share – 2024
- 2.3.3 Recent Strategic Developments (18-Month Summary)
- 2.4 Key Investment Highlights & Strategic Conclusions
Chapter 3. Smart TV Market Dynamics & Industry Analysis
- 3.1 Market Overview & Context
- 3.1.1 Smart TV Market Position in the Broader Automotive Value Chain
- 3.1.2 OEM vs. Replacement Market Dynamics
- 3.1.3 Market Maturity & Development Stage by Region
- 3.2 Smart TV Market Drivers
- 3.3 Smart TV Market Restraints & Challenges
- 3.4 Smart TV Market Opportunities
- 3.5 Porter's Five Forces Analysis
- 3.5.1 Threat of New Entrants
- 3.5.2 Bargaining Power of Suppliers
- 3.5.3 Bargaining Power of Buyers
- 3.5.4 Threat of Substitutes
- 3.5.5 Competitive Rivalry – Intensity Assessment
- 3.6 Smart TV Value Chain Analysis
- 3.6.1 Upstream – Raw Material/Input Suppliers
- 3.6.1.1 Raw Material/Input 1
- 3.6.1.2 Raw Material/Input 2
- 3.6.1.3 Raw Material/Input 3
- 3.6.2 Midstream – Production/Manufacturing/Service Delivery
- 3.6.2.1 Production/Process Overview
- 3.6.2.2 Key Facility Locations & Capacity by Manufacturer
- 3.6.3 Downstream – Distribution & End Consumer
- 3.6.3.1 Primary Channel – B2B/OEM
- 3.6.3.2 Secondary Channels – Dealer, Retail, Online, Direct
- 3.6.4 Value Chain Profitability Analysis
- 3.6.1 Upstream – Raw Material/Input Suppliers
- 3.7 PESTEL Analysis
- 3.7.1 Political Factors
- 3.7.2 Economic Factors
- 3.7.3 Social Factors
- 3.7.4 Technological Factors
- 3.7.5 Environmental Factors
- 3.7.6 Legal Factors
- 3.8 Smart TV Supply Chain Analysis
- 3.8.1 Raw Material/Input Supply Risk Assessment
- 3.8.2 Manufacturing Concentration Risk (Geographic Exposure)
- 3.8.3 Trade Disruption Impact Analysis
- 3.9 Regulatory & Policy Landscape
Note: The regulatory and policy landscape section covers regulations based on their applicability to the market, Smart TV category, geography, and scope of the study. Only regulatory frameworks with a material impact on operations, compliance, trade, sustainability, or market access are analyzed in detail.
Chapter 4. Key Investment Pockets & Opportunity Analysis
- 4.1 Smart TV Market Attractiveness Analysis
- 4.1.1 By Region – Investment Attractiveness Matrix (Volume × CAGR)
- 4.2 Absolute Revenue Growth Opportunity
- 4.2.1 By Region – Absolute USD Growth Through 2032
- 4.3 Incremental Volume Opportunity
- 4.3.1 By Region – Incremental Volume Through 2032
- 4.3.2 Segment – Incremental Volume
- 4.4 Emerging Submarket Opportunity Deep Dive (Subject to Applicability)
- 4.5 Emerging Market Opportunity Scorecards
- 4.5.1 United States
- 4.5.2 Europe
- 4.5.3 Asia
- 4.5.4 Middle East & Africa
Note: Emerging Market Opportunity Scorecards will be included based on relevance and strategic importance. Regions listed are indicative and may vary depending on data availability and market dynamics.
Chapter 5. Smart TV Import-Export Analysis & Trade Flows
- 5.1 Global Trade Overview
- 5.1.1 Global Export Value by Country (2024)
- 5.1.2 Global Export Volume by Country (2024)
- 5.1.3 Global Import Value by Country (2024)
- 5.1.4 Global Import Volume by Country (2024)
- 5.1.5 Net Trade Balance by Country (2024)
- 5.2 Export Analysis – Segment
- 5.2.1 Type 1 (HS Code)
- 5.2.2 Type 2 (HS Code)
- 5.2.3 Type 3 (HS Code)
- 5.2.4 Type 4 (HS Code)
- 5.2.5 Type 5 (HS Code)
- 5.3 Import Analysis – Segment
- 5.3.1 Type 1 (HS Code)
- 5.3.2 Type 2 (HS Code)
- 5.3.3 Type 3 (HS Code)
- 5.3.4 Type 4 (HS Code)
- 5.3.5 Type 5 (HS Code)
- 5.4 Average Unit Trade Prices
- 5.4.1 Average Export Price – Segment & Country
- 5.4.2 Average Import Price – Segment & Source Country
- 5.4.3 Price Trends (2024)
- 5.5 Key Trade Route Analysis
- 5.5.1 Trade Route 1
- 5.5.2 Trade Route 2
- 5.5.3 Trade Route 3
- 5.5.4 Trade Route 4
- 5.5.5 Trade Route 5
- 5.6 Trade Policy Impact Assessment
- 5.6.1 US Anti-Dumping & Section 301 Tariffs
- 5.6.2 EU Customs Union Impact
- 5.6.3 Major Free Trade Agreements
- 5.6.4 USMCA Rules of Origin
Note: Trade policy analysis will be included only where relevant to the Smart TV market.
Chapter 6. Competitive Landscape & Company Benchmarking
- 6.1 Smart TV Market Concentration & Structure
- 6.1.1 Herfindahl-Hirschman Index (HHI) – vs. 2024
- 6.1.2 Tier 1, Tier 2 & Tier 3 Market Structure
- 6.1.3 Global, Regional & Local Player Dynamics
- 6.2 Smart TV Market Share Analysis – 2024
- 6.2.1 Global Revenue Share by Company
- 6.2.2 Global Volume Share by Company
- 6.2.3 Regional Revenue Share
- 6.2.4 Market Share Evolution ( vs. 2024)
- 6.2.5 OEM Segment Share by Company
- 6.2.6 Replacement Segment Share by Company
- 6.3 Production/Delivery Capacity & Facility Analysis
- 6.3.1 Global Installed Capacity
- 6.3.2 Capacity Utilization Rates
- 6.3.3 Production/Output Volume
- 6.3.4 Facility Locations & Capacity Map
- 6.3.5 Planned Capacity Additions
- 6.4 Smart TV Competitive Benchmarking Matrix
- 6.4.1 Revenue, Volume, CAGR & Profitability Comparison
- 6.4.2 Channel Revenue Mix
- 6.4.3 Geographic Revenue Exposure
- 6.4.4 R&D Intensity
- 6.4.5 Sustainability Maturity
- 6.5 Strategic Developments in Smart TV (Last 24 Months)
- 6.5.1 Mergers, Acquisitions & Divestments
- 6.5.2 New Smart TV Launches
- 6.5.3 Facility Expansions
- 6.5.4 Strategic Alliances, Joint Ventures & Partnerships
- 6.5.5 Distribution Expansion & Market Entry
- 6.5.6 Sustainability & ESG Initiatives
- 6.6 Competitive Strategy Mapping
- 6.6.1 Leader, Challenger, Follower & Niche Classification
- 6.6.2 Pricing Strategy Comparison
- 6.6.3 Channel Strategy Matrix
Note: Strategic developments are included based on their materiality and the availability of reliable information.
Chapter 7. Global Smart TV Market – By Distribution Channel
- 7.1 Segment Overview
- 7.1.1 Volume & Revenue Split by Channel (2024 & 2032)
- 7.1.2 Channel Mix Evolution (2024-2032)
Chapter 8. Regional Market Analysis – Global Overview
- 8.1 Global Regional Overview
- 8.1.1 Regional Volume Share
- 8.1.2 Regional Revenue Share
- 8.1.3 Regional Volume by Region
- 8.1.4 Regional Revenue by Region
- 8.1.5 Regional Forecast Through 2032
- 8.2 Cross-Regional Segment Analysis
- 8.2.1 By Distribution Channel
- 8.2.2 By Brand/Price Tier
Chapter 9. North America Smart TV Market
- 9.1 United States
- 9.2 Canada
- 9.3 Mexico
Chapter 10. Europe Smart TV Market
- 10.1 Germany
- 10.2 France
- 10.3 Italy
- 10.4 United Kingdom
- 10.5 Spain
- 10.6 Poland
- 10.7 Russia
- 10.8 Netherlands
- 10.9 Belgium
- 10.10 Sweden
- 10.11 Denmark
- 10.12 Norway
- 10.13 Rest of Europe
Chapter 11. Asia Pacific Smart TV Market
- 11.1 China
- 11.2 India
- 11.3 Japan
- 11.4 South Korea
- 11.5 Thailand
- 11.6 Indonesia
- 11.7 Vietnam
- 11.8 Malaysia
- 11.9 Australia
- 11.10 Rest of Asia Pacific
Chapter 12. Latin America Smart TV Market
- 12.1 Brazil
- 12.2 Argentina
- 12.3 Colombia
- 12.4 Chile
- 12.5 Rest of Latin America
Chapter 13. Middle East Smart TV Market
- 13.1 Saudi Arabia
- 13.2 United Arab Emirates
- 13.3 Turkey
- 13.4 Israel
- 13.5 Iran
- 13.6 Rest of the Middle East
Chapter 14. Africa Smart TV Market
- 14.1 South Africa
- 14.2 Egypt
- 14.3 Nigeria
- 14.4 Morocco
- 14.5 Rest of Africa
Chapter 15. Smart TV Company Profiles
- 15.1 [Company 01]
- 15.1.1 Company Overview
- 15.1.2 Key Management Personnel
- 15.1.3 Products & Services Portfolio
- 15.1.4 Financial Performance
- 15.1.5 Key Market Focus & Geographic Presence
- 15.1.6 Recent Developments & Strategic Initiatives
Note: The company profile list is preliminary and may change based on research findings, market developments, data availability, and client requirements.
Chapter 16. Appendices
- Appendix A – List of Abbreviations & Acronyms
- Appendix B – Industry Classification Code Reference – Full Series
- Appendix C – Production & Capacity Data Tables
- Appendix D – End-Use & Demand Base Tables
- Appendix E – Consumption & Replacement Rate Assumptions
- Appendix F – ASP Reference Tables
- Appendix G – Manufacturing & Facility Database
- Appendix H – Import-Export Data Tables
- Appendix I – Regulatory Summary Tables
- Appendix J – Primary Research Participant List (Anonymized)
- Appendix K – Primary Research Questionnaire Framework
- Appendix L – Data Sources & Bibliography
- Appendix M – Market Size Divergence & Source Comparison
Chapter 17. Research Methodology
- 17.1 Research Framework & Philosophy
- 17.2 Secondary Research – Sources, Hierarchy & Data Extraction
- 17.3 Data Modeling – Bottom-Up & Top-Down Market Sizing
- 17.4 Primary Research – Stakeholder Framework, LOI & Sample Sizes
- 17.5 Forecast Methodology – Regression, Scenario & Sensitivity Analysis
- 17.6 Quality Control – Four-Layer Validation Framework
- 17.7 Limitations & Standard Assumptions
- 17.8 Disclaimer
