Computer Graphics 3D Animation Market: USD 26.72 billion in 2025, Pulled by Streaming, Games and Simulation
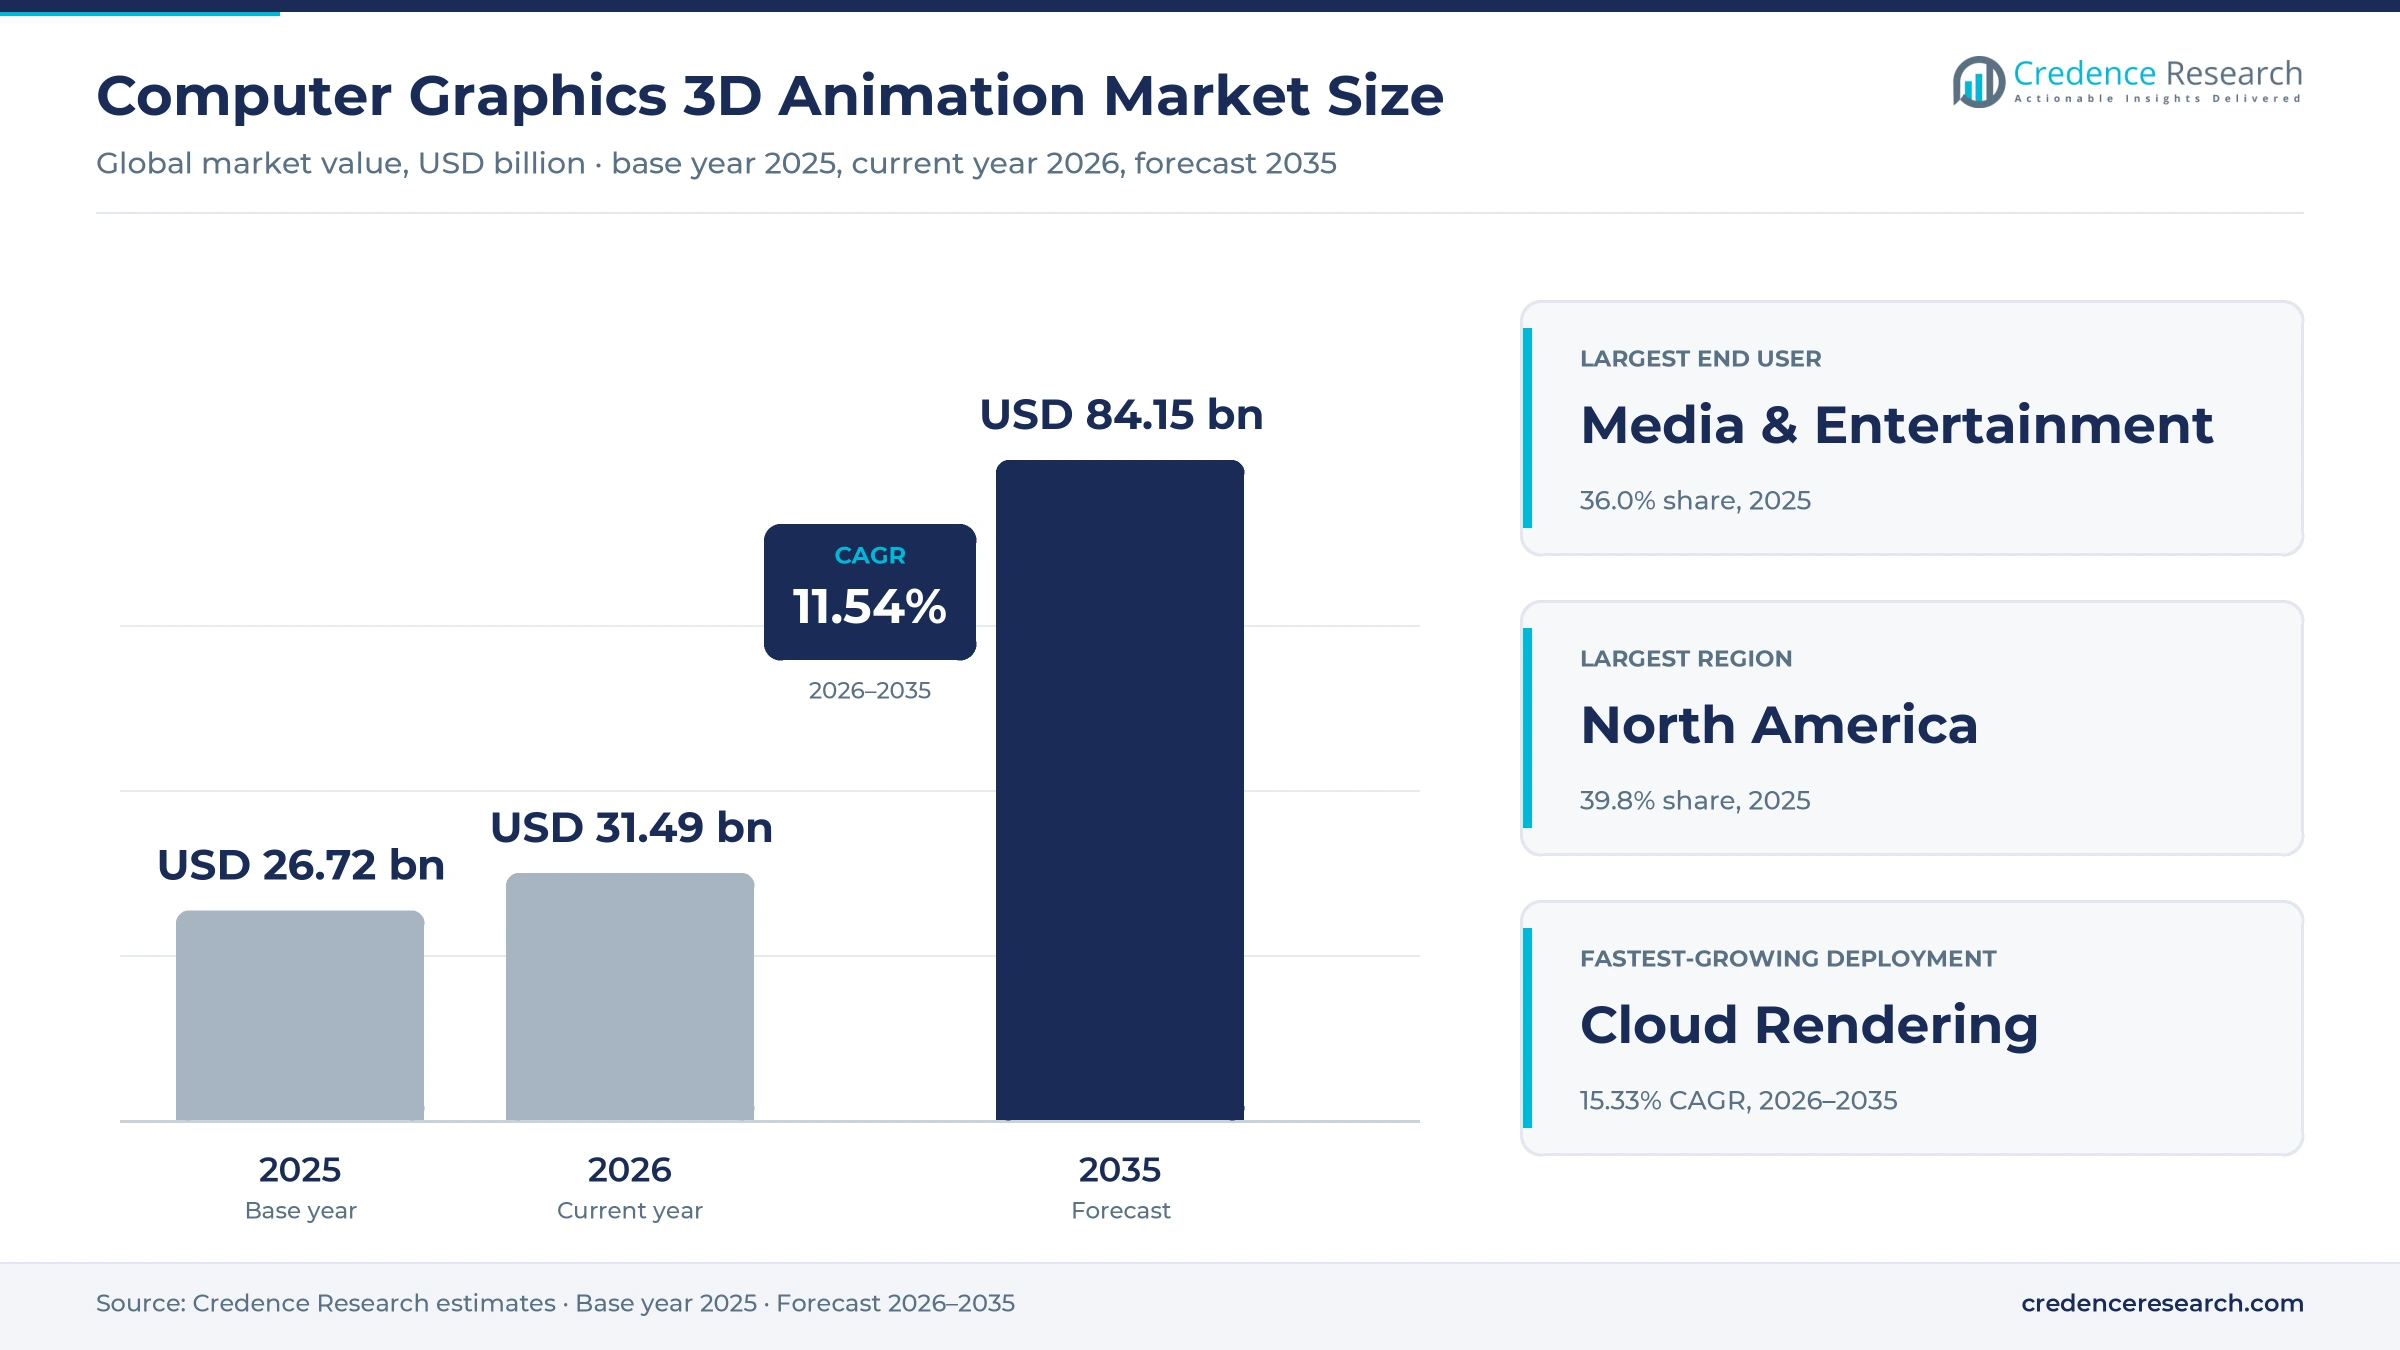
Spending on 3D modeling, animation, visual effects and rendering reached USD 26.72 billion in 2025, Credence Research estimates, as streaming services, game studios and industrial simulation teams all demand more computer-generated imagery. The computer graphics 3D animation market is forecast to reach USD 84.15 billion by 2035, a 11.54% CAGR over 2026–2035, with 2026 estimated at USD 31.49 billion.
Real-time engines, cloud rendering and AI tools are changing how 3D content is made. Work that once needed large render farms and long schedules can now run in game engines and on rented cloud capacity.
What does the market cover?
The market covers software, services and hardware used to create 3D animation and computer graphics. The scope includes:
- Modeling, rigging, animation, visual effects, rendering, motion graphics, simulation and compositing tools, including real-time engines used for animation.
- Animation and VFX production services, cloud rendering and render management.
- Workstations and GPUs bought for 3D content creation, deployed on premises or in the cloud.
The scope excludes 2D animation, general video editing, game publishing revenue and box-office receipts. Values are in USD billion at current prices, allocated to the region of the buyer. Software alone is covered in the 3D animation software market.
How was the estimate built?
All figures are Credence Research estimates, built from software seat counts and list prices, studio service spending, GPU and workstation shipments for content creation, cloud rendering usage and supplier disclosures.
Why does a shared file format matter?
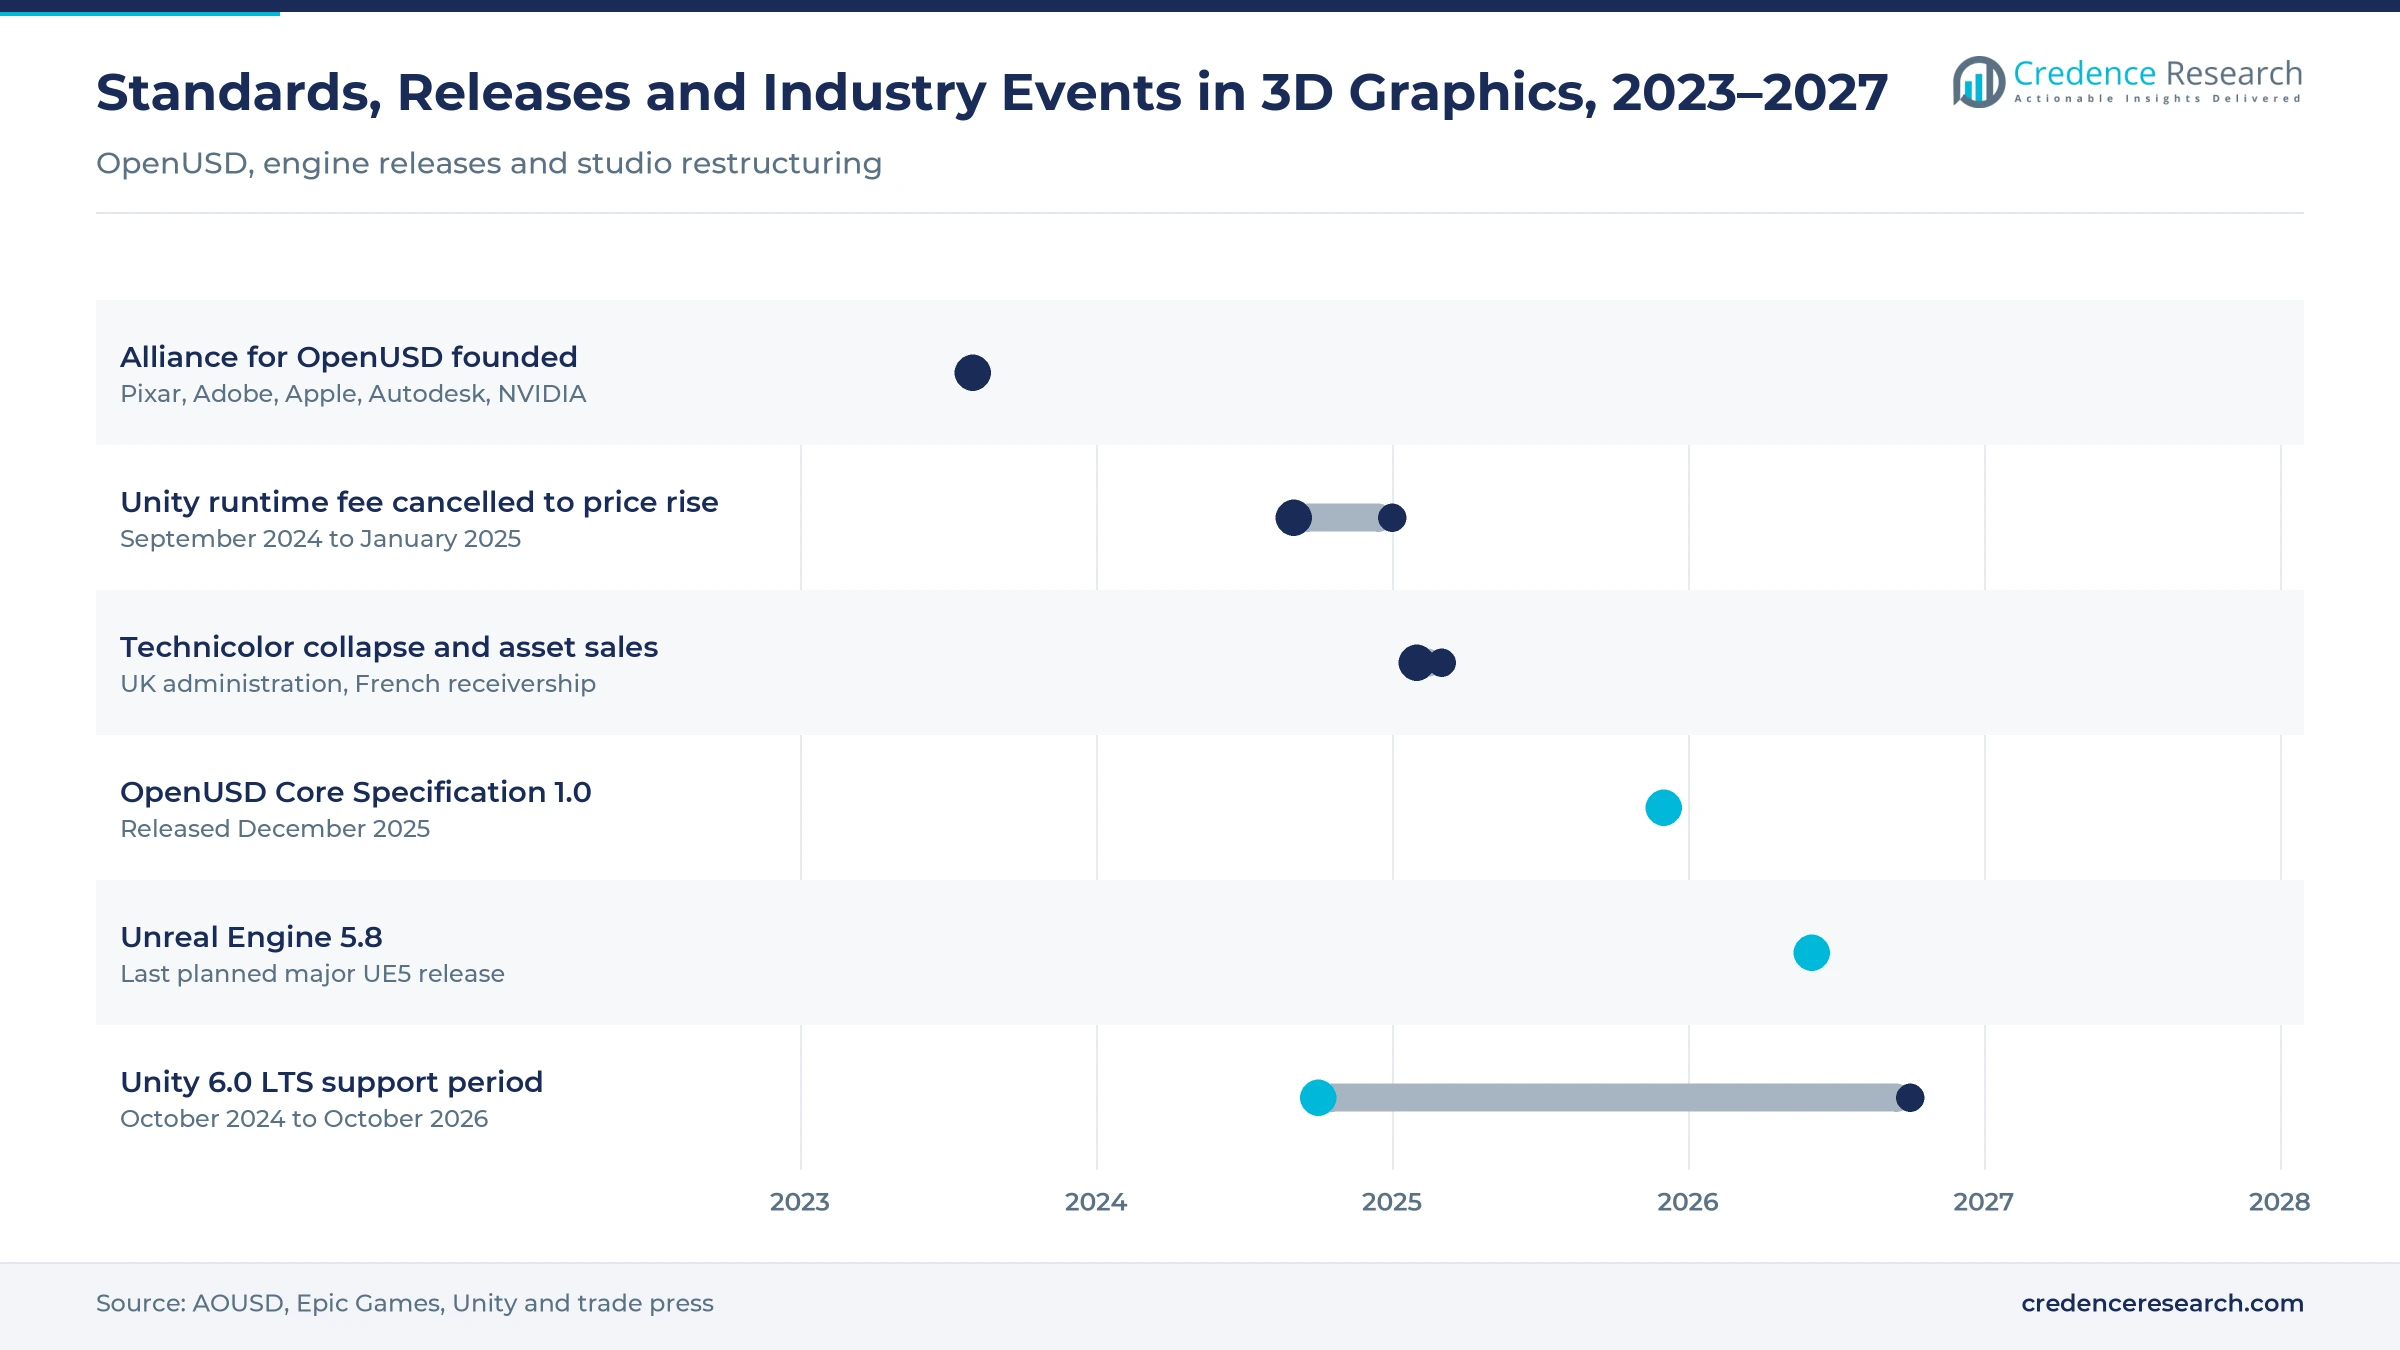
Studios use many tools in one pipeline, so files must move between them. The Alliance for OpenUSD released the OpenUSD Core Specification 1.0 in December 2025, and ByteDance, Huawei and Unity joined in July 2026, according to AOUSD.
Report Attributes
| Attribute | Details |
|---|---|
| Historical Period | 2018–2024 |
| Base Year | 2025 |
| Forecast Period | 2026–2035 |
| Market Size 2025 | USD 26.72 billion |
| Market Size 2026 (estimate) | USD 31.49 billion |
| Market Size 2035 (forecast) | USD 84.15 billion |
| CAGR (2026–2035) | 11.54% |
| Segments Covered | By Component, By Technology, By End User, By Deployment, By Workflow, By Content Type |
| Regions Covered | North America, Europe, Asia Pacific, Latin America, Middle East & Africa |
| Companies Covered | Adobe Inc., Autodesk Inc., NVIDIA Corporation, Epic Games, Inc., Unity Technologies, Maxon Computer GmbH, Side Effects Software Inc., The Foundry Visionmongers Ltd., Chaos Software GmbH, Blackmagic Design |
Computer Graphics 3D Animation Market Insights
- The computer graphics 3D animation market was worth USD 26.72 billion in 2025 and is forecast to reach USD 84.15 billion by 2035, a 11.54% CAGR over 2026–2035.
- Credence Research estimates the market at USD 31.49 billion in 2026, the current year.
- Visual effects and premium streaming content is the strongest driver, adding about 3.2 percentage points to the forecast CAGR.
- Software leads components with 46.0%; services grow fastest at 12.55%.
- Cloud rendering grows fastest by deployment at 15.33% a year.
- North America is the largest region at 39.8%; Asia Pacific grows fastest at 12.86%.
Software for Rendering and Animation in Media Holds the Largest Share
Which component leads?
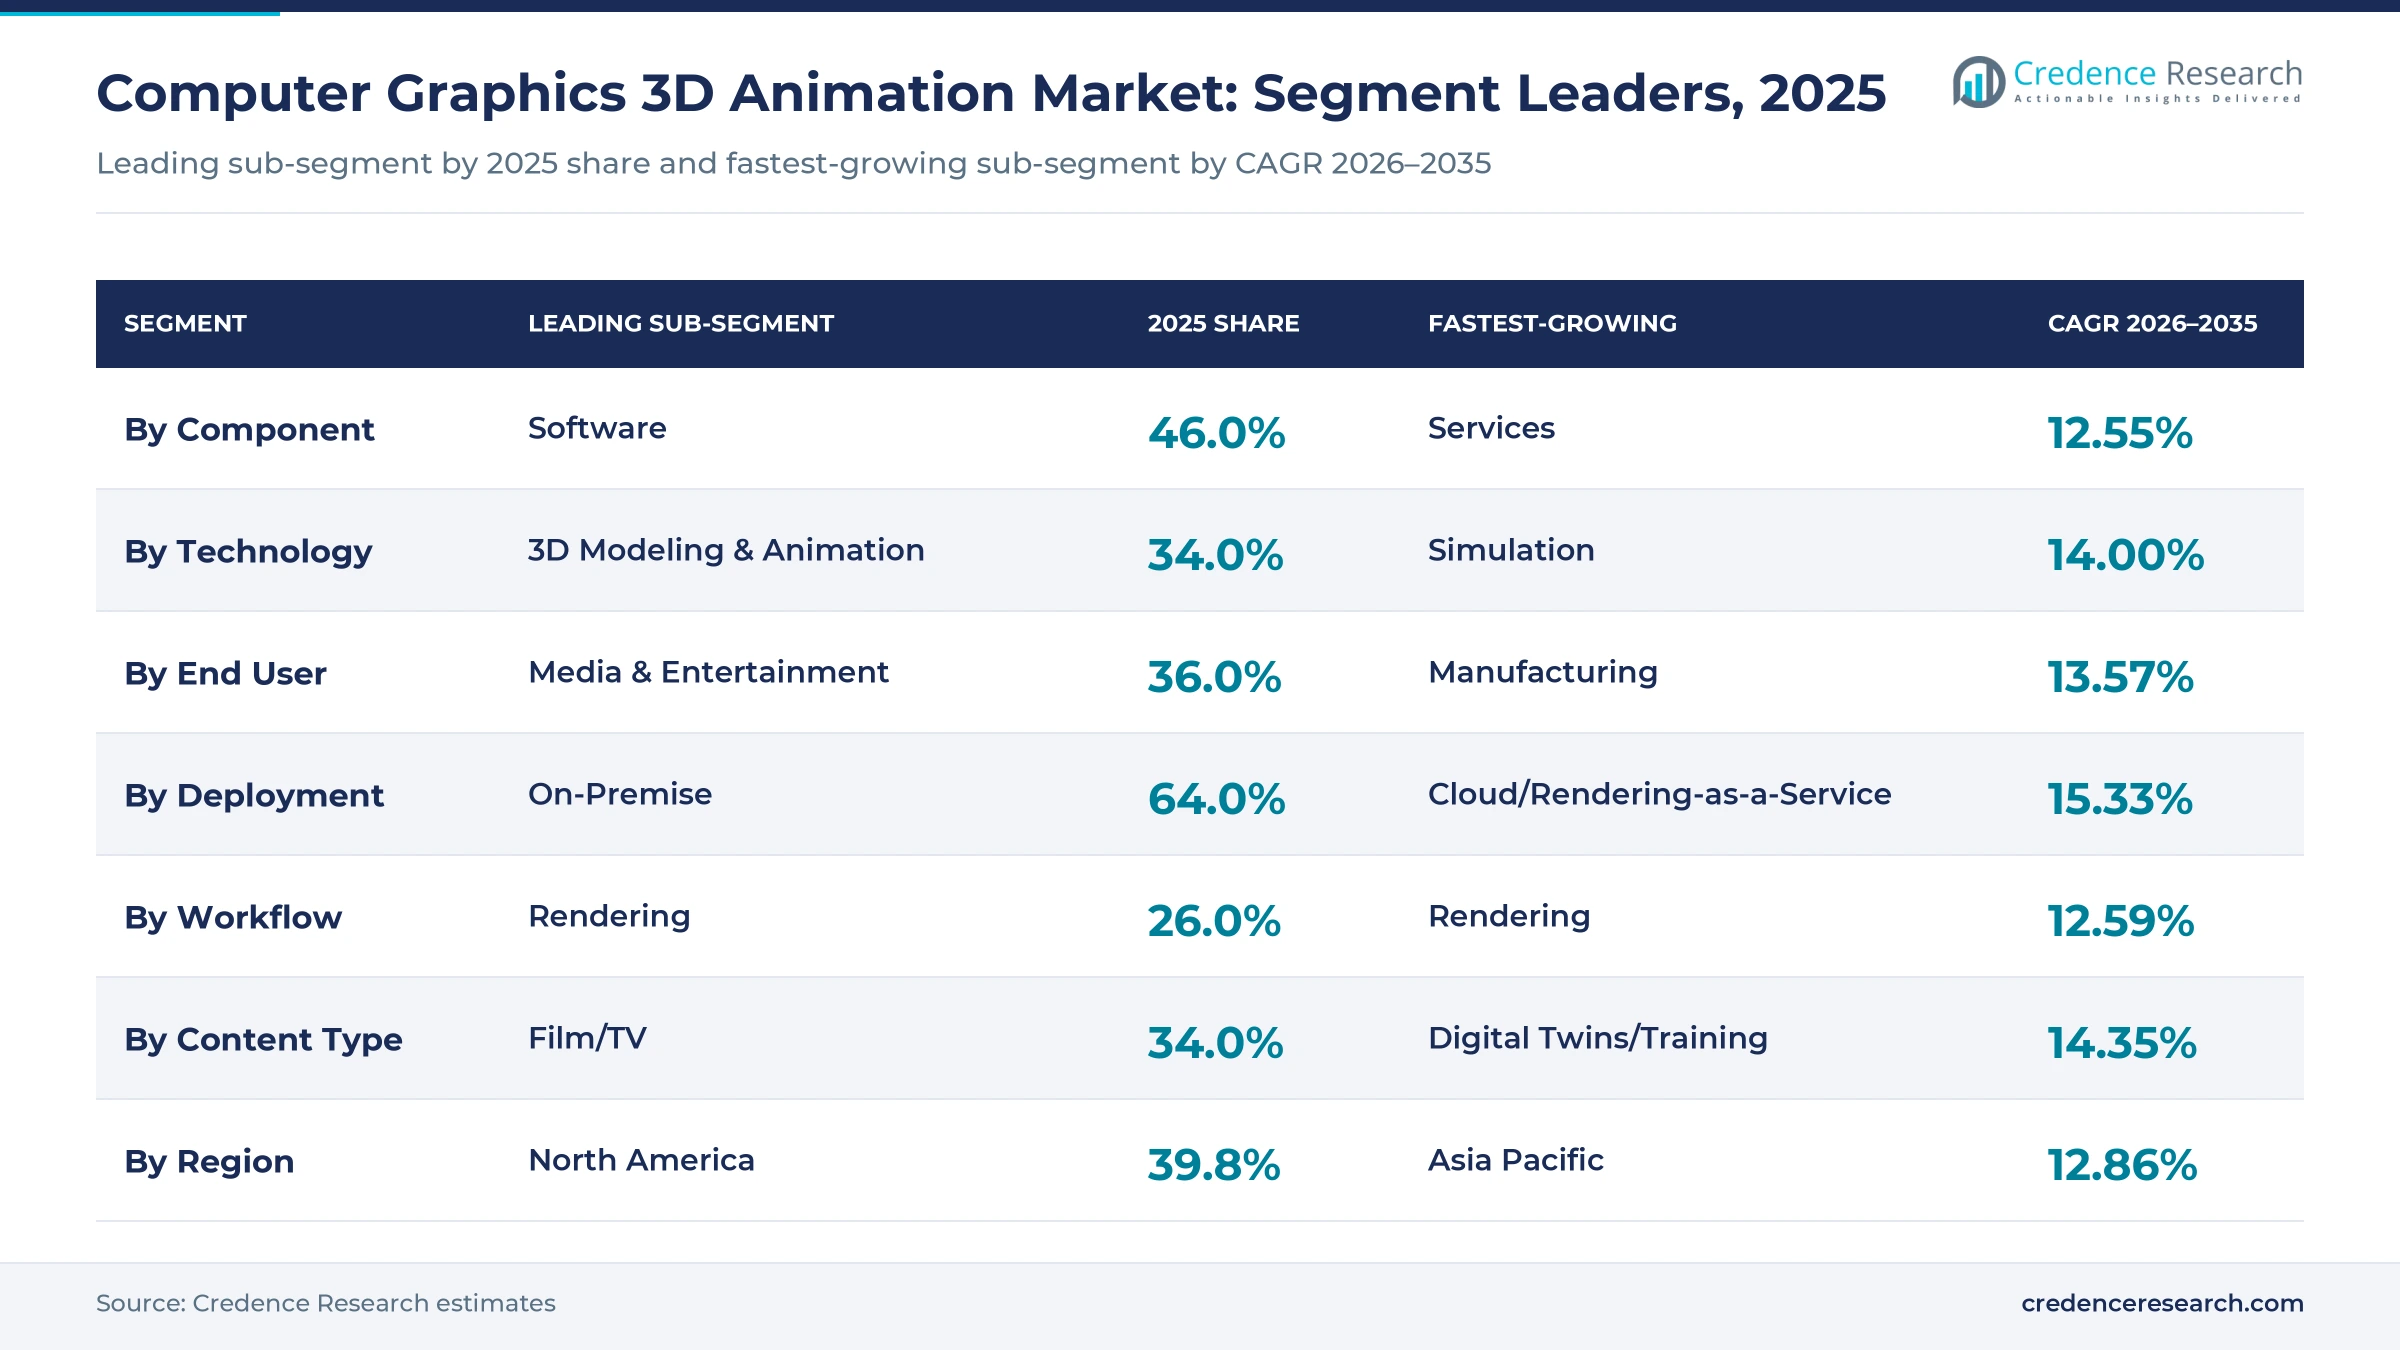
Software leads with a 46.0% share in 2025, followed closely by services from animation and VFX studios. Services grow fastest at 12.55% a year as content volumes rise.
Which technology and workflow lead?
3D modeling and animation leads technologies with 34.0%, and simulation grows fastest at 14.00%. Rendering leads workflow stages with 26.0% and also grows fastest at 12.59%, reflecting heavy compute use.
Which end user leads?
Media and entertainment leads with 36.0%, followed by gaming, advertising, manufacturing, architecture and healthcare. Manufacturing grows fastest at 13.57%.
Which deployment and content type lead?
On-premise deployment leads with 64.0%, and cloud grows fastest at 15.33%. Film and TV leads content types with 34.0%, while digital twins and training grows fastest at 14.35%.
| Segment Group | Leading Sub-segment | 2025 Share | Fastest-growing Sub-segment | CAGR 2026–2035 |
|---|---|---|---|---|
| By Component | Software | 46.0% | Services | 12.55% |
| By Technology | 3D Modeling & Animation | 34.0% | Simulation | 14.00% |
| By End User | Media & Entertainment | 36.0% | Manufacturing | 13.57% |
| By Deployment | On-Premise | 64.0% | Cloud/Rendering-as-a-Service | 15.33% |
| By Workflow | Rendering | 26.0% | Rendering | 12.59% |
| By Content Type | Film/TV | 34.0% | Digital Twins/Training | 14.35% |
Request a Free Sample
Fill in your details and we'll send you a free sample report.
- Sample data tables & charts
- Research methodology
VFX for Streaming, Real-Time Game Content and Industrial Visualization Drive Growth
Why do VFX and streaming matter? (~+3.2% impact on forecast CAGR)
Rising demand for visual effects and premium streaming content is the strongest driver, adding about 3.2 percentage points to the forecast CAGR. Streaming services compete on high-budget series that use visual effects in most scenes, and animated feature films keep drawing large audiences; China's Ne Zha 2, released in January 2025, became the highest-grossing animated film with about USD 2.2 billion, as widely reported. Virtual production lets directors see effects on set, cutting reshoots. Epic Games made its MegaLights lighting and Movie Render Graph tools production-ready in Unreal Engine 5.8 in June 2026, as stated by Epic Games. Media and entertainment leads end users with a 36.0% share, and film and TV leads content types with 34.0%. The risk is cost pressure on VFX vendors.
How do games add demand? (~+2.5% impact on forecast CAGR)
Gaming and esports demand for real-time 3D content adds about 2.5 percentage points to the forecast CAGR. Modern games need large libraries of 3D characters, environments and animations, and live-service games add content every season. About 212.3 million Americans play video games each week, according to the Entertainment Software Association. Game engines are also used for film, advertising and training, which widens their reach. Games and esports is the second-largest content type. Larger open-world titles and frequent seasonal updates raise the volume of assets each studio must model, rig and animate, which supports steady demand for computer graphics 3D animation tools and outsourced art services.
Why does industrial use matter? (~+1.8% impact on forecast CAGR)
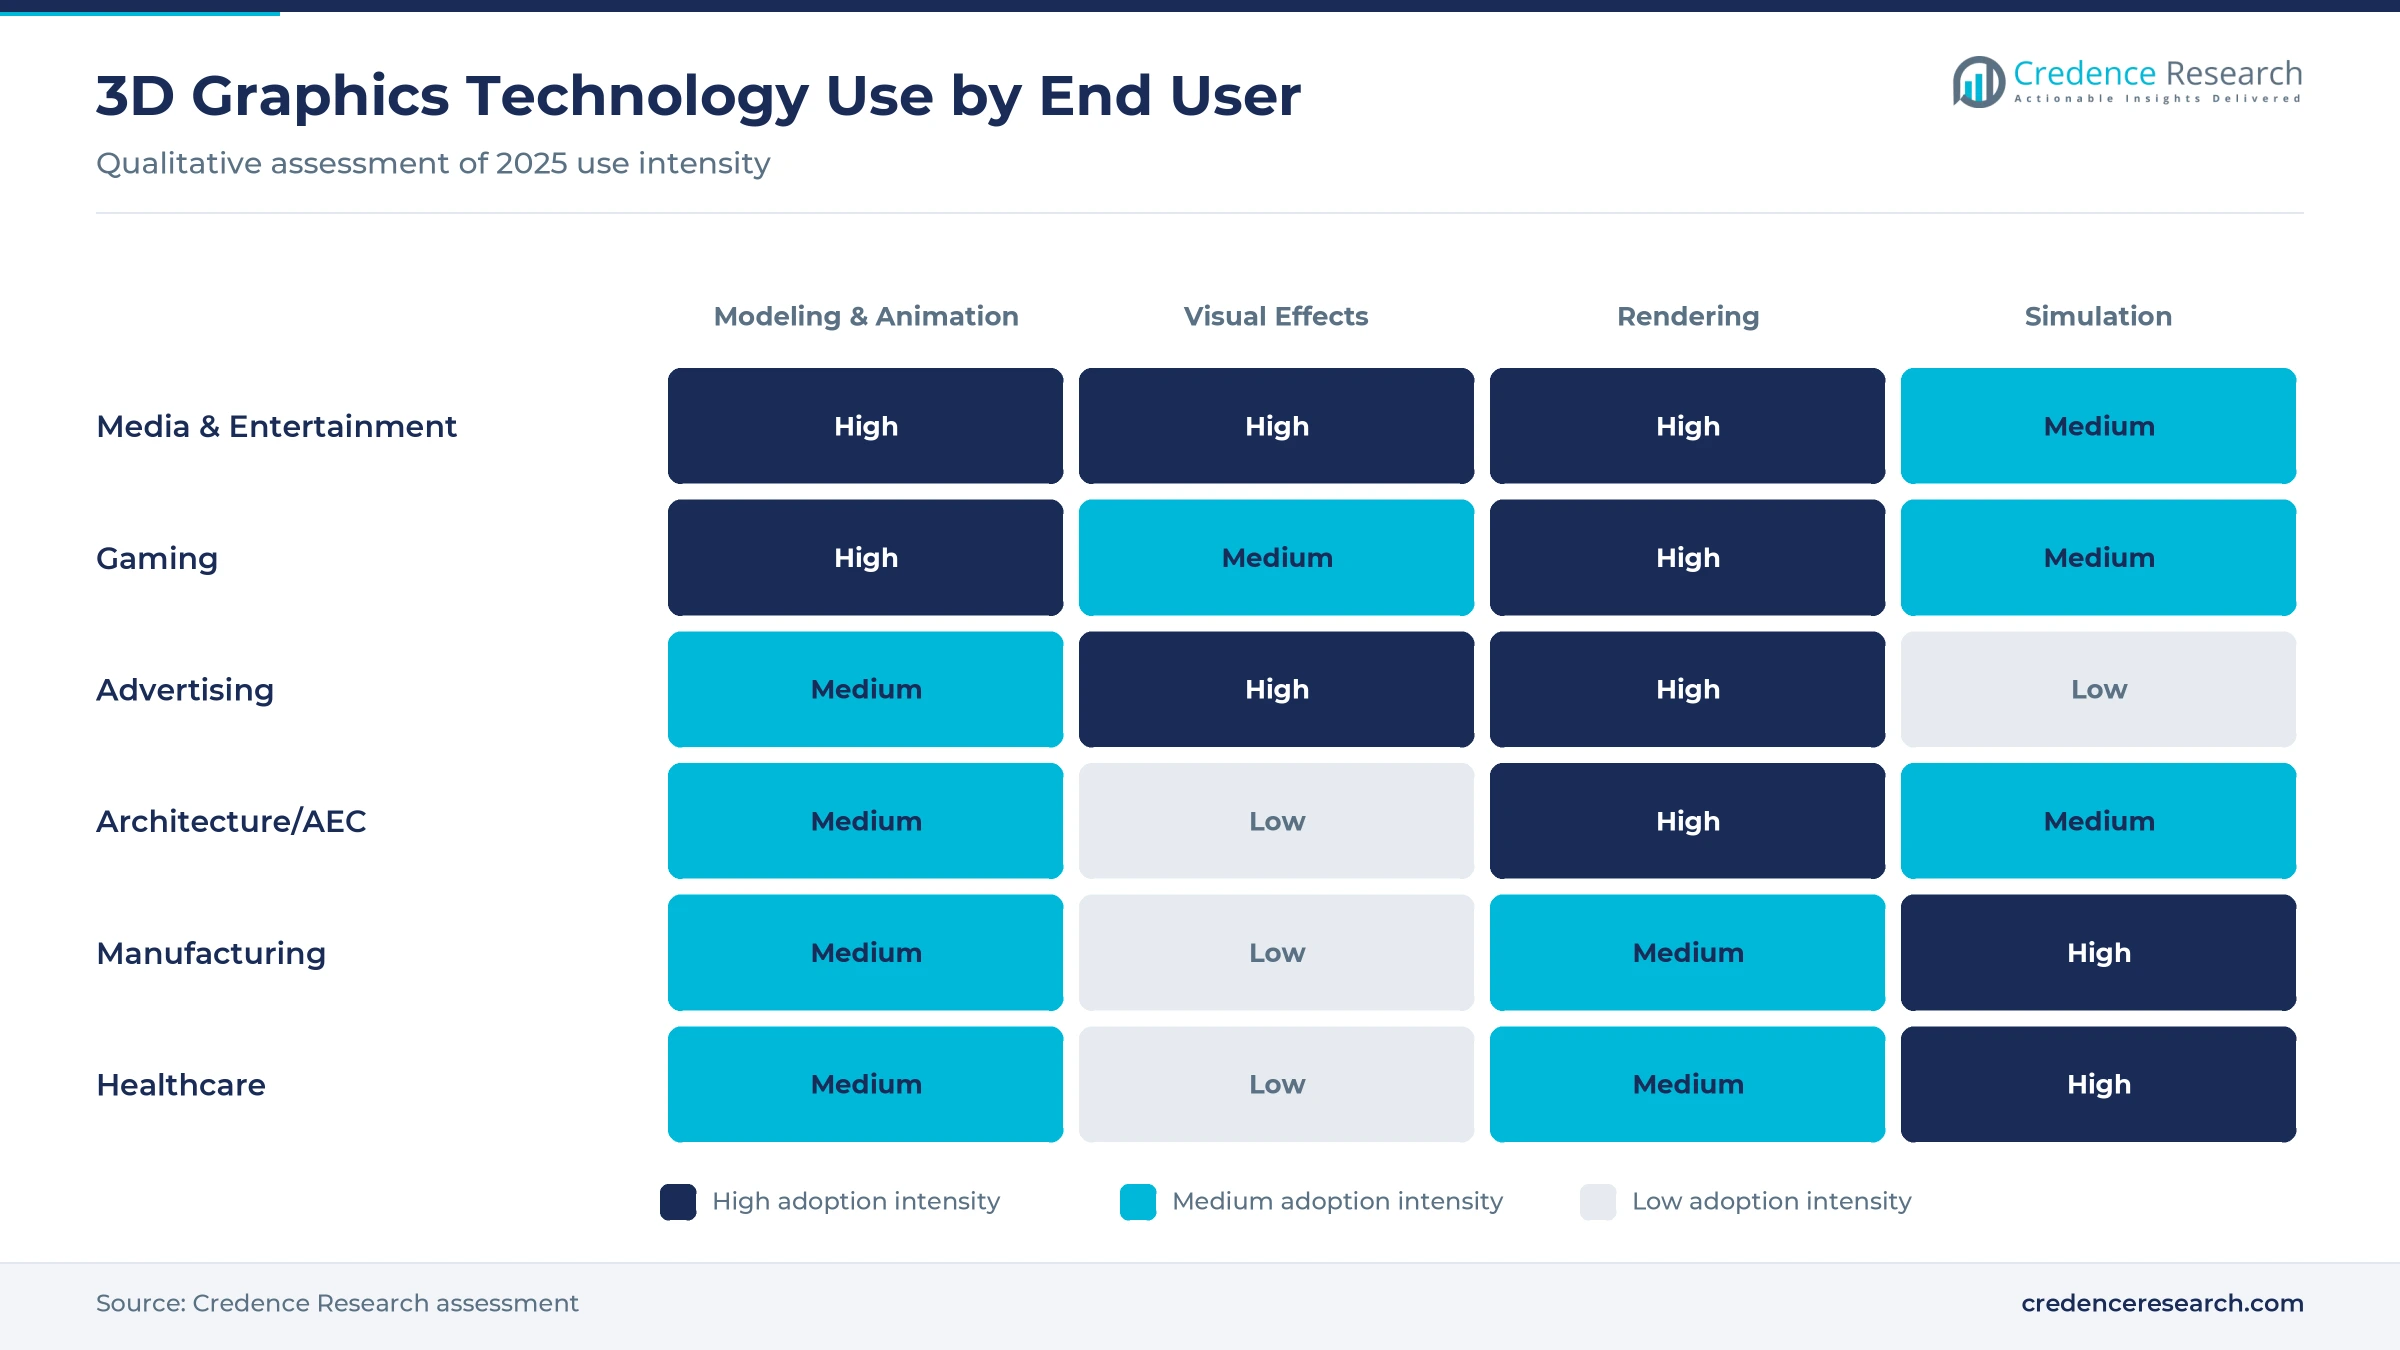
Broader adoption in healthcare, architecture, training and industrial visualization adds about 1.8 percentage points to the forecast CAGR. Manufacturers build digital twins of plants, architects present designs as real-time walkthroughs, and hospitals use 3D models for surgical planning and training. Sensor makers now publish OpenUSD models for robot simulation, and engineering teams reuse the same 3D assets for marketing, training and maintenance. Manufacturing is the fastest-growing end user at 13.57% a year, and digital twins and training is the fastest-growing content type at 14.35%.
Cloud Rendering, AI Tools and Open Standards Reshape Pipelines
Trend 1: Is rendering moving to the cloud?
Yes. Managed render farms let studios rent capacity for peak deadlines instead of buying hardware. Cloud and rendering-as-a-service is the fastest-growing deployment at 15.33% a year, while on-premise still leads with a 64.0% share.
Trend 2: Is AI entering 3D tools?
Yes. Autodesk said in its fiscal 2026 annual report that it is increasingly building AI into its products, as filed with the SEC. Maya 2027 adds machine-learning motion and deformation tools, and Unreal Engine 5.8 includes an experimental plug-in for large language models.
Trend 3: Is open-source software gaining?
Yes. Blender released versions 5.0, 5.1 and 5.2 between November 2025 and July 2026, and many smaller studios and schools use it alongside commercial tools.
Trend 4: Are pricing models changing?
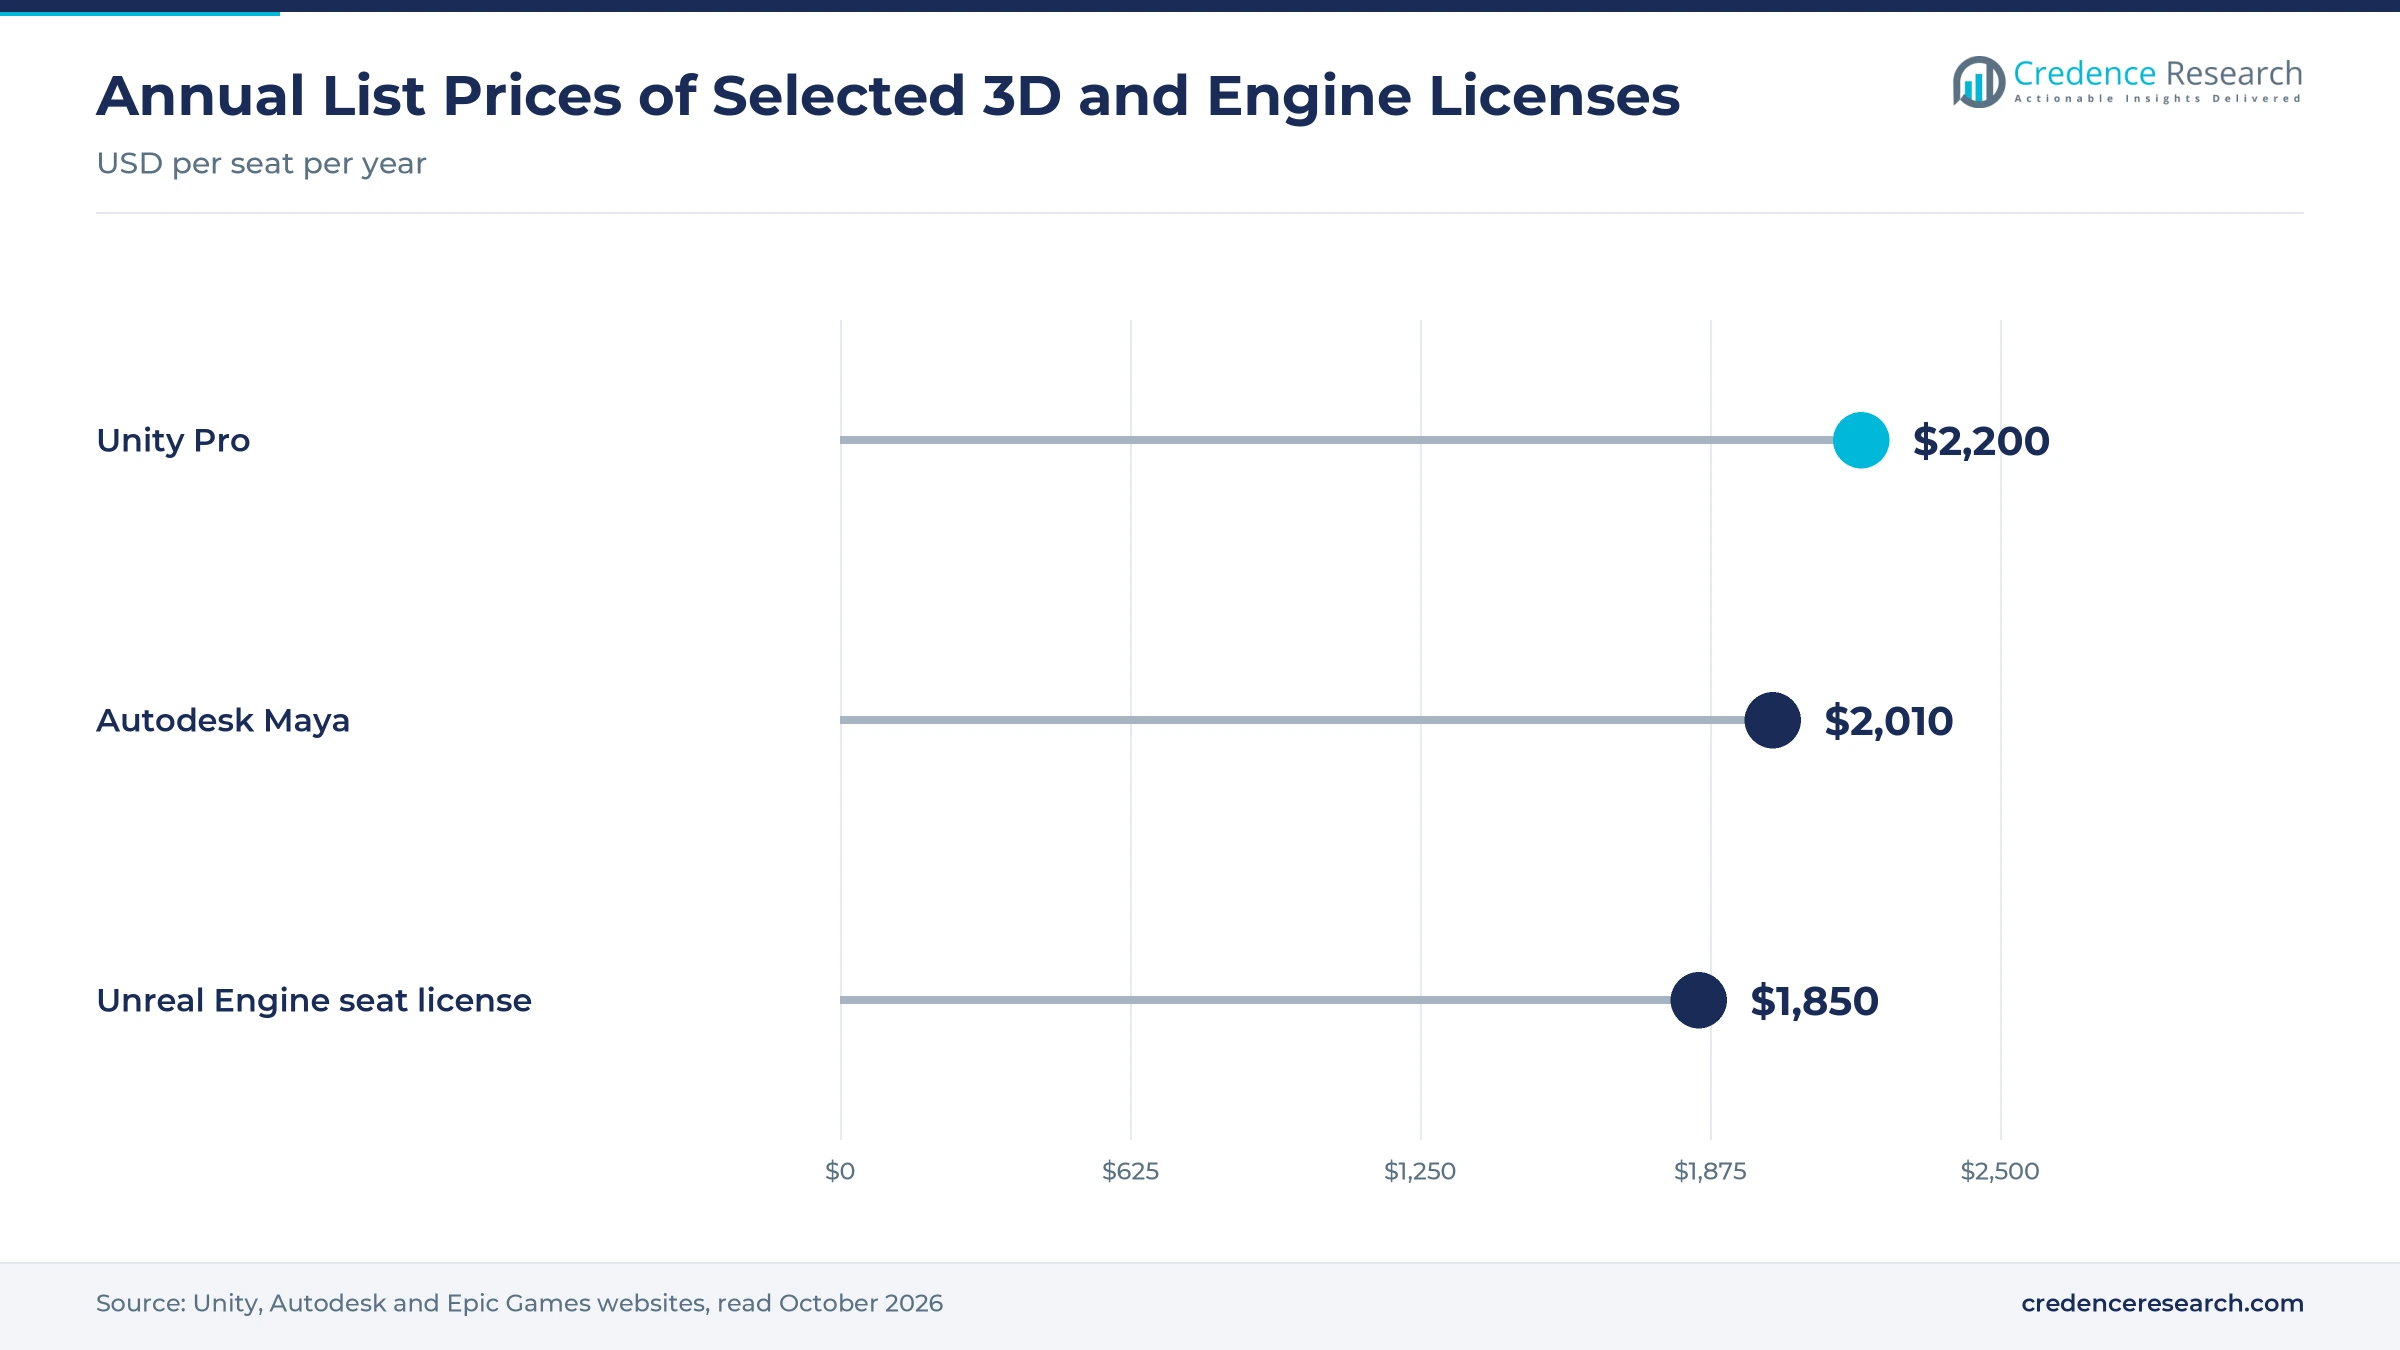
Yes. Unity cancelled its runtime fee in September 2024 after customer protests and raised seat prices instead from January 2025. Subscription and seat pricing remain the norm. The wider field is tracked in the computer graphics market.
Studio Failures, Flat Hiring and AI Disruption Weigh on the Market
Are VFX studios financially fragile?
Yes. Technicolor Group's UK and French businesses entered administration and receivership in February 2025, and most of about 440 UK staff were made redundant. Fixed-price contracts and delayed productions leave studios with thin margins.
Is employment growing?
No. The US Bureau of Labor Statistics counts about 51,900 special effects artists and animators and projects no change in employment from 2025 to 2035, partly because AI may reduce demand, according to the BLS.
Will AI reduce spending?
Partly. AI tools can generate rough models, textures and motion faster, which may cut labor spending on some tasks even as total content volume grows.
Do pricing changes create risk?
Yes. Customers have pushed back against new fees, and studios spread work across several tools to avoid dependence on one vendor.
Where are the opportunities?
Real-time pipelines for digital twins, product configurators and training offer growth outside entertainment. Suppliers that combine OpenUSD support, cloud rendering and AI-assisted creation can serve both studios and industrial users. The execution risk is meeting enterprise security and data-handling needs.
North America Leads on Hollywood and Game Studios, Asia Pacific Grows Fastest
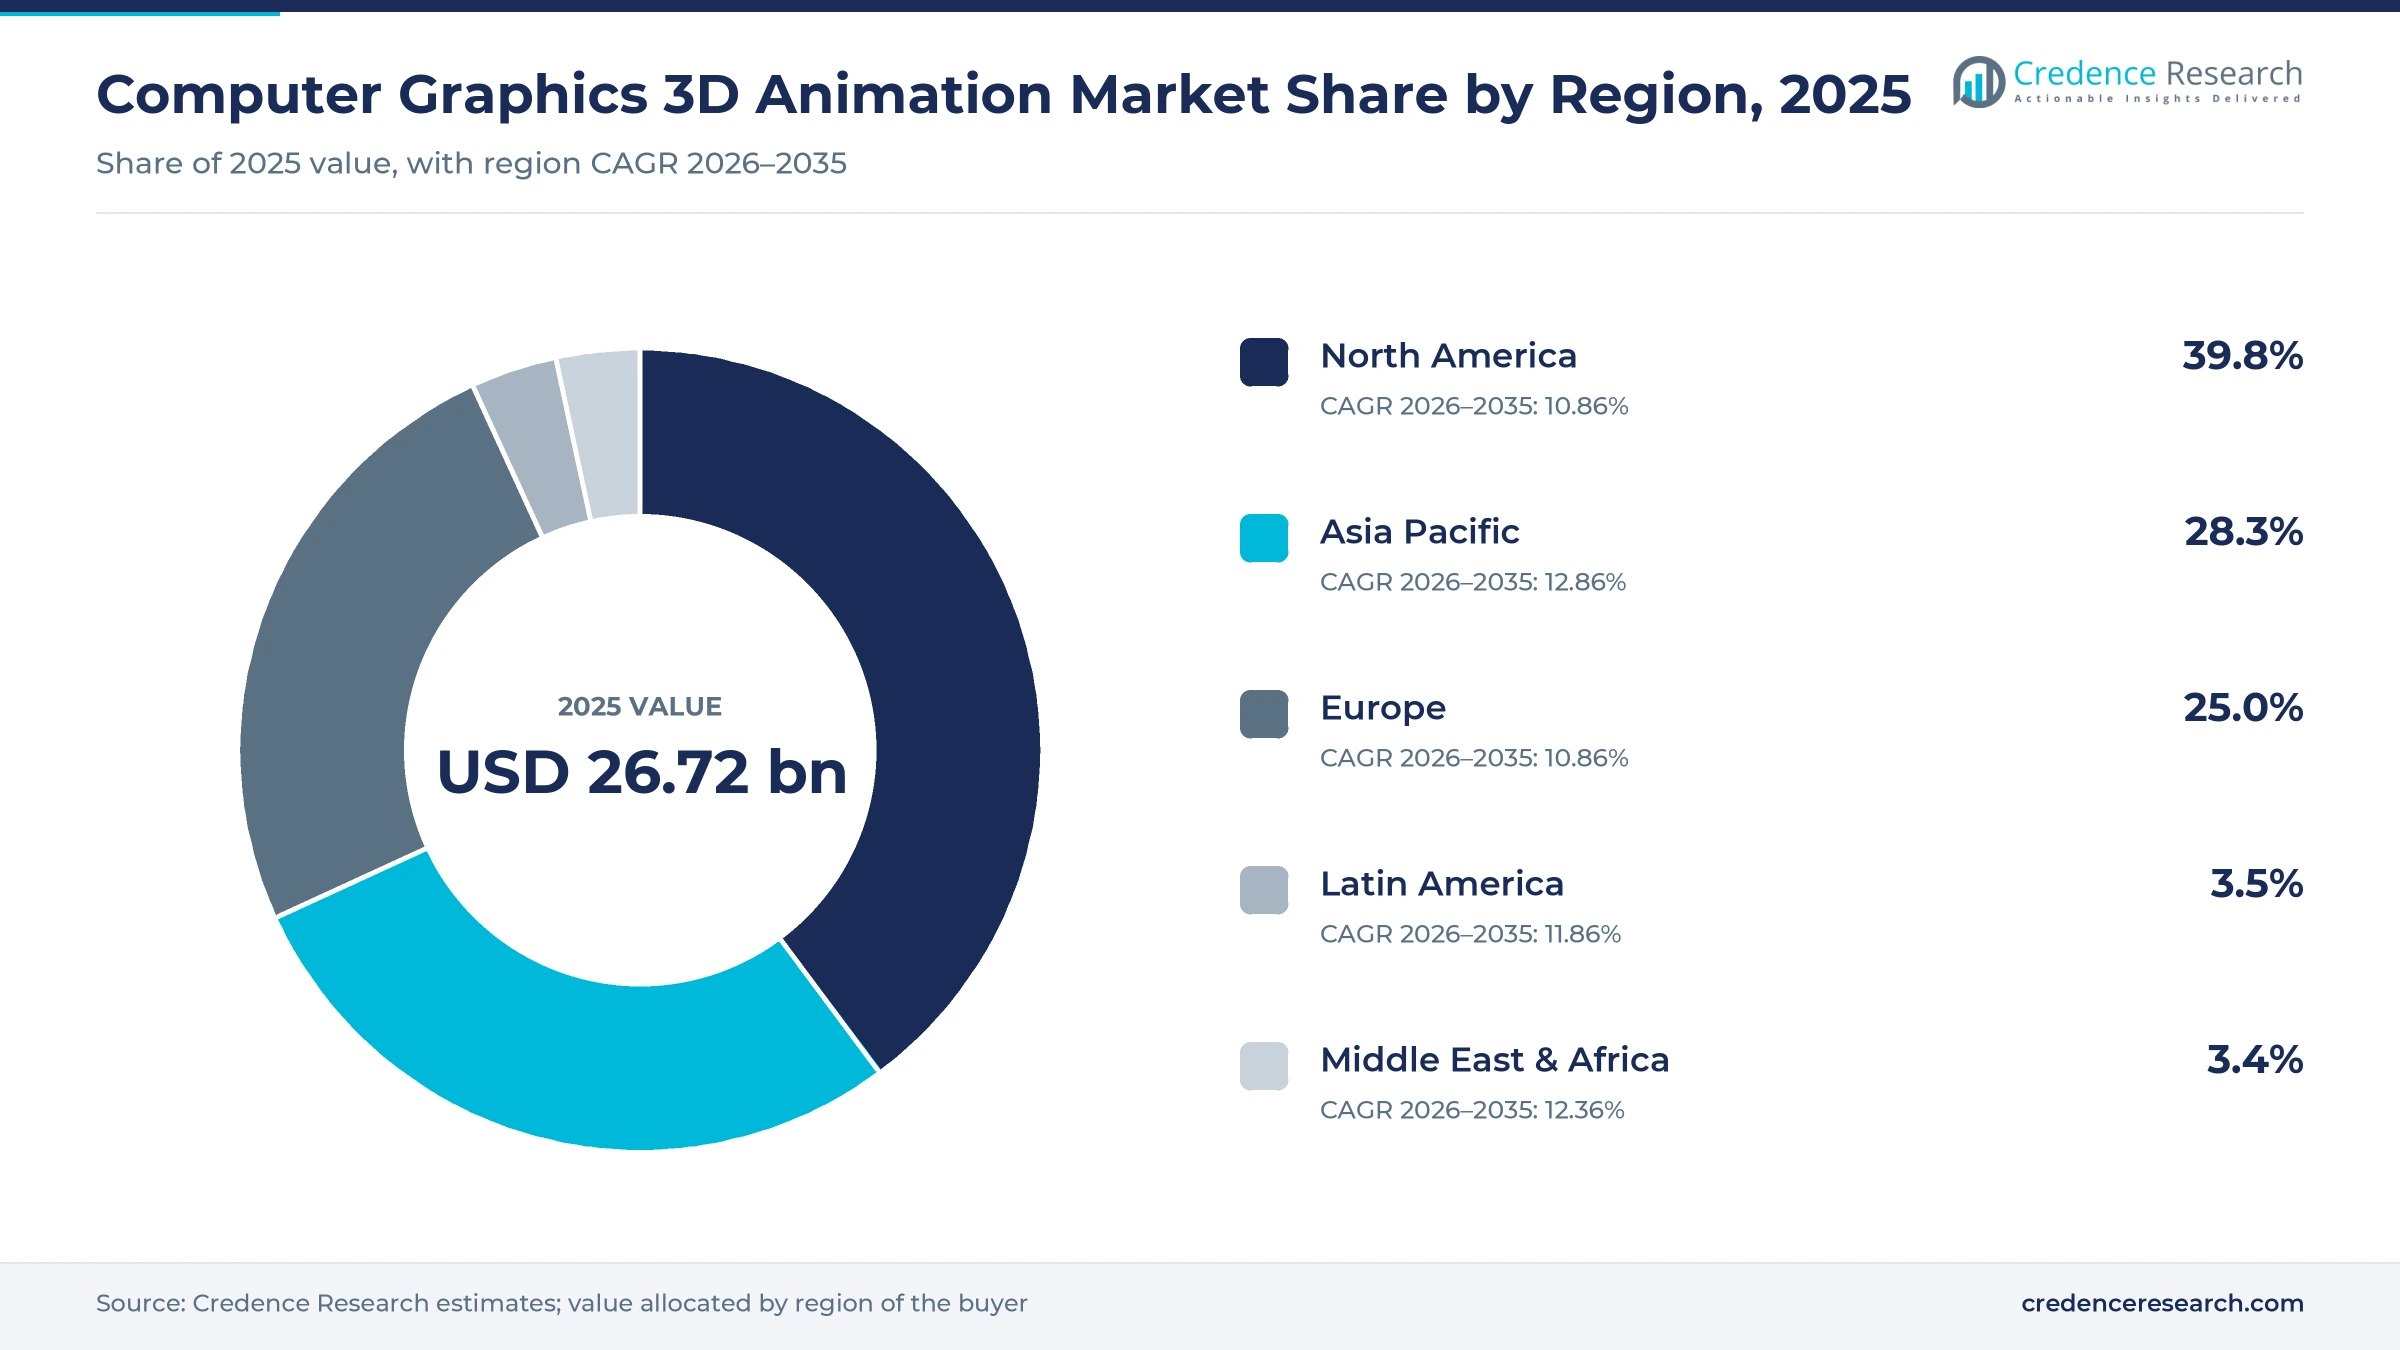
Computer graphics 3D animation value is allocated to the region of the buyer.
| Region | Share 2025 | CAGR 2026–2035 |
|---|---|---|
| North America | 39.8% | 10.86% |
| Asia Pacific | 28.3% | 12.86% |
| Europe | 25.0% | 10.86% |
| Latin America | 3.5% | 11.86% |
| Middle East & Africa | 3.4% | 12.36% |
Why does North America lead?
North America holds a 39.8% share in 2025 and grows at 10.86% a year. Hollywood studios, streaming platforms, large game publishers and most major software vendors are based in the United States and Canada.
Why does Asia Pacific grow fastest?
Asia Pacific holds 28.3% and is the fastest-growing region at 12.86% a year. China's animated films and games, India's outsourced animation and VFX studios, and Japanese and Korean game makers drive demand.
What shapes Europe?
Europe holds 25.0% and grows at 10.86%. London, Paris and Munich host major VFX and animation studios, though studio failures have hit the region.
What about Latin America and the Middle East & Africa?
Latin America holds 3.5% and grows at 11.86%, with animation studios in Brazil, Mexico and Colombia. The Middle East & Africa region holds 3.4% and grows at 12.36%, supported by media investment in the Gulf.
Releases, Standards and Restructuring, 2025–2026
| Development | Status and why it matters |
|---|---|
| In July 2026, the Blender Foundation launched Blender 5.2 LTS. | Launched. Strengthens free tools. |
| In July 2026, AOUSD announced ByteDance, Huawei, Physicl and Unity as new members. | Announced. Widens OpenUSD support. |
| In June 2026, Epic Games launched Unreal Engine 5.8 with production-ready MegaLights and Movie Render Graph. | Launched. Advances real-time rendering. |
| In March 2026, AOUSD announced an interest group on characters, motion and interactivity. | Announced. Extends the standard to animation. |
| In December 2025, AOUSD released the OpenUSD Core Specification 1.0. | Released. Sets a common 3D file standard. |
| In November 2025, the Blender Foundation launched Blender 5.0. | Launched. Major open-source release. |
| In March 2025, TransPerfect announced the acquisition of Technicolor Games after the group's collapse. | Completed. Shows consolidation in services. |
| In January 2025, NVIDIA launched the Cosmos world foundation model platform for physical AI. | Launched. Links 3D simulation and AI training. |
Need a Custom Version of This Report?
Tailor the scope, geography, or segments to your exact requirements.
- Custom geography or segment scope
- Direct access to our analyst team
Tool Vendors, Engine Makers and GPU Suppliers Shape Competition
The market is served by content-creation software vendors, real-time engine makers and hardware suppliers, alongside many production studios. No share ranking is given because vendors do not report 3D animation revenue separately.
Who makes the main creation tools?
Autodesk Inc. sells Maya, 3ds Max, the Arnold renderer and Flow production tracking, and is adding AI to its tools. Adobe Inc., a founding member of the Alliance for OpenUSD, sells Substance 3D texturing tools and After Effects for motion graphics. Maxon Computer GmbH sells Cinema 4D and the Redshift renderer. Side Effects Software Inc. makes Houdini for procedural effects and simulation. The Foundry Visionmongers Ltd. makes Nuke for compositing. Chaos Software GmbH makes the V-Ray, Corona and Enscape renderers.
Who makes the engines and hardware?
Epic Games, Inc. makes Unreal Engine, used for games, virtual production and visualization. Unity Technologies makes the Unity engine and joined the OpenUSD alliance. NVIDIA Corporation supplies RTX GPUs and the Omniverse platform for OpenUSD-based simulation. Blackmagic Design sells DaVinci Resolve with Fusion compositing, mainly for finishing rather than full 3D animation.
How do suppliers compete?
Suppliers compete on pipeline fit, rendering speed, real-time quality, AI features, file compatibility and price. Open standards make switching easier, so vendors compete more on features and cloud services than on lock-in.
What about free tools?
Blender, an open-source tool, competes with commercial software in many small studios and schools, which limits pricing power at the low end. Commercial vendors respond with integrated cloud services, support and pipeline tools that open-source projects rarely provide.
Frequently Asked Questions
How big is the computer graphics 3D animation market?
What drives the market?
Which end user is largest?
Is rendering moving to the cloud?
Which region leads?
What holds the market back?
Table of Content
Chapter 1 Market Segmentation
- 1.1 Segmentation Framework
- 1.1.1 Product and Service Classification
- 1.1.2 Application and End-Use Classification
- 1.1.3 Technology and Solution Classification
- 1.1.4 Customer and Distribution Channel Classification
- 1.1.5 Geographic Segmentation
- 1.1.6 Market Segment Definitions and Boundaries
- 1.2 By Component
- 1.2.1 Software
- 1.2.2 Services
- 1.2.3 Hardware
- 1.3 By Technology
- 1.3.1 3D Modeling & Animation
- 1.3.2 Visual Effects
- 1.3.3 3D Rendering
- 1.3.4 Motion Graphics
- 1.3.5 Simulation
- 1.4 By End User
- 1.4.1 Media & Entertainment
- 1.4.2 Gaming
- 1.4.3 Advertising
- 1.4.4 Architecture/AEC
- 1.4.5 Healthcare
- 1.4.6 Manufacturing
- 1.5 By Deployment
- 1.5.1 On-Premise
- 1.5.2 Cloud/Rendering-as-a-Service
- 1.6 By Workflow
- 1.6.1 Modeling
- 1.6.2 Rigging
- 1.6.3 Animation
- 1.6.4 Rendering
- 1.6.5 Compositing/Post-Production
- 1.7 By Content Type
- 1.7.1 Film/TV
- 1.7.2 Games/Esports
- 1.7.3 Product Visualization
- 1.7.4 Digital Twins/Training
- 1.7.5 AR/VR
Chapter 2 Introduction
- 2.1 Report Objectives and Scope
- 2.2 Product Definition and Industry Terminology
- 2.3 Market Inclusions and Exclusions
- 2.4 Research Process
- 2.4.1 Primary Research and Expert Interviews
- 2.4.2 Secondary Research and Source Review
- 2.4.3 Top-Down and Bottom-Up Estimation
- 2.4.4 Data Triangulation and Verification
- 2.5 Market Size Measurement Basis
- 2.5.1 2025: USD 26.72 billion → 2035: USD 84.15 billion
- 2.6 Historical and Forecast Reference Periods
- 2.6.1 Historical Period: 2018-2025
- 2.6.2 Base Year: 2025
- 2.6.3 Forecast Period: 2025-2035
- 2.7 Research Assumptions and Limitations
Chapter 3 Executive Summary
- 3.1 Market Snapshot and Key Findings
- 3.2 Base-Year Market Size, 2025
- 3.3 Forecast Market Size, 2035
- 3.4 Revenue and Volume Growth Outlook
- 3.5 Key Demand and Supply Indicators
- 3.6 Leading Market Segments
- 3.7 Fastest-Growing Market Opportunities
- 3.8 Regional Performance Highlights
- 3.9 Technology and Industry Transformation
- 3.10 Competitive Landscape Summary
- 3.11 Analyst View and Strategic Implications
Chapter 4 Global Computer Graphics 3D Animation Market Trends and Developments
- 4.1 Historical Industry Development, 2018-2025
- 4.2 Recent Market Trends and Developments
- 4.3 Demand and Customer Behavior Trends
- 4.4 Technology and Product Innovation
- 4.5 Artificial Intelligence, Automation and Digitalization
- 4.6 Local Manufacturing and Supply Chain Realignment
- 4.7 Industry Partnerships, Mergers and Acquisitions
- 4.8 Sustainability and Circular Economy Developments
- 4.9 Government and Private Sector Investment Trends
- 4.10 Emerging Business Models and Commercialization
- 4.11 Industry Developments and Announcements
Chapter 5 Global Computer Graphics 3D Animation Market Production, Supply and Demand Analysis
- 5.1 Demand Trend and Consumption Analysis, 2018-2025
- 5.2 Demand Forecast, 2025-2035
- 5.3 Production and Output Trend, 2018-2025
- 5.4 Production and Output Forecast, 2025-2035
- 5.5 Installed Capacity and Capacity Utilization
- 5.6 Company-Wise Production Plants and Statistics
- 5.6.1 Installed Production Capacity
- 5.6.2 Actual Production
- 5.6.3 Planned Capacity and Expansion Targets
- 5.7 Supply Chain Structure and Procurement Trends
- 5.8 Supply-Demand Gap and Bottlenecks
- 5.9 Import Dependence and Sourcing Structure
- 5.10 Contract Manufacturing and Outsourcing
- 5.11 Regional Supply and Demand Concentration
Chapter 6 Global Computer Graphics 3D Animation Market Pricing Analysis
- 6.1 Pricing Structure and Measurement
- 6.2 Historical Pricing Trends, 2018-2025
- 6.3 Pricing Outlook, 2025-2035
- 6.4 Average Selling Price and Unit Economics
- 6.5 Pricing by Product and Market Segment
- 6.6 Geographic Pricing Differences
- 6.7 Key Input, Energy, Labor and Logistics Costs
- 6.8 Contract Pricing and Purchasing Models
- 6.9 Pricing Sensitivity and Competitive Positioning
- 6.10 Price, Margin and Profitability Implications
Chapter 7 Global Computer Graphics 3D Animation Market Dynamics
- 7.1 Market Growth Drivers
- 7.1.1 Demand-Side Drivers
- 7.1.2 Technology and Innovation Drivers
- 7.1.3 Infrastructure and Investment Drivers
- 7.1.4 Regulatory and Policy Drivers
- 7.2 Market Restraints
- 7.2.1 Cost and Affordability Constraints
- 7.2.2 Technology and Adoption Barriers
- 7.2.3 Supply Chain and Operational Constraints
- 7.3 Market Challenges
- 7.3.1 Competitive Pressure and Margin Erosion
- 7.3.2 Skills, Infrastructure and Implementation Gaps
- 7.4 Emerging Market Opportunities
- 7.5 Market Dynamics Impact and Time-Horizon Assessment
Chapter 8 Global Computer Graphics 3D Animation Value Chain Analysis
- 8.1 Industry Value Chain Overview
- 8.2 Upstream Suppliers and Critical Inputs
- 8.3 Technology and Component Providers
- 8.4 Manufacturing or Service Delivery
- 8.5 Distribution, Channel Partners and Integrators
- 8.6 Downstream Applications and End Users
- 8.7 Value Addition and Profit Pools
- 8.8 Vertical Integration and Outsourcing
- 8.9 Supplier Concentration and Risk
- 8.10 Supply Chain Localization and Resilience
Chapter 9 Global Computer Graphics 3D Animation Market Regulations and Policies
- 9.1 Relevant Laws, Standards and Compliance Frameworks
- 9.2 Product, Service, Safety and Quality Requirements
- 9.3 Government Policies, Incentives and Subsidies
- 9.4 Imports, Exports and Trade Barriers
- 9.5 Public Procurement and Local Content Requirements
- 9.6 Environmental and Sustainability Compliance
- 9.7 Data Protection, AI and Cybersecurity Compliance
- 9.8 Upcoming Policy Changes and Market Implications
Chapter 10 Global Computer Graphics 3D Animation Market Hotspots and Opportunities
- 10.1 Market Opportunity Mapping and Growth Hotspots
- 10.2 High-Growth Applications and Customer Groups
- 10.3 Underserved Markets and White-Space Opportunities
- 10.4 Emerging Technology and Product Opportunities
- 10.5 New Capacity and Investment Hotspots
- 10.6 Market Entry and Expansion Opportunities
- 10.7 Distribution and Partnership Opportunities
- 10.8 Near-Term and Long-Term Commercial Potential
- 10.9 Opportunity Attractiveness and Execution Risks
Chapter 11 Global Computer Graphics 3D Animation Market Outlook, 2025-2035
- 11.1 Market Size and Analysis
- 11.1.1 Revenue (Market Measurement: 2025: USD 26.72 billion → 2035: USD 84.15 billion)
- 11.1.2 Market Volume and Quantity Sold
- 11.1.3 Historical Market Size, 2018-2025
- 11.1.4 Base-Year Market Size, 2025
- 11.2 Market Forecast, 2025-2035
- 11.2.1 Revenue Forecast to 2035
- 11.2.2 Volume Forecast to 2035
- 11.2.3 CAGR and Year-on-Year Growth
- 11.2.4 Incremental Revenue Opportunity
- 11.3 Forecast Assumptions and Scenario Analysis
- 11.3.1 Base-Case Forecast
- 11.3.2 Optimistic and Conservative Scenarios
- 11.3.3 Technology, Pricing and Policy Sensitivities
- 11.4 Market Attractiveness and Growth Outlook
Chapter 12 Global Computer Graphics 3D Animation Market Segmentation and Outlook
- 12.1 Segmentation Summary and Market Shares, 2025
- 12.2 Largest and Fastest-Growing Segments
- 12.3 By Component - Market Size and Forecast, 2025-2035
- 12.3.1 Segment Definition and Scope
- 12.3.2 Historical Market Size, 2018-2025
- 12.3.3 Revenue Forecast, 2025-2035
- 12.3.4 Volume Forecast, 2025-2035
- 12.3.5 Base-Year Market Share, 2025
- 12.3.6 Segment CAGR and Growth Drivers
- 12.3.7 Subsegment Market Size and Forecast
- 12.3.7.1 Software
- 12.3.7.2 Services
- 12.3.7.3 Hardware
- 12.3.8 Subsegment Pricing and Adoption Trends
- 12.3.9 Leading Suppliers and Competition
- 12.3.10 Regional Demand and Opportunities
- 12.4 By Technology - Market Size and Forecast, 2025-2035
- 12.4.1 Segment Definition and Scope
- 12.4.2 Historical Market Size, 2018-2025
- 12.4.3 Revenue Forecast, 2025-2035
- 12.4.4 Volume Forecast, 2025-2035
- 12.4.5 Base-Year Market Share, 2025
- 12.4.6 Segment CAGR and Growth Drivers
- 12.4.7 Subsegment Market Size and Forecast
- 12.4.7.1 3D Modeling & Animation
- 12.4.7.2 Visual Effects
- 12.4.7.3 3D Rendering
- 12.4.7.4 Motion Graphics
- 12.4.7.5 Simulation
- 12.4.8 Subsegment Pricing and Adoption Trends
- 12.4.9 Leading Suppliers and Competition
- 12.4.10 Regional Demand and Opportunities
- 12.5 By End User - Market Size and Forecast, 2025-2035
- 12.5.1 Segment Definition and Scope
- 12.5.2 Historical Market Size, 2018-2025
- 12.5.3 Revenue Forecast, 2025-2035
- 12.5.4 Volume Forecast, 2025-2035
- 12.5.5 Base-Year Market Share, 2025
- 12.5.6 Segment CAGR and Growth Drivers
- 12.5.7 Subsegment Market Size and Forecast
- 12.5.7.1 Media & Entertainment
- 12.5.7.2 Gaming
- 12.5.7.3 Advertising
- 12.5.7.4 Architecture/AEC
- 12.5.7.5 Healthcare
- 12.5.7.6 Manufacturing
- 12.5.8 Subsegment Pricing and Adoption Trends
- 12.5.9 Leading Suppliers and Competition
- 12.5.10 Regional Demand and Opportunities
- 12.6 By Deployment - Market Size and Forecast, 2025-2035
- 12.6.1 Segment Definition and Scope
- 12.6.2 Historical Market Size, 2018-2025
- 12.6.3 Revenue Forecast, 2025-2035
- 12.6.4 Volume Forecast, 2025-2035
- 12.6.5 Base-Year Market Share, 2025
- 12.6.6 Segment CAGR and Growth Drivers
- 12.6.7 Subsegment Market Size and Forecast
- 12.6.7.1 On-Premise
- 12.6.7.2 Cloud/Rendering-as-a-Service
- 12.6.8 Subsegment Pricing and Adoption Trends
- 12.6.9 Leading Suppliers and Competition
- 12.6.10 Regional Demand and Opportunities
- 12.7 By Workflow - Market Size and Forecast, 2025-2035
- 12.7.1 Segment Definition and Scope
- 12.7.2 Historical Market Size, 2018-2025
- 12.7.3 Revenue Forecast, 2025-2035
- 12.7.4 Volume Forecast, 2025-2035
- 12.7.5 Base-Year Market Share, 2025
- 12.7.6 Segment CAGR and Growth Drivers
- 12.7.7 Subsegment Market Size and Forecast
- 12.7.7.1 Modeling
- 12.7.7.2 Rigging
- 12.7.7.3 Animation
- 12.7.7.4 Rendering
- 12.7.7.5 Compositing/Post-Production
- 12.7.8 Subsegment Pricing and Adoption Trends
- 12.7.9 Leading Suppliers and Competition
- 12.7.10 Regional Demand and Opportunities
- 12.8 By Content Type - Market Size and Forecast, 2025-2035
- 12.8.1 Segment Definition and Scope
- 12.8.2 Historical Market Size, 2018-2025
- 12.8.3 Revenue Forecast, 2025-2035
- 12.8.4 Volume Forecast, 2025-2035
- 12.8.5 Base-Year Market Share, 2025
- 12.8.6 Segment CAGR and Growth Drivers
- 12.8.7 Subsegment Market Size and Forecast
- 12.8.7.1 Film/TV
- 12.8.7.2 Games/Esports
- 12.8.7.3 Product Visualization
- 12.8.7.4 Digital Twins/Training
- 12.8.7.5 AR/VR
- 12.8.8 Subsegment Pricing and Adoption Trends
- 12.8.9 Leading Suppliers and Competition
- 12.8.10 Regional Demand and Opportunities
- 12.9 Segment Growth Comparison
- 12.10 Segment Attractiveness and Priority Matrix
Chapter 13 Global Computer Graphics 3D Animation End-Use and Application Market Outlook
- 13.1 End-Use Industry and Customer Demand Structure
- 13.2 Leading Applications and Customer Groups
- 13.3 End-Use Market Size, Share and Forecast
- 13.4 Major End-Use Industry Deep Dives
- 13.4.1 Customer Requirements and Use Cases
- 13.4.2 Demand and Replacement Cycles
- 13.4.3 Technical and Regulatory Considerations
- 13.4.4 Purchasing and Procurement Models
- 13.4.5 Leading Vendors and Distribution Channels
- 13.4.6 Forecast and Commercial Opportunities
- 13.5 Emerging Applications and Cross-Segment Demand
- 13.6 End-Use Industry Investment Priorities
Chapter 14 Global Computer Graphics 3D Animation Geographic Market Outlook, 2025-2035
- 14.1 Regional Market Size and Share, 2025
- 14.2 Regional Market Forecast, 2025-2035
- 14.3 Regional Pricing, Production and Demand Differences
- 14.4 North America
- 14.4.1 United States
- 14.4.2 Canada
- 14.4.3 Mexico
- 14.5 Europe
- 14.5.1 Germany
- 14.5.2 France
- 14.5.3 Italy
- 14.5.4 United Kingdom
- 14.5.5 Spain
- 14.5.6 Poland
- 14.5.7 Russia
- 14.5.8 Netherlands
- 14.5.9 Belgium
- 14.5.10 Sweden
- 14.5.11 Denmark
- 14.5.12 Norway
- 14.5.13 Rest of Europe
- 14.6 Asia Pacific
- 14.6.1 China
- 14.6.2 India
- 14.6.3 Japan
- 14.6.4 South Korea
- 14.6.5 Thailand
- 14.6.6 Indonesia
- 14.6.7 Vietnam
- 14.6.8 Malaysia
- 14.6.9 Australia
- 14.6.10 Rest of Asia Pacific
- 14.7 Latin America
- 14.7.1 Brazil
- 14.7.2 Argentina
- 14.7.3 Colombia
- 14.7.4 Chile
- 14.7.5 Rest of Latin America
- 14.8 Middle East
- 14.8.1 Saudi Arabia
- 14.8.2 United Arab Emirates
- 14.8.3 Turkey
- 14.8.4 Israel
- 14.8.5 Iran
- 14.8.6 Rest of the Middle East
- 14.9 Africa
- 14.9.1 South Africa
- 14.9.2 Egypt
- 14.9.3 Nigeria
- 14.9.4 Morocco
- 14.9.5 Rest of Africa
- 14.10 Regional Investment, Policy and Supply Chain Differences
- 14.11 Regional Competitive Landscape
- 14.12 Geographic Growth Hotspots
Chapter 15 Global Computer Graphics 3D Animation Technology, Innovation and Sustainability Outlook
- 15.1 Technology Landscape and Maturity
- 15.2 Product, Process and Service Innovation
- 15.3 AI, Automation and Digital Tools in the Industry
- 15.4 Technology Adoption and Performance Benchmarking
- 15.5 Innovation Pipeline and R&D Investment
- 15.6 Patent and Intellectual Property Trends
- 15.7 Energy Efficiency and Resource Management
- 15.8 Sustainability, Recycling and Circularity
- 15.9 Technology Roadmap, 2025-2035
- 15.10 Risks of Obsolescence and Technology Substitution
Chapter 16 Global Computer Graphics 3D Animation Market Key Strategic Imperatives
- 16.1 Growth and Market Entry Priorities
- 16.2 High-Return Products and Segments
- 16.3 Pricing, Profitability and Cost Optimization
- 16.4 Technology Investment and Product Differentiation
- 16.5 Supply Chain Localization and Resilience
- 16.6 Distribution and Customer Acquisition
- 16.7 Partnership, Acquisition and Capacity Strategy
- 16.8 Regional Expansion Priorities
- 16.9 Short-, Medium- and Long-Term Actions
Chapter 17 Competition Outlook
- 17.1 Industry Competition Characteristics
- 17.2 Market Structure and Concentration
- 17.3 Market Share and Competitive Positioning, 2025
- 17.4 Company-Wise Revenue and Product Benchmarking
- 17.5 Production and Service Capacity Benchmarking
- 17.6 Technology, Pricing and Differentiation
- 17.7 Regional Footprint and Distribution Strength
- 17.8 Mergers, Acquisitions and Strategic Alliances
- 17.9 New Entrants and Competitive Threats
- 17.10 Porter's Five Forces and Industry Attractiveness
- 17.11 Competitive Outlook, 2025-2035
Chapter 18 Company Profiles
- 18.1 Company Coverage and Selection Criteria
- 18.2 Adobe Inc.
- 18.2.1 Business Description
- 18.2.2 Company Ownership and Geographic Presence
- 18.2.3 Product and Service Portfolio
- 18.2.4 Manufacturing and Operating Footprint
- 18.2.5 Production Capacity and Expansion Plans
- 18.2.6 Financial Performance and Investment
- 18.2.7 Market Share and Competitive Position
- 18.2.8 Technology and Innovation Capabilities
- 18.2.9 Strategic Alliances or Partnerships
- 18.2.10 Recent Developments
- 18.2.11 Growth Strategy and Outlook
- 18.3 Autodesk Inc.
- 18.4 NVIDIA Corporation
- 18.5 Epic Games, Inc.
- 18.6 Unity Technologies
- 18.7 Maxon Computer GmbH
- 18.8 Side Effects Software Inc.
- 18.9 The Foundry Visionmongers Ltd.
- 18.10 Chaos Software GmbH
- 18.11 Blackmagic Design
- 18.12 Other Relevant Market Participants
Note: Every listed company is profiled on the structure shown under the first company. The company list is preliminary and may change based on research findings, market developments, data availability and client requirements.
Chapter 19 Disclaimer
- 19.1 Research and Forecast Disclaimer
- 19.2 Data Source and Estimation Limitations
Note: The depth of individual sections depends on data availability for this market. Volume, capacity, trade and other unit-based metrics are included where applicable.