
Processor value is moving toward servers and on-device AI
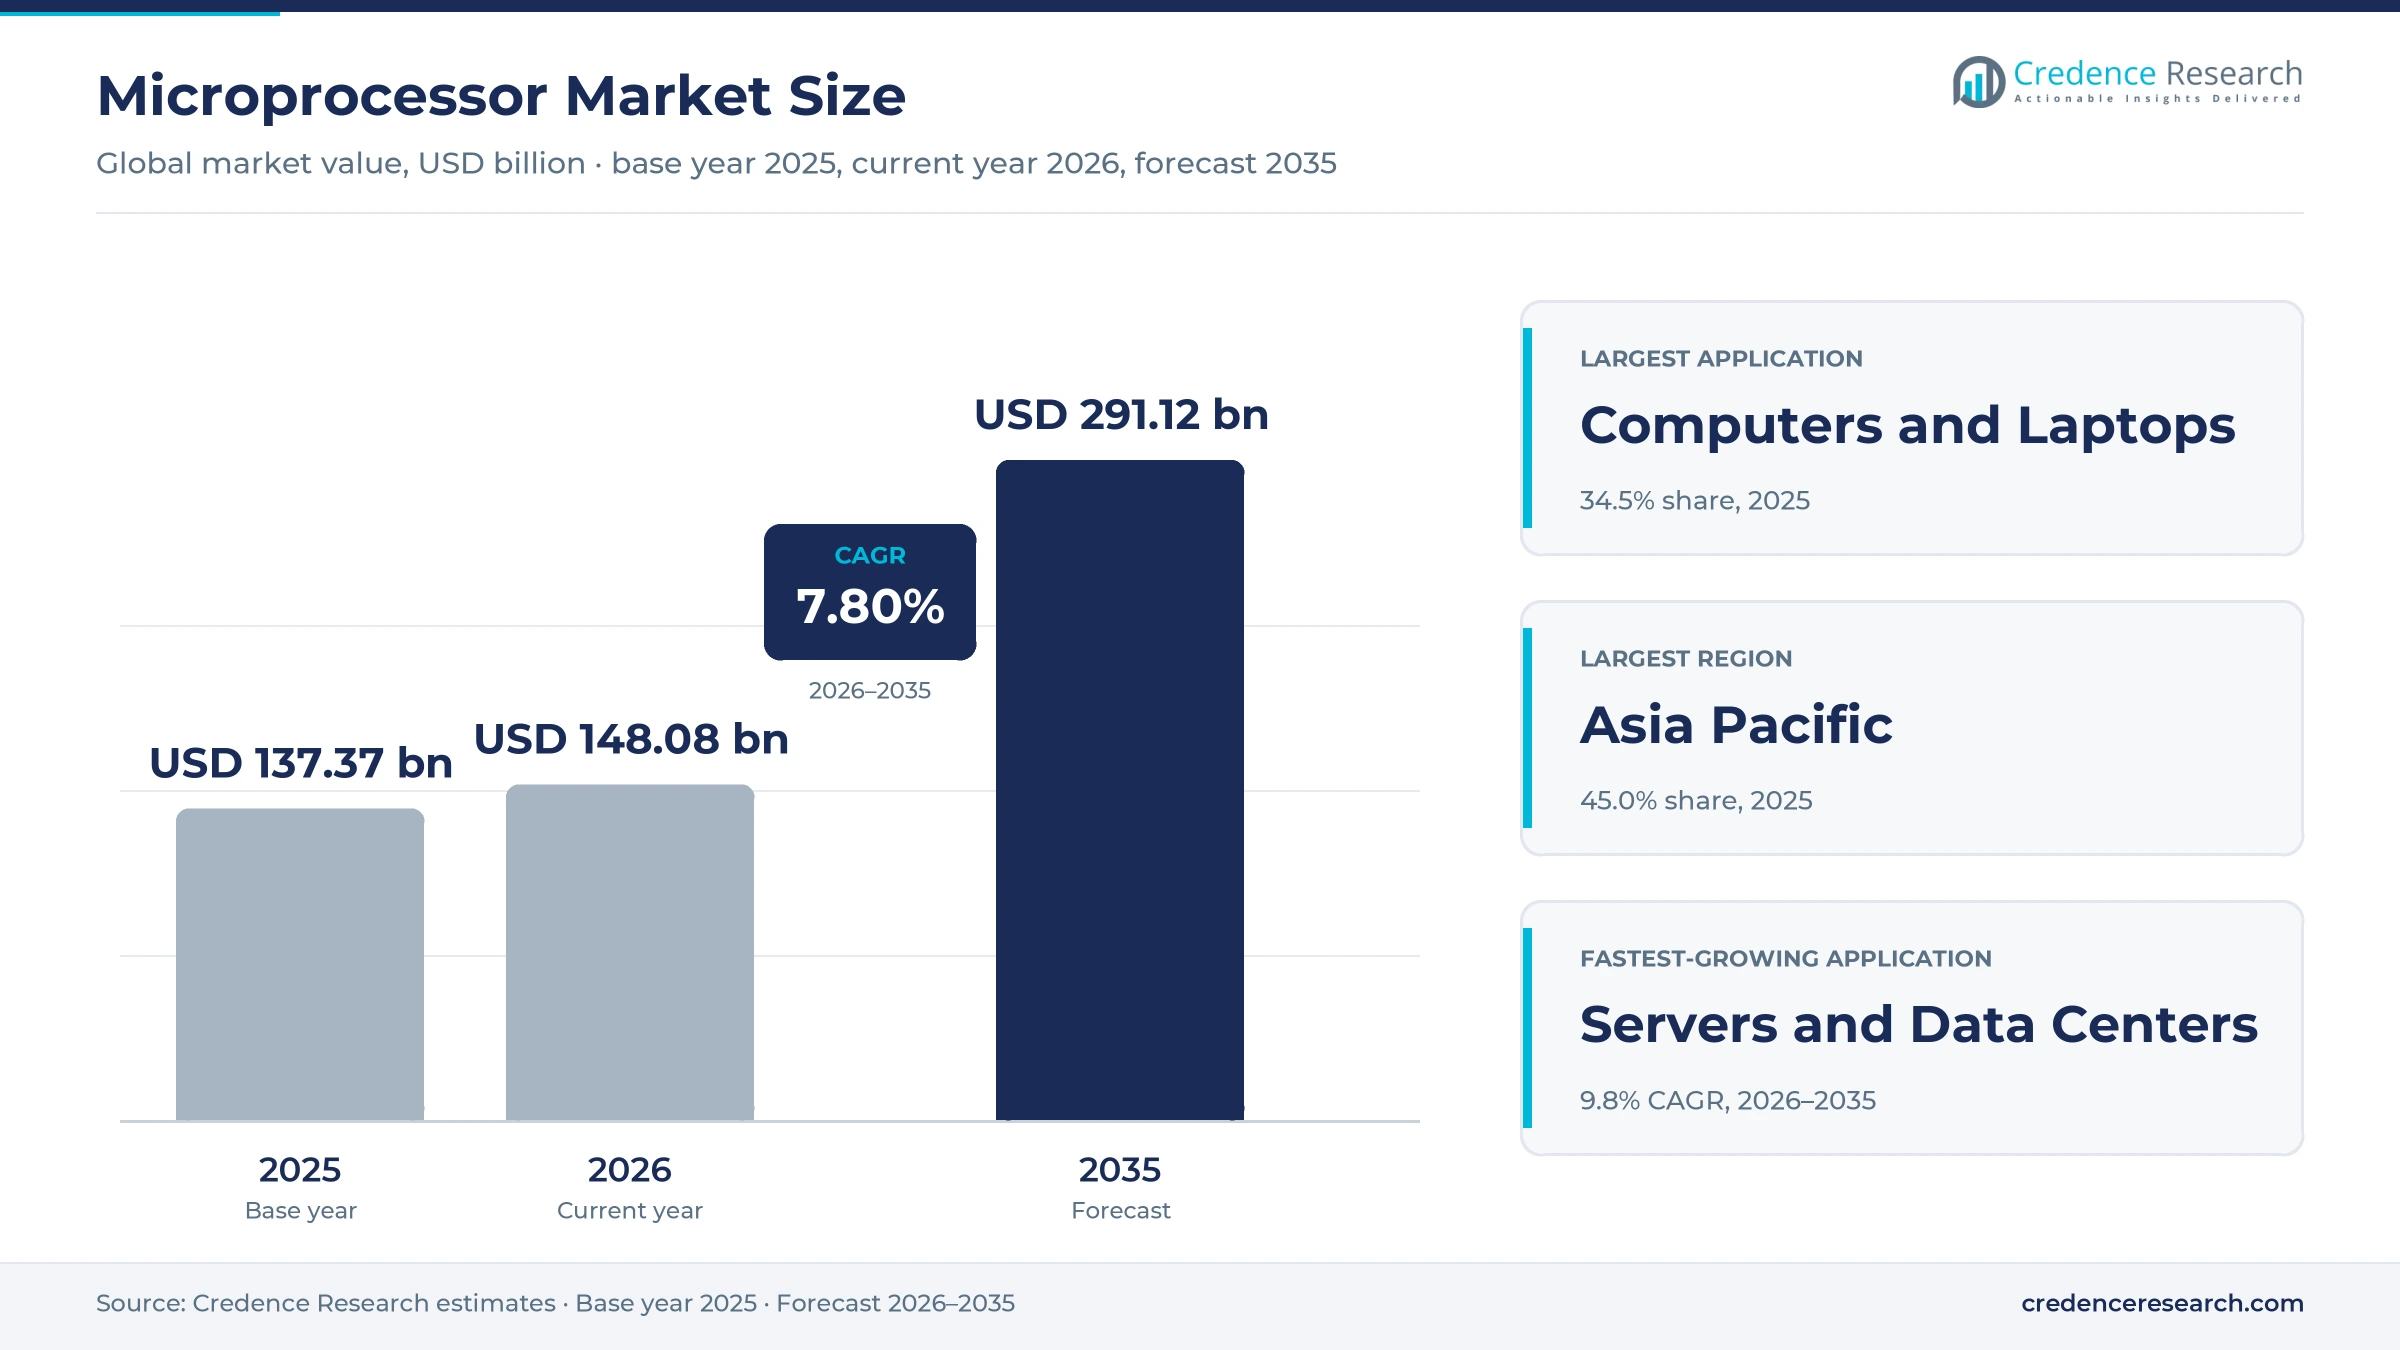
The global microprocessor market was valued at USD 137.37 billion in 2025 and is projected to increase from USD 148.08 billion in 2026 to USD 291.12 billion by 2035, registering a CAGR of 7.80% during 2026–2035. Demand comes from PC and laptop makers, smartphone and tablet brands, cloud and enterprise server buyers and industrial equipment builders that need a central processor in every system they ship. Asia Pacific held the largest regional share, 45.0% in 2025, because most phones, laptops and servers are assembled in China, Taiwan, Vietnam and India. North America is the fastest-growing region at 8.4% a year, as cloud operators there add general-purpose processors for AI inference and agent workloads. The commercial change that matters most is that server CPUs became scarce in 2026, which handed Intel, AMD and other suppliers rare pricing power over large buyers.
Which processors count, and why are graphics chips left out?
The estimate covers central processing units for PCs, laptops and servers, application processors for smartphones and tablets, and embedded microprocessors that run full operating systems in industrial, automotive and networking gear. Processors that phone and cloud companies design for their own use are counted at estimated chip cost, because they replace chips that would otherwise be bought from merchant suppliers.
Discrete graphics processors, dedicated AI accelerators and microcontrollers sit outside the estimate, although graphics and neural engines built into a processor die are included. Buyers mostly purchase through quarterly price agreements, with large PC and server makers negotiating volume discounts from list prices. Value is measured at the chip level, before the margin earned by the device or server maker.
Microprocessor Market Insights
- The market is valued at USD 137.37 billion in 2025 and is projected to reach USD 291.12 billion by 2035, growing at a 7.80% CAGR as servers and AI PCs lift chip content.
- Asia Pacific led with 45.0% of 2025 value, because most phones, laptops and servers are assembled in Chinese, Taiwanese and Indian plants.
- Computers and Laptops held 34.5% of 2025 value, while Servers and Data Centers grow fastest at 9.8% a year to 2035.
- Intel CFO David Zinsner said in April 2026 that the CPU-to-GPU ratio in AI data centers had moved from 1 to 8 toward 1 to 4.
- Arm launched its first in-house processor, the AGI CPU, in March 2026 with Meta as its first customer, adding a new merchant supplier.
PCs lead on value while server processors grow fastest
Why do PCs lead while server processors grow fastest?
Based on application, the market is categorized into computers and laptops, smartphones and tablets, servers and data centers, embedded systems and consumer electronics. Computers and Laptops led with 34.5% of 2025 value because desktop and laptop CPUs sell at higher prices per unit than most phone chips, and the end of Windows 10 support, covered in the drivers, pushed corporate fleets onto new processors within a single year. Servers and Data Centers grow fastest at 9.8% a year as AI agents need more general-purpose cores per accelerator, a shift Intel described in April 2026.
Why does x86 lead while RISC-V grows fastest from a small base?
Based on architecture, the market is categorized into x86, Arm and RISC-V and others. x86 led with 51.0% of 2025 value because nearly all Windows PCs and most enterprise servers still run Intel and AMD processors, and software compatibility keeps switching costs high. Arm follows closely on phone, tablet and cloud CPU volume. RISC-V and Others grows fastest at 13.7% a year as server-grade standards mature. RISC-V International ratified the RVA23 application profile at the end of 2024, and Scaleway launched the first RISC-V cloud instances in 2025, giving software vendors a stable target.
Why do processors at 7 nm and below dominate value?
Based on process node, the market is categorized into 7 nm and below and 10 nm and above. 7 nm and Below led with 72.0% of 2025 value because flagship phone, laptop and server processors moved to 3 nm and 2 nm class nodes, where each die carries the most cores and the highest price. Apple built its M5 on third-generation 3 nm technology in October 2025, and Samsung announced the Exynos 2600 as what it called the first 2 nm mobile chip in December 2025. The same group also grows fastest at 8.2% a year, while older nodes keep embedded and entry-level designs supplied at lower cost.
| Segment Group | Leading Sub-segment | Share, 2025 | Fastest-growing Sub-segment | CAGR, 2026–2035 |
|---|---|---|---|---|
| By Application | Computers and Laptops | 34.5% | Servers and Data Centers | 9.8% |
| By Architecture | x86 | 51.0% | RISC-V and Others | 13.7% |
| By Process Node | 7 nm and Below | 72.0% | 7 nm and Below | 8.2% |
List prices span from about USD 500 to USD 15,000 a chip
Processor pricing is tiered by core count and segment, with list prices set per chip and large buyers paying less through volume agreements. Server parts carry the widest range, because a 192-core chip replaces several smaller servers and saves power and licensing costs. Prices turned upward in 2026 for the first time in years, as the table shows, because Intel shifted wafers toward data center parts and AMD faced longer lead times. Higher foundry wafer prices at 3 nm and 2 nm add to costs as well. PC makers absorb part of the increase, but buyers of entry-level laptops face fewer configurations and higher shelf prices.
| Processor or price change | Typical price or fee | Basis |
|---|---|---|
| AMD EPYC 9965, 192 cores | USD 14,813 per chip at launch | TechSpot, October 2024 |
| AMD EPYC 9015, eight cores | USD 527 per chip at launch | TechSpot, October 2024 |
| Intel Core Ultra 9 285K desktop CPU | USD 589 per chip at launch | Notebookcheck, October 2024 |
| Server CPU price change | Up 10% to 20% since March 2026 | Commercial Times via Tom's Hardware, April 2026 |
| Consumer CPU price change | Up 5% to 10% since March 2026 | Commercial Times via Tom's Hardware, April 2026 |
Request a Free Sample
Fill in your details and we'll send you a free sample report.
- Sample data tables & charts
- Research methodology
AI inference, PC refresh and cloud CPUs lift chip demand
AI inference and agents raise CPU demand in data centers
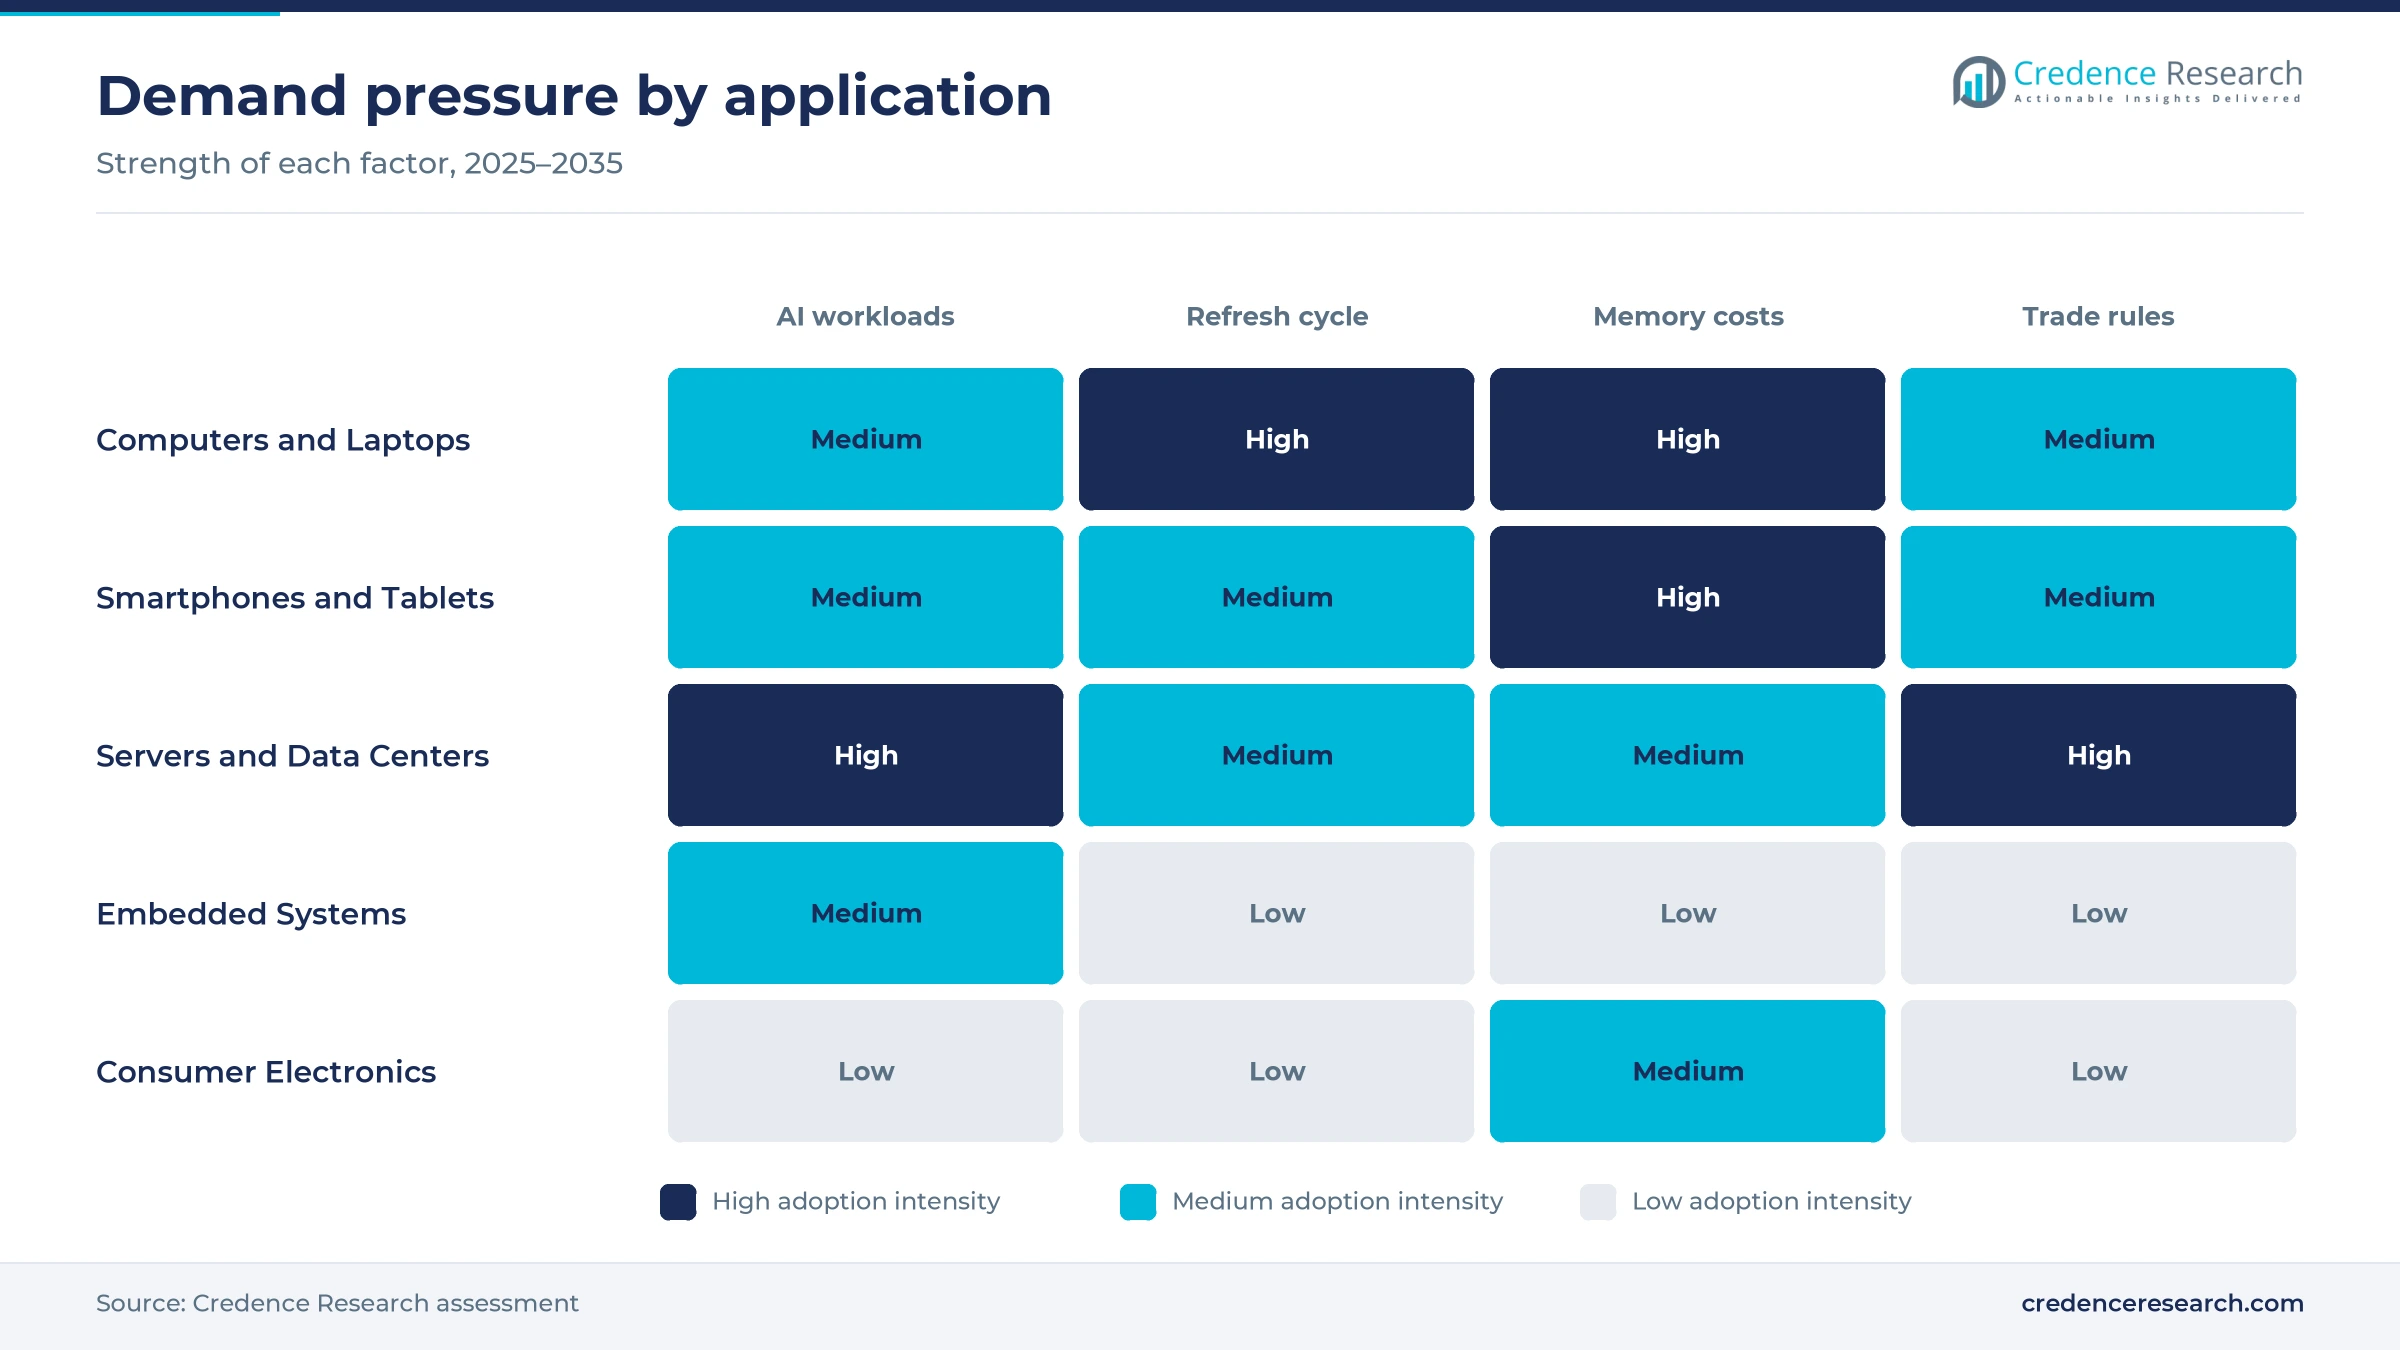
The shift from AI training to inference and agent workloads is raising the number of general-purpose processors installed next to each accelerator, because agents call databases, tools and web services that run on CPUs. Intel CFO David Zinsner said in April 2026 that the CPU-to-GPU ratio had moved from 1 to 8 toward 1 to 4 and could reach 1 to 1, Tom's Hardware reported. Server CPU lead times stretched to about six months in the same period. AMD's fourth-quarter 2025 results attribute its data center gains to demand for EPYC server processors. Suppliers with spare capacity at advanced nodes gain the most, while cloud buyers lock in multi-quarter allocations.
Windows 10 retirement and AI PCs pull forward laptop upgrades
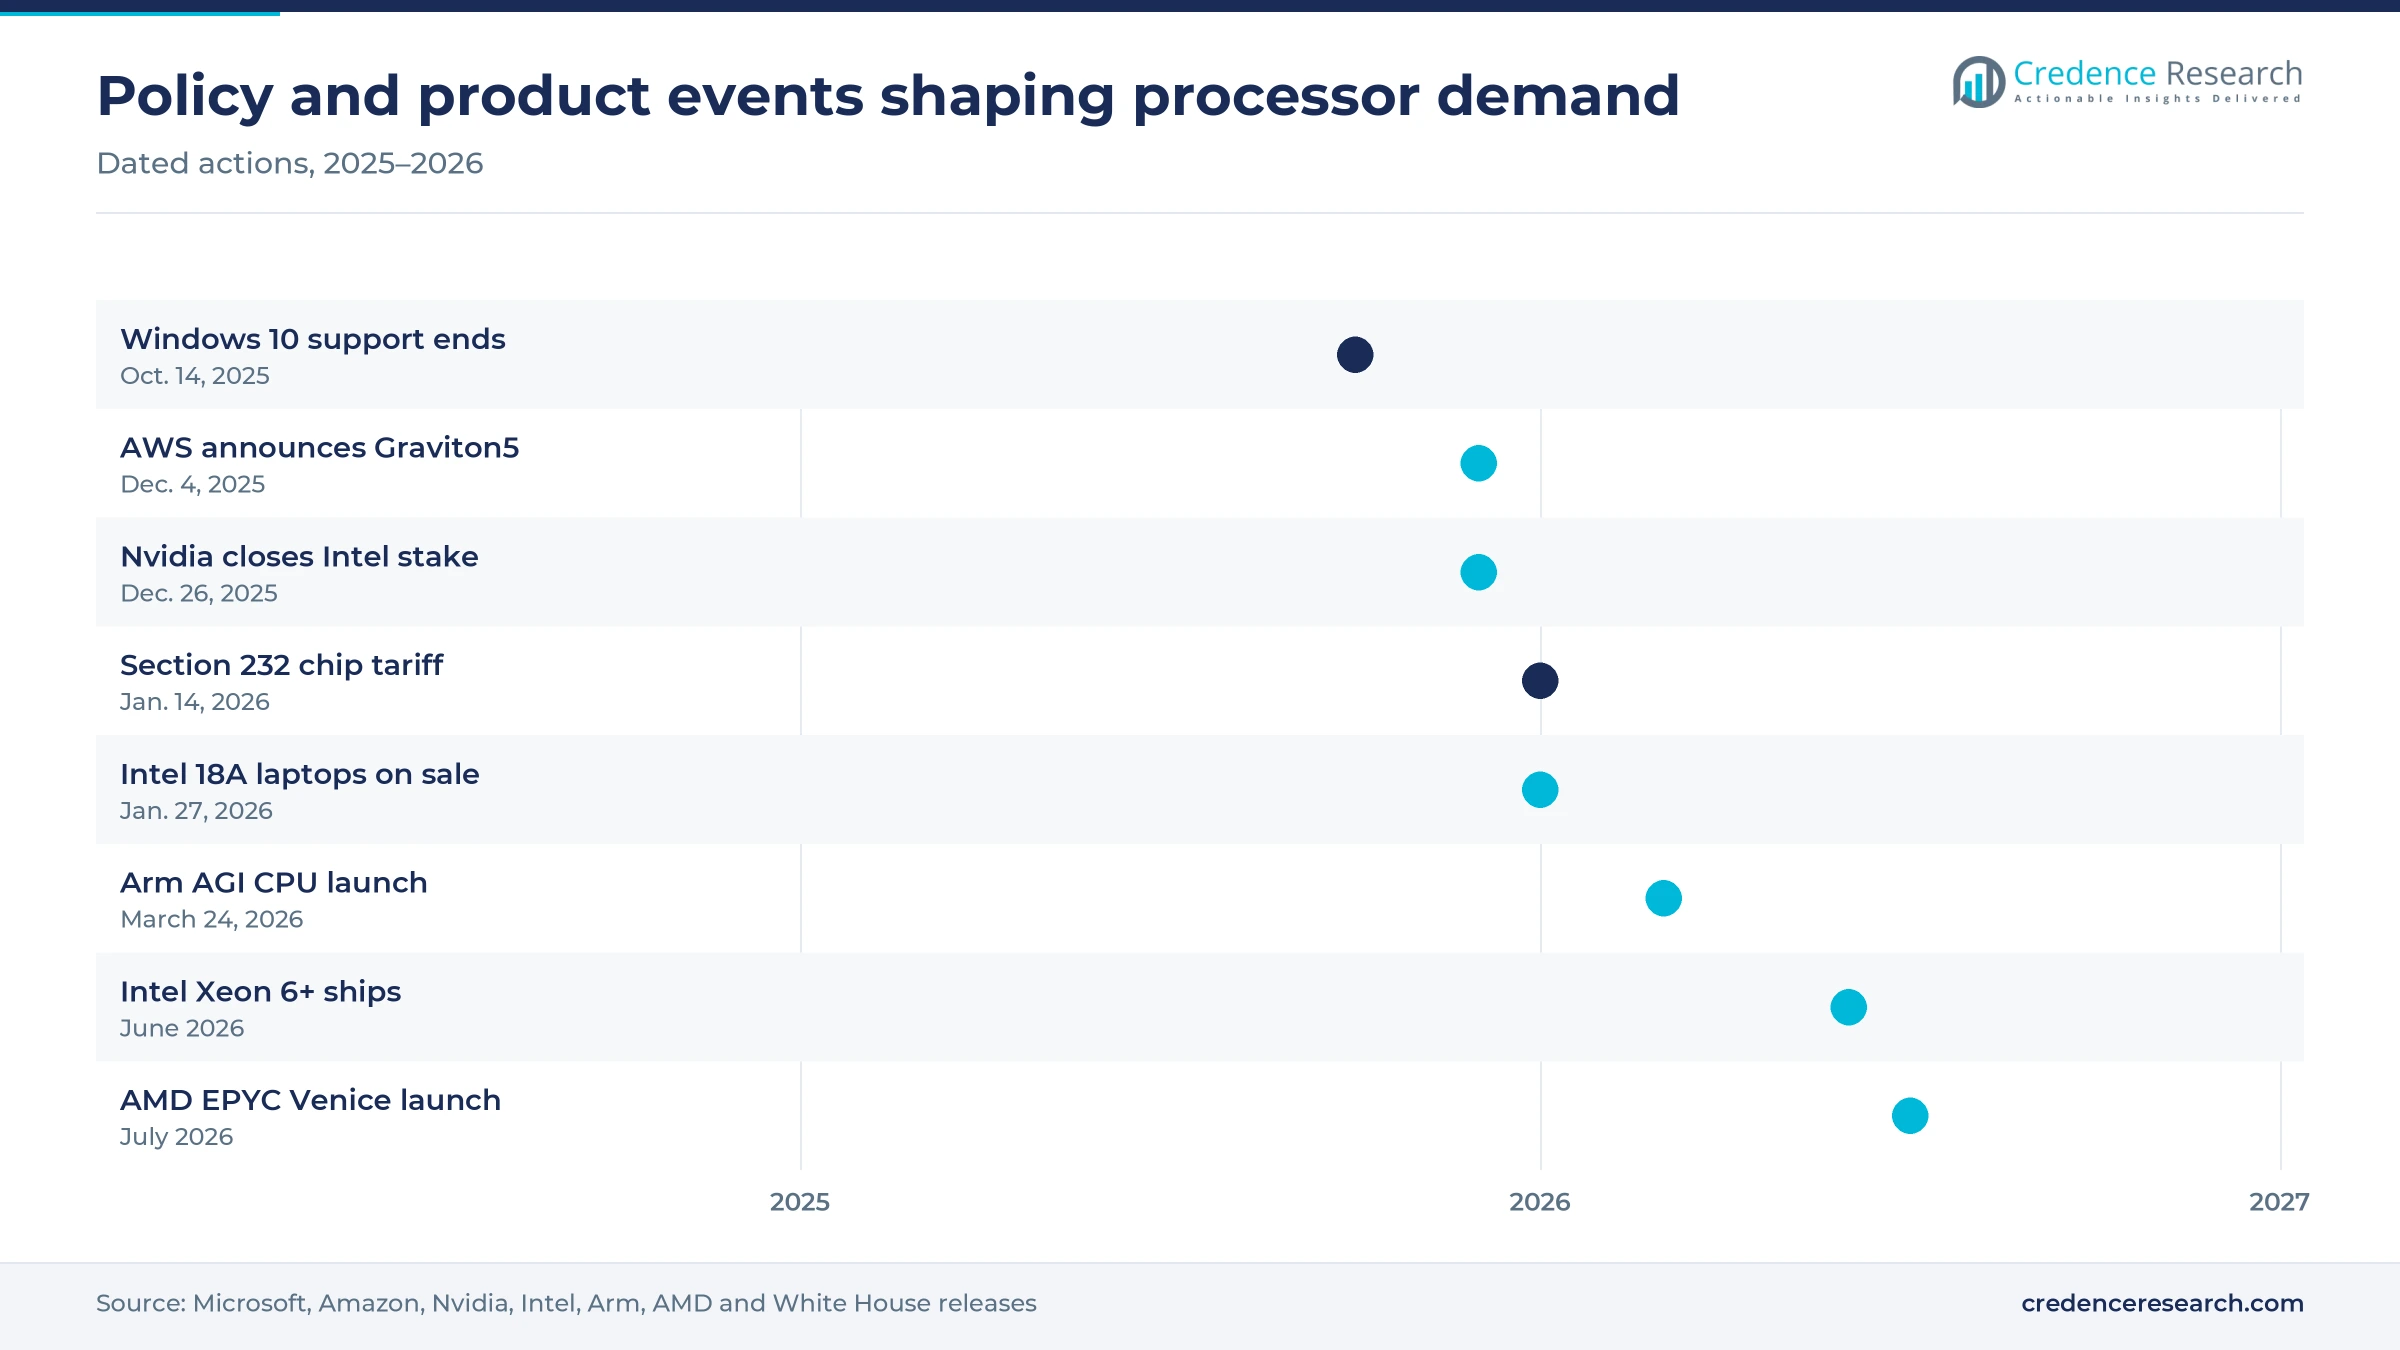
The end of Windows 10 support forced companies to replace older PCs, and the replacement cycle coincided with a push toward laptops that run AI tasks locally. Microsoft ended Windows 10 support on Oct. 14, 2025, leaving many corporate fleets without security updates unless they paid for extended coverage. Qualcomm unveiled the Snapdragon X2 Elite on Sept. 24, 2025, with an 80 TOPS neural processor and devices due in the first half of 2026. Microsoft's consumer Extended Security Updates program ends on Oct. 12, 2027, which sets an outer limit for the remaining Windows 10 fleet. Each refresh lifts the average price per CPU, because buyers specify chips with neural engines and more cores.
Cloud operators build their own Arm server processors
The largest cloud operators now design their own Arm server processors, which adds a captive layer of demand alongside merchant x86 chips. Amazon said Graviton5 has 192 cores and up to 25% higher performance, and that Graviton has supplied more than half of new AWS CPU capacity for three years running. Microsoft announced the 132-core Cobalt 200 on Nov. 18, 2025, after Cobalt 100 expanded to 32 Azure regions. Arm projected in April 2025 that close to half of the compute shipped to top hyperscalers that year would be Arm-based. For hyperscale data centers, in-house chips cut cost per instance, and merchant suppliers lose that volume.
Neural engines raise silicon content in phones and tablets
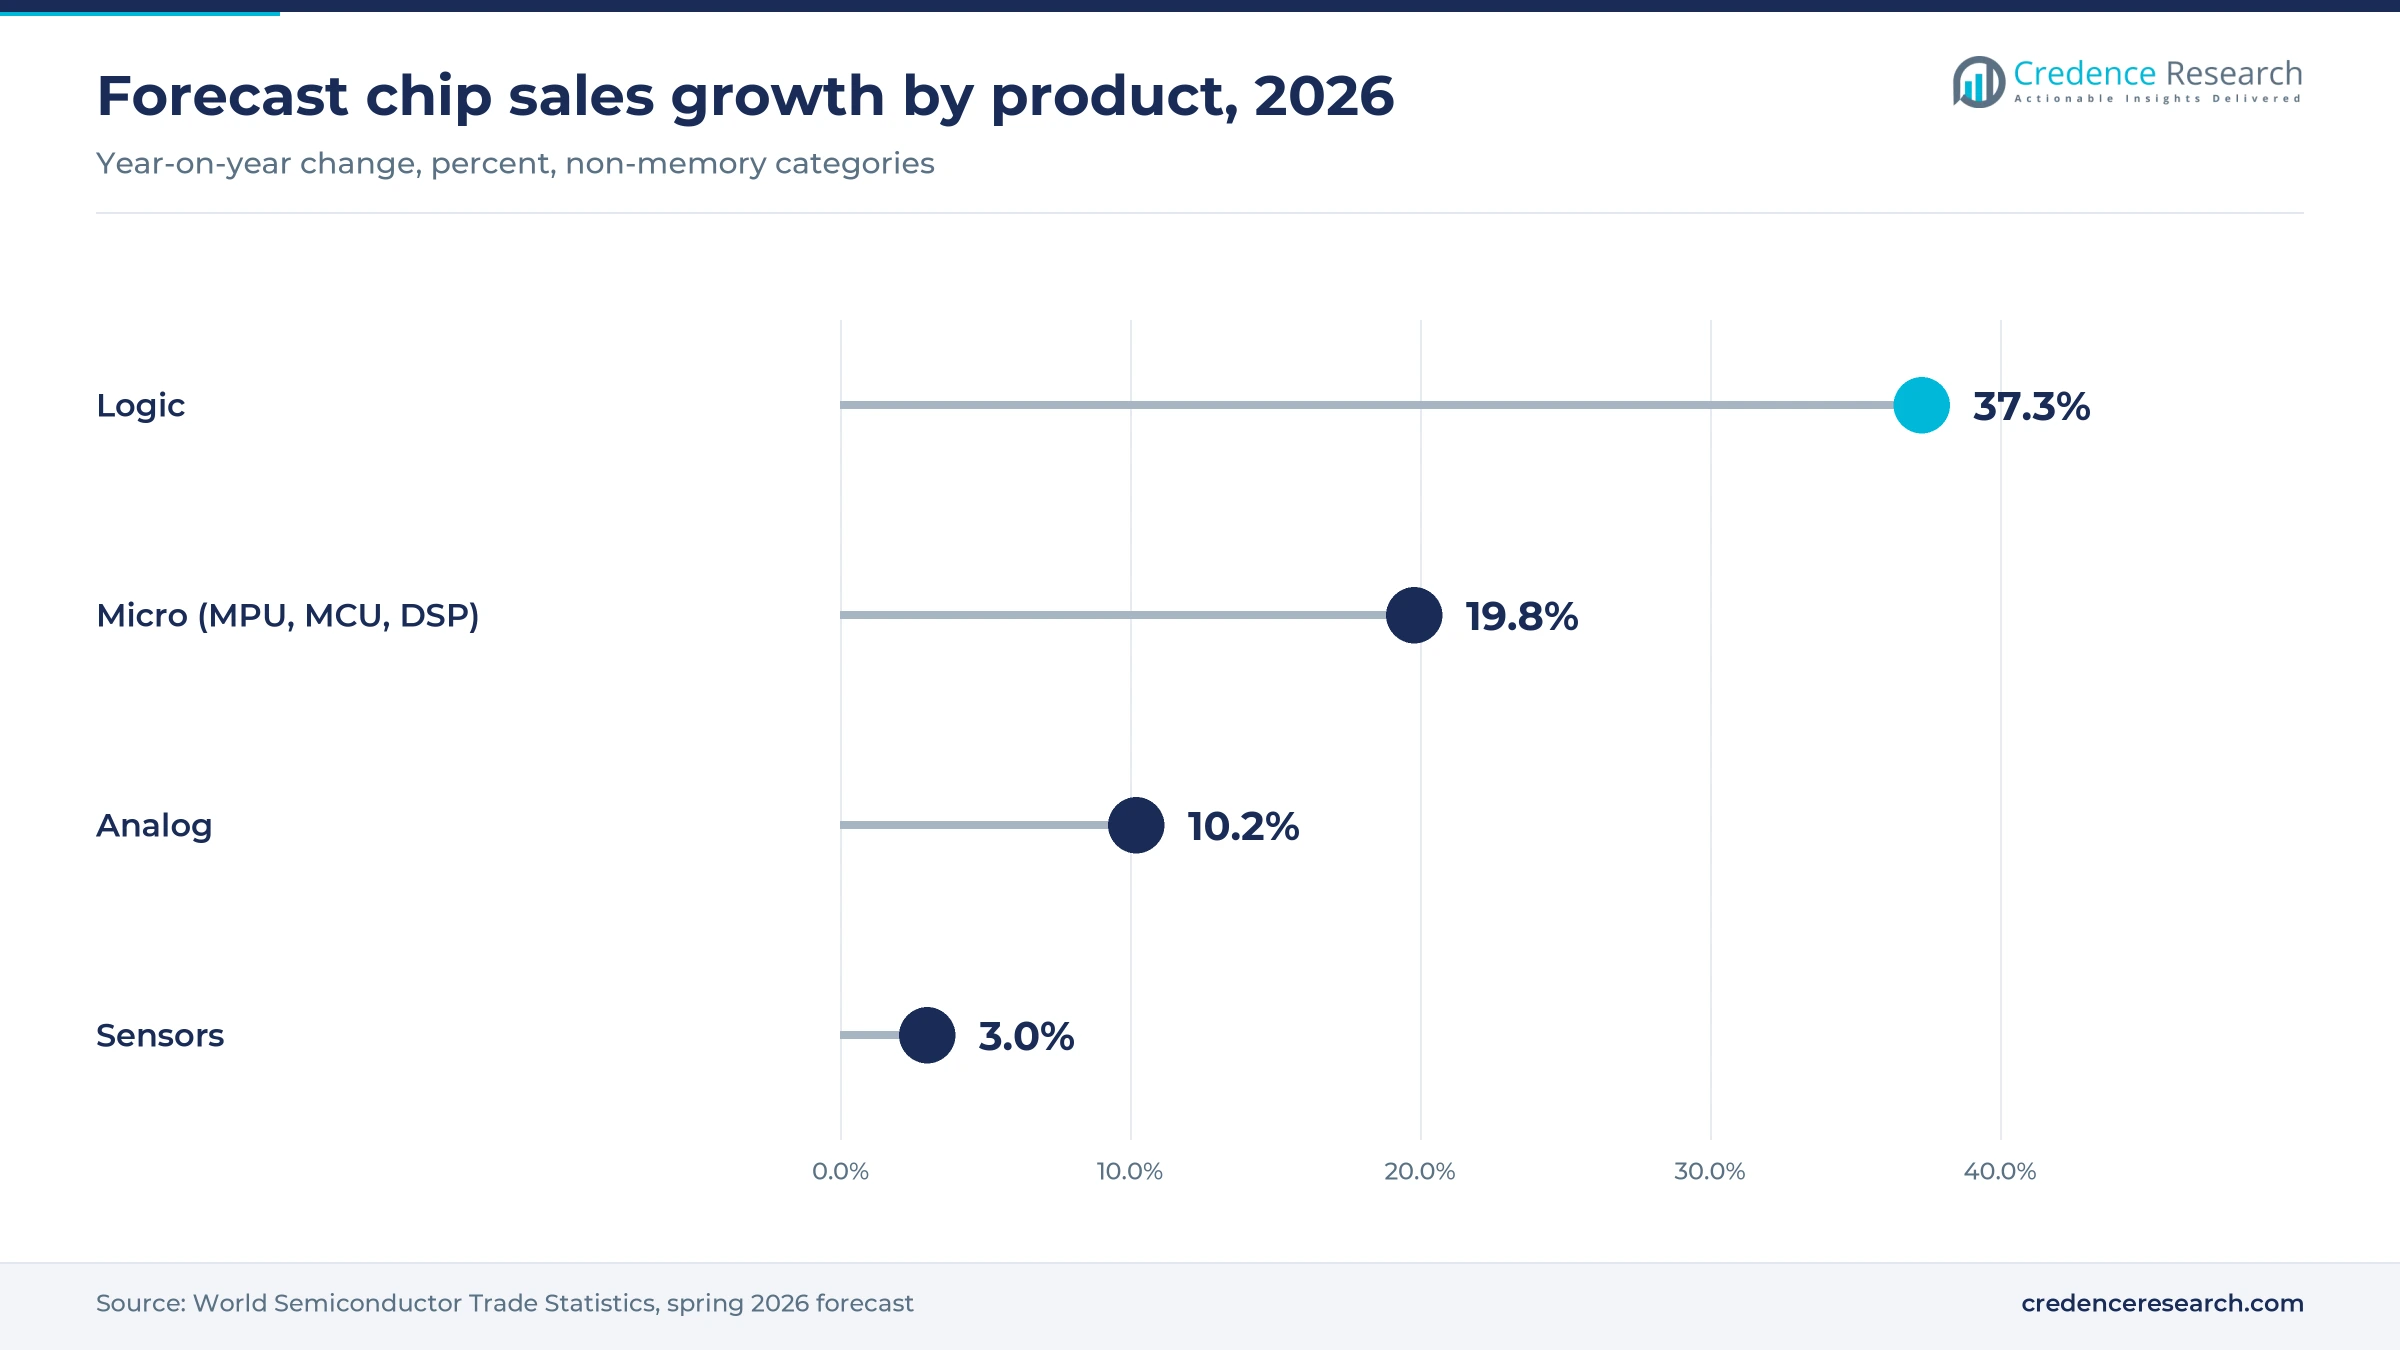
Phone and tablet processors are carrying larger neural and graphics blocks to run AI features on the device, which raises die size and value per chip even when unit volumes are flat. MediaTek launched the Dimensity 9500 on Sept. 22, 2025, on a 3 nm process with a ninth-generation neural processor. Apple said its M5 for iPad Pro adds a neural accelerator to every graphics core and delivers more than four times the peak GPU compute for AI of the M4. The WSTS spring 2026 forecast expects sales of the micro category to rise 19.8% in 2026 and 20.0% in 2027, after 7.9% growth in 2025. Suppliers with leading neural designs can hold prices even through weaker cycles.
X86 alliances, chiplets and open designs reshape supply
X86 rivals and Nvidia are shifting toward shared roadmaps
The x86 camp is shifting from pure rivalry toward shared standards and partnerships to defend its software base against Arm. Intel and AMD formed the x86 Ecosystem Advisory Group in October 2024 and, a year later, standardized features including AVX10, FRED, ChkTag and ACE across their chips, according to AMD. Nvidia agreed on Sept. 18, 2025, to invest USD 5 billion in Intel and to have Intel build custom x86 CPUs for Nvidia platforms and x86 PC chips with RTX graphics chiplets. The investment closed on Dec. 26, 2025, after the U.S. Federal Trade Commission ended its waiting period early. Enterprise buyers gain a longer x86 runway, while Arm PC vendors face a stronger rival.
Chiplet designs are rising as dies outgrow a single node
Processor makers are moving to chiplet designs that mix process nodes in one package, because the largest server dies no longer fit economically on a single leading-edge wafer. Intel launched Xeon 6+ at Computex in June 2026 with up to 288 cores on 12 compute tiles made on Intel 18A, stacked on Intel 3 base tiles with Foveros Direct, TweakTown reported. AMD launched EPYC Venice in July 2026 with up to 256 Zen 6 cores on TSMC 2 nm and a new SP7 socket. These designs raise demand for advanced packaging, and suppliers that control tile assembly can reuse small dies across many products.
Open RISC-V cores create an opening in sovereign compute
Governments and cloud providers that want processors free of licensing control have an opening in the open RISC-V instruction set, which is now reaching server standards. RISC-V International expects its server platform specification to be ratified by the end of 2026, after the server SoC requirements were ratified in 2025. The EuroHPC Joint Undertaking launched the DARE project in March 2025 with EUR 120 million of EU funding through 2030 to build European RISC-V processors. New RVA23-based data center hardware is expected in 2026, according to the association. Chip designers that ship compliant server parts early can win public tenders and research buyers.
Embedded AI processors open room in factories and vehicles
Industrial, robotics and automotive buyers need processors that run vision and control software at the edge, which opens a market for chips between microcontrollers and full PC processors. AMD introduced its Ryzen AI Embedded portfolio for automotive, industrial and physical AI uses at CES 2026, alongside EPYC Embedded 2005 parts for networking and storage. Infineon said in March 2025 that its automotive controller roadmap would move fully to RISC-V, according to RISC-V International. Industrial and vehicle programs keep the same processor in production for many years, so suppliers must commit to long software support and supply windows. Equipment makers gain long-life parts with AI acceleration, and suppliers win design slots that last a decade.
Memory shortages, tariffs and localization limit growth
Memory shortages cut phone and PC builds
Phone and PC makers cannot ship devices without memory, so the 2026 memory shortage is cutting processor orders even where end demand holds. Qualcomm CEO Cristiano Amon said on Feb. 4, 2026, that the weak handset outlook was 100% related to memory, and the company said several makers in China had reduced build plans. Suppliers of mid-range phone and entry laptop chips are most exposed, because their customers have the least room to absorb memory costs.
China is replacing foreign CPUs in state systems
Chinese procurement rules are shrinking the market that foreign suppliers can address in government and state computing. Guidance issued on Dec. 26, 2023, bars Intel and AMD processors from government PCs and servers, approves 18 processors from Loongson and Phytium, and sets a 2027 transition target, Tom's Hardware reported, citing the Financial Times. Intel and AMD are most exposed, while Chinese suppliers gain protected demand in state tenders.
Tariff policy leaves cross-border chip flows uncertain
U.S. trade policy adds cost risk for processors made in Asia and sold into American systems. A proclamation of Jan. 14, 2026, placed a 25% Section 232 tariff on a narrow set of advanced logic chips, with exemptions for U.S. data centers and consumer electronics, according to law firm White & Case. Commerce and the trade representative had to report by April 14, 2026, on wider tariffs, so server makers and PC brands keep hedging with extra U.S. assembly.
Capacity allocation leaves PC buyers short of chips
Suppliers are allocating scarce wafers to server processors, which leaves PC and channel buyers short of chips. Intel has moved wafer capacity from client CPUs to data center output since October 2025, when limits on Intel 10 and Intel 7 restricted supply to both, Tom's Hardware reported. Zinsner said in April 2026 that Intel remained supply-constrained on Xeon server processors. Smaller PC brands and distributors are most exposed, since large buyers secure allocations first.
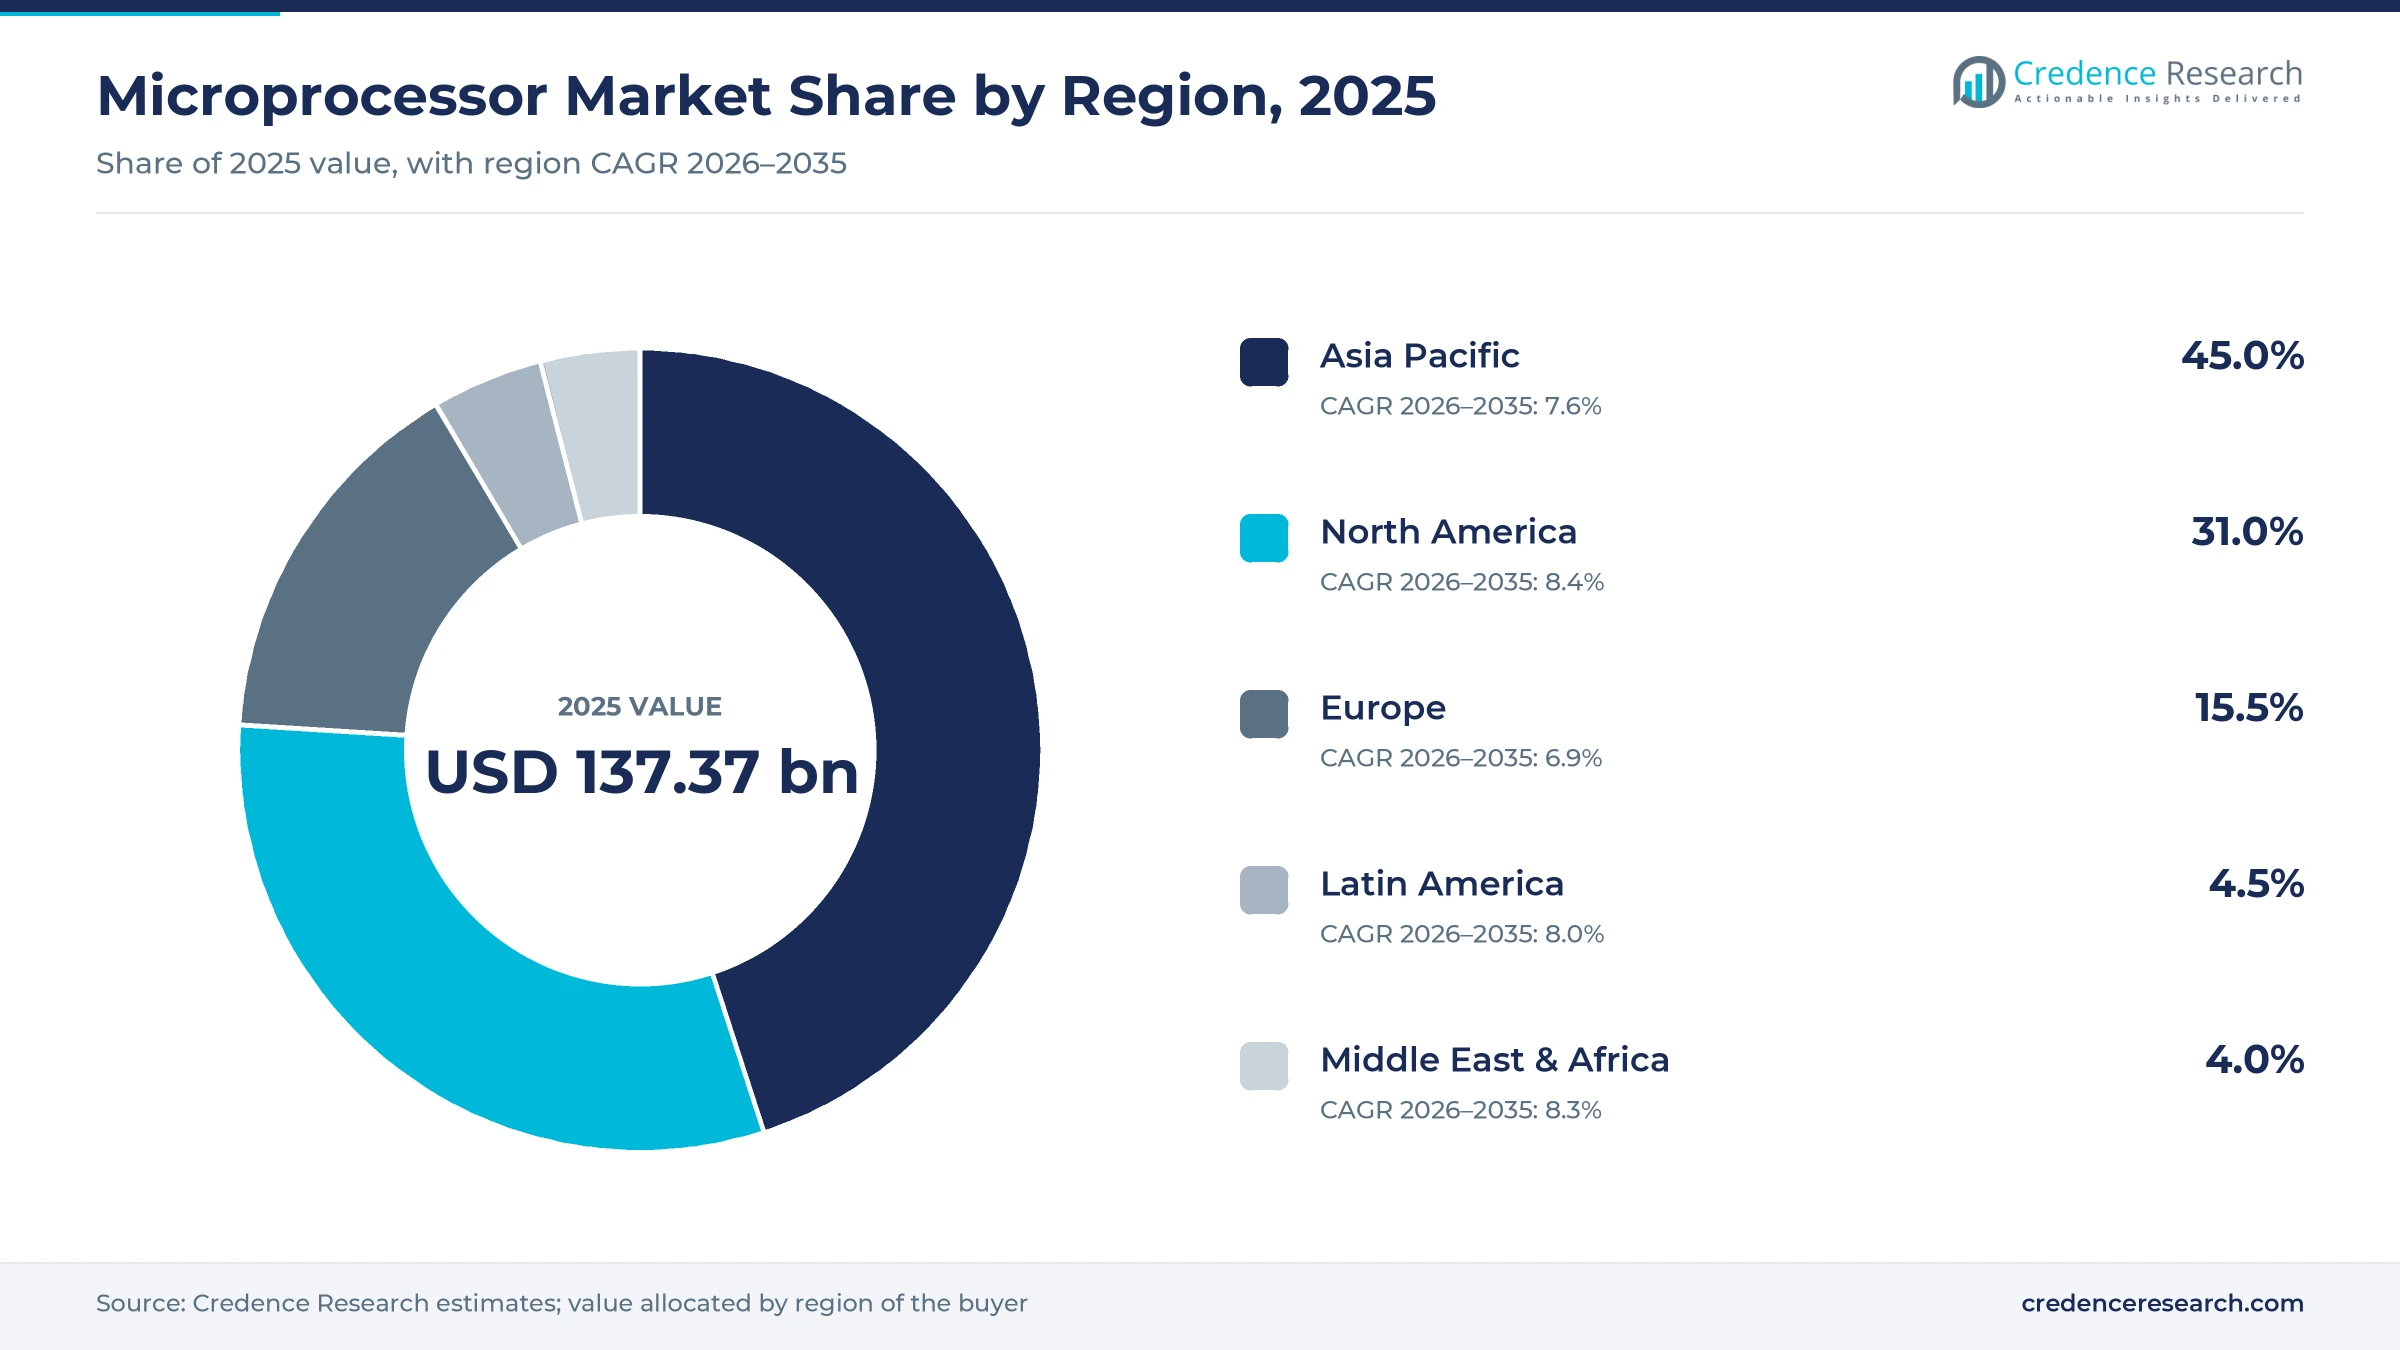
Asia Pacific builds the devices, North America the servers
| Region | Value, 2025 (USD billion) | Share, 2025 | CAGR, 2026–2035 |
|---|---|---|---|
| Asia Pacific | 61.82 | 45.0% | 7.6% |
| North America | 42.58 | 31.0% | 8.4% |
| Europe | 21.29 | 15.5% | 6.9% |
| Latin America | 6.18 | 4.5% | 8.0% |
| Middle East & Africa | 5.49 | 4.0% | 8.3% |
Asia Pacific leads on device assembly and local designers
Asia Pacific held 45.0% of 2025 value and grows at 7.6% a year, because most phones, laptops and servers are assembled in China, Taiwan, Vietnam and India. India's smartphone exports reached USD 13.4 billion from April to September 2025, up 59%, with iPhones above 75% of the total, Business Standard reported. Local designers MediaTek, Huawei and Loongson add regional supply, while the Chinese state procurement rules noted above shift public demand toward domestic chips.
North America grows fastest on cloud server demand
North America held 31.0% of 2025 value and grows at 8.4% a year, the fastest of any region. The largest cloud operators are headquartered there and buy both merchant x86 parts and their own Arm processors. World Semiconductor Trade Statistics put 2025 chip sales growth in the Americas at 31.4% in its spring 2026 forecast, a figure lifted mostly by accelerators and memory, so it signals data center build-out more than processor value alone. AMD plans future EPYC Venice output from TSMC's Arizona fab, which shortens supply lines for U.S. server builders.
Europe builds sovereign processors for supercomputing
Europe held 15.5% of 2025 value and grows at 6.9% a year, with demand led by enterprise PCs, automotive systems and public research computing. SiPearl powered on its 80-core Rhea1 processor on May 13, 2026, with general availability scheduled for the end of 2026 and a role in the JUPITER exascale system. World Semiconductor Trade Statistics put European chip sales growth at only 6.7% in 2025, well below the Americas, which keeps the region behind the global rate.
Latin America gains from server assembly in Mexico
Latin America held 4.5% of 2025 value and grows at 8.0% a year, led by PC, phone and server assembly in Mexico. Foxconn said in October 2024 that it was building the largest GB200 superchip production facility in the world in Guadalajara, Mexico News Daily reported. Each GB200 pairs Blackwell graphics chips with an Arm-based Grace CPU, so the plant adds regional processor consumption tied to U.S. cloud orders.
Middle East & Africa adds sovereign AI data centers
Middle East & Africa held 4.0% of 2025 value and grows at 8.3% a year from a base of enterprise and telecom servers. Stargate UAE is a 1-gigawatt AI cluster inside a 5-gigawatt campus in Abu Dhabi, and a G42 spokesperson said the first 200 megawatts should be completed in 2026, Gulf News reported. Each phase needs host processors alongside accelerators, which adds server CPU demand in the Gulf.
Launches on 18A and 2 nm defined 2026 for chip buyers
| Development | Status and market relevance |
|---|---|
| In December 2025, Nvidia completed its USD 5 billion purchase of Intel shares, about 4% of the company, under the September co-development deal. | Completed; funds custom x86 CPUs for Nvidia |
| In January 2026, Intel launched Core Ultra Series 3 laptop processors on Intel 18A, with systems on sale from Jan. 27. | Launched; first volume chips on 18A |
| In March 2026, Arm launched the AGI CPU, its first in-house processor, with Meta as first customer and OpenAI among partners. | Launched; Arm now sells chips |
| In June 2026, Intel launched Xeon 6+ with up to 288 efficient cores, shipping through Dell, HPE, Lenovo and Supermicro. | Shipping; targets dense cloud servers |
| In July 2026, AMD launched EPYC Venice with up to 256 cores on TSMC 2 nm, with production ramping in Taiwan. | Launched; first 2 nm server CPU |
NPUs, chiplets and 2 nm transistors change the product
- Integrated neural processing units run AI tasks on the device at low power, and the neural unit in Intel Core Ultra Series 3 reaches up to 50 TOPS.
- Chiplet packaging splits a processor into smaller tiles that can use different nodes, which raises yield and lets suppliers scale core counts.
- Gate-all-around transistors wrap the gate around stacked channels at 2 nm class nodes, which cuts leakage and supports higher clock speeds.
- Backside power delivery moves power wiring beneath the transistors, which frees routing space on the front of the die and improves efficiency.
Need a Custom Version of This Report?
Tailor the scope, geography, or segments to your exact requirements.
- Custom geography or segment scope
- Direct access to our analyst team
Two x86 suppliers face a widening Arm-based field
Competition turns on three factors that processor buyers test before committing to a platform. The first is software compatibility, which still favors Intel and AMD in Windows PCs and enterprise servers, though AMD has gained share in both. The second is performance per watt, where Arm-based designs from Qualcomm, Apple, MediaTek and the cloud operators compete on battery life and cost per cloud instance. The third is access to leading-edge wafers and packaging, because new processors move to 3 nm and 2 nm class nodes at the same time. Nvidia and Arm now sell processors of their own, which brings two strong platform owners into server supply. Embedded specialists such as Texas Instruments and STMicroelectronics compete on long product life and industrial qualification, while Loongson and Huawei serve protected Chinese demand.
How concentrated is the supply of processors?
Supply of processors is concentrated in three groups with very different economics. Intel and AMD control x86, so PC and enterprise server buyers have two suppliers and pay for software compatibility. Qualcomm, MediaTek, Samsung and Huawei design Arm phone processors and compete on modem integration and price per tier. Cloud operators and Nvidia design their own Arm server chips, which removes volume from merchant vendors. Almost all leading-edge dies are made by one or two foundries, so wafer access is the main barrier, and margins sit with the designers that set the instruction set or own the platform.
Companies profiled and their roles in this market
| Company | Type | Role in the market |
|---|---|---|
| Intel Corporation | x86 supplier and manufacturer | Core Ultra PC processors and Xeon server CPUs built in its own fabs |
| Advanced Micro Devices, Inc. (AMD) | x86 supplier | Ryzen PC processors, EPYC server CPUs and Ryzen AI Embedded parts |
| Qualcomm Technologies, Inc. | Arm processor supplier | Snapdragon phone, PC and automotive processors |
| MediaTek Inc. | Arm processor supplier | Dimensity phone processors and Kompanio tablet and Chromebook chips |
| Nvidia Corporation | Platform supplier | Arm-based Grace CPUs and custom x86 CPUs co-developed with Intel |
| Arm Holdings plc | Architecture owner and chip supplier | Licenses CPU designs and sells its own AGI CPU for data centers |
| Samsung Electronics (System LSI) | Phone processor supplier | Exynos phone processors, including the 2 nm Exynos 2600 |
| Huawei (HiSilicon) | Domestic processor supplier | Kirin phone processors and Kunpeng server CPUs for Chinese buyers |
| Texas Instruments Incorporated | Embedded specialist | Sitara embedded processors for industrial and automotive systems |
| STMicroelectronics | Embedded specialist | STM32MP microprocessors for industrial and consumer equipment |
| Loongson Technology | Domestic processor supplier | LoongArch PC and server CPUs, including the 3C6000 series |
Server CPU supply, not device demand, sets pricing power
Credence Research's view is that server CPU supply, more than phone or PC demand, will decide pricing power in the microprocessor market through 2028. AI agents have made general-purpose cores scarce, and the two x86 suppliers can raise prices while cloud operators build their own Arm chips to escape them. Device makers should secure memory and CPU allocations together, because a shortage of either stops shipments. Investors should watch Intel 18A yields and the pace of Arm and Nvidia server sales more closely than PC unit forecasts, which memory supply will distort into 2027.
Old estimate rolled forward and checked against chip data
The report uses 2025 as the base year and 2035 as the forecast horizon, with values in current U.S. dollars. The 2025 value carries forward the earlier Credence Research estimate at its stated growth rate and was checked against official chip sales statistics and the processor sales that listed suppliers disclose. Because processors that Apple, Samsung, Huawei and the cloud operators design for their own devices are counted at estimated chip cost, this estimate sits above figures that count merchant chip sales only. Regional, segment and scenario splits are Credence Research estimates built from company filings, product launch data and device assembly locations. Inputs include company filings and press releases, government publications, trade association statistics from World Semiconductor Trade Statistics and RISC-V International, and reputable trade press. No interviews or proprietary surveys were used to build these estimates.
Data center CPUs carry growth as device volumes recover
Growth to 2035 depends on data center processors early in the period and on device recovery later. Server CPU demand should stay strong while AI inference spreads, though cloud operators will move more of that volume to their own Arm chips. Phone and PC volumes should recover once memory supply normalizes, with each device carrying a larger neural engine. RISC-V will gain in embedded and public computing, but x86 and Arm will still hold most value. On the base case, the market reaches USD 291.12 billion by 2035, with a downside if memory shortages persist.
Memory supply and AI server budgets set the range of outcomes
The range of outcomes rests mainly on two questions for buyers and suppliers. The first is how long memory shortages keep phone and PC builds below demand. The second is whether AI inference keeps raising the number of CPUs per accelerator. A long memory shortage combined with a pause in cloud spending would drag growth below the base case. A faster memory recovery and wider agent deployments would lift it above.
| Scenario | CAGR, 2026–2035 | Value, 2035 | What has to hold |
|---|---|---|---|
| Downside | 5.8% | USD 245.96 billion | Memory shortages last into 2028 and cloud operators cut AI server budgets after 2027 |
| Base | 7.80% | USD 291.12 billion | Memory supply normalizes during 2027 and server CPU demand grows with AI inference |
| Upside | 9.3% | USD 329.67 billion | Agent workloads push CPU-to-GPU ratios toward 1 to 1 and PC refresh runs strong |
Frequently Asked Questions
How big is the microprocessor market?
How large is the server microprocessor segment, and why is it growing?
Who are the main microprocessor makers?
How is market share split between x86 and Arm processors?
Which architecture do smartphone and tablet processors use?
Does the microprocessor market include GPUs?
Why did CPU prices rise in 2026?
Which region leads the microprocessor market?
Table of Content
Chapter 1 Market Segmentation
- 1.1 Segmentation Framework
- 1.1.1 Product and Service Classification
- 1.1.2 Application and End-Use Classification
- 1.1.3 Technology and Solution Classification
- 1.1.4 Customer and Distribution Channel Classification
- 1.1.5 Geographic Segmentation
- 1.1.6 Market Segment Definitions and Boundaries
- 1.2 By Application
- 1.2.1 Computers and Laptops
- 1.2.2 Smartphones and Tablets
- 1.2.3 Servers and Data Centers
- 1.2.4 Embedded Systems
- 1.2.5 Consumer Electronics
- 1.3 By Architecture
- 1.3.1 x86
- 1.3.2 Arm
- 1.3.3 RISC-V and Others
- 1.4 By Process Node
- 1.4.1 7 nm and Below
- 1.4.2 10 nm and Above
Chapter 2 Introduction
- 2.1 Report Objectives and Scope
- 2.2 Product Definition and Industry Terminology
- 2.3 Market Inclusions and Exclusions
- 2.4 Research Process
- 2.4.1 Primary Research and Expert Interviews
- 2.4.2 Secondary Research and Source Review
- 2.4.3 Top-Down and Bottom-Up Estimation
- 2.4.4 Data Triangulation and Verification
- 2.5 Market Size Measurement Basis
- 2.5.1 2025: USD 137.37 billion → 2035: USD 291.12 billion
- 2.6 Historical and Forecast Reference Periods
- 2.6.1 Historical Period: 2018-2025
- 2.6.2 Base Year: 2025
- 2.6.3 Forecast Period: 2025-2035
- 2.7 Research Assumptions and Limitations
Chapter 3 Executive Summary
- 3.1 Market Snapshot and Key Findings
- 3.2 Base-Year Market Size, 2025
- 3.3 Forecast Market Size, 2035
- 3.4 Revenue and Volume Growth Outlook
- 3.5 Key Demand and Supply Indicators
- 3.6 Leading Market Segments
- 3.7 Fastest-Growing Market Opportunities
- 3.8 Regional Performance Highlights
- 3.9 Technology and Industry Transformation
- 3.10 Competitive Landscape Summary
- 3.11 Analyst View and Strategic Implications
Chapter 4 Global Microprocessor Market Trends and Developments
- 4.1 Historical Industry Development, 2018-2025
- 4.2 Recent Market Trends and Developments
- 4.3 Demand and Customer Behavior Trends
- 4.4 Technology and Product Innovation
- 4.5 Artificial Intelligence, Automation and Digitalization
- 4.6 Local Manufacturing and Supply Chain Realignment
- 4.7 Industry Partnerships, Mergers and Acquisitions
- 4.8 Sustainability and Circular Economy Developments
- 4.9 Government and Private Sector Investment Trends
- 4.10 Emerging Business Models and Commercialization
- 4.11 Industry Developments and Announcements
Chapter 5 Global Microprocessor Market Production, Supply and Demand Analysis
- 5.1 Demand Trend and Consumption Analysis, 2018-2025
- 5.2 Demand Forecast, 2025-2035
- 5.3 Production and Output Trend, 2018-2025
- 5.4 Production and Output Forecast, 2025-2035
- 5.5 Installed Capacity and Capacity Utilization
- 5.6 Company-Wise Production Plants and Statistics
- 5.6.1 Installed Production Capacity
- 5.6.2 Actual Production
- 5.6.3 Planned Capacity and Expansion Targets
- 5.7 Supply Chain Structure and Procurement Trends
- 5.8 Supply-Demand Gap and Bottlenecks
- 5.9 Import Dependence and Sourcing Structure
- 5.10 Contract Manufacturing and Outsourcing
- 5.11 Regional Supply and Demand Concentration
Chapter 6 Global Microprocessor Market Pricing Analysis
- 6.1 Pricing Structure and Measurement
- 6.2 Historical Pricing Trends, 2018-2025
- 6.3 Pricing Outlook, 2025-2035
- 6.4 Average Selling Price and Unit Economics
- 6.5 Pricing by Product and Market Segment
- 6.6 Geographic Pricing Differences
- 6.7 Key Input, Energy, Labor and Logistics Costs
- 6.8 Contract Pricing and Purchasing Models
- 6.9 Pricing Sensitivity and Competitive Positioning
- 6.10 Price, Margin and Profitability Implications
Chapter 7 Global Microprocessor Market Dynamics
- 7.1 Market Growth Drivers
- 7.1.1 Demand-Side Drivers
- 7.1.2 Technology and Innovation Drivers
- 7.1.3 Infrastructure and Investment Drivers
- 7.1.4 Regulatory and Policy Drivers
- 7.2 Market Restraints
- 7.2.1 Cost and Affordability Constraints
- 7.2.2 Technology and Adoption Barriers
- 7.2.3 Supply Chain and Operational Constraints
- 7.3 Market Challenges
- 7.3.1 Competitive Pressure and Margin Erosion
- 7.3.2 Skills, Infrastructure and Implementation Gaps
- 7.4 Emerging Market Opportunities
- 7.5 Market Dynamics Impact and Time-Horizon Assessment
Chapter 8 Global Microprocessor Value Chain Analysis
- 8.1 Industry Value Chain Overview
- 8.2 Upstream Suppliers and Critical Inputs
- 8.3 Technology and Component Providers
- 8.4 Manufacturing or Service Delivery
- 8.5 Distribution, Channel Partners and Integrators
- 8.6 Downstream Applications and End Users
- 8.7 Value Addition and Profit Pools
- 8.8 Vertical Integration and Outsourcing
- 8.9 Supplier Concentration and Risk
- 8.10 Supply Chain Localization and Resilience
Chapter 9 Global Microprocessor Market Regulations and Policies
- 9.1 Relevant Laws, Standards and Compliance Frameworks
- 9.2 Product, Service, Safety and Quality Requirements
- 9.3 Government Policies, Incentives and Subsidies
- 9.4 Imports, Exports and Trade Barriers
- 9.5 Public Procurement and Local Content Requirements
- 9.6 Environmental and Sustainability Compliance
- 9.7 Upcoming Policy Changes and Market Implications
Chapter 10 Global Microprocessor Market Hotspots and Opportunities
- 10.1 Market Opportunity Mapping and Growth Hotspots
- 10.2 High-Growth Applications and Customer Groups
- 10.3 Underserved Markets and White-Space Opportunities
- 10.4 Emerging Technology and Product Opportunities
- 10.5 New Capacity and Investment Hotspots
- 10.6 Market Entry and Expansion Opportunities
- 10.7 Distribution and Partnership Opportunities
- 10.8 Near-Term and Long-Term Commercial Potential
- 10.9 Opportunity Attractiveness and Execution Risks
Chapter 11 Global Microprocessor Market Outlook, 2025-2035
- 11.1 Market Size and Analysis
- 11.1.1 Revenue (Market Measurement: 2025: USD 137.37 billion → 2035: USD 291.12 billion)
- 11.1.2 Market Volume and Quantity Sold
- 11.1.3 Historical Market Size, 2018-2025
- 11.1.4 Base-Year Market Size, 2025
- 11.2 Market Forecast, 2025-2035
- 11.2.1 Revenue Forecast to 2035
- 11.2.2 Volume Forecast to 2035
- 11.2.3 CAGR and Year-on-Year Growth
- 11.2.4 Incremental Revenue Opportunity
- 11.3 Forecast Assumptions and Scenario Analysis
- 11.3.1 Base-Case Forecast
- 11.3.2 Optimistic and Conservative Scenarios
- 11.3.3 Technology, Pricing and Policy Sensitivities
- 11.4 Market Attractiveness and Growth Outlook
Chapter 12 Global Microprocessor Market Segmentation and Outlook
- 12.1 Segmentation Summary and Market Shares, 2025
- 12.2 Largest and Fastest-Growing Segments
- 12.3 By Application - Market Size and Forecast, 2025-2035
- 12.3.1 Segment Definition and Scope
- 12.3.2 Historical Market Size, 2018-2025
- 12.3.3 Revenue Forecast, 2025-2035
- 12.3.4 Volume Forecast, 2025-2035
- 12.3.5 Base-Year Market Share, 2025
- 12.3.6 Segment CAGR and Growth Drivers
- 12.3.7 Subsegment Market Size and Forecast
- 12.3.7.1 Computers and Laptops
- 12.3.7.2 Smartphones and Tablets
- 12.3.7.3 Servers and Data Centers
- 12.3.7.4 Embedded Systems
- 12.3.7.5 Consumer Electronics
- 12.3.8 Subsegment Pricing and Adoption Trends
- 12.3.9 Leading Suppliers and Competition
- 12.3.10 Regional Demand and Opportunities
- 12.4 By Architecture - Market Size and Forecast, 2025-2035
- 12.4.1 Segment Definition and Scope
- 12.4.2 Historical Market Size, 2018-2025
- 12.4.3 Revenue Forecast, 2025-2035
- 12.4.4 Volume Forecast, 2025-2035
- 12.4.5 Base-Year Market Share, 2025
- 12.4.6 Segment CAGR and Growth Drivers
- 12.4.7 Subsegment Market Size and Forecast
- 12.4.7.1 x86
- 12.4.7.2 Arm
- 12.4.7.3 RISC-V and Others
- 12.4.8 Subsegment Pricing and Adoption Trends
- 12.4.9 Leading Suppliers and Competition
- 12.4.10 Regional Demand and Opportunities
- 12.5 By Process Node - Market Size and Forecast, 2025-2035
- 12.5.1 Segment Definition and Scope
- 12.5.2 Historical Market Size, 2018-2025
- 12.5.3 Revenue Forecast, 2025-2035
- 12.5.4 Volume Forecast, 2025-2035
- 12.5.5 Base-Year Market Share, 2025
- 12.5.6 Segment CAGR and Growth Drivers
- 12.5.7 Subsegment Market Size and Forecast
- 12.5.7.1 7 nm and Below
- 12.5.7.2 10 nm and Above
- 12.5.8 Subsegment Pricing and Adoption Trends
- 12.5.9 Leading Suppliers and Competition
- 12.5.10 Regional Demand and Opportunities
- 12.6 Segment Growth Comparison
- 12.7 Segment Attractiveness and Priority Matrix
Chapter 13 Global Microprocessor End-Use and Application Market Outlook
- 13.1 End-Use Industry and Customer Demand Structure
- 13.2 Leading Applications and Customer Groups
- 13.3 End-Use Market Size, Share and Forecast
- 13.4 Major End-Use Industry Deep Dives
- 13.4.1 Customer Requirements and Use Cases
- 13.4.2 Demand and Replacement Cycles
- 13.4.3 Technical and Regulatory Considerations
- 13.4.4 Purchasing and Procurement Models
- 13.4.5 Leading Vendors and Distribution Channels
- 13.4.6 Forecast and Commercial Opportunities
- 13.5 Emerging Applications and Cross-Segment Demand
- 13.6 End-Use Industry Investment Priorities
Chapter 14 Global Microprocessor Geographic Market Outlook, 2025-2035
- 14.1 Regional Market Size and Share, 2025
- 14.2 Regional Market Forecast, 2025-2035
- 14.3 Regional Pricing, Production and Demand Differences
- 14.4 North America
- 14.4.1 United States
- 14.4.2 Canada
- 14.4.3 Mexico
- 14.5 Europe
- 14.5.1 Germany
- 14.5.2 France
- 14.5.3 Italy
- 14.5.4 United Kingdom
- 14.5.5 Spain
- 14.5.6 Poland
- 14.5.7 Russia
- 14.5.8 Netherlands
- 14.5.9 Belgium
- 14.5.10 Sweden
- 14.5.11 Denmark
- 14.5.12 Norway
- 14.5.13 Rest of Europe
- 14.6 Asia Pacific
- 14.6.1 China
- 14.6.2 India
- 14.6.3 Japan
- 14.6.4 South Korea
- 14.6.5 Thailand
- 14.6.6 Indonesia
- 14.6.7 Vietnam
- 14.6.8 Malaysia
- 14.6.9 Australia
- 14.6.10 Rest of Asia Pacific
- 14.7 Latin America
- 14.7.1 Brazil
- 14.7.2 Argentina
- 14.7.3 Colombia
- 14.7.4 Chile
- 14.7.5 Rest of Latin America
- 14.8 Middle East
- 14.8.1 Saudi Arabia
- 14.8.2 United Arab Emirates
- 14.8.3 Turkey
- 14.8.4 Israel
- 14.8.5 Iran
- 14.8.6 Rest of the Middle East
- 14.9 Africa
- 14.9.1 South Africa
- 14.9.2 Egypt
- 14.9.3 Nigeria
- 14.9.4 Morocco
- 14.9.5 Rest of Africa
- 14.10 Regional Investment, Policy and Supply Chain Differences
- 14.11 Regional Competitive Landscape
- 14.12 Geographic Growth Hotspots
Chapter 15 Global Microprocessor Technology, Innovation and Sustainability Outlook
- 15.1 Technology Landscape and Maturity
- 15.2 Product, Process and Service Innovation
- 15.3 AI, Automation and Digital Tools in the Industry
- 15.4 Technology Adoption and Performance Benchmarking
- 15.5 Innovation Pipeline and R&D Investment
- 15.6 Patent and Intellectual Property Trends
- 15.7 Energy Efficiency and Resource Management
- 15.8 Sustainability, Recycling and Circularity
- 15.9 Technology Roadmap, 2025-2035
- 15.10 Risks of Obsolescence and Technology Substitution
Chapter 16 Global Microprocessor Market Key Strategic Imperatives
- 16.1 Growth and Market Entry Priorities
- 16.2 High-Return Products and Segments
- 16.3 Pricing, Profitability and Cost Optimization
- 16.4 Technology Investment and Product Differentiation
- 16.5 Supply Chain Localization and Resilience
- 16.6 Distribution and Customer Acquisition
- 16.7 Partnership, Acquisition and Capacity Strategy
- 16.8 Regional Expansion Priorities
- 16.9 Short-, Medium- and Long-Term Actions
Chapter 17 Competition Outlook
- 17.1 Industry Competition Characteristics
- 17.2 Market Structure and Concentration
- 17.3 Market Share and Competitive Positioning, 2025
- 17.4 Company-Wise Revenue and Product Benchmarking
- 17.5 Production and Service Capacity Benchmarking
- 17.6 Technology, Pricing and Differentiation
- 17.7 Regional Footprint and Distribution Strength
- 17.8 Mergers, Acquisitions and Strategic Alliances
- 17.9 New Entrants and Competitive Threats
- 17.10 Porter's Five Forces and Industry Attractiveness
- 17.11 Competitive Outlook, 2025-2035
Chapter 18 Company Profiles
- 18.1 Company Coverage and Selection Criteria
- 18.2 Intel Corporation
- 18.2.1 Business Description
- 18.2.2 Company Ownership and Geographic Presence
- 18.2.3 Product and Service Portfolio
- 18.2.4 Manufacturing and Operating Footprint
- 18.2.5 Production Capacity and Expansion Plans
- 18.2.6 Financial Performance and Investment
- 18.2.7 Market Share and Competitive Position
- 18.2.8 Technology and Innovation Capabilities
- 18.2.9 Strategic Alliances or Partnerships
- 18.2.10 Recent Developments
- 18.2.11 Growth Strategy and Outlook
- 18.3 Advanced Micro Devices, Inc. (AMD)
- 18.4 Qualcomm Technologies, Inc.
- 18.5 MediaTek Inc.
- 18.6 Nvidia Corporation
- 18.7 Arm Holdings plc
- 18.8 Samsung Electronics (System LSI)
- 18.9 Huawei (HiSilicon)
- 18.10 Texas Instruments Incorporated
- 18.11 STMicroelectronics
- 18.12 Loongson Technology
- 18.13 Other Relevant Market Participants
Note: Every listed company is profiled on the structure shown under the first company. The company list is preliminary and may change based on research findings, market developments, data availability and client requirements.
Chapter 19 Disclaimer
- 19.1 Research and Forecast Disclaimer
- 19.2 Data Source and Estimation Limitations
Note: The depth of individual sections depends on data availability for this market. Volume, capacity, trade and other unit-based metrics are included where applicable.

