
Domestic projects, not tag exports, set the value
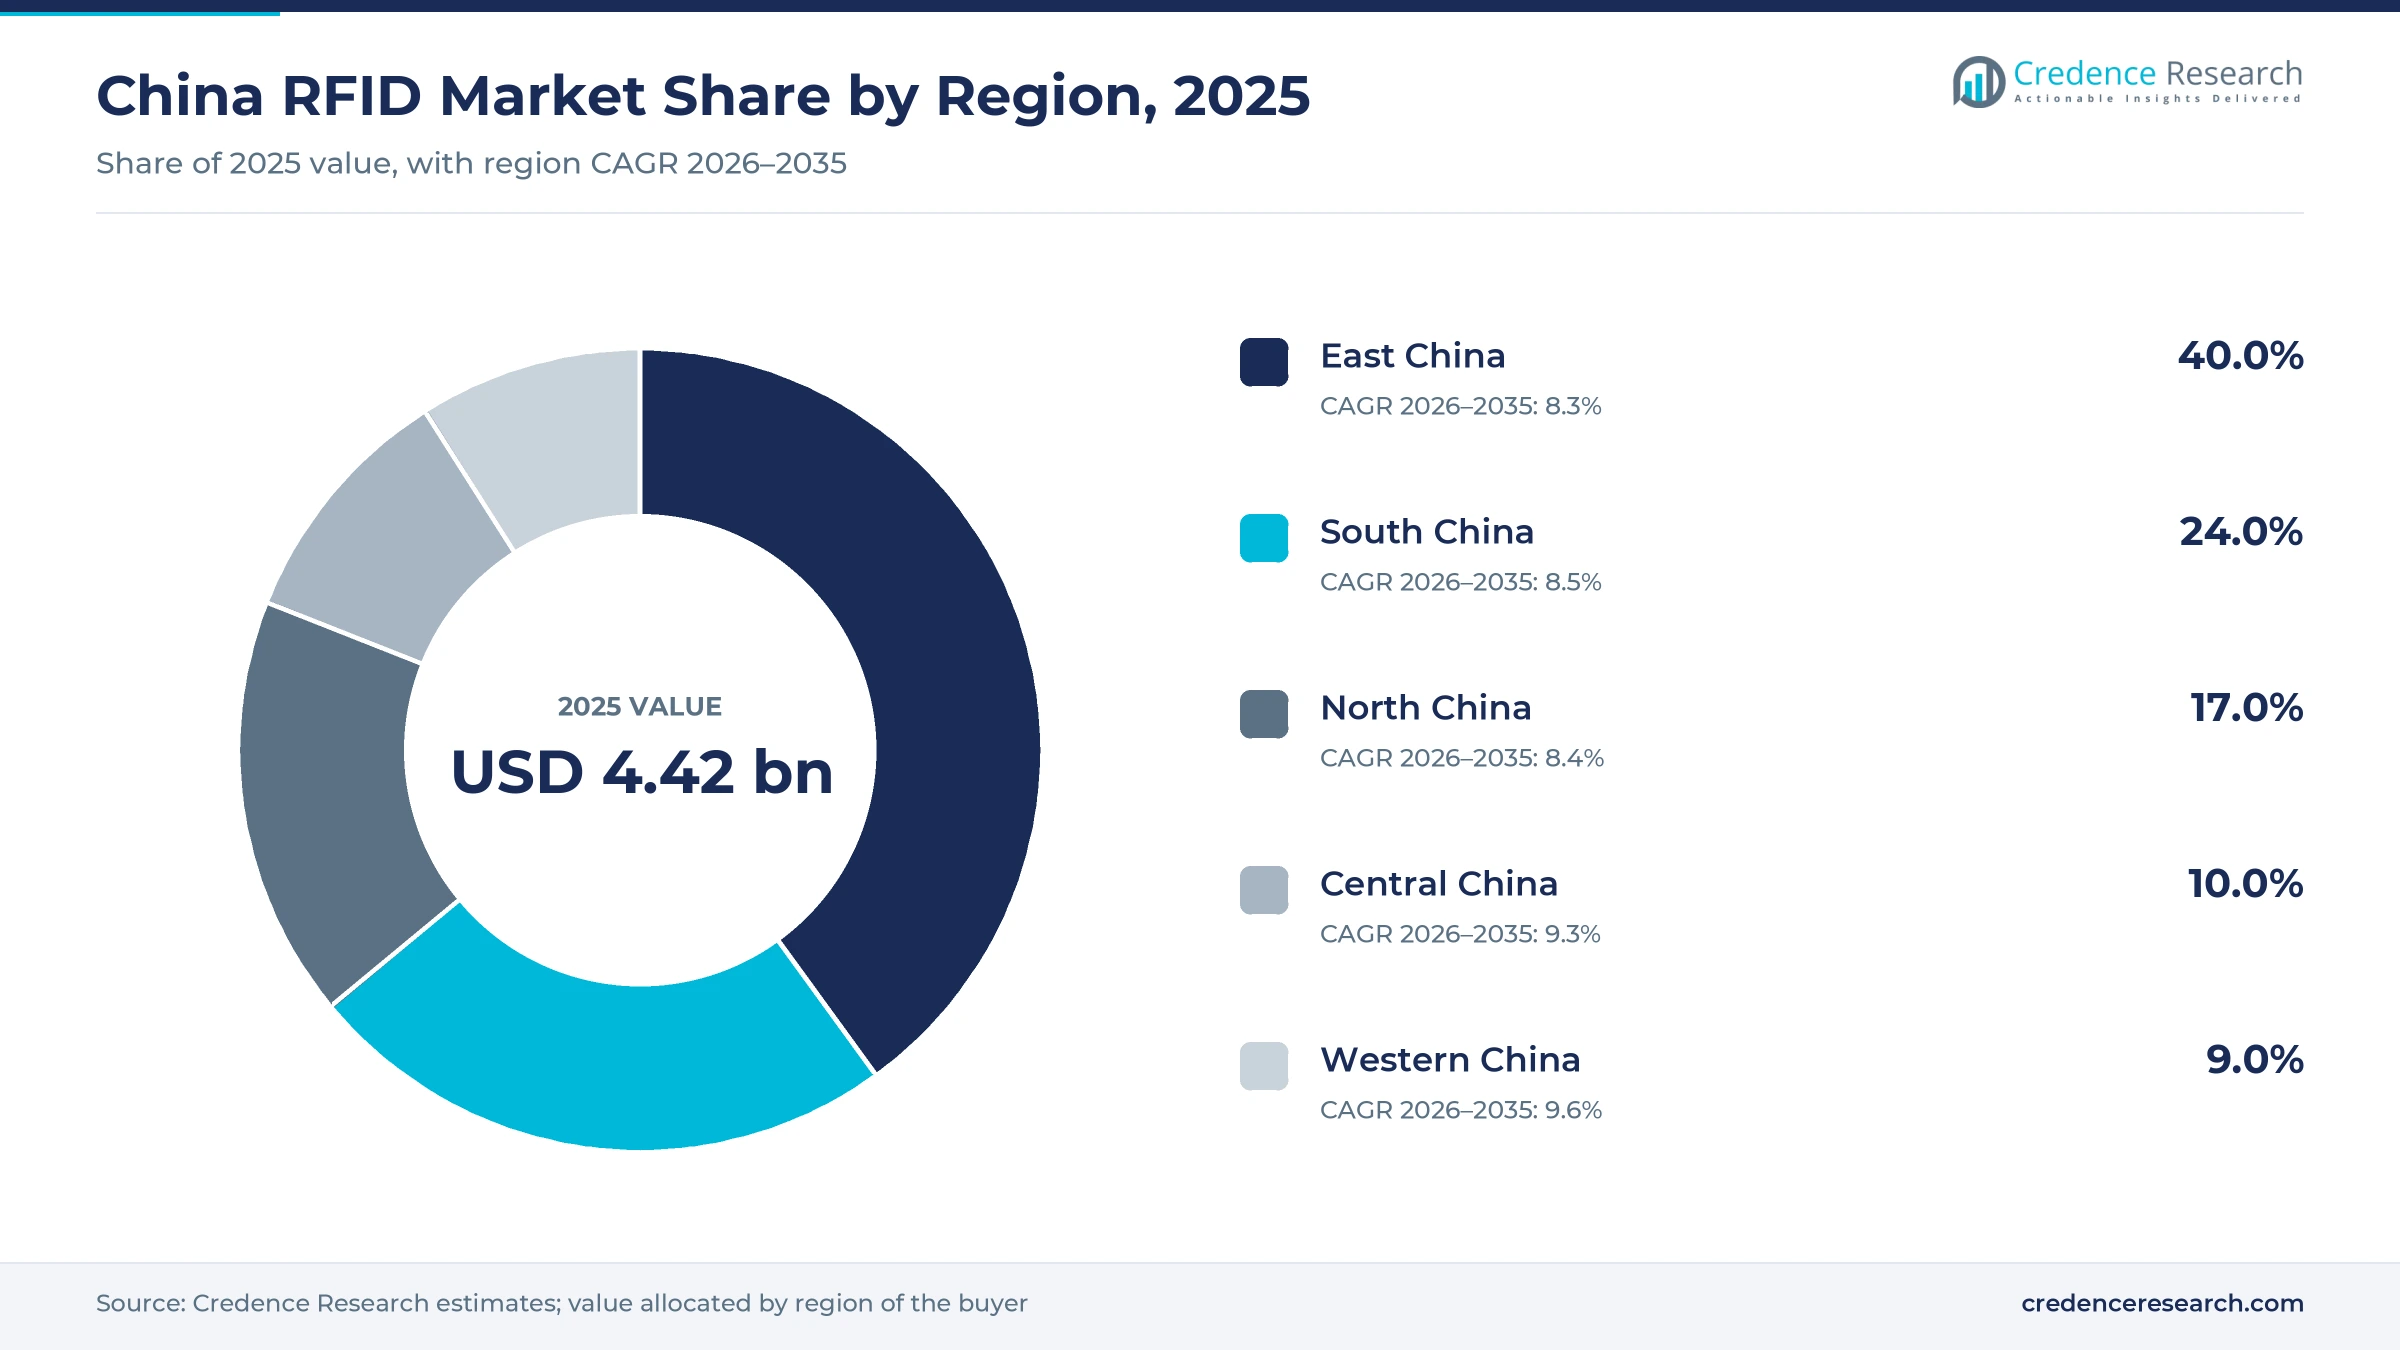
The China RFID market was valued at USD 4.42 billion in 2025 and is projected to increase from USD 4.80 billion in 2026 to USD 10.09 billion by 2035, registering a CAGR of 8.60% during 2026–2035. Spending comes from apparel and general retailers tagging items, parcel and cold-chain operators tracking returnable assets, hospitals tracing implants and consumables, and public programs that issue high-frequency identity, transit and library cards. East China held the largest regional share, 40.0% in 2025, while Western China is the fastest-growing region at 9.6% a year from a small base of library, rail and logistics projects. The most important regulatory change is the move of ultra-high frequency readers to the 920 to 925 megahertz band from November 2024. Falling tag prices widen use but cap the value each new project adds.
Domestic deployments count while exported tags do not
The market counts what buyers in China spend on RFID tags, labels, inlays and cards, on fixed, handheld and embedded readers, and on middleware, integration and services across low, high and ultra-high frequency bands. Retailers and logistics firms buy through integrators and label converters, while hospitals and public agencies buy through tenders that bundle hardware with software.
Tags and inlays that Chinese plants make for foreign buyers, electronic toll units on the 5.8 gigahertz band and general barcode equipment are excluded. The value chain runs from chip designers through inlay and label converters and reader makers to integrators, and margins are widest for firms that own the software that turns reads into inventory decisions.
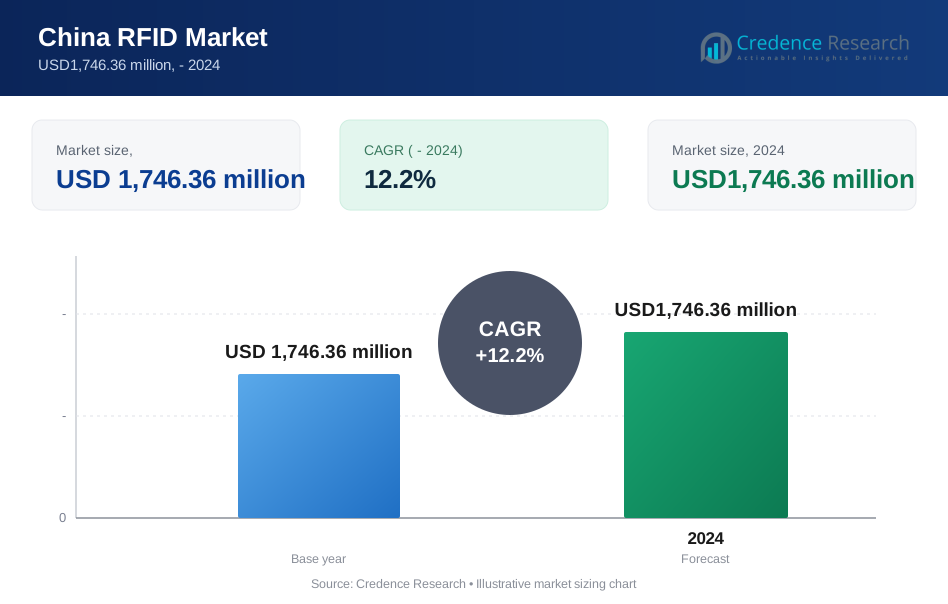
China RFID Market Insights
- The China RFID market was valued at USD 4.42 billion in 2025 and is projected to reach USD 10.09 billion by 2035 at an 8.60% CAGR.
- East China held 40.0% of 2025 value, because the Yangtze River Delta hosts most label converters, reader makers and retail head offices.
- Tags held 46.0% of 2025 value, because every tagged garment, box or implant consumes a new tag while readers last for years.
- Global RAIN tag-chip shipments fell to 42.7 billion in 2025 from 52.8 billion in 2024, which pushed Chinese inlay makers into price competition.
- From June 1, 2027 China extends UDI rules to all Class II medical devices, which widens hospital demand for RFID-based tracing.
Tags and HF lead while hospital uses grow fastest
Tags lead while software and services grow fastest
Based on product type, the market is categorized into tags, readers and software and services. Tags led with 46.0% of 2025 value because consumption scales with items, and Xiamen tag maker Xindeco IoT supplies VersaMini tags for Miniso cosmetics and accessories, according to Packaging Insights in June 2026. Software and Services grow fastest at 9.5% as hospitals pay for cabinets, middleware and SPD integration that tags alone do not deliver. Reader value grows slowly, because one handheld serves many stores.
High frequency leads while UHF grows fastest
Based on frequency, the market is categorized into low frequency, high frequency and ultra-high frequency. High Frequency led with 45.0% of 2025 value because identity, transit, social security and library cards use it, and Invengo has linked Chongqing Library self-loan stations with social security card checks since its upgrade in 2020. Ultra-High Frequency grows fastest at 9.9% as bulk reading suits stores and warehouses, and Shenzhen maker Urovo lists an FR1000 fixed reader for warehouse bulk reading, according to its August 2024 partner release. Low frequency keeps steady animal and access-control demand but loses share.
Retail leads while healthcare grows fastest
Based on end user, the market is categorized into commercial, animal tracking, transportation, agriculture, security and access control, healthcare, retail and others. Retail led with 24.0% of 2025 value because apparel and footwear chains tag items at source, and Uniqlo embeds RFID in clothing tags and reads whole baskets at checkout, according to RFID World in September 2025. Healthcare grows fastest at 11.0% as China extends unique device identification to all Class II devices from June 1, 2027, under NMPA Announcement No. 21 of March 2026. Transportation follows retail on demand from parcel, rail and airport baggage work.
| Segment Group | Leading Sub-segment | Share, 2025 | Fastest-growing Sub-segment | CAGR, 2026–2035 |
|---|---|---|---|---|
| By Product Type | Tags | 46.0% | Software and Services | 9.5% |
| By Frequency | High Frequency | 45.0% | Ultra-High Frequency | 9.9% |
| By End User | Retail | 24.0% | Healthcare | 11.0% |
Tags cost cents while readers and software hold value
Tags are priced per thousand units and fall with volume, so value in this market depends on how much software and integration each project carries. Retail labels have dropped to about USD 0.07 to 0.10, still above the USD 0.02 to 0.05 that stores pay for security tags, which explains why some chains tag only higher-priced items. Chip supply cycles and inlay competition move tag prices most, while readers keep more stable list prices. Integrators recover margin through middleware, maintenance and analytics contracts, which is why hospital and warehouse projects are worth more per tag than apparel rollouts.
| Item | Typical price or fee | Basis |
|---|---|---|
| UHF retail RFID label | USD 0.07-0.10 per tag | RFID World, September 2025 |
| Acousto-magnetic or RF security tag, for comparison | USD 0.02-0.05 per tag | RFID World, September 2025 |
| High-volume UHF tag bought in Asia | About USD 0.036 per tag, about USD 0.04 average for 500,000+ units | RFID Journal, citing SimplyRFID, December 2022 |
| Chainway C72 UHF handheld reader | USD 1,200 per unit list price | Asset Infinity store listing, November 2026 (sold out) |
Request a Free Sample
Fill in your details and we'll send you a free sample report.
- Sample data tables & charts
- Research methodology
Parcels, UDI rules, store tagging and a new band lift use
Parcel volumes push logistics firms to tag assets
Record parcel volumes drive demand for tags and readers among logistics operators, because manual scans cannot keep pace with returnable boxes, cages and pallets. China's postal sector handled 196.75 billion parcels from January to November 2025, up 12.9%, according to the State Post Bureau, while express items rose 14.9% to 180.74 billion. JD Logistics said in June 2025 that each of its 500,000 new reusable cold-chain boxes carries an RFID tag and barcode, according to JD Corporate Blog, so its system logs reuse count, condition and route. Transportation held the second-largest end-user position in 2025, and returnable-asset fleets give suppliers recurring tag and reader orders.
UDI rules move hospitals toward traceable consumables
Unique device identification rules move hospitals toward traceable consumables, because each implant and high-value item must be linked to a patient record. NMPA extended UDI to 103 Class II categories on June 1, 2024, and Announcement No. 21, published on March 4, 2026, adds all remaining Class II devices from June 1, 2027 and Class I devices from 2029. The First Affiliated Hospital of Sun Yat-sen University reports 100% lifecycle traceability for high-value consumables and cut acceptance of 200 orthopedic consumables from 45 minutes to two minutes, according to a GS1 case study. Integrators that bundle tags, smart cabinets and SPD software gain the most.
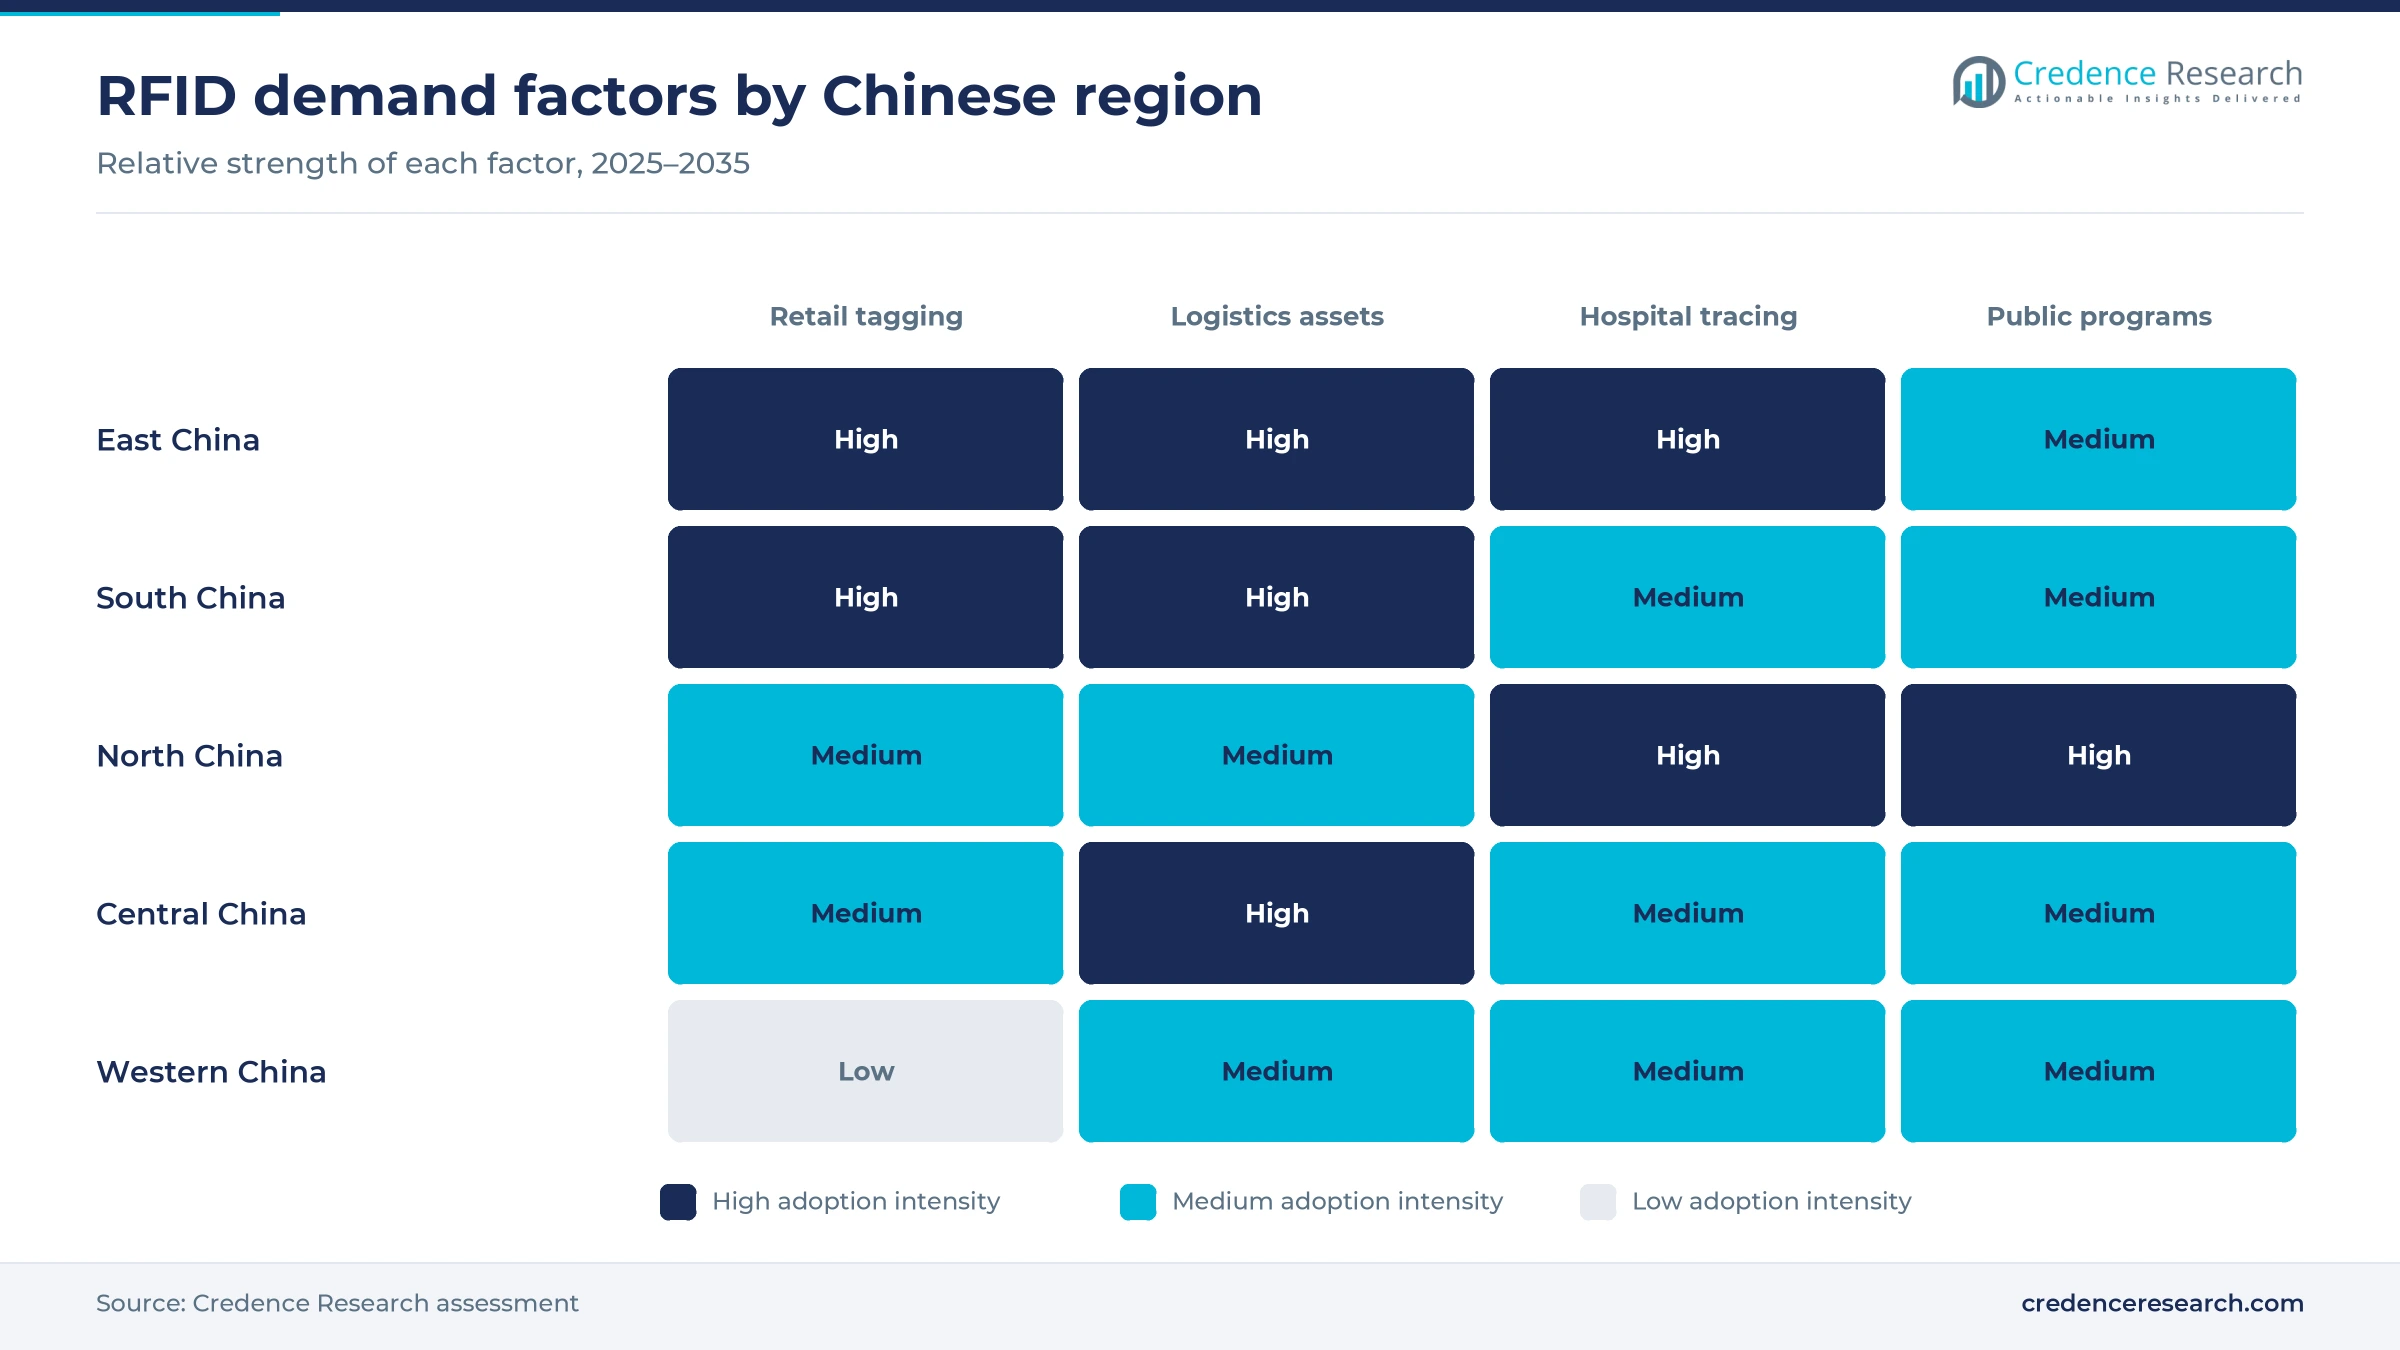
Apparel and variety chains tag items at source
Apparel, footwear and variety chains tag items at source, because RFID counts make store stock reliable enough for online orders and fast replenishment. SEUIC says RFID raised inventory counting efficiency at ANTA stores by 400%, and a March 2026 RAIN Alliance case study puts the same retail group at more than 12,000 stores nationwide. Urovo says its RFDT50 handheld sled reads up to 1,000 tags per second, according to its August 2024 partner release, so one worker can count a store in minutes. Label prices now close to those of security tags, as the price table shows, let chains tag most items rather than only high-value lines. Tagging decisions sit with brand head offices rather than stores, so converters compete for multi-season specifications.
A single UHF band simplifies reader design and approvals
A single ultra-high frequency band simplifies reader design and type approval, which lowers the cost of national rollouts. MIIT Regulation No. 76 of 2024 discontinued the 840 to 845 megahertz band and kept readers in 920 to 925 megahertz from Nov. 1, 2024, with tighter stray-emission and receiver-blocking limits, according to China Certification. Devices already certified may stay in use until decommissioned, so buyers face no forced replacement. Urovo, a Shenzhen reader maker, reached Impinj Gold Partner status in August 2024 with handhelds built on the Impinj E710 reader chip. Reader makers with one approved hardware line can serve retail, logistics and hospital buyers without regional variants.
Gen2X chips, reusable packaging and SPD reshape demand
Chipmakers are shifting to Gen2X and smaller tags
Tag makers are shifting toward Gen2X chips and very small tags, creating openings in cosmetics, accessories and electronics that resisted tagging. Xindeco IoT added VersaMax and VersaNano tags to its VersaTrack family in June 2026, built on Impinj M800 chips with Gen2X support, according to Packaging Insights, and the M800 series passed five billion lifetime shipments in early 2025, according to RFID Journal. The RAIN Alliance said in April 2026 that product-passport rules are advancing in China, so exporting suppliers of smart labels must prepare item-level data. Shanghai Quanray Electronics is one of only four chipmakers whose shipments the RAIN survey compiles, which places a domestic design house among the global volume suppliers. Suppliers that master small-antenna designs can charge more per tag than commodity apparel labels.
Returnable packaging is emerging as a steady tag buyer
Returnable packaging is emerging as a steady buyer, because logistics firms want to count each container cycle and cut losses. The JD Logistics cold-chain box program described above shows how a single operator can order hundreds of thousands of tags at once. Parcel growth of 12.9% in the first 11 months of 2025 keeps adding crates and cages that need identities. Brands exploring smart packaging for food and pharmaceuticals add another source of tagged containers. Avery Dennison runs I.LabX in Kunshan, opened in December 2023 with logistics and retail zones, to show such systems to Chinese buyers. Reusable assets also stabilize demand, because tags are replaced when boxes wear out.
Hospital SPD and smart cabinets are a near-term opening
Hospital supply processing and distribution programs are a near-term opening, because they shift purchasing of consumables from ward stock to tracked, pay-on-use inventory. SPD contracts usually bundle cabinets, software and on-site staff, so the vendor is paid for managed inventory rather than for hardware. Vendors of smart cabinets claim inventory accuracy above 99% and surgery preparation cut by 20 minutes, according to a February 2025 RFID World article by a supplier. Healthcare grows at 11.0% a year, the fastest end use. Integrators that link cabinets to hospital information systems win multiyear service contracts, because switching costs rise once ward staff rely on the cabinet data.
Airport baggage and rail tracking offer program-scale orders
Airport baggage and rail tracking offer program-scale orders, because one civil aviation or railway decision can equip many sites at once. The Civil Aviation Administration of China tracked about 1.54 million bags on more than 64,000 flights with RFID in 2021, with six airports in the pilot and major airports targeted by the end of 2022, according to an ICAO working paper. Invengo describes itself as a long-standing RFID supplier to China Rail and its automatic train identification system. Airports and rail operators now replace readers and add handheld and real-time location tools, which keeps the segment active after the first rollout. Current counts of airports using RFID are an evidence gap.
Price erosion, export controls and tariffs squeeze margins
Tag price competition squeezes inlay makers
Tag price competition squeezes inlay and label makers, because tags are interchangeable once a chip is certified. Global RAIN tag-chip shipments fell to 42.7 billion in 2025, a decline from the record 2024 level, as inventory overhang and retail destocking cut orders, according to the RAIN Alliance. Chinese converters with the same chips and machines then compete on price. Smaller converters without software or specialty tags are most exposed, while firms with hospital or industrial tags keep better margins.
U.S. export controls cut off some chip suppliers
U.S. export controls restrict some Chinese chip suppliers, which raises supply risk for converters that sell abroad. The Bureau of Industry and Security added Shanghai Fudan Microelectronics to the Entity List effective Sept. 12, 2025, with a presumption of denial for items under its rules, according to the Federal Register. Converters that use Fudan chips in tags for U.S. retailers face customer requalification. Domestic buyers are less exposed, because Fudan chips remain legal and available inside China.
Tariffs weaken export demand for Chinese tags
Tariffs on Chinese goods weaken export demand for Chinese-made tags, which pushes spare converter capacity toward the domestic market and adds pressure on local prices. The RAIN Alliance cited tariff uncertainty that reduced U.S. demand from apparel and general retail as one reason for the 2025 decline. Avery Dennison and Shenzhou Group opened a joint venture in Ho Chi Minh City on May 20, 2025 that makes RFID products, giving apparel brands a source outside China, although the companies did not link it to tariffs. Export-focused converters in East and South China are most exposed.
Uneven hospital budgets slow healthcare rollouts
Uneven hospital budgets slow healthcare rollouts, because RFID tracing needs cabinets, software and staff training before savings appear. China had about 38,700 hospitals at the end of 2024, according to the National Health Commission, but published RFID tracing cases come mostly from large tertiary teaching hospitals. County and private hospitals are most exposed to the cost, and the number of hospitals with full RFID tracing is an evidence gap. Vendors that offer pay-per-use SPD contracts lower the upfront barrier.
East China leads while Western China grows fastest
| Region | Value, 2025 (USD billion) | Share, 2025 | CAGR, 2026–2035 |
|---|---|---|---|
| East China | 1.77 | 40.0% | 8.3% |
| South China | 1.06 | 24.0% | 8.5% |
| North China | 0.75 | 17.0% | 8.4% |
| Central China | 0.44 | 10.0% | 9.3% |
| Western China | 0.40 | 9.0% | 9.6% |
East China leads on converters and retail head offices
East China held a 40.0% share of 2025 value and grows at 8.3% a year. The region hosts Shanghai chip designers Quanray and Fudan, Avery Dennison's Kunshan lab and most label converters. Retail and logistics head offices in Shanghai and Hangzhou award many national tagging programs here. Growth trails the inland regions, because many large retailers in the region already tag their stock.
South China leads in reader making and apparel retail
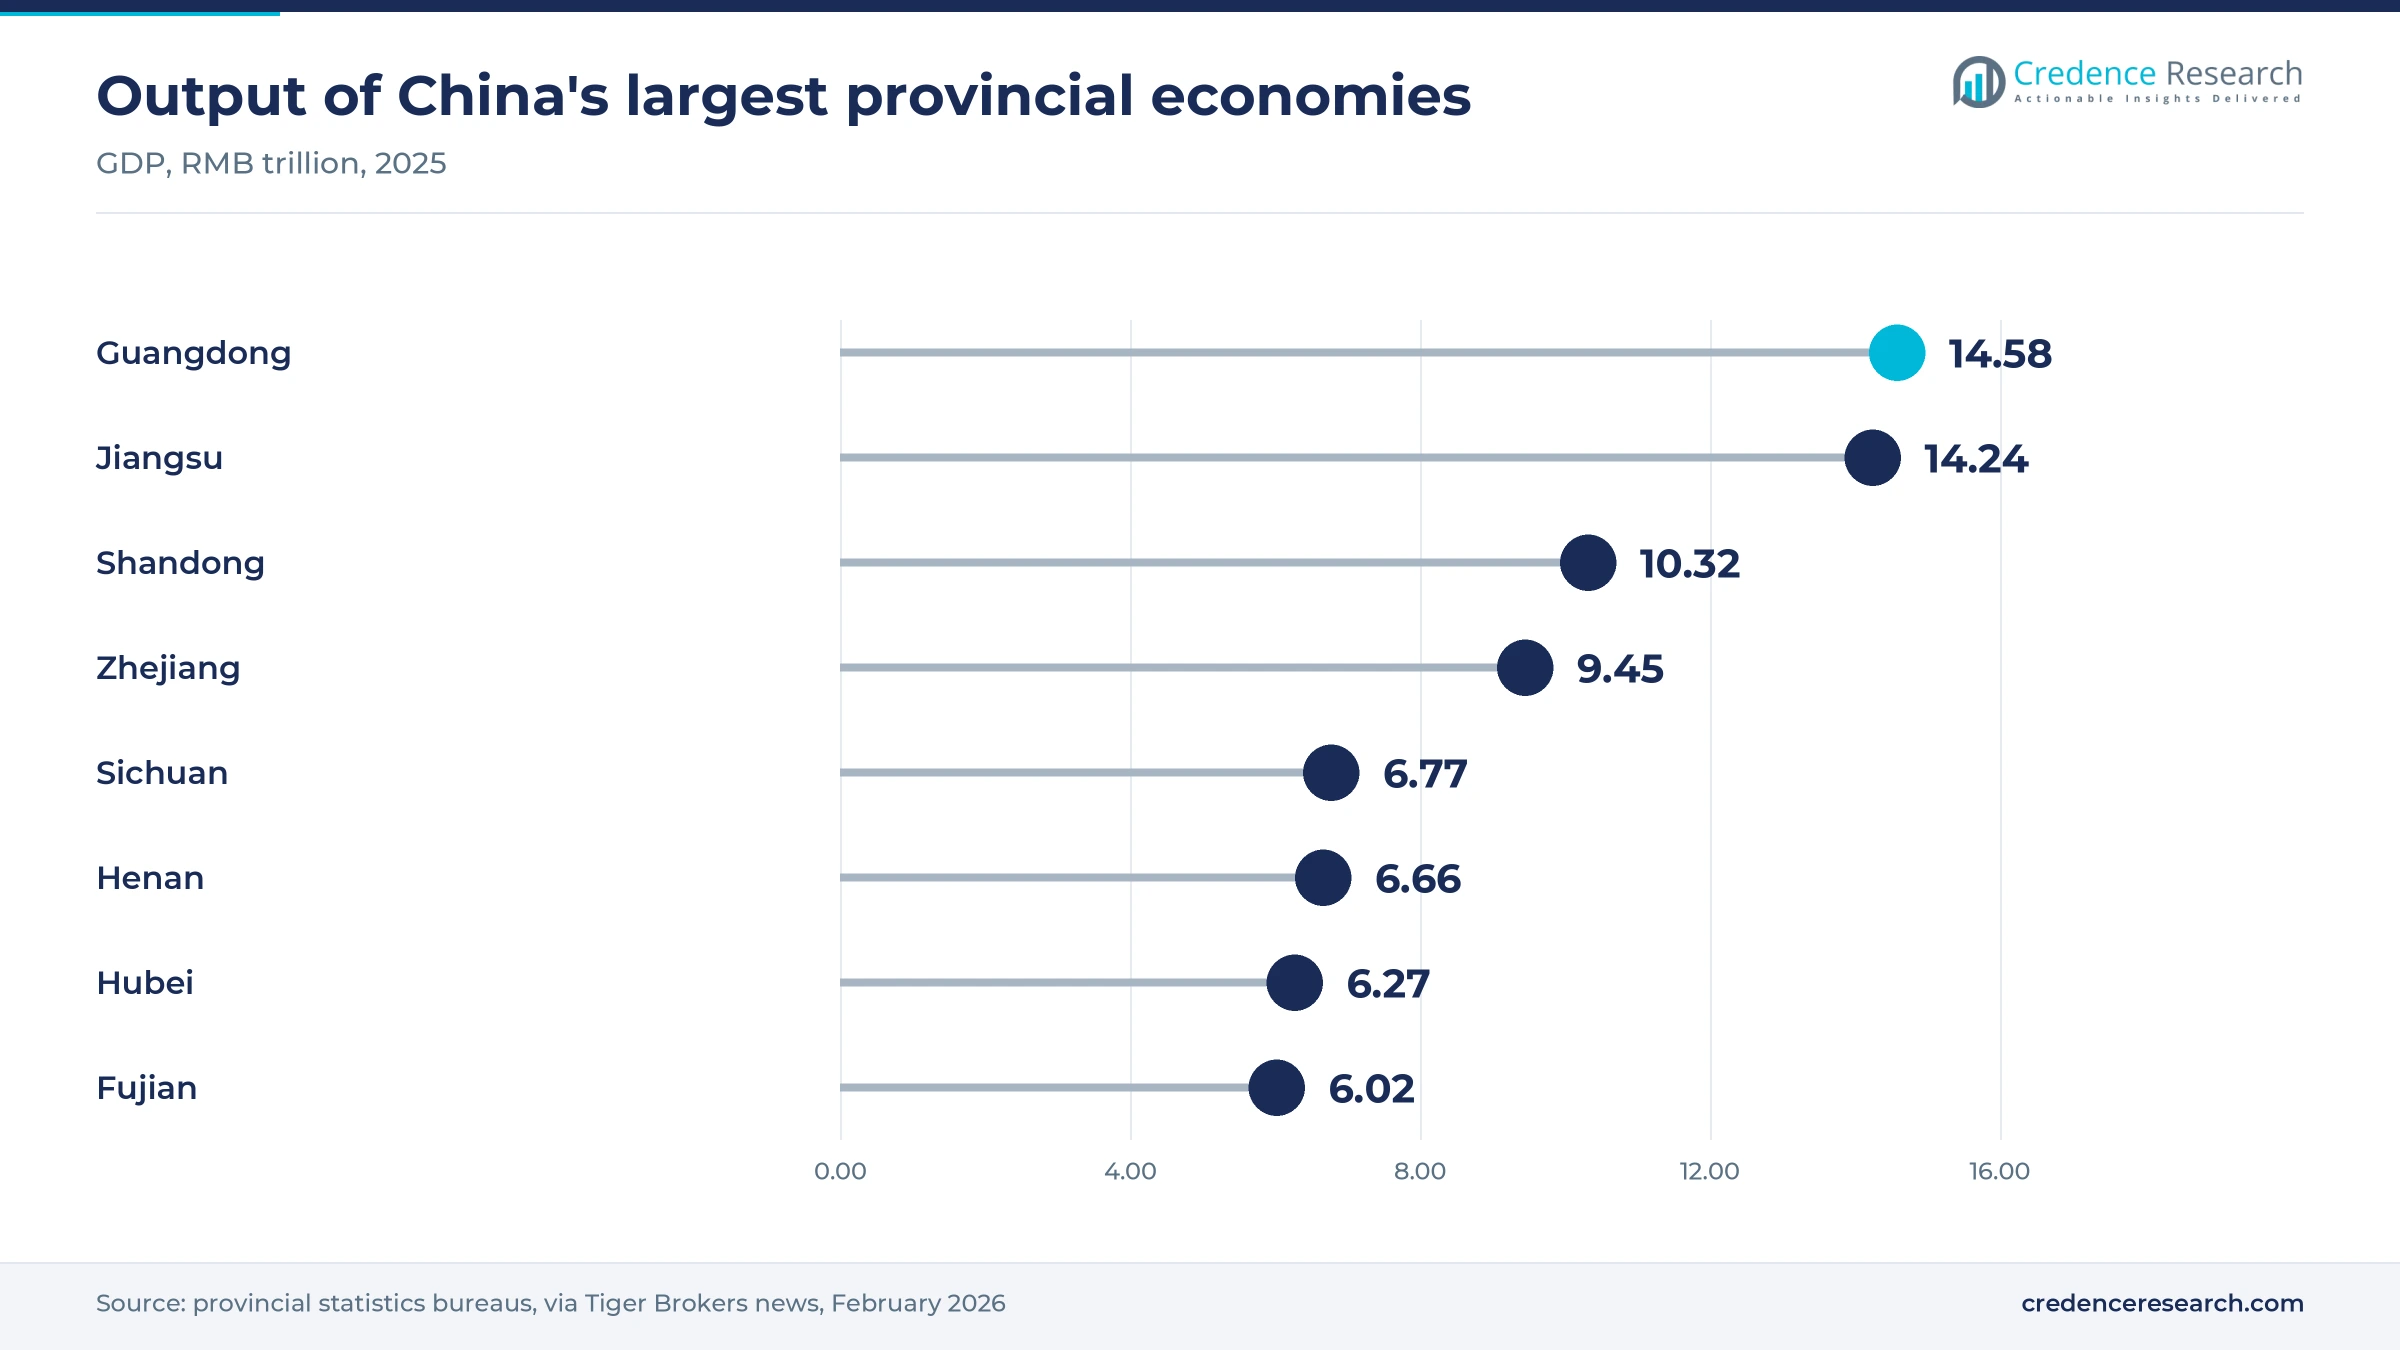
South China held a 24.0% share of 2025 value and grows at 8.5% a year. Guangdong produced about RMB 14.58 trillion of output in 2025, the largest of any province, and Shenzhen hosts reader and handheld makers such as Invengo, Urovo and Chainway. Large teaching hospitals in Guangzhou and Shenzhen add healthcare demand. The region gains from a dense base of electronics suppliers, which shortens reader design and certification cycles.
North China rests on public programs and aviation
North China held a 17.0% share of 2025 value and grows at 8.4% a year. Beijing hosts the ministries that set identity, health and aviation rules, and Beijing Capital and Daxing were among the six airports in the civil aviation RFID baggage pilot. Shandong passed RMB 10 trillion of output in 2025, adding port and manufacturing demand. Public programs make demand steady but slow, because tenders follow budget cycles rather than retail seasons.
Central China grows on logistics hubs
Central China held a 10.0% share of 2025 value and grows at 9.3% a year. Henan produced about RMB 6.66 trillion and Hubei about RMB 6.27 trillion of output in 2025, and both provinces host national parcel and rail freight hubs that sort goods for coastal brands. Warehouses relocating inland add orders for reusable crates and pallet tags. The region trails the coast in healthcare projects, so its growth depends more on logistics buyers.
Western China grows fastest from a small base
Western China held a 9.0% share of 2025 value and grows fastest at 9.6% a year. Sichuan produced about RMB 6.77 trillion of output in 2025, and Chongqing Library has run Invengo self-loan stations linked to social security cards, with a planned shared card for Sichuan and Chongqing libraries. Logistics parks around Chengdu and Chongqing add demand for container and pallet tracking, although published deployments there are few. The zone split is a Credence Research estimate, because no official RFID spending data exist by region.
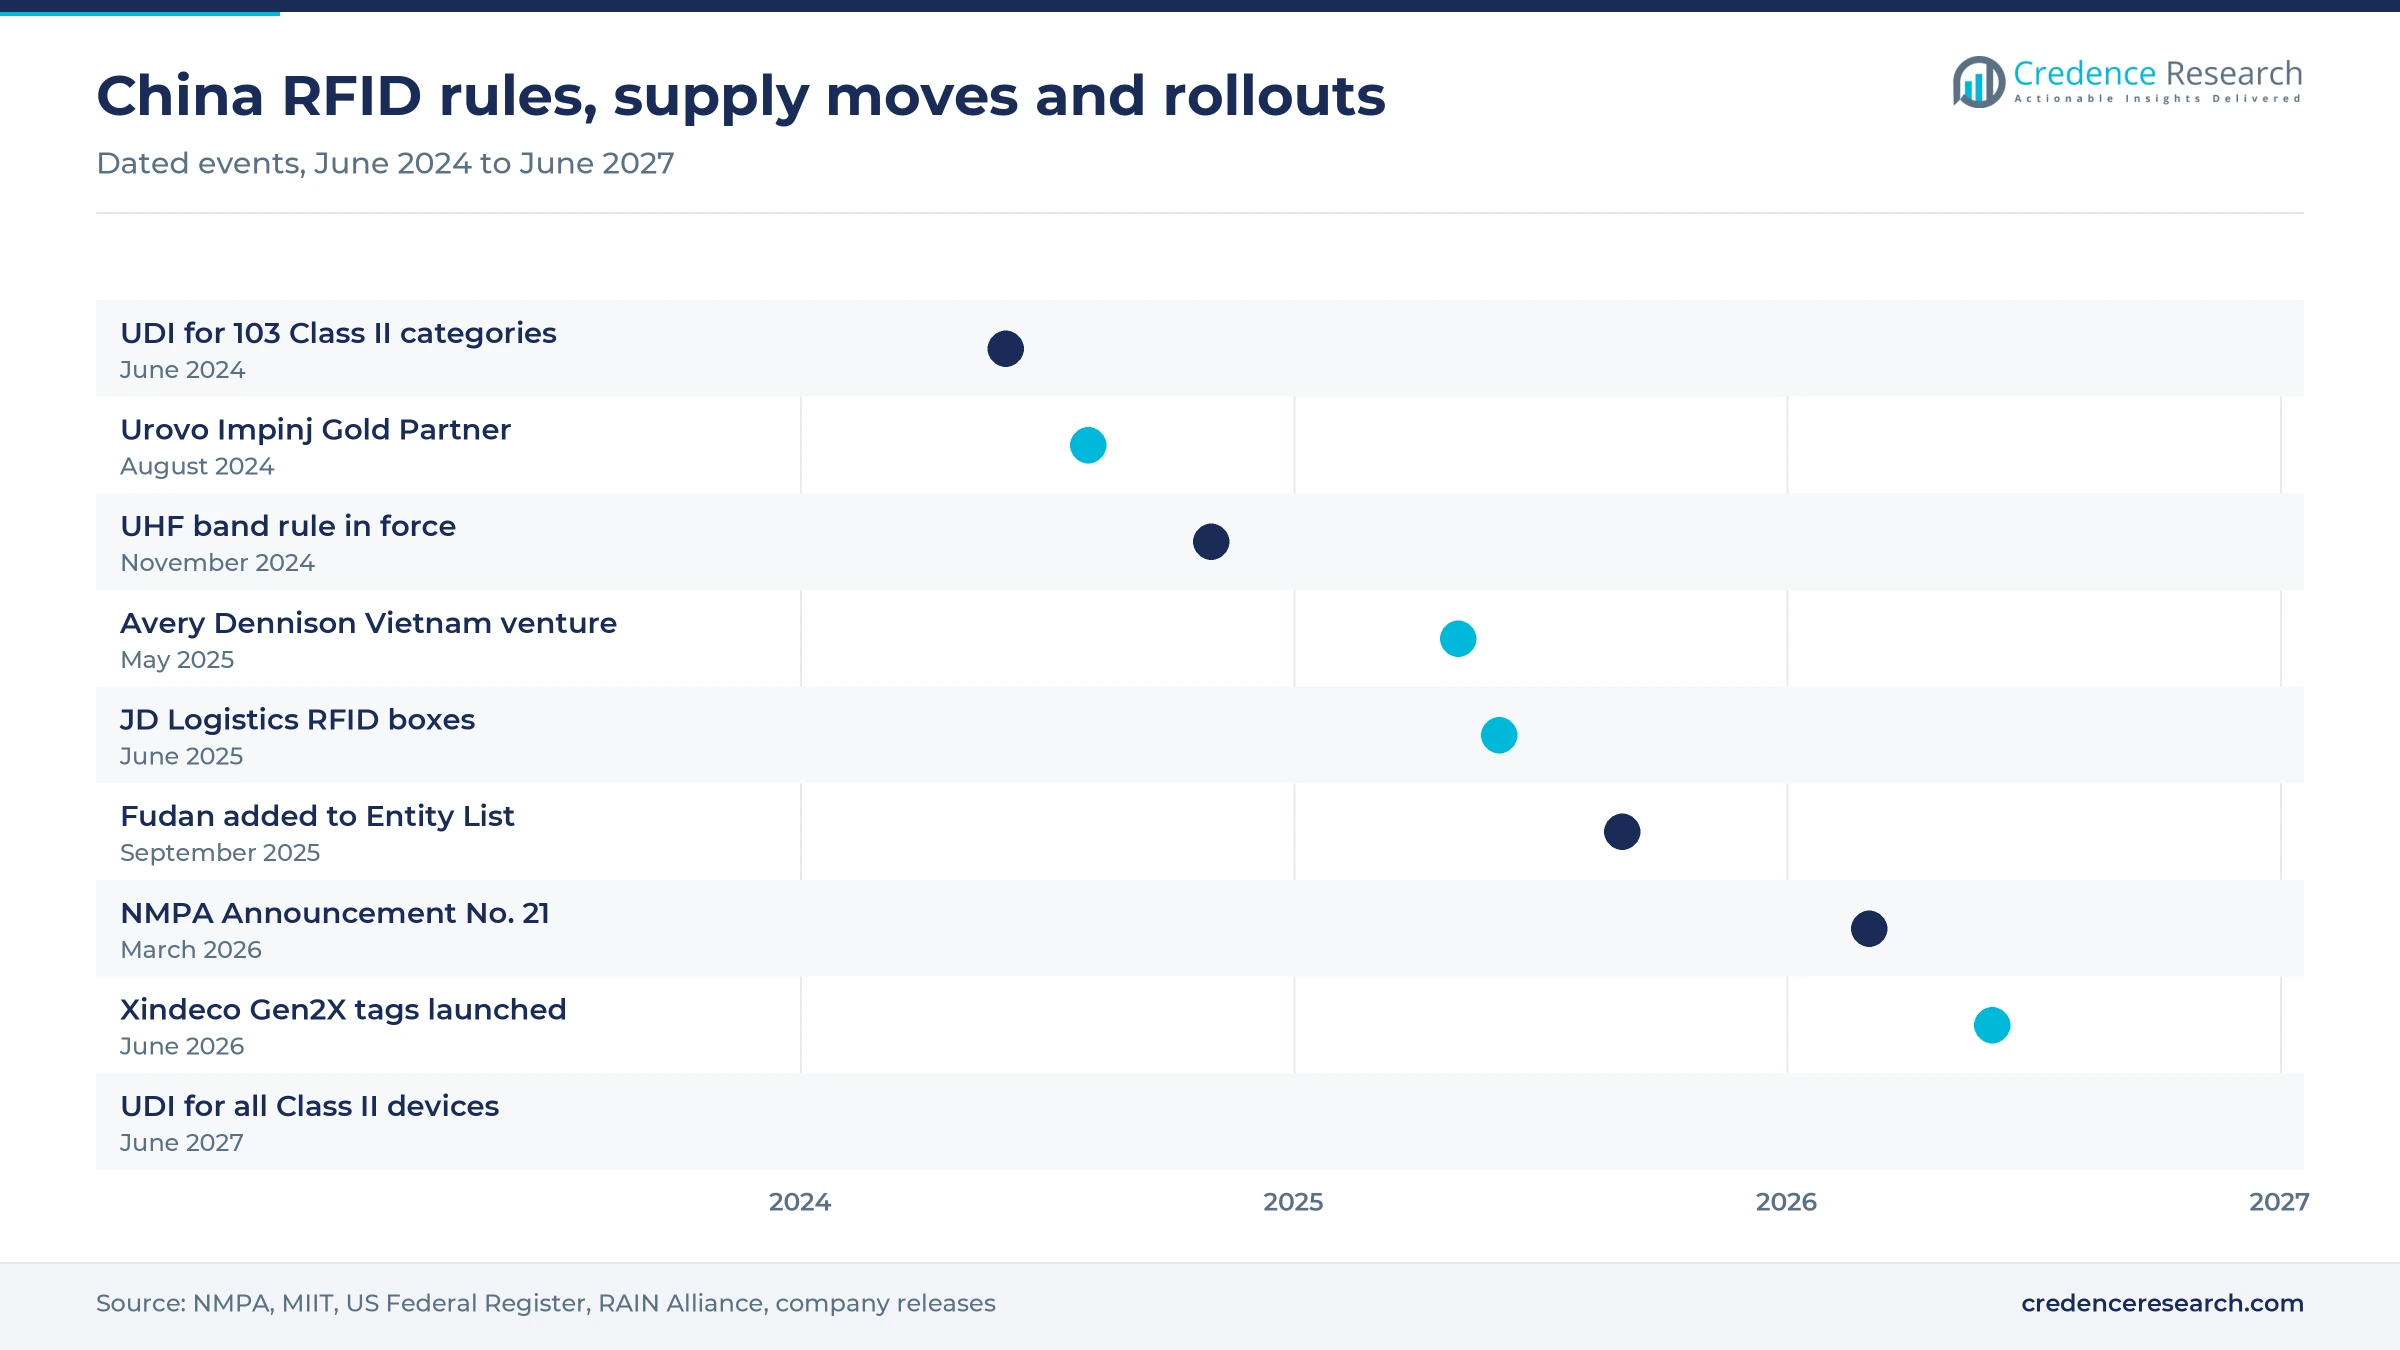
Rules, sanctions and rollouts that moved buyers, 2024–2026
| Development | Status and market relevance |
|---|---|
| In August 2024, Shenzhen reader maker Urovo reached Impinj Gold Partner status for handhelds and fixed readers built on Impinj reader chips. | Partner recognition; it confirms Impinj chips inside Chinese-made readers but discloses no order volume. |
| In November 2024, MIIT Regulation No. 76 took effect, moving UHF RFID readers to the 920 to 925 megahertz band. | Regulation in force; certified older devices may stay in use until they are decommissioned. |
| In June 2025, JD Logistics deployed 500,000 reusable cold-chain delivery boxes, each fitted with an RFID tag and barcode. | Operational deployment; tag supplier and unit price were not disclosed. |
| In September 2025, the U.S. Bureau of Industry and Security added Shanghai Fudan Microelectronics to the Entity List. | Final rule in force from Sept. 12, 2025; it affects exports and U.S.-origin inputs, not domestic sales. |
| In March 2026, NMPA published Announcement No. 21, extending UDI rules to all Class II devices from June 1, 2027. | Approved regulation; compliance begins with devices made on or after the effective date. |
Chip generation and reader design decide read accuracy
- Gen2X tag chips such as the Impinj M800 series extend read range and allow much smaller antennas, which opens cosmetics and accessories to item-level tagging.
- Handheld readers on the E710 reader chip such as Urovo and Chainway models read hundreds of tags a second, which makes store and warehouse counts practical for a single worker.
- Embedded and inlay designs built by converters such as Xindeco and Avery Dennison use UHF inlays tuned for liquids, metal or textiles, which decides how reliably a tag reads on each product.
- Smart cabinets and fixed portals read every item as it enters or leaves a room, which lets hospitals and warehouses charge stock on use instead of counting by hand.
Need a Custom Version of This Report?
Tailor the scope, geography, or segments to your exact requirements.
- Custom geography or segment scope
- Direct access to our analyst team
Local chip and reader makers face global platforms
Competition splits between chip designers, converters and reader makers, and the integrators that sell complete systems. Impinj and NXP supply most ultra-high frequency chips used by Chinese converters, while Shanghai Quanray Electronics and Shanghai Fudan Microelectronics compete with domestic chips. Avery Dennison and Xindeco IoT compete on inlays and specialty tags for apparel, cosmetics and logistics. Invengo, listed in Shenzhen, competes on railway, library and retail systems, while Urovo and SEUIC sell handheld readers to retail groups. Zebra Technologies, Brady Corporation, which bought Honeywell's productivity business in August 2026, and HID Global supply readers, printers and access-control credentials. Approved hardware, references in large public programs and software that links reads to inventory and hospital systems decide who wins contracts in China.
A few chip designers supply a crowded field of converters and integrators
Supply is organized as a narrow top and a wide base. A handful of chip designers, mainly Impinj, NXP, Quanray and Fudan in ultra-high frequency, supply hundreds of inlay converters, label printers and reader makers, many of them in Shanghai, Jiangsu, Zhejiang, Shenzhen and Xiamen. Entry is easy for converters, because chips and inlay machines are bought off the shelf, which keeps tag margins thin. Barriers rise for railway, aviation and hospital work, where type approval, references and software integration matter. Margins are highest in middleware and service contracts and lowest in commodity apparel labels.
Companies profiled and their roles in this market
| Company | Type | Role in the market |
|---|---|---|
| Invengo Information Technology Co., Ltd. | Local system supplier | RFID systems for railway identification, libraries, retail and healthcare in China |
| Avery Dennison Corporation | Inlay and label converter | UHF inlays and RFID labels, with a digital solutions lab in Kunshan |
| Impinj, Inc. | Chip supplier | M800 tag chips and E710 reader chips used by Chinese converters and readers |
| NXP Semiconductors | Chip supplier | UCODE UHF and NTAG and MIFARE HF chips for tags and cards |
| Shanghai Quanray Electronics Co., Ltd. | Local chip designer | UHF tag chips for apparel, logistics, retail and asset tagging |
| Shanghai Fudan Microelectronics Group | Local chip designer | RFID and smart card chips for domestic tag and card makers |
| Xindeco IoT | Local tag manufacturer | VersaTrack and VersaMini UHF tags for retail and hard-to-tag items |
| Urovo Technology | Local reader maker | Handheld and fixed UHF readers and RFID printers for retail and warehouses |
| SEUIC Technologies | Local reader maker | RFID handhelds and terminals for apparel retail and hospital asset tracking |
| Zebra Technologies Corporation | Reader and printer brand | Fixed and handheld RFID readers and RFID label printers |
| Brady Corporation (former Honeywell PSS) | Reader and mobile computer brand | RFID, scanning and mobile computers from the former Honeywell productivity business |
| HID Global (ASSA ABLOY) | Credential and tag supplier | HF access-control credentials, readers and industrial RFID tags |
Software and hospital work will carry the margin
Credence Research's view is that the value of RFID in China will shift from tags toward software and services through 2035. Tags remain the largest item, but price competition among converters keeps their value growing slower than their volume. Hospital tracing under the expanded UDI rules and returnable-asset programs in logistics carry higher spending per tag, because they need cabinets, portals and integration. The suppliers best placed are those that combine approved readers, domestic chip options and software that links reads to inventory, billing and patient records.
Old estimate rebuilt from frequency and end-use spend
The report uses 2025 as the base year and forecasts to 2035. Market values in this report come from the Credence Research model. This edition of the China RFID report replaces the previous 2024 estimate with a rebuilt 2025 value, checked against spending by frequency band and end use, published tag and reader prices, parcel statistics and hospital counts. Segment and regional shares are Credence Research estimates based on government statistics, regulator notices, trade body data and company announcements. No interviews or surveys were carried out for this edition.
Healthcare, logistics and UHF set the pace to 2035
In the base case the China RFID market grows at 8.60% a year through 2035, as hospital tracing, returnable logistics assets and item tagging in retail add value faster than identity and transit cards. Tags keep the largest share, while software and services grow fastest as buyers pay for integration. Ultra-high frequency gains on high frequency in stores and warehouses. East China keeps the largest regional share, and Western China gains on logistics. Price competition and trade rules are the main risks, so the pace will depend on how much software each new project carries.
Tag prices, hospital budgets and trade rules decide the range
The outcome depends on how fast hospitals move from pilot cabinets to full SPD tracing, whether logistics firms keep tagging returnable assets, and how trade rules shape exports of Chinese tags. A long price war among converters and slow hospital budgets would hold growth near the downside case. Wider UDI enforcement, a recovery in global tag demand and new product-passport rules would push the market toward the upside case.
| Scenario | CAGR, 2026–2035 | Value, 2035 | What has to hold |
|---|---|---|---|
| Downside | 6.6% | USD 8.53 billion | Tag prices keep falling, hospitals delay tracing and export controls widen to more suppliers |
| Base | 8.60% | USD 10.09 billion | Retail, logistics and hospital tagging continue at the pace seen in 2025 and 2026 |
| Upside | 10.4% | USD 11.69 billion | UDI enforcement, a recovery in tag-chip demand and product-passport rules widen tagging |
Frequently Asked Questions
How big is the China RFID market?
How is RFID used in healthcare in China?
Which RFID frequency leads in China?
Which frequency band do UHF RFID readers use in China?
How much does an RFID tag cost?
Which region leads the market in China?
What are the main challenges for RFID suppliers in China?
Which RFID companies lead in China?
Table of Content
Chapter 1 Market Segmentation
- 1.1 Segmentation Framework
- 1.1.1 Product and Service Classification
- 1.1.2 Application and End-Use Classification
- 1.1.3 Technology and Solution Classification
- 1.1.4 Customer and Distribution Channel Classification
- 1.1.5 Geographic Segmentation
- 1.1.6 Market Segment Definitions and Boundaries
- 1.2 By Product Type
- 1.2.1 Tags
- 1.2.2 Readers
- 1.2.3 Software and Services
- 1.3 By Frequency
- 1.3.1 Low Frequency
- 1.3.2 High Frequency
- 1.3.3 Ultra-High Frequency
- 1.4 By End User
- 1.4.1 Retail
- 1.4.2 Transportation
- 1.4.3 Security and Access Control
- 1.4.4 Commercial
- 1.4.5 Healthcare
- 1.4.6 Animal Tracking
- 1.4.7 Agriculture
- 1.4.8 Others
Chapter 2 Introduction
- 2.1 Report Objectives and Scope
- 2.2 Product Definition and Industry Terminology
- 2.3 Market Inclusions and Exclusions
- 2.4 Research Process
- 2.4.1 Primary Research and Expert Interviews
- 2.4.2 Secondary Research and Source Review
- 2.4.3 Top-Down and Bottom-Up Estimation
- 2.4.4 Data Triangulation and Verification
- 2.5 Market Size Measurement Basis
- 2.5.1 2025: USD 4.42 billion → 2035: USD 10.09 billion
- 2.6 Historical and Forecast Reference Periods
- 2.6.1 Historical Period: 2018-2025
- 2.6.2 Base Year: 2025
- 2.6.3 Forecast Period: 2025-2035
- 2.7 Research Assumptions and Limitations
Chapter 3 Executive Summary
- 3.1 Market Snapshot and Key Findings
- 3.2 Base-Year Market Size, 2025
- 3.3 Forecast Market Size, 2035
- 3.4 Revenue and Volume Growth Outlook
- 3.5 Key Demand and Supply Indicators
- 3.6 Leading Market Segments
- 3.7 Fastest-Growing Market Opportunities
- 3.8 Regional Performance Highlights
- 3.9 Technology and Industry Transformation
- 3.10 Competitive Landscape Summary
- 3.11 Analyst View and Strategic Implications
Chapter 4 China RFID Market Trends and Developments
- 4.1 Historical Industry Development, 2018-2025
- 4.2 Recent Market Trends and Developments
- 4.3 Demand and Customer Behavior Trends
- 4.4 Technology and Product Innovation
- 4.5 Artificial Intelligence, Automation and Digitalization
- 4.6 Local Manufacturing and Supply Chain Realignment
- 4.7 Industry Partnerships, Mergers and Acquisitions
- 4.8 Sustainability and Circular Economy Developments
- 4.9 Government and Private Sector Investment Trends
- 4.10 Emerging Business Models and Commercialization
- 4.11 Industry Developments and Announcements
Chapter 5 China RFID Market Production, Supply and Demand Analysis
- 5.1 Demand Trend and Consumption Analysis, 2018-2025
- 5.2 Demand Forecast, 2025-2035
- 5.3 Production and Output Trend, 2018-2025
- 5.4 Production and Output Forecast, 2025-2035
- 5.5 Installed Capacity and Capacity Utilization
- 5.6 Company-Wise Production Plants and Statistics
- 5.6.1 Installed Production Capacity
- 5.6.2 Actual Production
- 5.6.3 Planned Capacity and Expansion Targets
- 5.7 Supply Chain Structure and Procurement Trends
- 5.8 Supply-Demand Gap and Bottlenecks
- 5.9 Import Dependence and Sourcing Structure
- 5.10 Contract Manufacturing and Outsourcing
- 5.11 Regional Supply and Demand Concentration
Chapter 6 China RFID Market Pricing Analysis
- 6.1 Pricing Structure and Measurement
- 6.2 Historical Pricing Trends, 2018-2025
- 6.3 Pricing Outlook, 2025-2035
- 6.4 Average Selling Price and Unit Economics
- 6.5 Pricing by Product and Market Segment
- 6.6 Geographic Pricing Differences
- 6.7 Key Input, Energy, Labor and Logistics Costs
- 6.8 Contract Pricing and Purchasing Models
- 6.9 Pricing Sensitivity and Competitive Positioning
- 6.10 Price, Margin and Profitability Implications
Chapter 7 China RFID Market Dynamics
- 7.1 Market Growth Drivers
- 7.1.1 Demand-Side Drivers
- 7.1.2 Technology and Innovation Drivers
- 7.1.3 Infrastructure and Investment Drivers
- 7.1.4 Regulatory and Policy Drivers
- 7.2 Market Restraints
- 7.2.1 Cost and Affordability Constraints
- 7.2.2 Technology and Adoption Barriers
- 7.2.3 Supply Chain and Operational Constraints
- 7.3 Market Challenges
- 7.3.1 Competitive Pressure and Margin Erosion
- 7.3.2 Skills, Infrastructure and Implementation Gaps
- 7.4 Emerging Market Opportunities
- 7.5 Market Dynamics Impact and Time-Horizon Assessment
Chapter 8 China RFID Value Chain Analysis
- 8.1 Industry Value Chain Overview
- 8.2 Upstream Suppliers and Critical Inputs
- 8.3 Technology and Component Providers
- 8.4 Manufacturing or Service Delivery
- 8.5 Distribution, Channel Partners and Integrators
- 8.6 Downstream Applications and End Users
- 8.7 Value Addition and Profit Pools
- 8.8 Vertical Integration and Outsourcing
- 8.9 Supplier Concentration and Risk
- 8.10 Supply Chain Localization and Resilience
Chapter 9 China RFID Market Regulations and Policies
- 9.1 Relevant Laws, Standards and Compliance Frameworks
- 9.2 Product, Service, Safety and Quality Requirements
- 9.3 Government Policies, Incentives and Subsidies
- 9.4 Imports, Exports and Trade Barriers
- 9.5 Public Procurement and Local Content Requirements
- 9.6 Environmental and Sustainability Compliance
- 9.7 Upcoming Policy Changes and Market Implications
Chapter 10 China RFID Market Hotspots and Opportunities
- 10.1 Market Opportunity Mapping and Growth Hotspots
- 10.2 High-Growth Applications and Customer Groups
- 10.3 Underserved Markets and White-Space Opportunities
- 10.4 Emerging Technology and Product Opportunities
- 10.5 New Capacity and Investment Hotspots
- 10.6 Market Entry and Expansion Opportunities
- 10.7 Distribution and Partnership Opportunities
- 10.8 Near-Term and Long-Term Commercial Potential
- 10.9 Opportunity Attractiveness and Execution Risks
Chapter 11 China RFID Market Outlook, 2025-2035
- 11.1 Market Size and Analysis
- 11.1.1 Revenue (Market Measurement: 2025: USD 4.42 billion → 2035: USD 10.09 billion)
- 11.1.2 Market Volume and Quantity Sold
- 11.1.3 Historical Market Size, 2018-2025
- 11.1.4 Base-Year Market Size, 2025
- 11.2 Market Forecast, 2025-2035
- 11.2.1 Revenue Forecast to 2035
- 11.2.2 Volume Forecast to 2035
- 11.2.3 CAGR and Year-on-Year Growth
- 11.2.4 Incremental Revenue Opportunity
- 11.3 Forecast Assumptions and Scenario Analysis
- 11.3.1 Base-Case Forecast
- 11.3.2 Optimistic and Conservative Scenarios
- 11.3.3 Technology, Pricing and Policy Sensitivities
- 11.4 Market Attractiveness and Growth Outlook
Chapter 12 China RFID Market Segmentation and Outlook
- 12.1 Segmentation Summary and Market Shares, 2025
- 12.2 Largest and Fastest-Growing Segments
- 12.3 By Product Type - Market Size and Forecast, 2025-2035
- 12.3.1 Segment Definition and Scope
- 12.3.2 Historical Market Size, 2018-2025
- 12.3.3 Revenue Forecast, 2025-2035
- 12.3.4 Volume Forecast, 2025-2035
- 12.3.5 Base-Year Market Share, 2025
- 12.3.6 Segment CAGR and Growth Drivers
- 12.3.7 Subsegment Market Size and Forecast
- 12.3.7.1 Tags
- 12.3.7.2 Readers
- 12.3.7.3 Software and Services
- 12.3.8 Subsegment Pricing and Adoption Trends
- 12.3.9 Leading Suppliers and Competition
- 12.3.10 Regional Demand and Opportunities
- 12.4 By Frequency - Market Size and Forecast, 2025-2035
- 12.4.1 Segment Definition and Scope
- 12.4.2 Historical Market Size, 2018-2025
- 12.4.3 Revenue Forecast, 2025-2035
- 12.4.4 Volume Forecast, 2025-2035
- 12.4.5 Base-Year Market Share, 2025
- 12.4.6 Segment CAGR and Growth Drivers
- 12.4.7 Subsegment Market Size and Forecast
- 12.4.7.1 Low Frequency
- 12.4.7.2 High Frequency
- 12.4.7.3 Ultra-High Frequency
- 12.4.8 Subsegment Pricing and Adoption Trends
- 12.4.9 Leading Suppliers and Competition
- 12.4.10 Regional Demand and Opportunities
- 12.5 By End User - Market Size and Forecast, 2025-2035
- 12.5.1 Segment Definition and Scope
- 12.5.2 Historical Market Size, 2018-2025
- 12.5.3 Revenue Forecast, 2025-2035
- 12.5.4 Volume Forecast, 2025-2035
- 12.5.5 Base-Year Market Share, 2025
- 12.5.6 Segment CAGR and Growth Drivers
- 12.5.7 Subsegment Market Size and Forecast
- 12.5.7.1 Retail
- 12.5.7.2 Transportation
- 12.5.7.3 Security and Access Control
- 12.5.7.4 Commercial
- 12.5.7.5 Healthcare
- 12.5.7.6 Animal Tracking
- 12.5.7.7 Agriculture
- 12.5.7.8 Others
- 12.5.8 Subsegment Pricing and Adoption Trends
- 12.5.9 Leading Suppliers and Competition
- 12.5.10 Regional Demand and Opportunities
- 12.6 Segment Growth Comparison
- 12.7 Segment Attractiveness and Priority Matrix
Chapter 13 China RFID End-Use and Application Market Outlook
- 13.1 End-Use Industry and Customer Demand Structure
- 13.2 Leading Applications and Customer Groups
- 13.3 End-Use Market Size, Share and Forecast
- 13.4 Major End-Use Industry Deep Dives
- 13.4.1 Customer Requirements and Use Cases
- 13.4.2 Demand and Replacement Cycles
- 13.4.3 Technical and Regulatory Considerations
- 13.4.4 Purchasing and Procurement Models
- 13.4.5 Leading Vendors and Distribution Channels
- 13.4.6 Forecast and Commercial Opportunities
- 13.5 Emerging Applications and Cross-Segment Demand
- 13.6 End-Use Industry Investment Priorities
Chapter 14 China RFID Geographic Market Outlook, 2025-2035
- 14.1 Domestic Market Distribution and Demand Clusters
- 14.2 State- or Province-Wise Market Size and Forecast, 2025-2035
- 14.3 City and Metropolitan Market Outlook
- 14.4 Industrial, Manufacturing and Commercial Clusters
- 14.5 Geographic Concentration of Key End Users
- 14.6 Local Pricing and Purchasing Differences
- 14.7 Domestic Production Facilities and Capacity Map
- 14.8 Local Infrastructure and Project Pipeline
- 14.9 State-Level Policy and Incentive Differences
- 14.10 Subnational Investment Hotspots and Opportunities
- 14.11 Distribution and Logistics Networks
- 14.12 Domestic Competitive Footprint
Chapter 15 China RFID Technology, Innovation and Sustainability Outlook
- 15.1 Technology Landscape and Maturity
- 15.2 Product, Process and Service Innovation
- 15.3 AI, Automation and Digital Tools in the Industry
- 15.4 Technology Adoption and Performance Benchmarking
- 15.5 Innovation Pipeline and R&D Investment
- 15.6 Patent and Intellectual Property Trends
- 15.7 Energy Efficiency and Resource Management
- 15.8 Sustainability, Recycling and Circularity
- 15.9 Technology Roadmap, 2025-2035
- 15.10 Risks of Obsolescence and Technology Substitution
Chapter 16 China RFID Market Key Strategic Imperatives
- 16.1 Growth and Market Entry Priorities
- 16.2 High-Return Products and Segments
- 16.3 Pricing, Profitability and Cost Optimization
- 16.4 Technology Investment and Product Differentiation
- 16.5 Supply Chain Localization and Resilience
- 16.6 Distribution and Customer Acquisition
- 16.7 Partnership, Acquisition and Capacity Strategy
- 16.8 Regional Expansion Priorities
- 16.9 Short-, Medium- and Long-Term Actions
Chapter 17 Competition Outlook
- 17.1 Industry Competition Characteristics
- 17.2 Market Structure and Concentration
- 17.3 Market Share and Competitive Positioning, 2025
- 17.4 Company-Wise Revenue and Product Benchmarking
- 17.5 Production and Service Capacity Benchmarking
- 17.6 Technology, Pricing and Differentiation
- 17.7 Regional Footprint and Distribution Strength
- 17.8 Mergers, Acquisitions and Strategic Alliances
- 17.9 New Entrants and Competitive Threats
- 17.10 Porter's Five Forces and Industry Attractiveness
- 17.11 Competitive Outlook, 2025-2035
Chapter 18 Company Profiles
- 18.1 Company Coverage and Selection Criteria
- 18.2 Invengo Information Technology Co., Ltd.
- 18.2.1 Business Description
- 18.2.2 Company Ownership and Geographic Presence
- 18.2.3 Product and Service Portfolio
- 18.2.4 Manufacturing and Operating Footprint
- 18.2.5 Production Capacity and Expansion Plans
- 18.2.6 Financial Performance and Investment
- 18.2.7 Market Share and Competitive Position
- 18.2.8 Technology and Innovation Capabilities
- 18.2.9 Strategic Alliances or Partnerships
- 18.2.10 Recent Developments
- 18.2.11 Growth Strategy and Outlook
- 18.3 Avery Dennison Corporation
- 18.4 Impinj, Inc.
- 18.5 NXP Semiconductors
- 18.6 Shanghai Quanray Electronics Co., Ltd.
- 18.7 Shanghai Fudan Microelectronics Group
- 18.8 Xindeco IoT
- 18.9 Urovo Technology
- 18.10 SEUIC Technologies
- 18.11 Zebra Technologies Corporation
- 18.12 Brady Corporation (former Honeywell PSS)
- 18.13 HID Global (ASSA ABLOY)
- 18.14 Other Relevant Market Participants
Note: Every listed company is profiled on the structure shown under the first company. The company list is preliminary and may change based on research findings, market developments, data availability and client requirements.
Chapter 19 Disclaimer
- 19.1 Research and Forecast Disclaimer
- 19.2 Data Source and Estimation Limitations
Note: The depth of individual sections depends on data availability for this market. Volume, capacity, trade and other unit-based metrics are included where applicable.

