
State networks set demand as operators sell QKD links
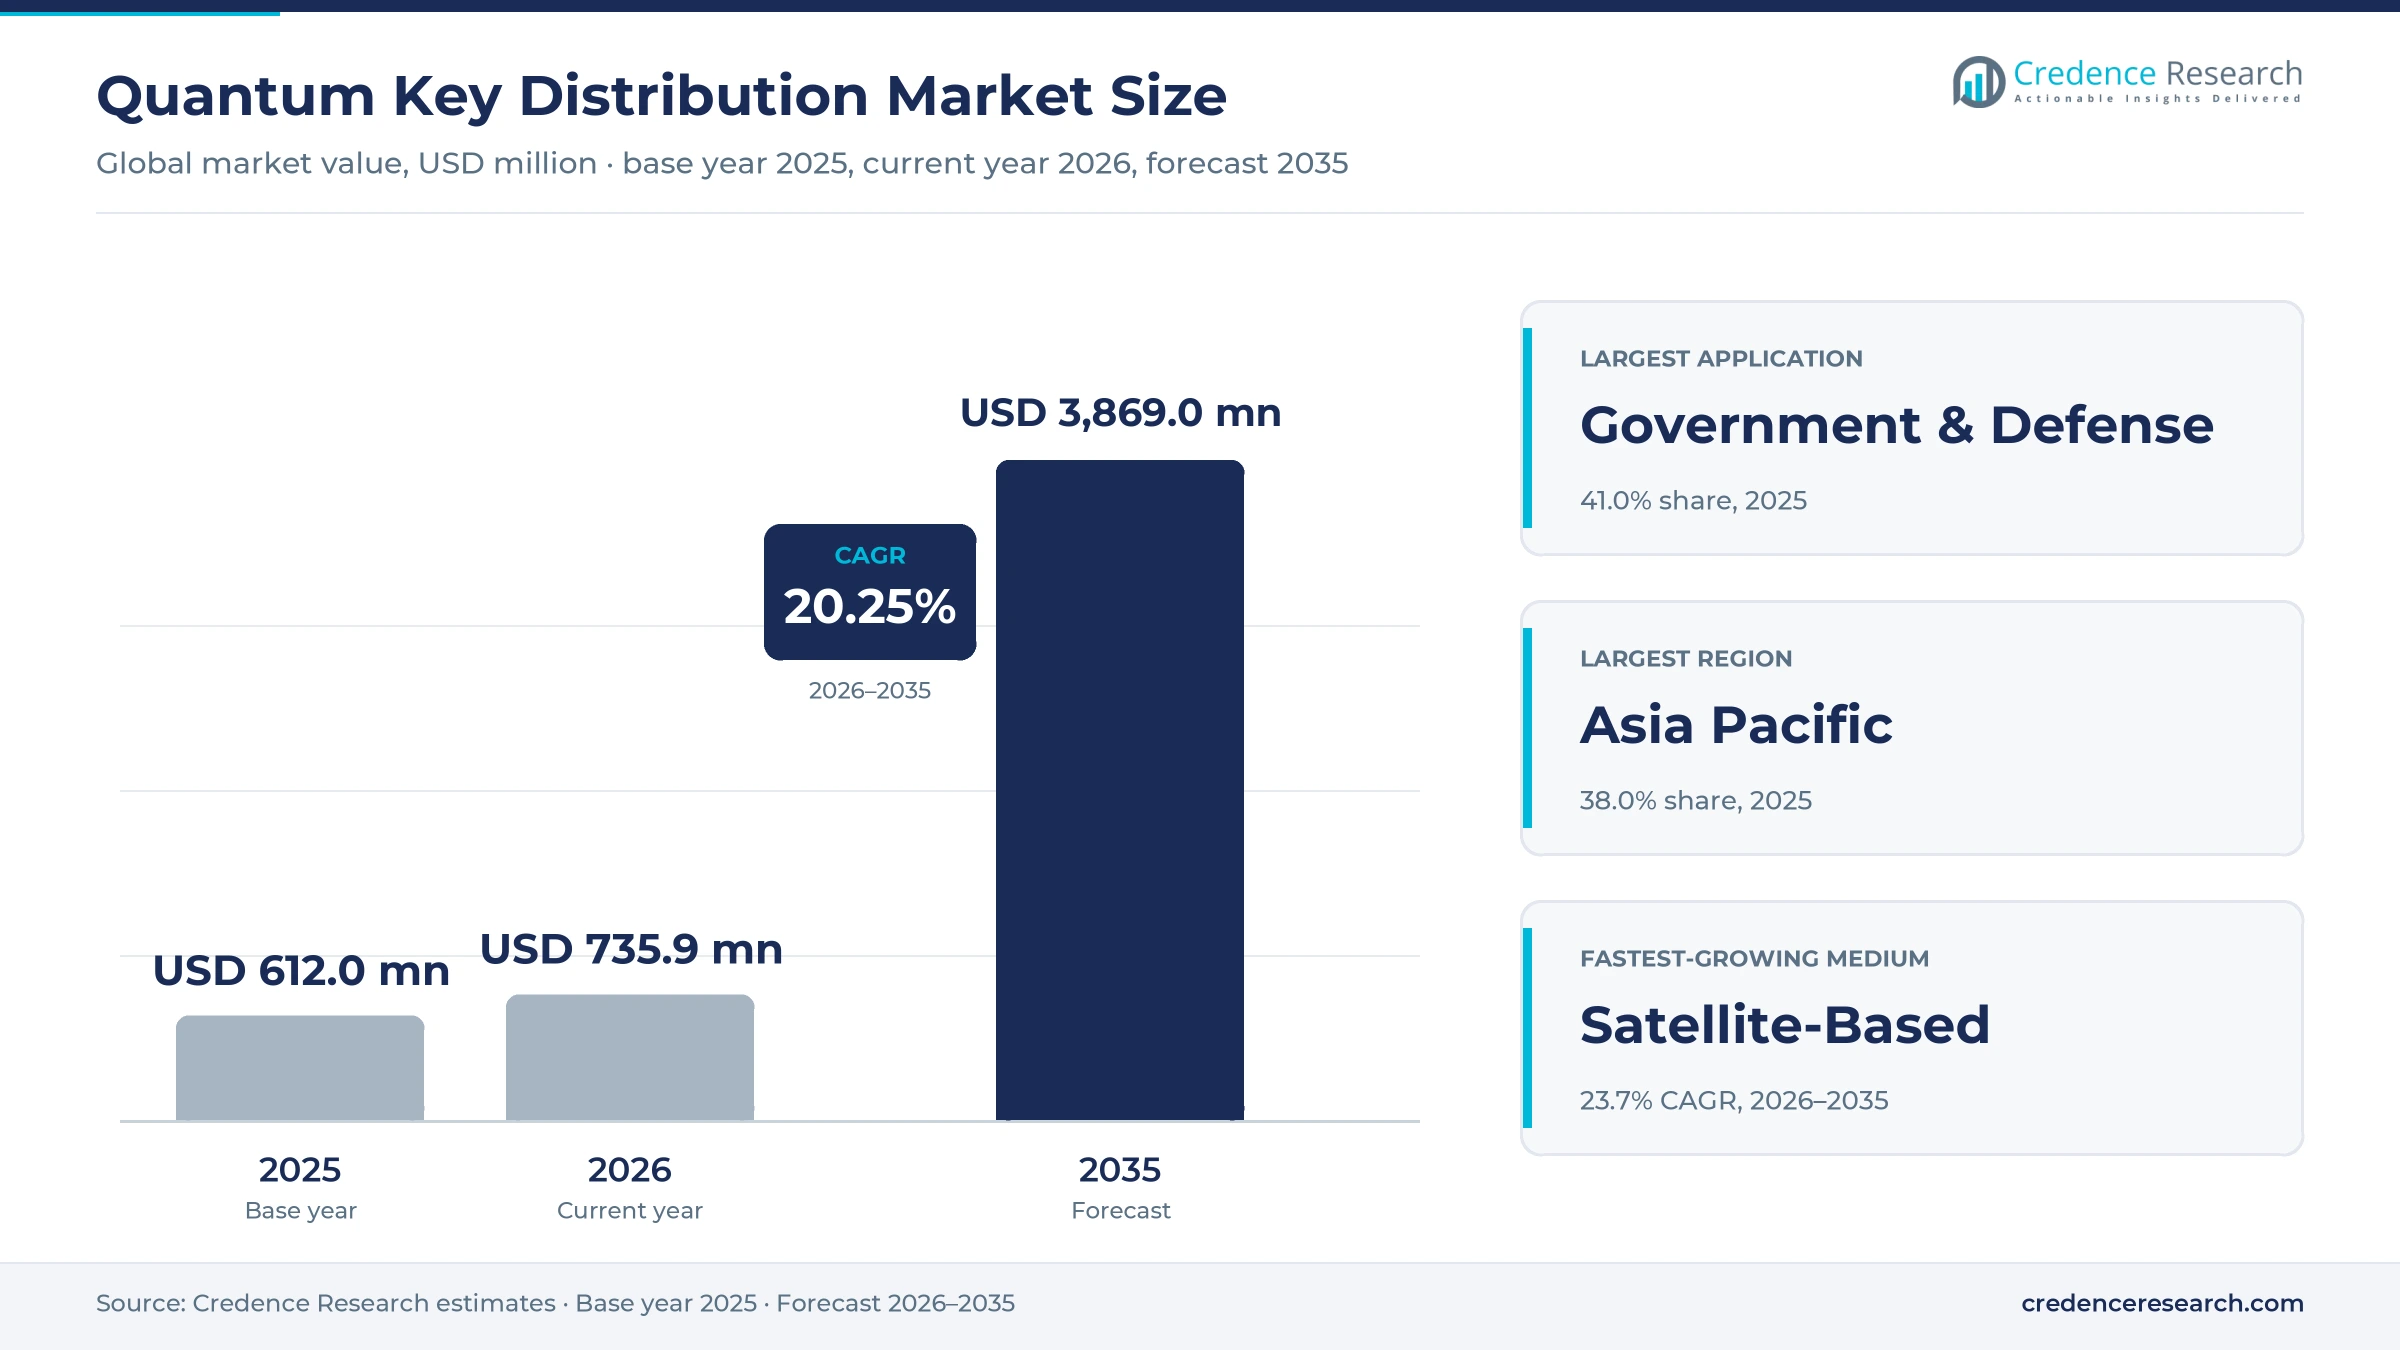
The global quantum key distribution market was valued at USD 612.0 million in 2025 and is projected to increase from USD 735.9 million in 2026 to USD 3.87 billion by 2035, registering a CAGR of 20.25% during 2026–2035. Demand comes from governments that want encryption keys whose exchange reveals any interception, and from operators, banks and data center owners that add those keys to existing optical encryption. Asia Pacific held the largest regional share, 38.0% in 2025, because Chinese state networks and national programs in South Korea, Singapore and India buy the most links. Europe is the fastest-growing region at 21.1% a year as member states build national segments of the EU quantum communication infrastructure. The main commercial change is the hybrid design, in which suppliers combine QKD keys with post-quantum algorithms on shared fiber, while U.S. and U.K. security agencies still recommend post-quantum cryptography first, which limits federal demand.
Keys, not data, are what buyers pay QKD suppliers to protect
The market counts QKD transmitters and receivers, key management systems, integration work and QKD-secured link services that governments, telecom operators, banks, data center owners and hospitals buy to refresh encryption keys between sites. Buyers usually procure point-to-point metro links first and then extend them into backbones with trusted nodes that relay keys between cities.
Post-quantum cryptography software, quantum random number generators sold on their own and quantum computing services are excluded. Value sits with vendors that hold certified optical hardware and key management software, because the encryptors that carry customer traffic come from separate optical transport suppliers.
Quantum Key Distribution Market Insights
- The global quantum key distribution market was valued at USD 612.0 million in 2025 and is projected to reach USD 3.87 billion by 2035, growing at a 20.25% CAGR during 2026–2035.
- Asia Pacific held 38.0% of 2025 value, as Chinese state networks and national programs in Korea, Singapore and India buy most links.
- Government and defense held 41.0% of 2025 value, because ministries and state-owned firms fund most QKD backbones today.
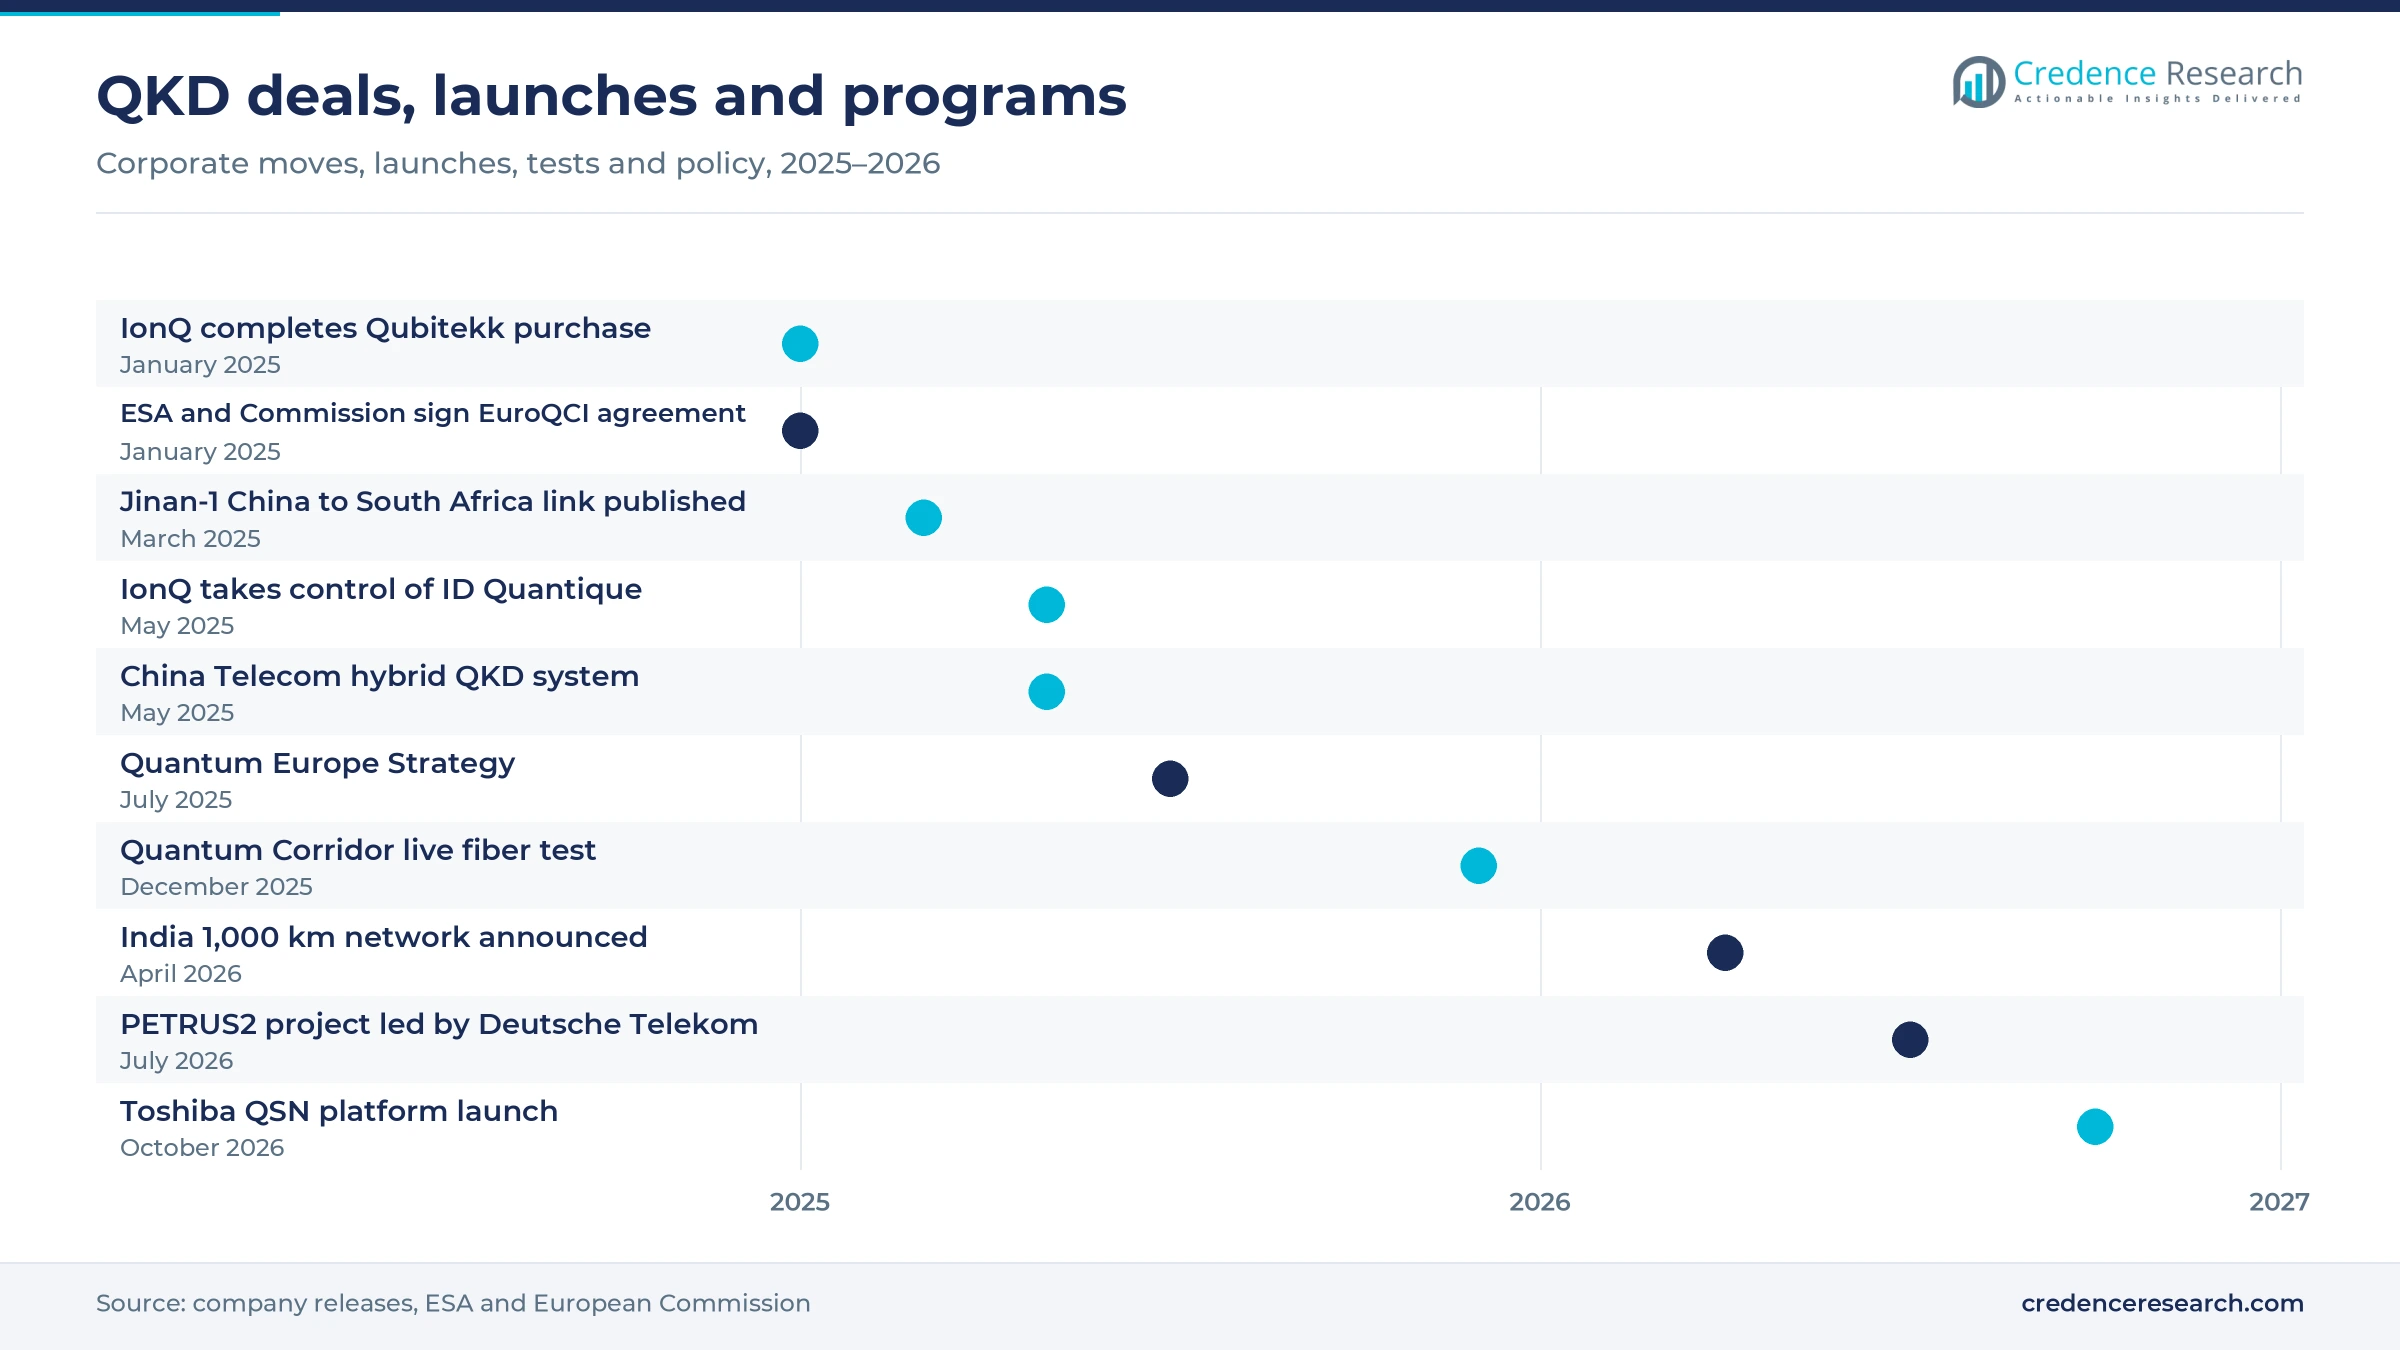
- China Telecom launched a hybrid QKD and post-quantum cryptography system in May 2025 and completed a call of more than 1,000 km.
- The NSA does not recommend QKD for national security systems, which keeps U.S. federal demand below that of Asia and Europe.
Long-distance links lead while multiplexed systems gain
Trusted-node backbones keep long-distance systems ahead
Based on type, the market is categorized into multiplexed systems and long distance systems. Long Distance Systems led with 52.0% of 2025 value because state backbones relay keys across hundreds of kilometers through trusted nodes, and the Quantum Corridor network in Illinois and Indiana is planned to stretch 263 miles, according to a December 2025 release. Multiplexed Systems grow fastest at 21.3% a year because they let QKD share lit fiber with data traffic, so buyers avoid leasing a dark strand for every link, and Toshiba's Quantum-Safe Networking platform, launched in October 2026, is designed to serve hundreds of remote sites from one hub.
Government buyers lead as telecom and data center links grow
Based on application, the market is categorized into telecom and data center, financial services companies, government and defense, healthcare and others. Government & Defense led with 41.0% of 2025 value because ministries fund the first networks, and South Korea's Ministry of Science and ICT opened a call on May 6, 2026, for a 2026 to 2028 expansion that requires public and private demand organizations to take part. Telecom and Data Center grows fastest at 21.7% a year because operators can resell one QKD backbone to many enterprise sites, and BT and Colt are testing Toshiba Europe equipment on live networks under a U.K. funded scale-up project awarded in November 2026.
Fiber carries most links as satellite trials start
Based on transmission medium, the market is categorized into fiber-based and satellite-based QKD. Fiber-Based links led with 88.0% of 2025 value because metro QKD plugs into existing optical encryptors, and the Chicago test used Ciena Waveserver 5 modules at 800G with AES-256 encryption certified to FIPS 140-3 Level 2. Satellite-Based QKD grows fastest at 23.7% a year as Colt, Honeywell and Nokia said on June 2, 2025, that they would trial QKD over low Earth orbit satellites for transatlantic distances, although commercial capacity remains small.
| Segment Group | Leading Sub-segment | Share, 2025 | Fastest-growing Sub-segment | CAGR, 2026–2035 |
|---|---|---|---|---|
| By Type | Long Distance Systems | 52.0% | Multiplexed Systems | 21.3% |
| By Application | Government & Defense | 41.0% | Telecom and Data Center | 21.7% |
| By Transmission Medium | Fiber-Based | 88.0% | Satellite-Based | 23.7% |
QKD links sell by project, not by list price
QKD is priced per project, because each link depends on fiber loss, distance, node count and the encryptors it must feed. No major vendor publishes list prices, so the figures below are partly Credence Research estimates and should be read as ranges. Public funding sets the scale of many deals, as U.K. competition projects worth GBP 1.5 million to GBP 3 million show. No vendor discloses QKD margins, so the split of value between hardware and services is an evidence gap, while operators earn recurring fees on managed links and lit-fiber multiplexing should lower the cost of each new site.
| Offer or contract | Typical price or fee | Basis |
|---|---|---|
| British funded quantum networking project | GBP 1.5 million to GBP 3 million per project | TechRepublic on the British commercial quantum networking competition, November 2026 |
| Metro QKD link, transmitter and receiver pair | USD 150,000 to USD 400,000 (estimate) | Credence Research estimate from tender scope and integration work |
| Managed QKD-secured link service | USD 5,000 to USD 20,000 a month per site pair (estimate) | Credence Research estimate from operator service models |
Request a Free Sample
Fill in your details and we'll send you a free sample report.
- Sample data tables & charts
- Research methodology
State backbones and operator services drive QKD demand
State backbones turn QKD into public infrastructure
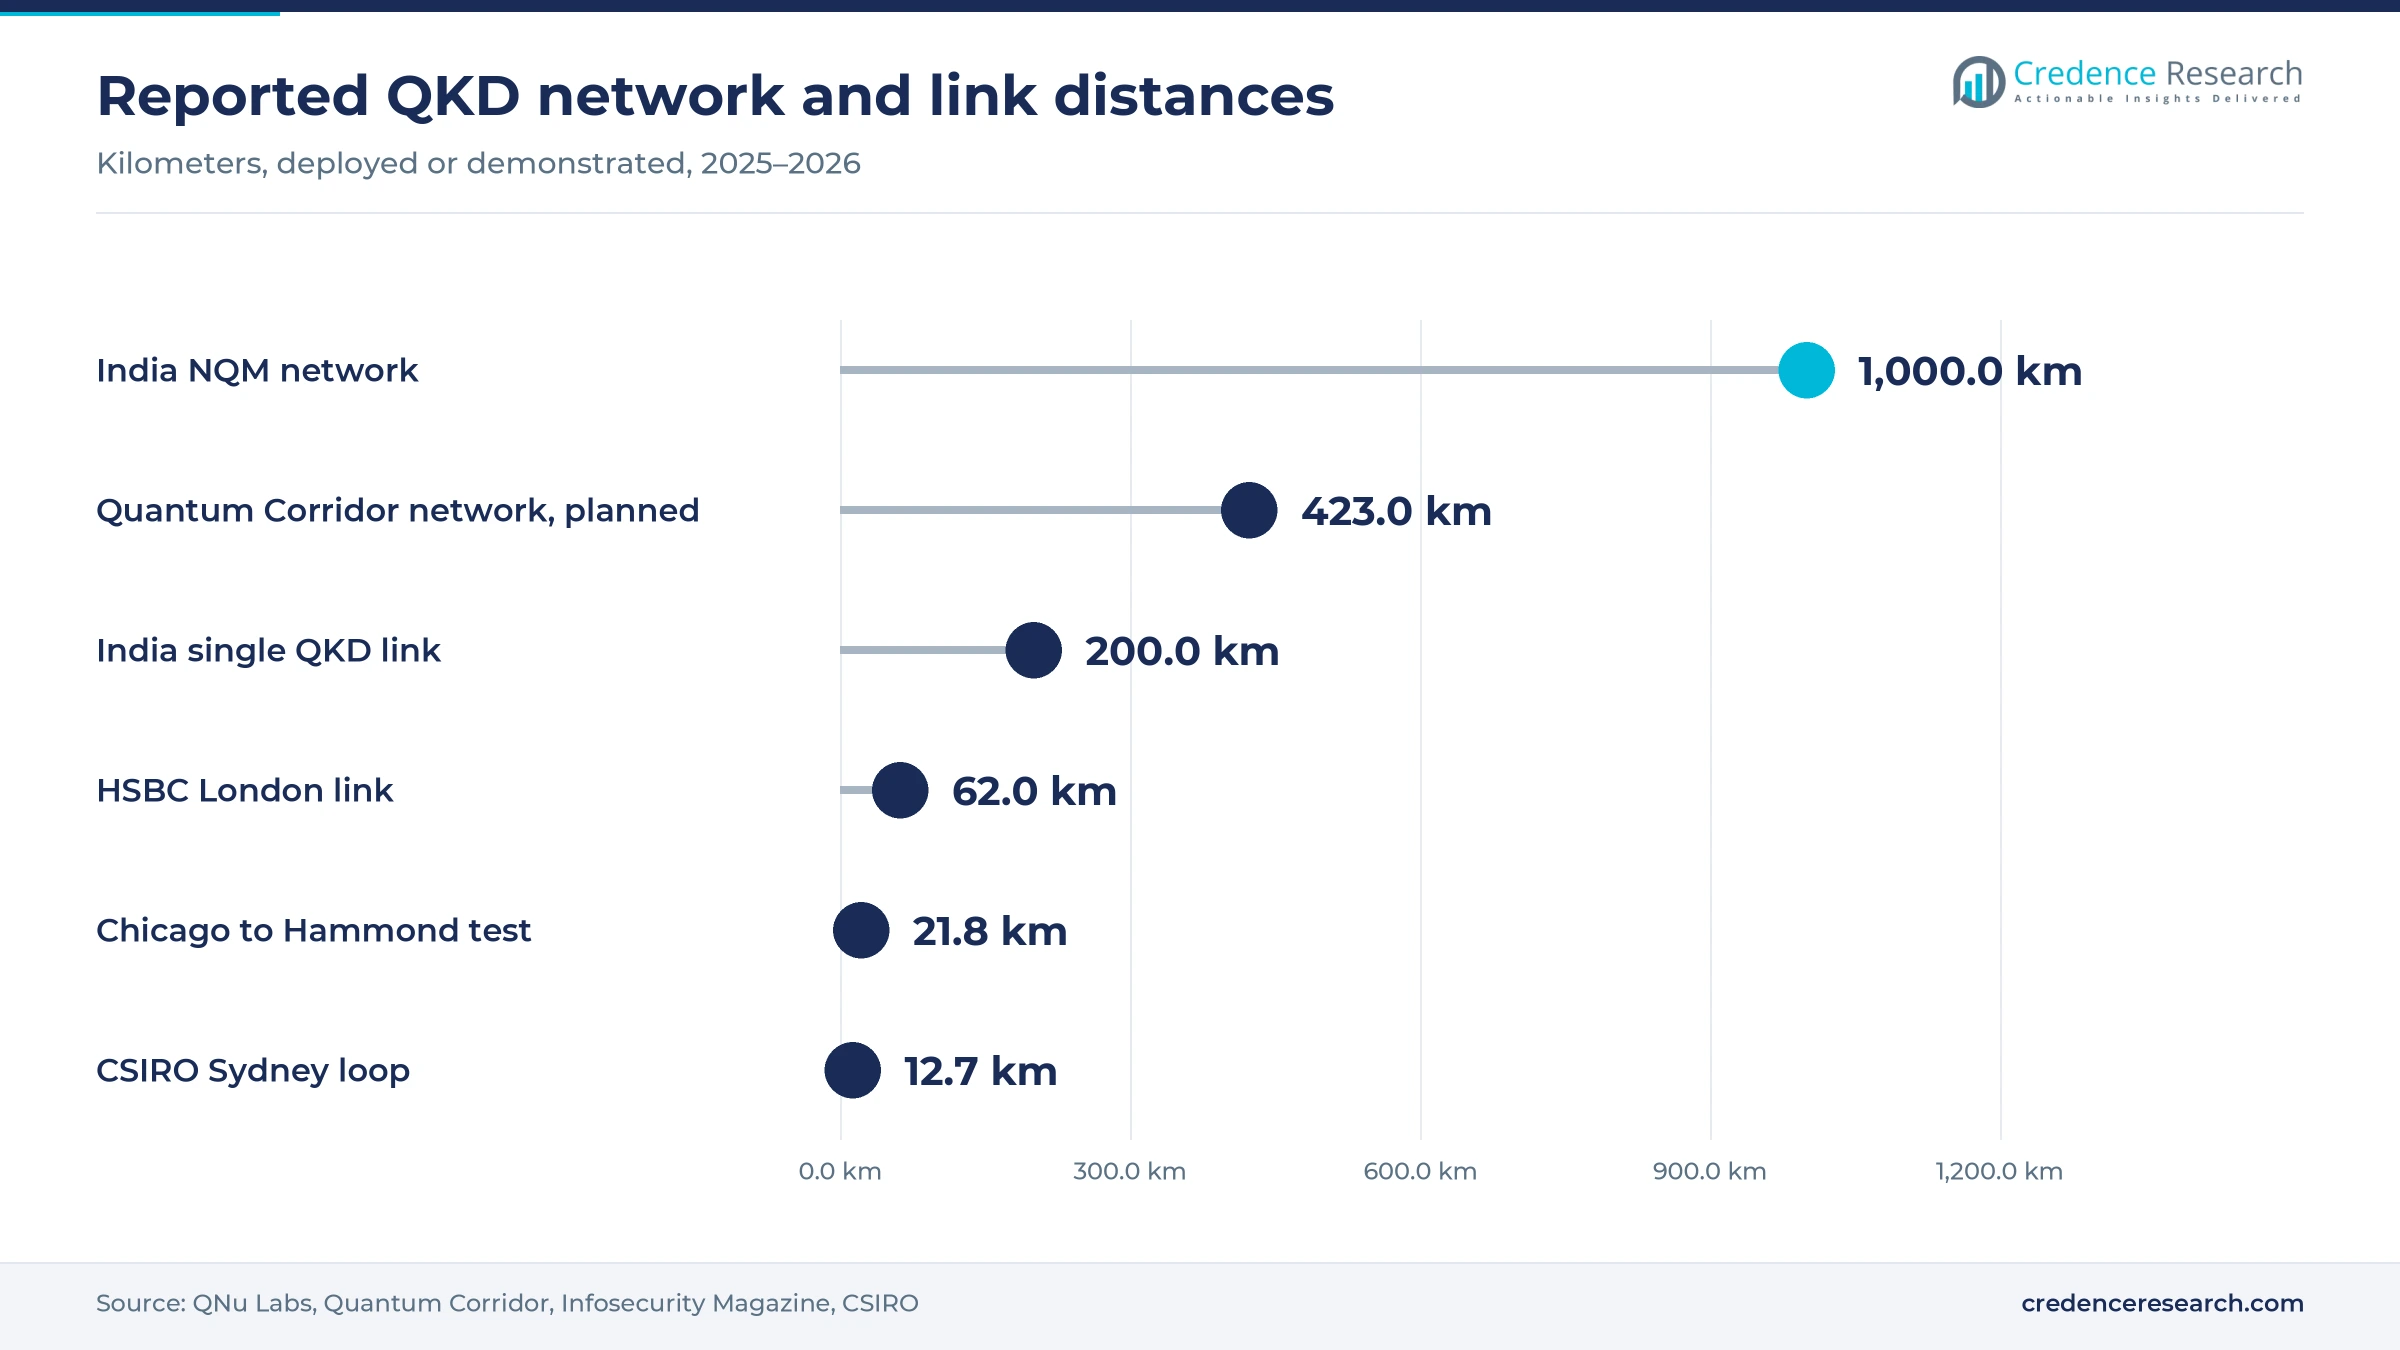
Governments are funding QKD as shared infrastructure for ministries and state companies, which converts one-off pilots into multi-year orders for links, nodes and key managers. China Telecom said in May 2025 that its quantum backbone spans 16 cities, including Hefei, Beijing, Shanghai and Guangzhou, through metro networks that protect government, finance and energy users, China Daily reported. India's National Quantum Mission acknowledged a 1,000 km network built on existing fiber with QNu Labs technology on April 8, 2026, half of its 2,000 km goal, according to QNu Labs. That pattern keeps government and defense at 41.0% of 2025 value. Vendors with certified hardware and local manufacturing win these programs, while foreign suppliers face sovereignty rules.
Europe builds a sovereign quantum communication layer
The European Union treats QKD as part of its secure communication stack, which gives suppliers a funded pipeline across all member states. ESA and the European Commission signed the EuroQCI agreement on Jan. 30, 2025, with ESA as contracting, design and qualification authority, and the network will be integrated into the IRIS² satellite constellation. The Commission's Quantum Europe Strategy of July 2, 2025, said a quantum act proposal is expected in 2026. Deutsche Telekom said on July 14, 2026, that it leads PETRUS2, a Connecting Europe Facility project with Thales, AIT, Airbus and SES that prepares cross-border QKD infrastructure. European vendors gain preferred access to these tenders, while non-EU suppliers face sovereignty screening.
Operators package QKD as a managed security service
Telecom operators are turning QKD into a service they sell by site, which lets banks and agencies buy protection without owning optical hardware. Singtel launched Singapore's National Quantum-Safe Network Plus in August 2024 after the Infocomm Media Development Authority appointed it in 2023. China Telecom also sells quantum-encrypted calling and SIM services to consumers and industry customers, although most of that base uses services beyond QKD. KT said on Feb. 9, 2026, that its in-house system generates 300,000 keys a second, enough to supply more than 70,000 encryption devices with fresh keys every minute. Operators gain recurring revenue, while hardware vendors become suppliers to a few large carriers.
Data center links prove QKD on commercial fiber
Data center and financial links show that QKD can run on carrier fiber without service loss, which reduces the perceived risk for enterprise buyers. Quantum Corridor and Toshiba reported a 21.8 km link between Chicago and Hammond, Indiana, with an average secure key rate of 1,500 kbps and fresh keys every 90 seconds, with zero packet loss over 48 hours of encrypted traffic. HSBC became the first bank on the BT and Toshiba metro network in London, linking Canary Wharf with a Berkshire data center about 62 km away, according to Infosecurity Magazine. These results favor vendors already validated with carriers, because enterprise buyers now ask for live-network references before ordering.
Hybrid keys and satellites reshape QKD network design
Hybrid QKD and post-quantum keys become the default design
Network operators are shifting toward hybrid designs that mix QKD keys with post-quantum algorithms to address agency guidance and long distances, creating openings for key management software across telecom and government networks. NIST published its first three finalized post-quantum encryption standards on Aug. 13, 2024, giving buyers an approved software layer to pair with QKD. China Telecom Quantum Group unveiled a hybrid QKD and post-quantum system in May 2025 and completed a cross-province encrypted voice call of more than 1,000 km, China Daily reported. Suppliers that sell only standalone QKD boxes lose ground, because buyers now expect one key manager to handle both sources.
Satellites emerge to carry keys between continents
QKD programs are shifting toward satellites to address the distance limit of fiber, creating openings for optical ground stations and space payloads across government and intercontinental links. The Jinan-1 microsatellite linked China and South Africa over 12,900 km, and the Stellenbosch ground station generated 1.07 million secure bits in one pass, according to results published in Nature on March 19, 2025. ESA also plans SAGA, a mission to demonstrate and validate space-based quantum technologies in orbit, alongside EuroQCI. Satellite-Based QKD grows at 23.7% a year from a small base, and suppliers of optical satellite communication terminals are best placed.
Interoperable and certified equipment opens multi-vendor networks
National networks that mix vendors form a clear opening, because certified and interoperable equipment lets operators avoid single-supplier lock-in. ETSI released GS QKD 016 in April 2023, a Common Criteria protection profile for pairs of QKD modules developed with support from Germany's BSI. Toshiba Europe and Quantum Bridge Technologies sent quantum-safe data between Cambridge, U.K., and Toronto through Telehouse facilities using the draft ETSI GS QKD 020 key management interface, TelecomTV reported in March 2026. AIT coordinates HarmoniQCI, an EU project on standards and interoperability announced on July 14, 2026, alongside PETRUS2. Vendors that certify their modules first can supply several national segments planned under EuroQCI at once.
Continuous-variable QKD gives smaller markets a cheaper entry
Continuous-variable QKD, which uses standard telecom components, offers an opening for countries and operators that want sovereign suppliers at lower hardware cost. CSIRO said in October 2025 that QuintessenceLabs ran its qOptica system over a 12.7 km AARNet fiber loop in Sydney with strong key rates. LuxQuanta, a Spanish continuous-variable supplier, closed an EUR 8 million Series A round with the EIC Fund and Corning among its investors, Optics.org reported on Oct. 21, 2025. India's National Quantum Mission raised the number of startups it supports from eight to 17 in April 2026, according to QNu Labs, widening the pool of domestic suppliers. National carriers and research networks in these markets gain local suppliers with lower hardware costs.
Agency doubts, dark fiber and delays slow adoption
Security agencies recommend post-quantum software first
Western security agencies question QKD as a primary defense against quantum computers. The NSA says it does not recommend the use of QKD to protect national security systems unless its limitations are overcome, and the U.K. NCSC, in a paper published on Aug. 5, 2025, recommends post-quantum cryptography as the primary mitigation. Vendors selling to U.S. and U.K. federal buyers are most exposed, because defense procurement follows these agencies. Suppliers respond by selling the hybrid systems described under trends, which add QKD on top of standard post-quantum algorithms.
Dedicated dark fiber raises the cost of each link
Many QKD systems still need their own fiber strand, which raises leased-line costs. Toshiba says its Flexible QKD System LE, its most affordable model and a 3U unit for 19-inch racks, needs one dedicated dark fiber for the quantum channel, plus three service channels that can share existing fiber. Enterprises in cities with scarce fiber-optic cables and rural sites are most exposed, and they delay orders until lit-fiber multiplexing products become proven.
Satellite program delays push out space QKD revenue
Space QKD depends on a few public satellites, so one slip delays a whole supply chain. ESA said in January 2025 that Eagle-1 was scheduled for launch in 2026, yet Space Intel Report said on June 2, 2026, that the satellite will not launch before late 2027 or early 2028 after payload delays. Ground station builders and payload suppliers are most exposed, because their orders follow launch dates, and buyers needing cross-border keys must rely on fiber until then.
Consolidation narrows the pool of independent suppliers
Large buyers of QKD now face fewer independent vendors after a series of acquisitions. IonQ completed its purchase of Qubitekk in January 2025 and took a controlling stake in ID Quantique in May 2025, adding nearly 300 granted and pending patents. China Telecom took control of QuantumCTek in 2024, bringing China's main QKD equipment maker inside its largest QKD operator. Operators that need second sources are most exposed, because state buyers often prefer domestic suppliers, which limits price competition.
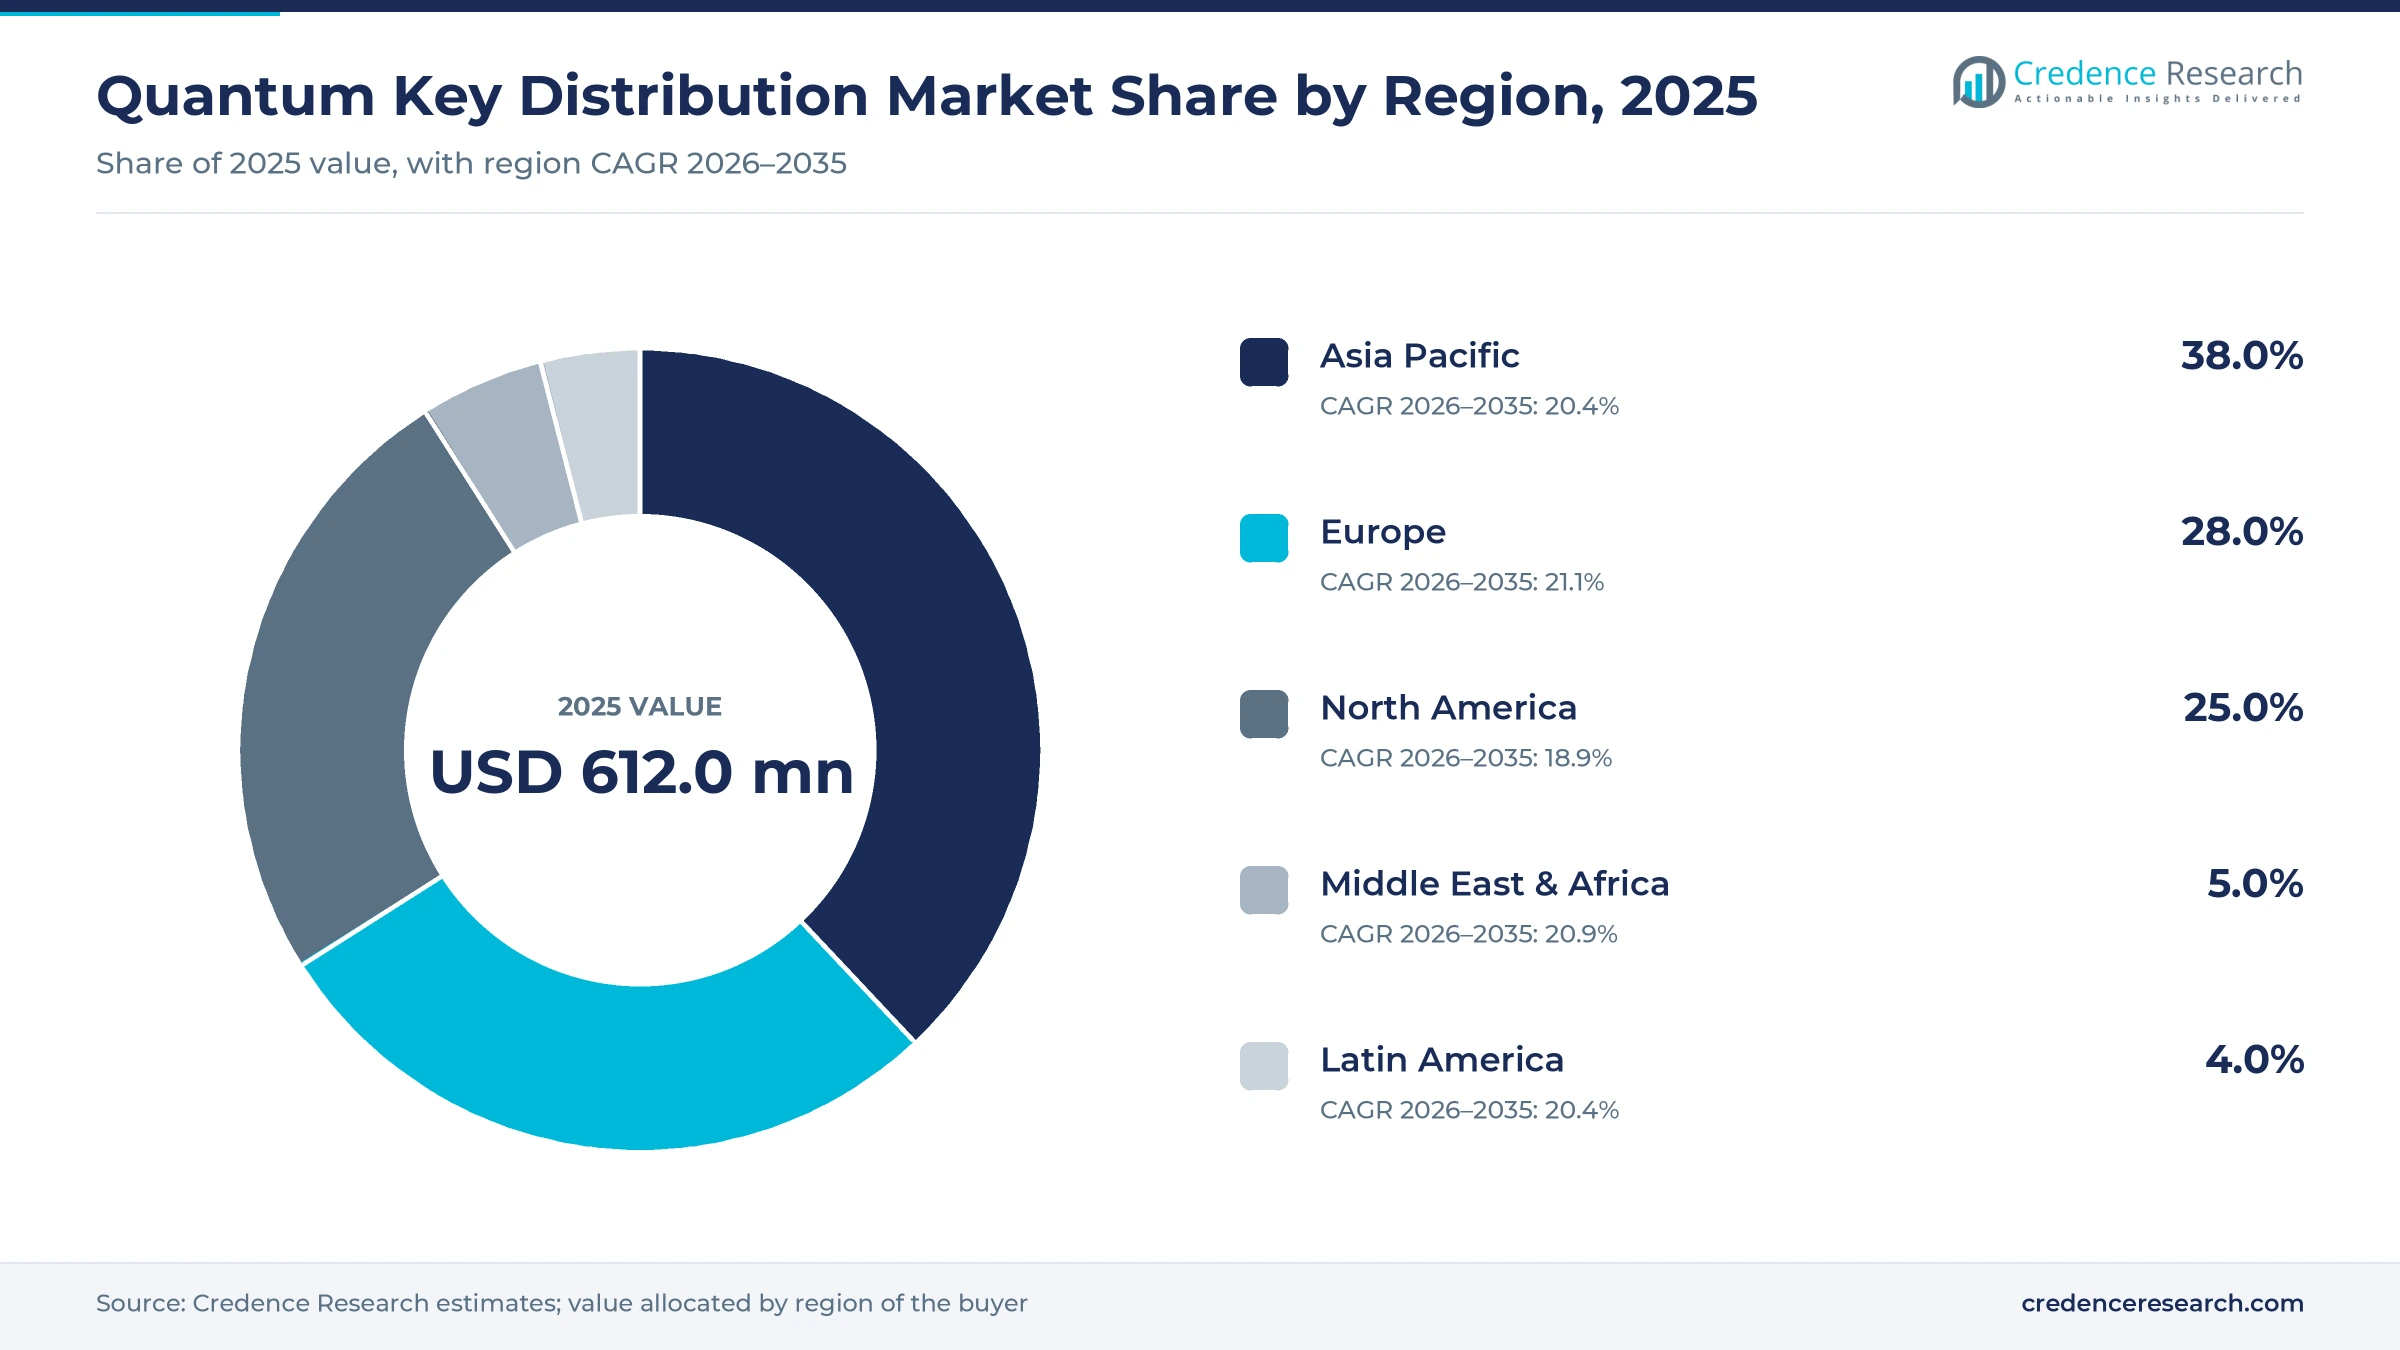
Asia Pacific leads while Europe grows fastest
| Region | Value, 2025 (USD million) | Share, 2025 | CAGR, 2026–2035 |
|---|---|---|---|
| Asia Pacific | 232.6 | 38.0% | 20.4% |
| Europe | 171.4 | 28.0% | 21.1% |
| North America | 153.0 | 25.0% | 18.9% |
| Middle East & Africa | 30.6 | 5.0% | 20.9% |
| Latin America | 24.5 | 4.0% | 20.4% |
Asia Pacific leads on Chinese and Korean state networks
Asia Pacific held 38.0% of 2025 value and grows at 20.4% a year. China accounts for most of it, as the 16-city backbone and the hybrid system described above show, and QuantumCTek, now controlled by China Telecom, supplies much of the domestic equipment. South Korea adds operator demand from KT and SK Broadband, while Singapore appointed SPTel and SpeQtral to build part of its national quantum-safe network. India and Australia add sovereign programs, so regional demand is spread across several state buyers.
Europe grows fastest on EuroQCI national segments
Europe held 28.0% of 2025 value and grows fastest at 21.1% a year. The EuroQCI agreement and PETRUS2 noted above fund national terrestrial segments, and Toshiba Europe, ID Quantique and LuxQuanta supply much of the hardware. BT, Colt and Deutsche Telekom test QKD on live networks, which gives vendors real carrier references. Program delays, such as the Eagle-1 slip, are the main risk to this growth rate, because most European demand still comes through public programs.
North America grows slowest as agencies favor post-quantum
North America held 25.0% of 2025 value and grows at 18.9% a year, the slowest regional rate. Federal demand stays limited by the NSA position described above, so commercial carriers and research hubs lead. EPB and IonQ announced a USD 22 million partnership on April 25, 2025, to build a quantum computing and networking hub in Chattanooga, Tennessee, on top of the EPB Quantum Network. The Quantum Corridor tests in Chicago show that carriers can carry QKD on commercial fiber.
Middle East and Africa gain from satellite ground stations
The Middle East and Africa held 5.0% of 2025 value and grow at 20.9% a year. Stellenbosch University in South Africa hosted the ground station for the Jinan-1 link noted above, which places the region in early satellite QKD research. No verified commercial QKD orders in the Gulf or elsewhere in the region were found for this edition, so the estimate relies on Credence Research modeling of research and security budgets.
Latin America remains at the pilot stage
Latin America held 4.0% of 2025 value and grows at 20.4% a year. No national QKD network or carrier service was verified in the region for this edition, so the value comes from research links and banking pilots and rests on Credence Research estimates. Buyers in Brazil and Mexico mainly follow the hybrid post-quantum route, because QKD hardware and dedicated fiber cost more than software upgrades.
Acquisitions, hybrid launches and EU projects mark 2025-26
| Development | Status and market relevance |
|---|---|
| In May 2025, IonQ completed its acquisition of a controlling stake in ID Quantique. | Completed acquisition; it joins the largest Western QKD hardware vendor with a quantum computing company and its patents. |
| In May 2025, China Telecom Quantum Group unveiled a hybrid QKD and post-quantum cryptography system for commercial use. | Commercial launch after a 1,000 km test call; it sets the hybrid model that Chinese state buyers now procure. |
| In February 2026, KT said it had developed its own QKD system generating 300,000 keys a second. | Testing milestone, verified with TTA, ETRI and NIA in late 2025; deployment is planned but not dated. |
| In July 2026, Deutsche Telekom announced that it leads PETRUS2, an EU project preparing cross-border QKD infrastructure. | Project award under the Connecting Europe Facility; it coordinates national EuroQCI segments rather than buying hardware. |
| In October 2026, Toshiba launched its Quantum-Safe Networking platform for hybrid QKD and post-quantum keys over lit fiber. | Product launch with a demonstration alongside SpeQtral and HPE; it targets operators that cannot lease dark fiber. |
Photon detectors, key managers and trusted nodes
- Discrete-variable QKD sends single photons and uses single-photon detectors, the approach used in most commercial fiber systems today, with key rates that fall as fiber loss rises.
- Continuous-variable QKD encodes keys in the amplitude and phase of light, using coherent telecom receivers that can lower hardware cost and ease integration with operator equipment.
- Key management systems store and deliver keys to encryptors and hardware security modules, and they now accept post-quantum keys too.
- Trusted nodes and relays link short QKD spans into backbones, which extends reach across cities and countries but requires each node to be physically secured by the operator.
Need a Custom Version of This Report?
Tailor the scope, geography, or segments to your exact requirements.
- Custom geography or segment scope
- Direct access to our analyst team
Hardware specialists and state operators compete
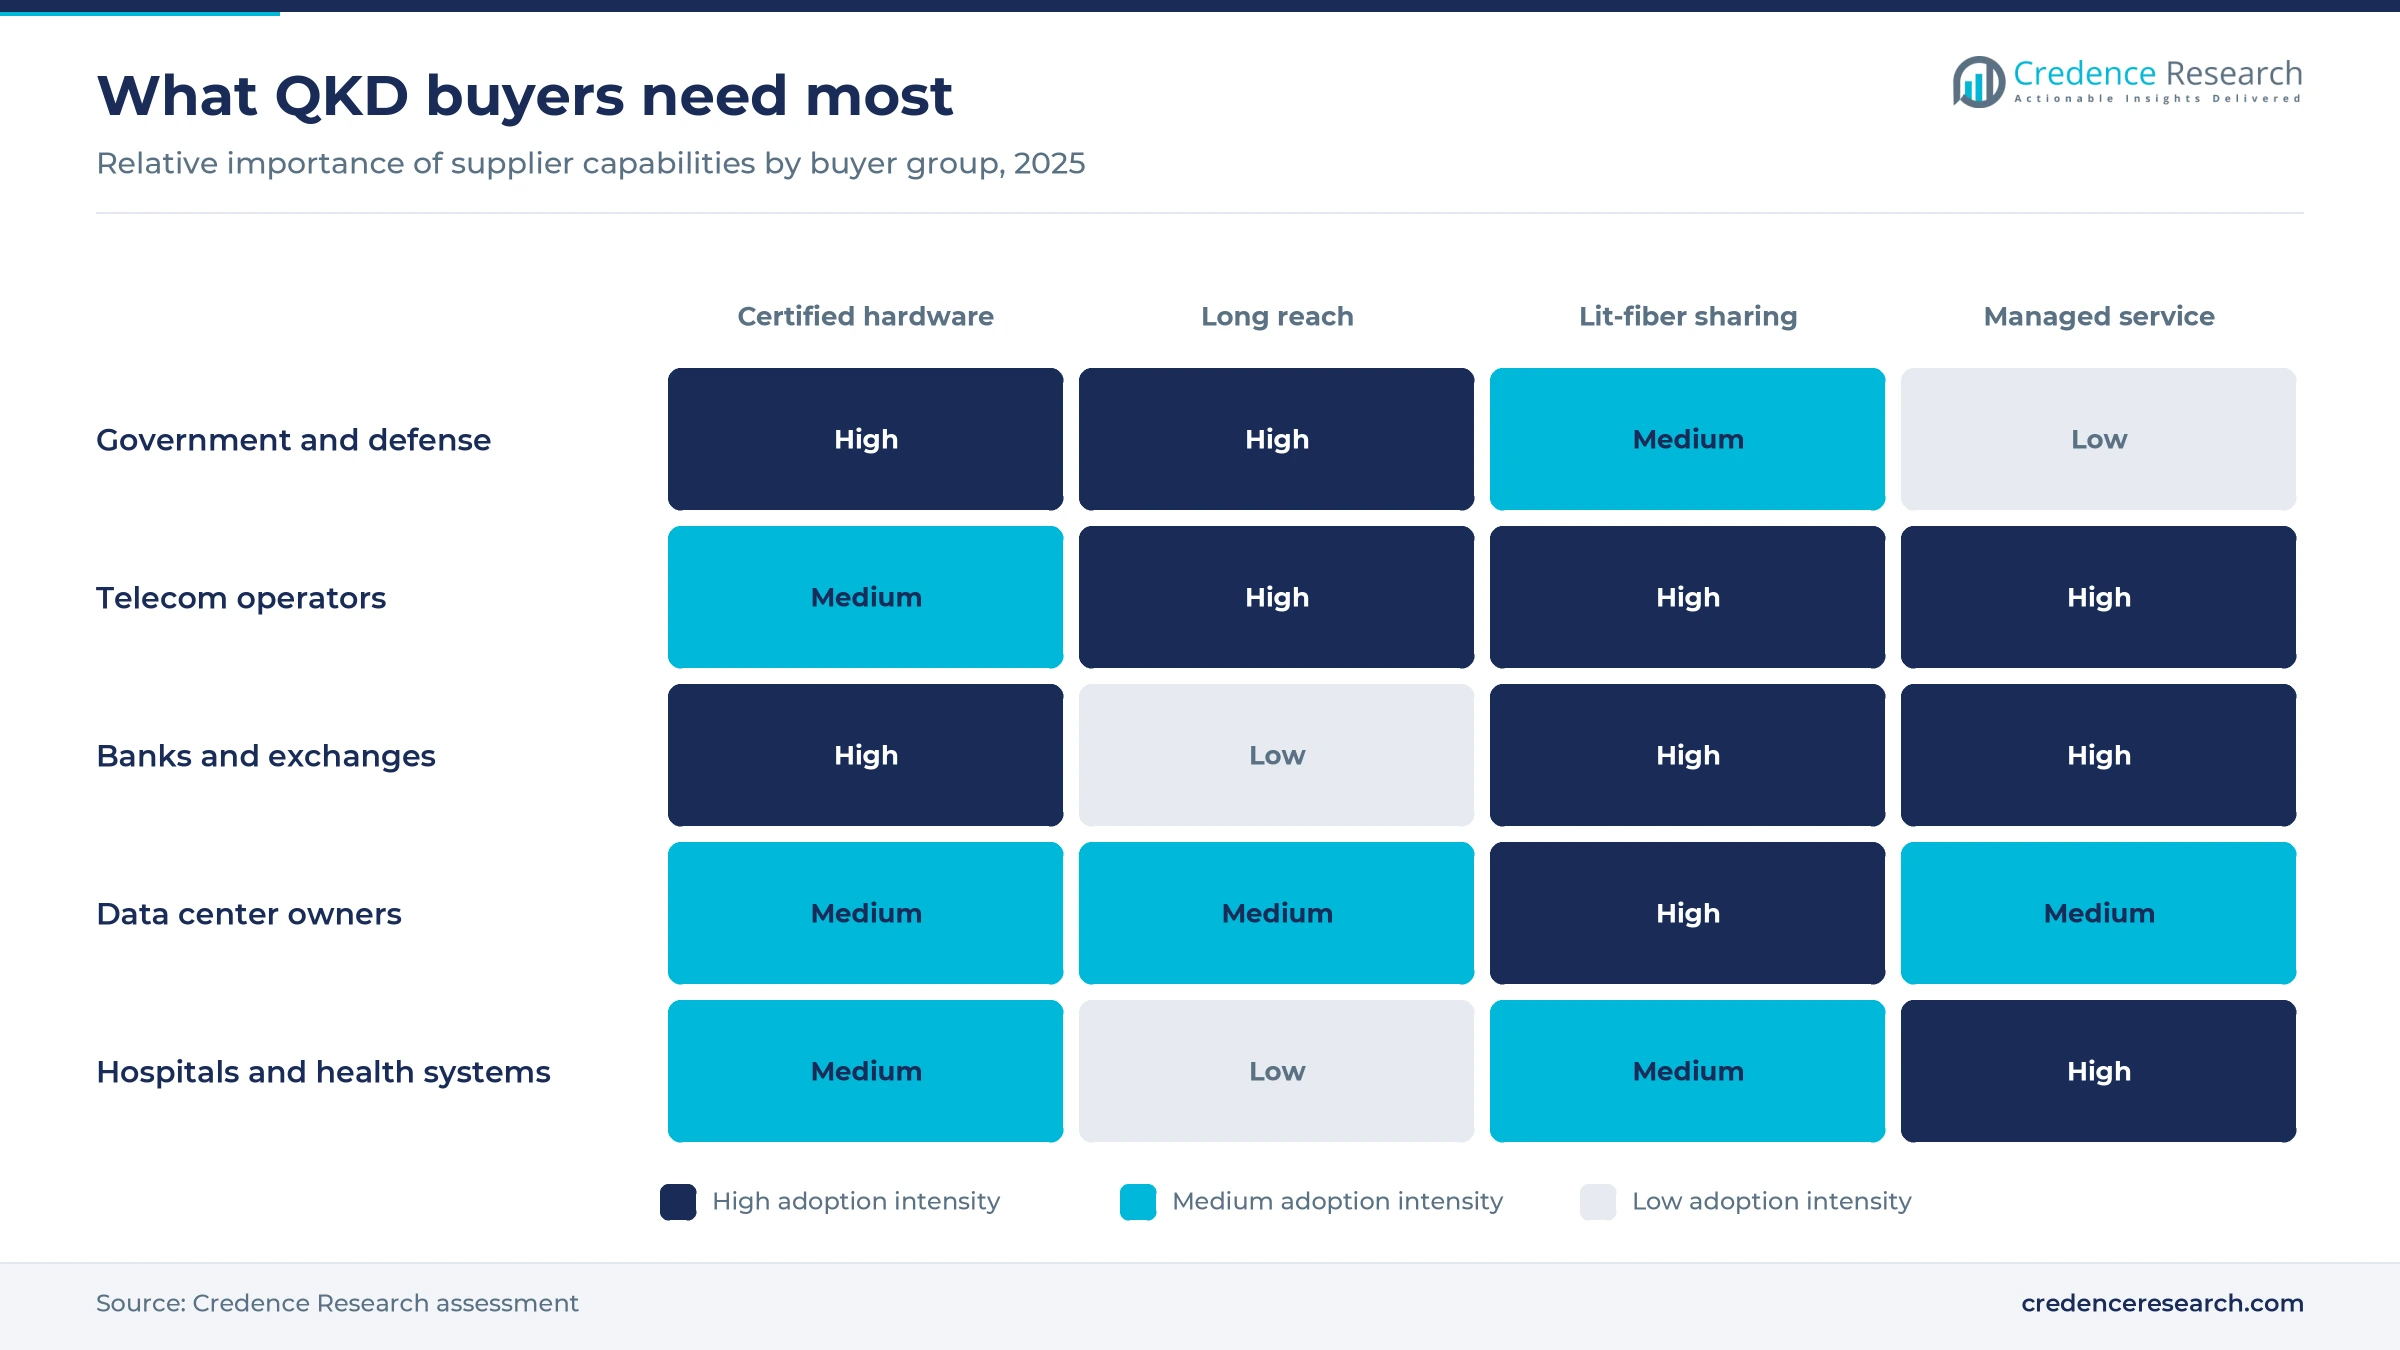
Competition runs on three factors, certified hardware that agencies accept, distance and key rate on real fiber, and integration with the encryptors and software that carry customer data. Toshiba and ID Quantique, now part of IonQ, lead outside China, while QuantumCTek supplies Chinese state networks under China Telecom ownership. QuintessenceLabs and LuxQuanta compete with continuous-variable systems, and QNu Labs serves Indian programs. KT builds its own systems, and operators decide which vendors reach end users. Nokia integrates QKD keys into optical transport and encryption software layers. SES and SpeQtral are positioning for satellite links once Eagle-1 and other payloads reach orbit. Hardware specialists win on key rate and certification, while operators win on reach, billing relationships and multi-year service contracts. Chinese and Western supply chains rarely compete for the same tender, because state buyers on both sides restrict foreign cryptographic hardware.
How the QKD supply side is organized
Supply sits in four layers with different assets and margins. Hardware specialists such as Toshiba, ID Quantique inside IonQ, QuantumCTek, QuintessenceLabs, LuxQuanta and QNu Labs build the optical systems and key managers. Operators such as China Telecom, Singtel, KT, SK Broadband, BT and Colt run the links and sell them as services. Satellite players SES and SpeQtral serve long-distance demand, while Nokia and Ciena supply the encryptors that use the keys. The market is concentrated, certification is a strong entry barrier, and margins sit in hardware and key management software.
Companies profiled and their roles in this market
| Company | Type | Role in the market |
|---|---|---|
| Toshiba Corporation | QKD hardware specialist | Multiplexed and long-distance QKD systems and the QSN platform |
| ID Quantique (IonQ) | QKD hardware specialist | ID Quantique QKD systems and Qubitekk networking products |
| QuantumCTek Co., Ltd. (China Telecom) | QKD hardware specialist | QKD equipment for Chinese state and operator networks |
| QuintessenceLabs | CV-QKD specialist | qOptica continuous-variable QKD system |
| LuxQuanta | CV-QKD specialist | Continuous-variable QKD systems for operators |
| QNu Labs | QKD hardware specialist | ARMOS QKD platform for Indian national networks |
| KT Corporation | Operator and developer | In-house QKD system and Korean quantum network services |
| SK Broadband (SK Telecom) | Operator | QKD network services for Korean public and enterprise users |
| Nokia Corporation | Optical transport partner | Optical encryption that consumes QKD keys, satellite QKD trials |
| SpeQtral | Satellite and network provider | Singapore quantum-safe network builder and satellite QKD |
| SES S.A. | Satellite operator | Leads the Eagle-1 QKD satellite consortium |
QKD wins where states fund it and PQC is not enough
Credence Research's view is that QKD wins where states fund it and post-quantum software alone is not judged enough. China, Korea, Singapore, India and the EU now treat quantum key exchange as public infrastructure, while U.S. and U.K. agencies prefer software, which splits the market by geography. Hybrid designs that feed both key types into one manager are the practical bridge. Vendors with certified hardware, carrier references and lit-fiber products are best placed, while standalone boxes face price pressure.
Vendor disclosures and program budgets anchor the estimate
The report uses 2025 as the base year and 2026 to 2035 as the forecast period. Market values come from the Credence Research model, which replaces the earlier estimate on this page after checking it against listed vendor disclosures and public program budgets. Regional and segment splits are Credence Research estimates built from vendor, operator and program data. Sources include ESA, the European Commission, the NSA, the U.K. NCSC, NIST, ETSI, company releases and news reports. The 20.25% forecast CAGR is lower than many published views, because U.S. and U.K. agency guidance limits federal demand and satellite programs such as Eagle-1 have slipped. No interviews or surveys were conducted for this edition of the quantum key distribution report. No official statistic measures QKD sales, and the largest vendors do not report QKD revenue separately, so the base value carries the most uncertainty.
Hybrid networks carry QKD growth to 2035
Through 2035, QKD should grow from state-funded backbones into carrier services sold to banks, data centers and critical infrastructure. Hybrid designs will become standard, so QKD will rarely be bought without post-quantum software. Lit-fiber products should reduce the cost of each site, while satellites extend keys across borders once programs such as Eagle-1 launch. Asia Pacific keeps the largest share, and Europe gains as national segments are procured, while North America stays tied to agency guidance.
Agency guidance and state budgets decide the range to 2035
The outcome depends on two variables, whether security agencies accept QKD inside hybrid designs and how fast state programs move from pilots to procurement. The downside case assumes agencies keep recommending post-quantum software alone and satellite programs slip further. The upside case assumes EuroQCI and Asian national networks buy at scale and lit-fiber products cut link costs. The base case sits between them, with steady state spending and gradual carrier uptake.
| Scenario | CAGR, 2026–2035 | Value, 2035 | What has to hold |
|---|---|---|---|
| Downside | 16.2% | USD 2.85 billion | Agencies keep favoring post-quantum software and satellite programs slip again |
| Base | 20.25% | USD 3.87 billion | State networks expand steadily and hybrid designs spread among carriers |
| Upside | 24.2% | USD 5.19 billion | EuroQCI and Asian national networks buy at scale as lit-fiber links cut costs |
Frequently Asked Questions
How big is the quantum key distribution market?
Which are the leading quantum key distribution companies?
Which QKD companies are publicly listed?
What QKD products and devices do buyers purchase?
How does QKD differ from post-quantum cryptography?
Which region leads the QKD market?
Why does QKD need trusted nodes?
How much does a QKD link cost?
Table of Content
Chapter 1 Market Segmentation
- 1.1 Segmentation Framework
- 1.1.1 Product and Service Classification
- 1.1.2 Application and End-Use Classification
- 1.1.3 Technology and Solution Classification
- 1.1.4 Customer and Distribution Channel Classification
- 1.1.5 Geographic Segmentation
- 1.1.6 Market Segment Definitions and Boundaries
- 1.2 By Type
- 1.2.1 Multiplexed Systems
- 1.2.2 Long Distance Systems
- 1.3 By Application
- 1.3.1 Telecom and Data Center
- 1.3.2 Financial Services Companies
- 1.3.3 Government & Defense
- 1.3.4 Healthcare
- 1.3.5 Others
- 1.4 By Transmission Medium
- 1.4.1 Fiber-Based
- 1.4.2 Satellite-Based
Chapter 2 Introduction
- 2.1 Report Objectives and Scope
- 2.2 Product Definition and Industry Terminology
- 2.3 Market Inclusions and Exclusions
- 2.4 Research Process
- 2.4.1 Primary Research and Expert Interviews
- 2.4.2 Secondary Research and Source Review
- 2.4.3 Top-Down and Bottom-Up Estimation
- 2.4.4 Data Triangulation and Verification
- 2.5 Market Size Measurement Basis
- 2.5.1 2025: USD 612.0 million → 2035: USD 3.87 billion
- 2.6 Historical and Forecast Reference Periods
- 2.6.1 Historical Period: 2018-2025
- 2.6.2 Base Year: 2025
- 2.6.3 Forecast Period: 2025-2035
- 2.7 Research Assumptions and Limitations
Chapter 3 Executive Summary
- 3.1 Market Snapshot and Key Findings
- 3.2 Base-Year Market Size, 2025
- 3.3 Forecast Market Size, 2035
- 3.4 Revenue and Volume Growth Outlook
- 3.5 Key Demand and Supply Indicators
- 3.6 Leading Market Segments
- 3.7 Fastest-Growing Market Opportunities
- 3.8 Regional Performance Highlights
- 3.9 Technology and Industry Transformation
- 3.10 Competitive Landscape Summary
- 3.11 Analyst View and Strategic Implications
Chapter 4 Global Quantum Key Distribution Market Trends and Developments
- 4.1 Historical Industry Development, 2018-2025
- 4.2 Recent Market Trends and Developments
- 4.3 Demand and Customer Behavior Trends
- 4.4 Technology and Product Innovation
- 4.5 Artificial Intelligence, Automation and Digitalization
- 4.6 Local Manufacturing and Supply Chain Realignment
- 4.7 Industry Partnerships, Mergers and Acquisitions
- 4.8 Sustainability and Circular Economy Developments
- 4.9 Government and Private Sector Investment Trends
- 4.10 Emerging Business Models and Commercialization
- 4.11 Industry Developments and Announcements
Chapter 5 Global Quantum Key Distribution Market Production, Supply and Demand Analysis
- 5.1 Demand Trend and Consumption Analysis, 2018-2025
- 5.2 Demand Forecast, 2025-2035
- 5.3 Production and Output Trend, 2018-2025
- 5.4 Production and Output Forecast, 2025-2035
- 5.5 Installed Capacity and Capacity Utilization
- 5.6 Company-Wise Production Plants and Statistics
- 5.6.1 Installed Production Capacity
- 5.6.2 Actual Production
- 5.6.3 Planned Capacity and Expansion Targets
- 5.7 Supply Chain Structure and Procurement Trends
- 5.8 Supply-Demand Gap and Bottlenecks
- 5.9 Import Dependence and Sourcing Structure
- 5.10 Contract Manufacturing and Outsourcing
- 5.11 Regional Supply and Demand Concentration
Chapter 6 Global Quantum Key Distribution Market Pricing Analysis
- 6.1 Pricing Structure and Measurement
- 6.2 Historical Pricing Trends, 2018-2025
- 6.3 Pricing Outlook, 2025-2035
- 6.4 Average Selling Price and Unit Economics
- 6.5 Pricing by Product and Market Segment
- 6.6 Geographic Pricing Differences
- 6.7 Key Input, Energy, Labor and Logistics Costs
- 6.8 Contract Pricing and Purchasing Models
- 6.9 Pricing Sensitivity and Competitive Positioning
- 6.10 Price, Margin and Profitability Implications
Chapter 7 Global Quantum Key Distribution Market Dynamics
- 7.1 Market Growth Drivers
- 7.1.1 Demand-Side Drivers
- 7.1.2 Technology and Innovation Drivers
- 7.1.3 Infrastructure and Investment Drivers
- 7.1.4 Regulatory and Policy Drivers
- 7.2 Market Restraints
- 7.2.1 Cost and Affordability Constraints
- 7.2.2 Technology and Adoption Barriers
- 7.2.3 Supply Chain and Operational Constraints
- 7.3 Market Challenges
- 7.3.1 Competitive Pressure and Margin Erosion
- 7.3.2 Skills, Infrastructure and Implementation Gaps
- 7.4 Emerging Market Opportunities
- 7.5 Market Dynamics Impact and Time-Horizon Assessment
Chapter 8 Global Quantum Key Distribution Value Chain Analysis
- 8.1 Industry Value Chain Overview
- 8.2 Upstream Suppliers and Critical Inputs
- 8.3 Technology and Component Providers
- 8.4 Manufacturing or Service Delivery
- 8.5 Distribution, Channel Partners and Integrators
- 8.6 Downstream Applications and End Users
- 8.7 Value Addition and Profit Pools
- 8.8 Vertical Integration and Outsourcing
- 8.9 Supplier Concentration and Risk
- 8.10 Supply Chain Localization and Resilience
Chapter 9 Global Quantum Key Distribution Market Regulations and Policies
- 9.1 Relevant Laws, Standards and Compliance Frameworks
- 9.2 Product, Service, Safety and Quality Requirements
- 9.3 Government Policies, Incentives and Subsidies
- 9.4 Imports, Exports and Trade Barriers
- 9.5 Public Procurement and Local Content Requirements
- 9.6 Environmental and Sustainability Compliance
- 9.7 Upcoming Policy Changes and Market Implications
Chapter 10 Global Quantum Key Distribution Market Hotspots and Opportunities
- 10.1 Market Opportunity Mapping and Growth Hotspots
- 10.2 High-Growth Applications and Customer Groups
- 10.3 Underserved Markets and White-Space Opportunities
- 10.4 Emerging Technology and Product Opportunities
- 10.5 New Capacity and Investment Hotspots
- 10.6 Market Entry and Expansion Opportunities
- 10.7 Distribution and Partnership Opportunities
- 10.8 Near-Term and Long-Term Commercial Potential
- 10.9 Opportunity Attractiveness and Execution Risks
Chapter 11 Global Quantum Key Distribution Market Outlook, 2025-2035
- 11.1 Market Size and Analysis
- 11.1.1 Revenue (Market Measurement: 2025: USD 612.0 million → 2035: USD 3.87 billion)
- 11.1.2 Market Volume and Quantity Sold
- 11.1.3 Historical Market Size, 2018-2025
- 11.1.4 Base-Year Market Size, 2025
- 11.2 Market Forecast, 2025-2035
- 11.2.1 Revenue Forecast to 2035
- 11.2.2 Volume Forecast to 2035
- 11.2.3 CAGR and Year-on-Year Growth
- 11.2.4 Incremental Revenue Opportunity
- 11.3 Forecast Assumptions and Scenario Analysis
- 11.3.1 Base-Case Forecast
- 11.3.2 Optimistic and Conservative Scenarios
- 11.3.3 Technology, Pricing and Policy Sensitivities
- 11.4 Market Attractiveness and Growth Outlook
Chapter 12 Global Quantum Key Distribution Market Segmentation and Outlook
- 12.1 Segmentation Summary and Market Shares, 2025
- 12.2 Largest and Fastest-Growing Segments
- 12.3 By Type - Market Size and Forecast, 2025-2035
- 12.3.1 Segment Definition and Scope
- 12.3.2 Historical Market Size, 2018-2025
- 12.3.3 Revenue Forecast, 2025-2035
- 12.3.4 Volume Forecast, 2025-2035
- 12.3.5 Base-Year Market Share, 2025
- 12.3.6 Segment CAGR and Growth Drivers
- 12.3.7 Subsegment Market Size and Forecast
- 12.3.7.1 Multiplexed Systems
- 12.3.7.2 Long Distance Systems
- 12.3.8 Subsegment Pricing and Adoption Trends
- 12.3.9 Leading Suppliers and Competition
- 12.3.10 Regional Demand and Opportunities
- 12.4 By Application - Market Size and Forecast, 2025-2035
- 12.4.1 Segment Definition and Scope
- 12.4.2 Historical Market Size, 2018-2025
- 12.4.3 Revenue Forecast, 2025-2035
- 12.4.4 Volume Forecast, 2025-2035
- 12.4.5 Base-Year Market Share, 2025
- 12.4.6 Segment CAGR and Growth Drivers
- 12.4.7 Subsegment Market Size and Forecast
- 12.4.7.1 Telecom and Data Center
- 12.4.7.2 Financial Services Companies
- 12.4.7.3 Government & Defense
- 12.4.7.4 Healthcare
- 12.4.7.5 Others
- 12.4.8 Subsegment Pricing and Adoption Trends
- 12.4.9 Leading Suppliers and Competition
- 12.4.10 Regional Demand and Opportunities
- 12.5 By Transmission Medium - Market Size and Forecast, 2025-2035
- 12.5.1 Segment Definition and Scope
- 12.5.2 Historical Market Size, 2018-2025
- 12.5.3 Revenue Forecast, 2025-2035
- 12.5.4 Volume Forecast, 2025-2035
- 12.5.5 Base-Year Market Share, 2025
- 12.5.6 Segment CAGR and Growth Drivers
- 12.5.7 Subsegment Market Size and Forecast
- 12.5.7.1 Fiber-Based
- 12.5.7.2 Satellite-Based
- 12.5.8 Subsegment Pricing and Adoption Trends
- 12.5.9 Leading Suppliers and Competition
- 12.5.10 Regional Demand and Opportunities
- 12.6 Segment Growth Comparison
- 12.7 Segment Attractiveness and Priority Matrix
Chapter 13 Global Quantum Key Distribution End-Use and Application Market Outlook
- 13.1 End-Use Industry and Customer Demand Structure
- 13.2 Leading Applications and Customer Groups
- 13.3 End-Use Market Size, Share and Forecast
- 13.4 Major End-Use Industry Deep Dives
- 13.4.1 Customer Requirements and Use Cases
- 13.4.2 Demand and Replacement Cycles
- 13.4.3 Technical and Regulatory Considerations
- 13.4.4 Purchasing and Procurement Models
- 13.4.5 Leading Vendors and Distribution Channels
- 13.4.6 Forecast and Commercial Opportunities
- 13.5 Emerging Applications and Cross-Segment Demand
- 13.6 End-Use Industry Investment Priorities
Chapter 14 Global Quantum Key Distribution Geographic Market Outlook, 2025-2035
- 14.1 Regional Market Size and Share, 2025
- 14.2 Regional Market Forecast, 2025-2035
- 14.3 Regional Pricing, Production and Demand Differences
- 14.4 North America
- 14.4.1 United States
- 14.4.2 Canada
- 14.4.3 Mexico
- 14.5 Europe
- 14.5.1 Germany
- 14.5.2 France
- 14.5.3 Italy
- 14.5.4 United Kingdom
- 14.5.5 Spain
- 14.5.6 Poland
- 14.5.7 Russia
- 14.5.8 Netherlands
- 14.5.9 Belgium
- 14.5.10 Sweden
- 14.5.11 Denmark
- 14.5.12 Norway
- 14.5.13 Rest of Europe
- 14.6 Asia Pacific
- 14.6.1 China
- 14.6.2 India
- 14.6.3 Japan
- 14.6.4 South Korea
- 14.6.5 Thailand
- 14.6.6 Indonesia
- 14.6.7 Vietnam
- 14.6.8 Malaysia
- 14.6.9 Australia
- 14.6.10 Rest of Asia Pacific
- 14.7 Latin America
- 14.7.1 Brazil
- 14.7.2 Argentina
- 14.7.3 Colombia
- 14.7.4 Chile
- 14.7.5 Rest of Latin America
- 14.8 Middle East
- 14.8.1 Saudi Arabia
- 14.8.2 United Arab Emirates
- 14.8.3 Turkey
- 14.8.4 Israel
- 14.8.5 Iran
- 14.8.6 Rest of the Middle East
- 14.9 Africa
- 14.9.1 South Africa
- 14.9.2 Egypt
- 14.9.3 Nigeria
- 14.9.4 Morocco
- 14.9.5 Rest of Africa
- 14.10 Regional Investment, Policy and Supply Chain Differences
- 14.11 Regional Competitive Landscape
- 14.12 Geographic Growth Hotspots
Chapter 15 Global Quantum Key Distribution Technology, Innovation and Sustainability Outlook
- 15.1 Technology Landscape and Maturity
- 15.2 Product, Process and Service Innovation
- 15.3 AI, Automation and Digital Tools in the Industry
- 15.4 Technology Adoption and Performance Benchmarking
- 15.5 Innovation Pipeline and R&D Investment
- 15.6 Patent and Intellectual Property Trends
- 15.7 Energy Efficiency and Resource Management
- 15.8 Sustainability, Recycling and Circularity
- 15.9 Technology Roadmap, 2025-2035
- 15.10 Risks of Obsolescence and Technology Substitution
Chapter 16 Global Quantum Key Distribution Market Key Strategic Imperatives
- 16.1 Growth and Market Entry Priorities
- 16.2 High-Return Products and Segments
- 16.3 Pricing, Profitability and Cost Optimization
- 16.4 Technology Investment and Product Differentiation
- 16.5 Supply Chain Localization and Resilience
- 16.6 Distribution and Customer Acquisition
- 16.7 Partnership, Acquisition and Capacity Strategy
- 16.8 Regional Expansion Priorities
- 16.9 Short-, Medium- and Long-Term Actions
Chapter 17 Competition Outlook
- 17.1 Industry Competition Characteristics
- 17.2 Market Structure and Concentration
- 17.3 Market Share and Competitive Positioning, 2025
- 17.4 Company-Wise Revenue and Product Benchmarking
- 17.5 Production and Service Capacity Benchmarking
- 17.6 Technology, Pricing and Differentiation
- 17.7 Regional Footprint and Distribution Strength
- 17.8 Mergers, Acquisitions and Strategic Alliances
- 17.9 New Entrants and Competitive Threats
- 17.10 Porter's Five Forces and Industry Attractiveness
- 17.11 Competitive Outlook, 2025-2035
Chapter 18 Company Profiles
- 18.1 Company Coverage and Selection Criteria
- 18.2 Toshiba Corporation
- 18.2.1 Business Description
- 18.2.2 Company Ownership and Geographic Presence
- 18.2.3 Product and Service Portfolio
- 18.2.4 Manufacturing and Operating Footprint
- 18.2.5 Production Capacity and Expansion Plans
- 18.2.6 Financial Performance and Investment
- 18.2.7 Market Share and Competitive Position
- 18.2.8 Technology and Innovation Capabilities
- 18.2.9 Strategic Alliances or Partnerships
- 18.2.10 Recent Developments
- 18.2.11 Growth Strategy and Outlook
- 18.3 ID Quantique (IonQ)
- 18.4 QuantumCTek Co., Ltd. (China Telecom)
- 18.5 QuintessenceLabs
- 18.6 LuxQuanta
- 18.7 KT Corporation
- 18.8 SK Broadband (SK Telecom)
- 18.9 Nokia Corporation
- 18.10 SpeQtral
- 18.11 QNu Labs
- 18.12 SES S.A.
- 18.13 Other Relevant Market Participants
Note: Every listed company is profiled on the structure shown under the first company. The company list is preliminary and may change based on research findings, market developments, data availability and client requirements.
Chapter 19 Disclaimer
- 19.1 Research and Forecast Disclaimer
- 19.2 Data Source and Estimation Limitations
Note: The depth of individual sections depends on data availability for this market. Volume, capacity, trade and other unit-based metrics are included where applicable.

