
Market Overview:
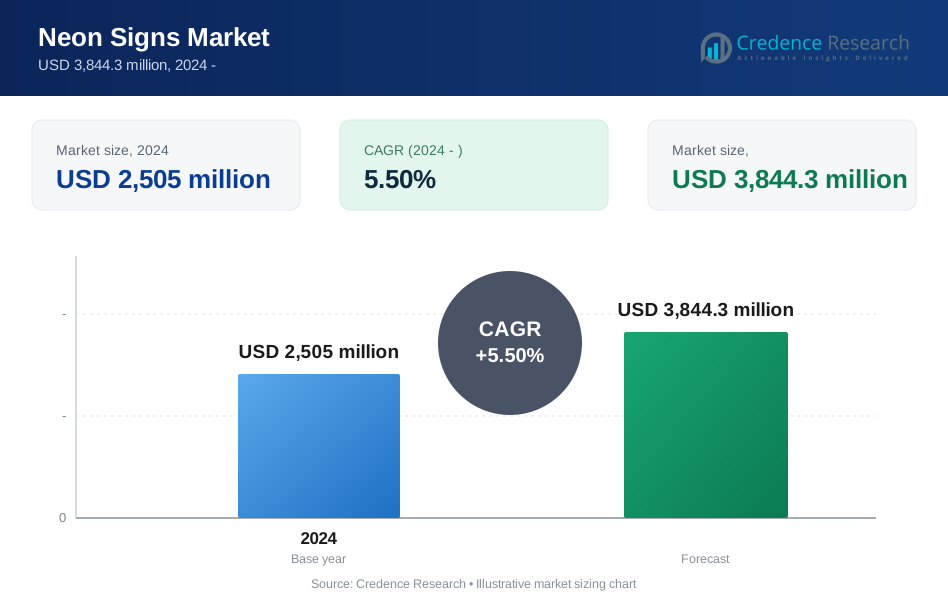
The Neon Signs Market size was valued at USD 2505 million in 2024 and is anticipated to reach USD 3844.3 million by 2032, at a CAGR of 5.5 % during the forecast period (2024-2032).
| REPORT ATTRIBUTE | DETAILS |
|---|---|
| Historical Period | 2020-2023 |
| Base Year | 2024 |
| Forecast Period | 2025-2032 |
| Neon Signs Market Size 2024 | USD 2505 million |
| Neon Signs Market, CAGR | 5.5% |
| Neon Signs Market Size 2032 | USD 3844.3 million |
Key drivers fueling the Neon Signs Market include the unique visual appeal and high customization potential of neon signage, which enables brands to stand out in crowded urban environments. Neon signs offer vibrant color options, long lifespan, and high resistance to weather conditions, making them suitable for both indoor and outdoor use. The resurgence of retro and vintage aesthetics in global branding campaigns, coupled with the growing popularity of themed restaurants, bars, and boutique stores, further accelerates demand. Innovations in energy-efficient neon lighting and advancements in flexible tubing technologies are also expanding the application scope, while manufacturers increasingly focus on sustainable and low-maintenance product offerings to align with evolving customer expectations.
Regionally, North America dominates the Neon Signs Market, accounting for the largest share due to a high concentration of retail chains, entertainment venues, and quick-service restaurants in the United States and Canada. Europe maintains a significant presence, supported by strong demand from hospitality and tourism sectors, especially in countries such as the United Kingdom, Germany, and France. The Asia-Pacific region is witnessing robust growth, driven by rapid urbanization, expanding retail infrastructure, and the rising popularity of branded experiences in countries like China, Japan, and India. Meanwhile, the Middle East & Africa and Latin America regions are emerging as promising markets, propelled by increasing commercial investments and vibrant nightlife economies.
Market Insights:
- The Neon Signs Market reached USD 2,505 million in 2024 and will grow to USD 3,844.3 million by 2032.
- High visual impact, vibrant colors, and strong customization options drive persistent demand from retail, hospitality, and entertainment sectors.
- Retro and vintage aesthetics fuel renewed interest, especially among themed restaurants, bars, and boutique stores.
- Advances in energy-efficient lighting, flexible tubing, and safer materials support eco-conscious and innovative product lines.
- Competition from digital signage and evolving consumer preferences pressures traditional neon manufacturers to innovate.
- Operational costs and regulatory compliance create barriers for new entrants and challenge smaller vendors.
- North America holds 37% of the global market, Europe 28%, and Asia-Pacific 24%, with each region benefiting from robust commercial, hospitality, and tourism activity.
Market Drivers:
Growing Demand for Eye-Catching Visual Branding and Storefront Appeal:
Retailers and commercial businesses prioritize neon signage for its ability to attract attention and boost foot traffic. The bright, colorful glow of neon signs stands out in urban environments, creating instant visibility for storefronts, bars, and entertainment venues. Companies leverage this advantage to differentiate their brands and reinforce identity, especially in competitive markets. The Neon Signs Market benefits from this persistent need for high-impact visual marketing tools. Customizable shapes, fonts, and colors enable businesses to align signage with unique branding requirements. Event organizers, pop-up shops, and hospitality providers also incorporate neon to generate buzz and improve guest engagement. The effectiveness of neon signage in boosting customer recall and creating memorable experiences underpins its enduring market demand.
- For Instance, According to a NeonPlus survey of 1,000 customers, 64% coustomers were more attracted by stores with illuminated signage, confirming the strong appeal of neon and similar lighting solutions in retail environment.
Increasing Popularity of Retro and Vintage Aesthetics in Design Trends:
Designers and marketers increasingly integrate retro and vintage themes to evoke nostalgia and capture consumer interest. Neon signage aligns seamlessly with this trend, offering an iconic aesthetic reminiscent of mid-20th-century advertising. Restaurants, cafes, and entertainment spaces adopt neon for interior decor and brand storytelling. The resurgence of these styles extends to digital campaigns, where neon-inspired visuals reinforce in-store experiences. It supports the creation of Instagrammable spaces and drives word-of-mouth promotion. Businesses across diverse sectors invest in neon signage to harness the emotional connection and cultural appeal generated by retro design trends. This aesthetic momentum fuels sustained demand across both established and emerging markets.
Advancements in Neon Sign Manufacturing and Energy Efficiency:
Technological innovation shapes the Neon Signs Market through improvements in materials, fabrication, and lighting efficiency. Manufacturers now use flexible tubing, lightweight electrodes, and safer gases, which increase design versatility and operational lifespan. Developments in energy-efficient power supplies and dimmable controls address environmental concerns and reduce operational costs. It supports broader adoption among eco-conscious businesses seeking to balance aesthetics and sustainability. Safety standards and automation in neon bending and assembly enhance product reliability and scalability. These advancements allow manufacturers to offer customized, durable, and low-maintenance neon solutions, expanding the market’s customer base.
- For Instance,LED neon signs produced by companies like Voodoo Neon consume just 150 watts for a typical medium-sized sign-up to 80% less energy than traditional neon glass signs, while converting 90% of electricity into light.
Expanding Commercial Real Estate and Urban Nightlife Infrastructure:
Urbanization and the growth of commercial districts directly impact the Neon Signs Market. Cities worldwide are investing in retail centers, entertainment corridors, and hospitality zones that rely on vibrant signage for visibility and differentiation. Nightlife economies, including clubs, music venues, and themed restaurants, prioritize neon for its visual impact and enduring cultural relevance. Real estate developers integrate neon signage into mixed-use projects and revitalization efforts to create distinctive environments. The expanding scope of outdoor advertising and event promotion further increases demand. These market dynamics position neon signage as a strategic asset for driving commercial success and fostering urban identity.
Market Trends:
Integration of Energy-Efficient Technologies and Eco-Friendly Materials in Neon Signage:
The Neon Signs Market is witnessing a shift toward energy-efficient technologies and sustainable materials. Manufacturers are adopting advanced power supplies, LED-based neon alternatives, and recyclable tubing to reduce electricity consumption and environmental impact. Businesses now prioritize neon signage that aligns with their corporate social responsibility goals, driving demand for low-voltage, mercury-free, and long-lasting products. Flexible and lightweight tubing materials improve installation options and open new possibilities for custom shapes and applications. Innovations in dimming controls and smart connectivity further enhance operational efficiency. This trend is strengthening the market’s appeal to both established brands and environmentally conscious startups.
- For instance, Neo-Neon LED Neon Flex technology uses just less the energy of traditional glass neon, with typical LED neon signs consuming 150 watts compared to 610 and 400 watts for glass neon, resulting in up to 80% greater energy efficiency.
Personalization, Digital Integration, and Social Media-Driven Aesthetics:
Customization remains a defining trend, with businesses seeking unique neon designs to reinforce brand identity and create memorable customer experiences. The Neon Signs Market benefits from digital integration, as brands increasingly use neon signage alongside interactive displays, QR codes, and dynamic content for marketing campaigns. Social media platforms amplify the visual impact of neon, turning creative installations into viral attractions and supporting user-generated content. Designers leverage augmented reality to preview neon concepts and optimize placements before production. The rise of experiential marketing encourages retail, hospitality, and entertainment venues to use neon signage for immersive environments. These trends support sustained market growth and position neon as a central element in modern visual communication strategies.
- For instance, the Philips MASTER LEDtube T8 by Signify contains 40% post-consumer recycled plastic and offers a lifespan of 100,000 hours, significantly reducing replacement frequency and environmental waste.
Market Challenges Analysis:
Competition from Digital Signage and Evolving Consumer Preferences
The Neon Signs Market faces significant competition from digital signage solutions that offer dynamic content, remote updates, and interactive capabilities. Businesses in retail, hospitality, and entertainment sectors increasingly adopt LED and LCD-based digital displays for versatility and ease of management. It creates pressure on traditional neon manufacturers to differentiate through quality, design, and customization. Consumer preferences are shifting toward integrated solutions that combine visual appeal with advanced technology. Companies must respond to evolving expectations or risk losing market share. This competitive environment challenges the sustained growth of traditional neon signage providers.
Rising Operational Costs and Regulatory Compliance Requirements
Operational costs for neon signage production are rising, driven by fluctuating raw material prices, skilled labor shortages, and higher energy expenses. The Neon Signs Market also contends with strict safety and environmental regulations regarding the use of gases and electrical components. Compliance with these standards increases manufacturing complexity and costs. Smaller vendors may struggle to keep pace with evolving requirements. These factors limit the entry of new players and affect overall profitability. Businesses must adopt efficient processes and sustainable materials to navigate these ongoing challenges.
Market Opportunities:
Expansion in Emerging Markets and Urban Development Projects
The Neon Signs Market has significant opportunities in emerging economies where rapid urbanization and infrastructure investment are transforming retail and hospitality landscapes. Cities in Asia-Pacific, Latin America, and the Middle East are witnessing a surge in commercial construction, nightlife districts, and branded environments. Businesses entering these regions seek distinctive signage to boost visibility and attract new customers. Local governments and private developers often integrate neon installations into revitalization and tourism initiatives. This expansion enables manufacturers to capture untapped demand and establish strategic partnerships. Growth in urban entertainment venues further supports long-term market opportunities.
Product Innovation and Customization for Diverse Applications
Manufacturers can leverage innovation in design, energy efficiency, and materials to offer unique value propositions across multiple sectors. The Neon Signs Market benefits when companies develop customizable solutions for events, experiential marketing, boutique stores, and residential interiors. Clients increasingly seek tailored products that reflect their brand identity and sustainability goals. Advances in flexible tubing, smart lighting controls, and recyclable components enable new product lines and applications. Collaborations with architects, designers, and digital marketers also create fresh revenue streams. This focus on creativity and customer engagement unlocks new growth avenues for established and emerging players.
Market Segmentation Analysis:
By Type:
The Neon Signs Market includes traditional neon glass tube signs and emerging LED neon alternatives. Traditional glass tube neon remains popular for its distinctive glow and retro appeal, widely favored in hospitality and entertainment venues. LED neon signs, however, are gaining traction due to energy efficiency, longer operational life, and ease of installation. Businesses seeking sustainable solutions increasingly select LED neon, driving product diversification and innovation.
- For instance, Kings of Neon reports that high-quality glass neon signs can have a lifespan ranging from 8 to 15 years, with some signs lasting even longer under optimal conditions.
By Application:
Applications for neon signs cover both indoor and outdoor environments. Outdoor neon signs dominate market share, supporting storefront visibility, wayfinding, and commercial branding in retail districts and entertainment hubs. Indoor applications focus on decorative and thematic elements in restaurants, bars, hotels, and retail interiors. Event planners and marketing agencies also use neon signage to create immersive experiences and enhance customer engagement at pop-up locations and exhibitions.
- For instance, Hard Rock Cafe in Las Vegas featured the world’s tallest guitar neon sign at 82 foot, which became an iconic indoor and outdoor centerpiece since 1990.
By End-Use:
Retail, hospitality, and entertainment represent the primary end-use sectors within the Neon Signs Market. Retail businesses use neon to capture attention and differentiate store façades. The hospitality sector leverages neon signage for atmosphere and visual identity in restaurants, hotels, and nightlife venues. Entertainment operators, such as theaters and amusement centers, value neon for its nostalgic appeal and ability to create memorable experiences. New demand from boutique stores, creative studios, and residential interiors is also broadening the market’s end-use profile.
Segmentations:
By Type:
- Traditional Neon Glass Tube Signs
- LED Neon Signs
By Application:
- Outdoor Signage
- Indoor Signage
- Decorative Displays
- Advertising and Promotion
By End-Use:
- Retail
- Hospitality
- Entertainment
- Restaurants and Bars
- Events and Exhibitions
- Residential
Based on the Geography:
- North America
- U.S.
- Canada
- Mexico
- Europe
- Germany
- France
- U.K.
- Italy
- Spain
- Rest of Europe
- Asia Pacific
- China
- Japan
- India
- South Korea
- South-east Asia
- Rest of Asia Pacific
- Latin America
- Brazil
- Argentina
- Rest of Latin America
- Middle East & Africa
- GCC Countries
- South Africa
- Rest of the Middle East and Africa
Regional Analysis:
North America:
North America holds 37% of the Neon Signs Market, the largest share globally, driven by a high concentration of retail chains, entertainment venues, and quick-service restaurants. The United States and Canada maintain a strong tradition of neon signage in urban landscapes, driving steady demand for both new installations and refurbishments. Businesses in these markets value the high visibility and brand reinforcement that neon provides, supporting widespread adoption across commercial, hospitality, and event spaces. Innovation in energy-efficient neon lighting and advanced customization options continues to attract investment from established brands and emerging businesses. The region’s thriving tourism and nightlife sectors create further opportunities for visually striking signage. Regulatory standards for safety and sustainability guide the development of new product offerings and shape market strategies.
Europe:
Europe accounts for 28% of the Neon Signs Market, reflecting the region’s vibrant tourism industries, boutique hospitality providers, and focus on preserving historic cityscapes. Countries such as the United Kingdom, Germany, and France feature neon signs as iconic visual elements in city centers and entertainment districts. Businesses invest in neon to enhance customer experience and differentiate storefronts within dense urban areas. Regulatory frameworks encourage the use of energy-efficient materials and safe installation practices, ensuring neon remains viable in contemporary applications. European designers often blend traditional aesthetics with modern technology, creating unique signage solutions that appeal to both locals and tourists. Market growth remains stable, backed by ongoing investments in cultural and commercial infrastructure.
Asia-Pacific:
Asia-Pacific represents 24% of the Neon Signs Market, supported by rapid urbanization, expanding retail infrastructure, and a rising middle class. Cities in China, Japan, South Korea, and India invest heavily in commercial construction and vibrant nightlife economies that favor bold, visually engaging signage. Businesses use neon to capture consumer attention and reinforce brand presence in crowded retail and entertainment hubs. Local governments integrate neon installations into urban development and tourism strategies, amplifying market growth. Innovation in flexible tubing, smart controls, and low-energy lighting appeals to cost-sensitive buyers and eco-conscious enterprises. It positions Asia-Pacific as a dynamic market with strong future prospects for neon signage providers.
Key Player Analysis:
- MNeon
- Neon Creations
- Sparky Neon
- Philips Lighting
- EGL Lighting
- Philips Lighting
- EGL Lighting
- Crown Sign Systems
- MNeon
- Optek Electronics
Competitive Analysis:
The Neon Signs Market features a mix of established global brands and specialized regional manufacturers, driving a competitive landscape marked by innovation, customization, and quality service. Companies such as EGL Lighting, Philips Lighting, and Crown Sign Systems lead the market with strong portfolios and extensive distribution networks. It remains important for market leaders to focus on advanced product development, such as energy-efficient LED neon solutions and digital integration, to address evolving customer preferences. Smaller regional players excel in personalized service, niche applications, and rapid turnaround times, securing local client loyalty. Price competition persists, but differentiation through design, reliability, and after-sales support strengthens brand value. Collaboration with architects and designers helps key players deliver bespoke solutions and expand market reach. Continuous investment in new materials, sustainability, and compliance standards enables top companies to maintain a competitive edge in a dynamic signage industry.
Recent Developments:
- In july2025, Philips Lighting (Signify) announced the Philips Dynalite Dealer Program to expand dealer networks in residential and small commercial projects.
- In June 2025, ChromoTek released mNeonGreen-Trap Agarose, a reagent designed for immunoprecipitation of mNeonGreen-fusion proteins, supporting advanced protein research application.
- In July 2024, Sparky Neon launched affordable, customizable, and energy-efficient LED neon sign solutions, targeting both business and individual customers seeking innovative signage for modern spaces
Market Concentration & Characteristics:
The Neon Signs Market demonstrates moderate concentration, with a mix of established global players and numerous regional manufacturers. It is characterized by strong customization capabilities, high brand differentiation, and robust demand from retail, hospitality, and entertainment sectors. Leading companies maintain competitive advantage through design innovation, energy-efficient products, and reliable after-sales service. Regional players excel in offering tailored solutions that cater to local aesthetic preferences and regulatory standards. The market’s fragmented structure fosters continuous product development, flexible pricing strategies, and collaborative partnerships with designers and architects. Advances in eco-friendly materials and smart controls support the market’s evolution while reinforcing the importance of quality, safety, and visual impact
Report Coverage:
The research report offers an in-depth analysis based on Type Application, End-Use and Region. It details leading Market players, providing an overview of their business, product offerings, investments, revenue streams, and key applications. Additionally, the report includes insights into the competitive environment, SWOT analysis, current Market trends, as well as the primary drivers and constraints. Furthermore, it discusses various factors that have driven Market expansion in recent years. The report also explores Market dynamics, regulatory scenarios, and technological advancements that are shaping the industry. It assesses the impact of external factors and global economic changes on Market growth. Lastly, it provides strategic recommendations for new entrants and established companies to navigate the complexities of the Market.
Future Outlook:
- The Neon Signs Market will expand into new verticals such as wellness centers, co‑working spaces, and smart homes.
- Companies will offer neon signage with integrated IoT controls for remote color and brightness adjustments.
- It will adopt new materials like biodegradable tubing and recycled metals to meet sustainability demands.
- Brands will pursue joint ventures with interior designers and architects to embed neon into themed experiences.
- Market players will leverage augmented reality tools to allow virtual previews of neon installations.
- It will attract investments in modular neon kits for DIY consumers and small businesses.
- Manufacturers will deploy cloud‑based monitoring for real‑time diagnostics and predictive maintenance.
- It will benefit from growth in pop‑up retail, experiential marketing, and event‑driven environments.
- Digital overlays will pair with neon signage to deliver hybrid campaigns that blend static and dynamic visuals.
- It will support circular‑economy models by offering refurbishment programs and component recycling services.
Request a Free Sample
Fill in your details and we'll send you a free sample report.
- Sample data tables & charts
- Research methodology
Market Dynamics
Unique Visual Appeal and Customization
Neon signs offer vibrant colors, high brightness, and extensive customization options, enabling brands to create distinctive storefronts and immersive environments that attract attention in crowded urban settings.
Resurgence of Retro and Vintage Aesthetics
The popularity of retro and vintage design trends in branding, hospitality, and entertainment is fueling renewed demand for neon signage, as businesses seek to evoke nostalgia and create memorable, Instagrammable spaces.
Advancements in Energy-Efficient and Flexible Neon Technologies
Innovations such as LED neon alternatives, flexible tubing, and safer materials are expanding the application scope of neon signs, making them more energy-efficient, durable, and suitable for eco-conscious businesses.
Expansion of Urban Nightlife and Commercial Real Estate
Rapid urbanization and the growth of entertainment districts, retail centers, and hospitality venues worldwide are increasing the need for eye-catching signage, positioning neon as a strategic tool for visibility and brand differentiation.
Growing Demand for Experiential Marketing and Social Media Integration
Businesses are leveraging neon signage to create interactive, visually impactful experiences that drive customer engagement both in physical spaces and on social media, supporting brand recall and word-of-mouth promotion.
Need a Custom Version of This Report?
Tailor the scope, geography, or segments to your exact requirements.
- Custom geography or segment scope
- Direct access to our analyst team
Frequently Asked Questions
What is the current size of the Neon Signs Market?
What are the key segments within the Neon Signs Market?
What are some challenges faced by the Neon Signs Market?
Who are the major players in the Neon Signs Market?
Table of Content
Chapter 1 Market Segmentation
- 1.1 Segmentation Framework
- 1.1.1 Product and Service Classification
- 1.1.2 Application and End-Use Classification
- 1.1.3 Technology and Solution Classification
- 1.1.4 Customer and Distribution Channel Classification
- 1.1.5 Geographic Segmentation
- 1.1.6 Market Segment Definitions and Boundaries
- 1.2 By Type
- 1.2.1 Traditional Neon Glass Tube Signs
- 1.2.2 LED Neon Signs
- 1.3 By End-Use
- 1.3.1 Retail
- 1.3.2 Hospitality
- 1.3.3 Entertainment
- 1.3.4 Restaurants and Bars
- 1.3.5 Events and Exhibitions
- 1.3.6 Residential
- 1.4 By Application
- 1.4.1 Outdoor Signage
- 1.4.2 Indoor Signage
- 1.4.3 Decorative Displays
- 1.4.4 Advertising and Promotion
Chapter 2 Introduction
- 2.1 Report Objectives and Scope
- 2.2 Product Definition and Industry Terminology
- 2.3 Market Inclusions and Exclusions
- 2.4 Research Process
- 2.4.1 Primary Research and Expert Interviews
- 2.4.2 Secondary Research and Source Review
- 2.4.3 Top-Down and Bottom-Up Estimation
- 2.4.4 Data Triangulation and Verification
- 2.5 Market Size Measurement Basis
- 2.5.1 2024: USD 2,505 million → 2032: USD 3,844.3 million
- 2.6 Historical and Forecast Reference Periods
- 2.6.1 Base Year: 2024
- 2.6.2 Forecast Period: 2024-2032
- 2.7 Research Assumptions and Limitations
Chapter 3 Executive Summary
- 3.1 Market Snapshot and Key Findings
- 3.2 Base-Year Market Size, 2024
- 3.3 Forecast Market Size, 2032
- 3.4 Revenue and Volume Growth Outlook
- 3.5 Key Demand and Supply Indicators
- 3.6 Leading Market Segments
- 3.7 Fastest-Growing Market Opportunities
- 3.8 Regional Performance Highlights
- 3.9 Technology and Industry Transformation
- 3.10 Competitive Landscape Summary
- 3.11 Analyst View and Strategic Implications
Chapter 4 Global Neon Signs Market Trends and Developments
- 4.1 Historical Industry Development
- 4.2 Recent Market Trends and Developments
- 4.3 Demand and Customer Behavior Trends
- 4.4 Technology and Product Innovation
- 4.5 Artificial Intelligence, Automation and Digitalization
- 4.6 Local Manufacturing and Supply Chain Realignment
- 4.7 Industry Partnerships, Mergers and Acquisitions
- 4.8 Sustainability and Circular Economy Developments
- 4.9 Government and Private Sector Investment Trends
- 4.10 Emerging Business Models and Commercialization
- 4.11 Industry Developments and Announcements
Chapter 5 Global Neon Signs Market Production, Supply and Demand Analysis
- 5.1 Demand Trend and Consumption Analysis
- 5.2 Demand Forecast, 2024-2032
- 5.3 Production and Output Trend
- 5.4 Production and Output Forecast, 2024-2032
- 5.5 Installed Capacity and Capacity Utilization
- 5.6 Company-Wise Production Plants and Statistics
- 5.6.1 Installed Production Capacity
- 5.6.2 Actual Production
- 5.6.3 Planned Capacity and Expansion Targets
- 5.7 Supply Chain Structure and Procurement Trends
- 5.8 Supply-Demand Gap and Bottlenecks
- 5.9 Import Dependence and Sourcing Structure
- 5.10 Contract Manufacturing and Outsourcing
- 5.11 Regional Supply and Demand Concentration
Chapter 6 Global Neon Signs Market Pricing Analysis
- 6.1 Pricing Structure and Measurement
- 6.2 Historical Pricing Trends
- 6.3 Pricing Outlook, 2024-2032
- 6.4 Average Selling Price and Unit Economics
- 6.5 Pricing by Product and Market Segment
- 6.6 Geographic Pricing Differences
- 6.7 Key Input, Energy, Labor and Logistics Costs
- 6.8 Contract Pricing and Purchasing Models
- 6.9 Pricing Sensitivity and Competitive Positioning
- 6.10 Price, Margin and Profitability Implications
Chapter 7 Global Neon Signs Market Dynamics
- 7.1 Market Growth Drivers
- 7.1.1 Demand-Side Drivers
- 7.1.2 Technology and Innovation Drivers
- 7.1.3 Infrastructure and Investment Drivers
- 7.1.4 Regulatory and Policy Drivers
- 7.2 Market Restraints
- 7.2.1 Cost and Affordability Constraints
- 7.2.2 Technology and Adoption Barriers
- 7.2.3 Supply Chain and Operational Constraints
- 7.3 Market Challenges
- 7.3.1 Competitive Pressure and Margin Erosion
- 7.3.2 Skills, Infrastructure and Implementation Gaps
- 7.4 Emerging Market Opportunities
- 7.5 Market Dynamics Impact and Time-Horizon Assessment
Chapter 8 Global Neon Signs Value Chain Analysis
- 8.1 Industry Value Chain Overview
- 8.2 Upstream Suppliers and Critical Inputs
- 8.3 Technology and Component Providers
- 8.4 Manufacturing or Service Delivery
- 8.5 Distribution, Channel Partners and Integrators
- 8.6 Downstream Applications and End Users
- 8.7 Value Addition and Profit Pools
- 8.8 Vertical Integration and Outsourcing
- 8.9 Supplier Concentration and Risk
- 8.10 Supply Chain Localization and Resilience
Chapter 9 Global Neon Signs Market Regulations and Policies
- 9.1 Relevant Laws, Standards and Compliance Frameworks
- 9.2 Product, Service, Safety and Quality Requirements
- 9.3 Government Policies, Incentives and Subsidies
- 9.4 Imports, Exports and Trade Barriers
- 9.5 Public Procurement and Local Content Requirements
- 9.6 Environmental and Sustainability Compliance
- 9.7 Upcoming Policy Changes and Market Implications
Chapter 10 Global Neon Signs Market Hotspots and Opportunities
- 10.1 Market Opportunity Mapping and Growth Hotspots
- 10.2 High-Growth Applications and Customer Groups
- 10.3 Underserved Markets and White-Space Opportunities
- 10.4 Emerging Technology and Product Opportunities
- 10.5 New Capacity and Investment Hotspots
- 10.6 Market Entry and Expansion Opportunities
- 10.7 Distribution and Partnership Opportunities
- 10.8 Near-Term and Long-Term Commercial Potential
- 10.9 Opportunity Attractiveness and Execution Risks
Chapter 11 Global Neon Signs Market Outlook, 2024-2032
- 11.1 Market Size and Analysis
- 11.1.1 Revenue (Market Measurement: 2024: USD 2,505 million → 2032: USD 3,844.3 million)
- 11.1.2 Market Volume and Quantity Sold
- 11.1.3 Historical Market Size
- 11.1.4 Base-Year Market Size, 2024
- 11.2 Market Forecast, 2024-2032
- 11.2.1 Revenue Forecast to 2032
- 11.2.2 Volume Forecast to 2032
- 11.2.3 CAGR and Year-on-Year Growth
- 11.2.4 Incremental Revenue Opportunity
- 11.3 Forecast Assumptions and Scenario Analysis
- 11.3.1 Base-Case Forecast
- 11.3.2 Optimistic and Conservative Scenarios
- 11.3.3 Technology, Pricing and Policy Sensitivities
- 11.4 Market Attractiveness and Growth Outlook
Chapter 12 Global Neon Signs Market Segmentation and Outlook
- 12.1 Segmentation Summary and Market Shares, 2024
- 12.2 Largest and Fastest-Growing Segments
- 12.3 By Type - Market Size and Forecast, 2024-2032
- 12.3.1 Segment Definition and Scope
- 12.3.2 Historical Market Size
- 12.3.3 Revenue Forecast, 2024-2032
- 12.3.4 Volume Forecast, 2024-2032
- 12.3.5 Base-Year Market Share, 2024
- 12.3.6 Segment CAGR and Growth Drivers
- 12.3.7 Subsegment Market Size and Forecast
- 12.3.7.1 Traditional Neon Glass Tube Signs
- 12.3.7.2 LED Neon Signs
- 12.3.8 Subsegment Pricing and Adoption Trends
- 12.3.9 Leading Suppliers and Competition
- 12.3.10 Regional Demand and Opportunities
- 12.4 By End-Use - Market Size and Forecast, 2024-2032
- 12.4.1 Segment Definition and Scope
- 12.4.2 Historical Market Size
- 12.4.3 Revenue Forecast, 2024-2032
- 12.4.4 Volume Forecast, 2024-2032
- 12.4.5 Base-Year Market Share, 2024
- 12.4.6 Segment CAGR and Growth Drivers
- 12.4.7 Subsegment Market Size and Forecast
- 12.4.7.1 Retail
- 12.4.7.2 Hospitality
- 12.4.7.3 Entertainment
- 12.4.7.4 Restaurants and Bars
- 12.4.7.5 Events and Exhibitions
- 12.4.7.6 Residential
- 12.4.8 Subsegment Pricing and Adoption Trends
- 12.4.9 Leading Suppliers and Competition
- 12.4.10 Regional Demand and Opportunities
- 12.5 By Application - Market Size and Forecast, 2024-2032
- 12.5.1 Segment Definition and Scope
- 12.5.2 Historical Market Size
- 12.5.3 Revenue Forecast, 2024-2032
- 12.5.4 Volume Forecast, 2024-2032
- 12.5.5 Base-Year Market Share, 2024
- 12.5.6 Segment CAGR and Growth Drivers
- 12.5.7 Subsegment Market Size and Forecast
- 12.5.7.1 Outdoor Signage
- 12.5.7.2 Indoor Signage
- 12.5.7.3 Decorative Displays
- 12.5.7.4 Advertising and Promotion
- 12.5.8 Subsegment Pricing and Adoption Trends
- 12.5.9 Leading Suppliers and Competition
- 12.5.10 Regional Demand and Opportunities
- 12.6 Segment Growth Comparison
- 12.7 Segment Attractiveness and Priority Matrix
Chapter 13 Global Neon Signs End-Use and Application Market Outlook
- 13.1 End-Use Industry and Customer Demand Structure
- 13.2 Leading Applications and Customer Groups
- 13.3 End-Use Market Size, Share and Forecast
- 13.4 Major End-Use Industry Deep Dives
- 13.4.1 Customer Requirements and Use Cases
- 13.4.2 Demand and Replacement Cycles
- 13.4.3 Technical and Regulatory Considerations
- 13.4.4 Purchasing and Procurement Models
- 13.4.5 Leading Vendors and Distribution Channels
- 13.4.6 Forecast and Commercial Opportunities
- 13.5 Emerging Applications and Cross-Segment Demand
- 13.6 End-Use Industry Investment Priorities
Chapter 14 Global Neon Signs Geographic Market Outlook, 2024-2032
- 14.1 Regional Market Size and Share, 2024
- 14.2 Regional Market Forecast, 2024-2032
- 14.3 Regional Pricing, Production and Demand Differences
- 14.4 North America
- 14.4.1 United States
- 14.4.2 Canada
- 14.4.3 Mexico
- 14.5 Europe
- 14.5.1 Germany
- 14.5.2 France
- 14.5.3 Italy
- 14.5.4 United Kingdom
- 14.5.5 Spain
- 14.5.6 Poland
- 14.5.7 Russia
- 14.5.8 Netherlands
- 14.5.9 Belgium
- 14.5.10 Sweden
- 14.5.11 Denmark
- 14.5.12 Norway
- 14.5.13 Rest of Europe
- 14.6 Asia Pacific
- 14.6.1 China
- 14.6.2 India
- 14.6.3 Japan
- 14.6.4 South Korea
- 14.6.5 Thailand
- 14.6.6 Indonesia
- 14.6.7 Vietnam
- 14.6.8 Malaysia
- 14.6.9 Australia
- 14.6.10 Rest of Asia Pacific
- 14.7 Latin America
- 14.7.1 Brazil
- 14.7.2 Argentina
- 14.7.3 Colombia
- 14.7.4 Chile
- 14.7.5 Rest of Latin America
- 14.8 Middle East
- 14.8.1 Saudi Arabia
- 14.8.2 United Arab Emirates
- 14.8.3 Turkey
- 14.8.4 Israel
- 14.8.5 Iran
- 14.8.6 Rest of the Middle East
- 14.9 Africa
- 14.9.1 South Africa
- 14.9.2 Egypt
- 14.9.3 Nigeria
- 14.9.4 Morocco
- 14.9.5 Rest of Africa
- 14.10 Regional Investment, Policy and Supply Chain Differences
- 14.11 Regional Competitive Landscape
- 14.12 Geographic Growth Hotspots
Chapter 15 Global Neon Signs Technology, Innovation and Sustainability Outlook
- 15.1 Technology Landscape and Maturity
- 15.2 Product, Process and Service Innovation
- 15.3 AI, Automation and Digital Tools in the Industry
- 15.4 Technology Adoption and Performance Benchmarking
- 15.5 Innovation Pipeline and R&D Investment
- 15.6 Patent and Intellectual Property Trends
- 15.7 Energy Efficiency and Resource Management
- 15.8 Sustainability, Recycling and Circularity
- 15.9 Technology Roadmap, 2024-2032
- 15.10 Risks of Obsolescence and Technology Substitution
Chapter 16 Global Neon Signs Market Key Strategic Imperatives
- 16.1 Growth and Market Entry Priorities
- 16.2 High-Return Products and Segments
- 16.3 Pricing, Profitability and Cost Optimization
- 16.4 Technology Investment and Product Differentiation
- 16.5 Supply Chain Localization and Resilience
- 16.6 Distribution and Customer Acquisition
- 16.7 Partnership, Acquisition and Capacity Strategy
- 16.8 Regional Expansion Priorities
- 16.9 Short-, Medium- and Long-Term Actions
Chapter 17 Competition Outlook
- 17.1 Industry Competition Characteristics
- 17.2 Market Structure and Concentration
- 17.3 Market Share and Competitive Positioning, 2024
- 17.4 Company-Wise Revenue and Product Benchmarking
- 17.5 Production and Service Capacity Benchmarking
- 17.6 Technology, Pricing and Differentiation
- 17.7 Regional Footprint and Distribution Strength
- 17.8 Mergers, Acquisitions and Strategic Alliances
- 17.9 New Entrants and Competitive Threats
- 17.10 Porter's Five Forces and Industry Attractiveness
- 17.11 Competitive Outlook, 2024-2032
Chapter 18 Company Profiles
- 18.1 Company Coverage and Selection Criteria
- 18.2 Philips Lighting (Signify)
- 18.2.1 Business Description
- 18.2.2 Company Ownership and Geographic Presence
- 18.2.3 Product and Service Portfolio
- 18.2.4 Manufacturing and Operating Footprint
- 18.2.5 Production Capacity and Expansion Plans
- 18.2.6 Financial Performance and Investment
- 18.2.7 Market Share and Competitive Position
- 18.2.8 Technology and Innovation Capabilities
- 18.2.9 Strategic Alliances or Partnerships
- 18.2.10 Recent Developments
- 18.2.11 Growth Strategy and Outlook
- 18.3 EGL Lighting
- 18.4 Crown Sign Systems
- 18.5 Neon Creations
- 18.6 Sparky Neon
- 18.7 Optek Electronics
- 18.8 MNeon
- 18.9 Voodoo Neon
- 18.10 Kings of Neon
- 18.11 Neo-Neon
- 18.12 Other Relevant Market Participants
Note: Every listed company is profiled on the structure shown under the first company. The company list is preliminary and may change based on research findings, market developments, data availability and client requirements.
Chapter 19 Disclaimer
- 19.1 Research and Forecast Disclaimer
- 19.2 Data Source and Estimation Limitations
Note: The depth of individual sections depends on data availability for this market. Volume, capacity, trade and other unit-based metrics are included where applicable.

