
Market Overview
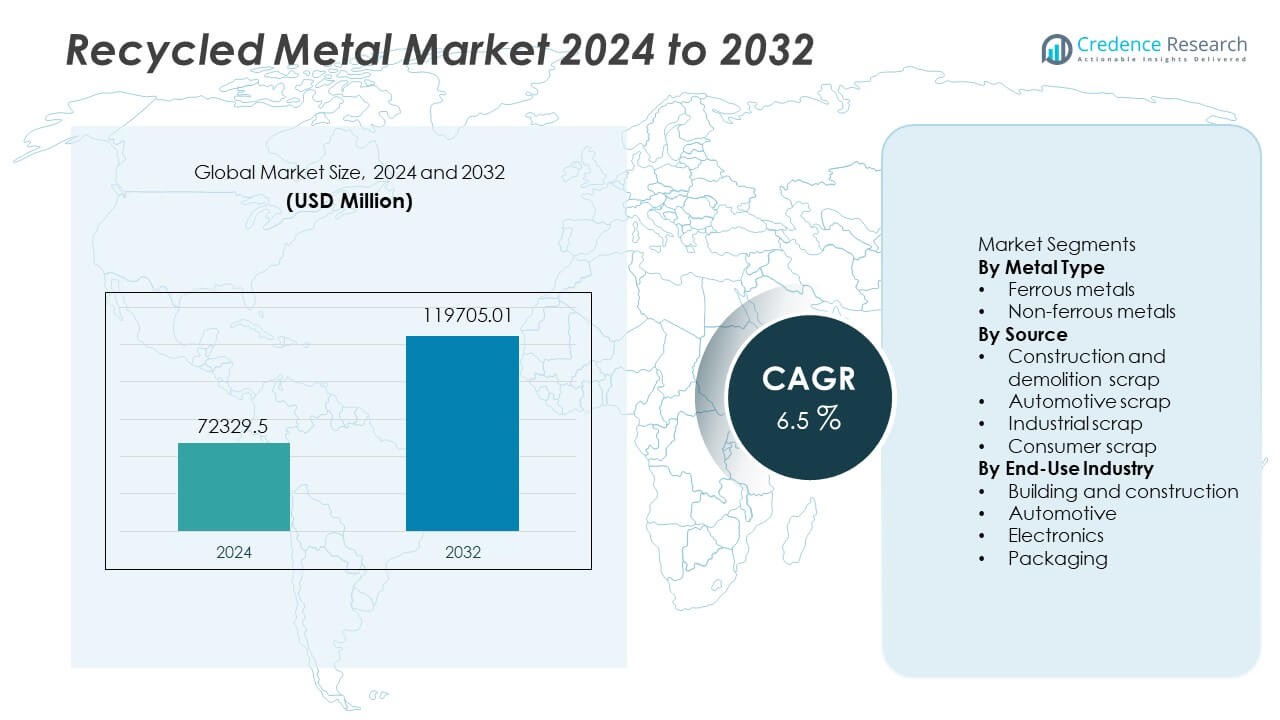
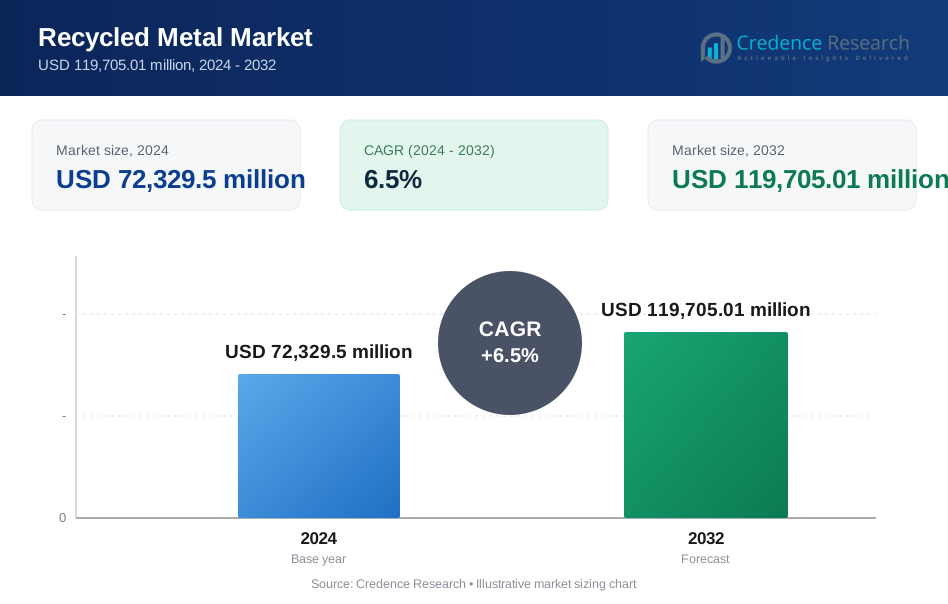
The Recycled Metal Market reached USD 72,329.5 million in 2024. The sector is projected to hit USD 119,705.01 million by 2032, reflecting a CAGR of 6.5% during the forecast period.
| REPORT ATTRIBUTE | DETAILS |
|---|---|
| Historical Period | 2020-2023 |
| Base Year | 2024 |
| Forecast Period | 2025-2032 |
| Recycled Metal Market Size 2024 | USD 72,329.5 Million |
| Recycled Metal Market, CAGR | 6.5% |
| Recycled Metal Market Size 2032 | USD 119,705.01 Million |
Top players in the recycled metal market include ArcelorMittal, Nucor Corporation, Sims Limited, Schnitzer Steel Industries, Commercial Metals Company, Steel Dynamics Inc., Tata Steel, Aurubis AG, Novelis Inc., and European Metal Recycling. These companies invest in advanced scrap-processing and electric-arc furnace technologies to expand recycled output and support decarbonization goals. Asia Pacific remains the leading regional market with 45 % share, driven by large construction volumes and strong industrial demand in China, India, and Japan. Europe ranks next due to strict circular-economy regulations, while North America follows with high recycling rates across ferrous and non-ferrous segments supported by mature scrap-collection systems.
Market Insights
- The Recycled Metal market reached USD 72,329.5 million in 2024 and is set to hit USD 119,705.01 million by 2032 at a 6.5 % CAGR, driven by rising sustainability investment across major industries.
- Growing demand for green materials in construction and automotive boosts consumption, while public policies encourage recycling programs and higher scrap recovery from end-of-life vehicles and industrial segments.
- Key trends include wider adoption of advanced sorting systems, sensor-based separation, and electric-arc furnaces, supporting higher recycled ratios for ferrous metals, which hold nearly 62 % share within the segment mix.
- Competition intensifies as global players expand scrap networks, acquire regional recyclers, and invest in automation and low-carbon steel solutions, although fluctuating scrap quality and contamination restrain wider adoption in precision applications.
- Asia Pacific leads global demand with 45 % share, followed by Europe at 25 % and North America at 20 %, reflecting strong construction activity, regulatory pressure, and established collection systems across these regions.
 Market Segmentation Analysis:
By Metal Type
In 2024, ferrous metals account for roughly 62 % of the recycled metal market, making them the dominant sub-segment. Demand remains strong because steel—mainly from iron and ferrous alloys-serves as the backbone of infrastructure and construction materials worldwide. Recycling firms favor ferrous scrap due to its high availability from old buildings, railways, and industrial machinery. Lower processing costs and stable demand support its lead over non-ferrous metals, whose share hovers around 38 %. Rising infrastructure projects and steel-intensive construction keep driving ferrous metal recycling volumes upward.
- For instance, worldwide scrap-based steel production used around 650 million tonnes of scrap per year vs about 1,869 million tonnes of total crude steel production.
By Source
The automotive scrap sub-segment leads the recycled-metal supply chain, contributing about 45 % of total scrap volume. End-of-life vehicles yield large quantities of steel, aluminum, and other metals that recyclers reclaim at scale. Regulatory pressure for sustainable disposal and incentives for metal recovery further boost automotive-scrap recycling. Construction and demolition scrap follow closely, but automotive scrap remains the most consistent feedstock. The reliable inflow, high metal concentration, and established scrap-collection networks make it the dominant source sub-segment in the market.
- For instance, typical passenger cars contain about 800 kg of steel, making them a rich source of recycled metal when dismantled at end-of-life.
By End-Use Industry
In the end-use breakdown, the building and construction sector commands roughly 50 % of recycled metal consumption. Recycled steel re-enters as structural beams, rebar, and reinforcement materials in residential and commercial projects. Urbanization, infrastructure upgrades, and green-building standards drive this high demand. The automotive industry ranks next, followed by electronics and packaging. Still, construction’s sheer scale and continuous demand give it the dominant position. As sustainable construction practices grow, demand for recycled metal in this sector is likely to strengthen further.
Key Growth Drivers
Growing Demand for Sustainable Materials
Recycled metals support lower carbon emissions and help cut energy use during production. Many governments promote metal-recycling targets through regulations and green incentives. Manufacturers in construction, automotive, and packaging prefer recycled inputs due to sustainability goals and lower raw-material volatility. Companies report lower lifecycle costs after shifting toward secondary metals. Growing public focus on resource preservation also raises awareness across heavy industries. These factors encourage higher collection efforts, better sorting systems, and industrial partnerships. Increasing global investments in circular economy programs continue to push recycled-metal adoption in both emerging and developed regions.
- For instance, a major steel producer using electric-arc-furnace (EAF) technology emits less than one-third of greenhouse-gas intensity compared to conventional blast-furnace steelmaking when using scrap as feedstock.
Expansion in Construction and Infrastructure Projects
Large public infrastructure plans in Asia Pacific, North America, and Europe increase recycled-steel usage in bridges, roads, and commercial buildings. Construction firms use recycled rebar and beams to meet green certification requirements. Infrastructure modernization projects produce significant ferrous scrap, which returns to the supply cycle. Government-funded housing and urban redevelopment improve demand visibility. Building codes gradually encourage material recycling to cut landfill pressure. Increased steel intensity in infrastructure projects also makes recycled metal a reliable option. Growing urban construction in developing countries further strengthens market growth during the forecast period across global regions.
- For instance, when producing one tonne of steel via the EAF route (using recycled scrap), energy consumption drops to about 9–12.5 GJ per tonne, compared to 28–31 GJ per tonne for traditional blast-furnace methods.
Increasing Metal Recovery from End-of-Life Vehicles
Automotive-scrap flows rise because modern vehicles contain more lightweight metals such as aluminum. Strict vehicle-scrappage rules push organized recycling and regulated dismantling centers. Recovered metals feed back into automotive, machinery, and industrial supply chains. Growing electric-vehicle fleets are expected to produce new streams of copper and aluminum. Many automotive manufacturers integrate recycled metals to reduce environmental scores and support closed-loop systems. Higher end-of-life recovery rates also reduce land waste and lower mining dependency. Improved vehicle dismantling, better sorting technology, and regulatory support continue to drive automotive-scrap recycling across global markets.
Key Trends and Opportunities
Rising Use of Advanced Sorting and Sensor Technologies
Automated sorting systems, including optical, magnetic, and sensor-based equipment, improve metal separation accuracy and raise yield rates. Investment in AI-enabled sorting helps recyclers detect alloys and contaminants with higher precision. Better recovery rates improve supply consistency for steel and non-ferrous segments. Technology upgrades lower processing losses and increase the quality of recycled metal. Many recycling plants adopt robotics for safe handling of end-of-life vehicles and demolition scrap. These tools reduce manual labor risks and enhance operational speed. Growing digitalization opens opportunities for technology providers and specialized recycling machinery suppliers worldwide.
- For instance, a global recycling-equipment company reports its optical/sensor-based sorting lines consistently recover up to 98 % of marketable non-ferrous metals from mixed scrap loads greatly reducing waste and improving purity.
Emerging Opportunities in Green Steel Production
Steelmakers invest in lower-emission furnaces that use recycled scrap rather than iron ore. Policies supporting green steel encourage scrap-based steelmaking through emission-reduction targets. Global automakers and construction firms seek low-carbon steel to meet sustainability guidelines. This preference increases demand for recycled metallic feedstock. Scrap-based electric-arc furnaces offer significant emission savings compared to traditional blast furnaces. Countries investing in green infrastructure create new demand centers for recycled metals. These initiatives provide long-term opportunities for recycling stakeholders, furnace manufacturers, and steel producers seeking sustainability-linked procurement standards.
- For instance, a large U.S.-based steelmaker used scrap-based electric-arc furnaces to produce about 18.5 million tonnes of steel in 2024, recycling roughly 18 million tonnes of scrap metal the same year.
Key Challenges
Quality Variability and Contamination Issues
Scrap-quality differences reduce production efficiency and limit recycled-metal use in precision applications. Contamination from coatings, plastics, and mixed alloys requires advanced sorting and pre-processing. Many recycling plants face technical barriers when dealing with composite materials, electronic scrap, and complex automotive structures. These issues increase processing time and operational costs. Limited standardization across scrap collection also affects material visibility. Some industries require stricter purity standards that recycled metals struggle to meet consistently. Quality concerns continue to slow adoption in high-performance sectors such as aerospace and advanced electronics manufacturing across major regions.
Fluctuating Raw-Material Prices and Collection Gaps
Metal-price volatility affects collection economics and recycling margins. During periods of low primary-metal pricing, recycling becomes less profitable and discourages investment. Collection gaps remain visible in developing countries because of weak infrastructure and informal scrap-collection networks. Limited awareness restricts household scrap return rates. Rising operational and labor costs also impact profitability in fragmented scrap markets. Uneven global regulations cause supply inconsistencies, increasing risk for recycling firms. These factors restrict continuous feedstock supply and raise uncertainty in long-term capacity planning for recyclers and downstream industries worldwide.
Regional Analysis
North America
North America holds 20 % of the recycled metal market on strong industrial recycling systems and well-established scrap collection networks. The United States leads due to high steel consumption in construction and automotive activities. Rising sustainability rules encourage recycled steel in public infrastructure and green building projects. Major steelmakers expand electric-arc furnace capacity to increase scrap usage and reduce emissions. Canada contributes sizable ferrous scrap from industrial hubs, while cross-border scrap trade supports supply balance. Ongoing plant modernization and higher end-of-life vehicle recovery continue to support regional demand for recycled metals during the forecast period.
Europe
Europe commands 25 % share driven by strong circular-economy policies and strict environmental rules. Recycling targets under EU frameworks push metal recovery from automotive, construction, and industrial waste streams. Germany and Italy operate large steel-recycling plants that adopt high scrap ratios in electric-arc furnaces. Automotive OEMs integrate recycled aluminum and steel in vehicle platforms under emission-reduction targets. Growing adoption of low-carbon steel in infrastructure helps expand ferrous scrap consumption. Rising electronic-waste collection enhances non-ferrous metal recovery. European markets maintain high quality standards that encourage investments in sorting technology and automated recycling equipment.
Asia Pacific
Asia Pacific leads the global recycled metal market with 45 % share supported by massive construction activities, rapid industrialization, and strong manufacturing bases. China operates large ferrous recycling capacity and encourages scrap-based steelmaking to reduce emissions. India expands organized scrap-processing zones to replace informal recycling practices. Japan grows non-ferrous recovery from advanced automotive and electronics markets. Urbanization, public infrastructure spending, and electric-vehicle adoption generate high demand for recycled iron, steel, copper, and aluminum. Strong government support and expanding electric-arc furnace installations further strengthen regional leadership in recycled metal consumption across major economies.
Latin America
Latin America represents 6 % of the recycled metal market backed by industrial scrap from mining, construction, and automotive activities in Mexico and Brazil. Growth remains tied to steel demand in urban infrastructure and housing projects. Scrap collection systems are improving with support from local metal processors and regional industry programs. Automotive recycling expands with end-of-life vehicle rules in key countries. Investment in modern shredding and sorting equipment enhances metal recovery and export supply. Continued industrialization, urban construction demand, and sustainability initiatives help drive recycled metal usage across emerging Latin American economies.
Middle East and Africa
Middle East and Africa account for 4 % share driven by growing construction and energy-sector projects that generate sizable ferrous scrap. Gulf countries expand infrastructure spending linked with industrial diversification and green-building plans. Scrap collection capacity improves across United Arab Emirates and Saudi Arabia as steelmakers integrate higher scrap ratios in local furnaces. Africa increases metal recycling from mining and automotive sectors, although informal collection remains common. Rising interest in circular-economy regulation and industrial reform helps expand future opportunities. Demand for low-emission materials is likely to grow with large regional infrastructure plans.
Market Segmentations:
By Metal Type
- Ferrous metals
- Non-ferrous metals
By Source
- Construction and demolition scrap
- Automotive scrap
- Industrial scrap
- Consumer scrap
By End-Use Industry
- Building and construction
- Automotive
- Electronics
- Packaging
By Geography
- North America
- U.S.
- Canada
- Mexico
- Europe
- Germany
- France
- U.K.
- Italy
- Spain
- Rest of Europe
- Asia Pacific
- China
- Japan
- India
- South Korea
- South-east Asia
- Rest of Asia Pacific
- Latin America
- Brazil
- Argentina
- Rest of Latin America
- Middle East & Africa
- GCC Countries
- South Africa
- Rest of the Middle East and Africa
Competitive Landscape
Competitive landscape includes ArcelorMittal, Nucor Corporation, Sims Limited, Schnitzer Steel Industries, Commercial Metals Company, Steel Dynamics Inc., Tata Steel, Aurubis AG, Novelis Inc., and European Metal Recycling. Leading companies expand scrap-processing capacity and adopt electric-arc furnace technology to increase recycled content and lower emissions. Many players invest in automation, robotics, and advanced sorting lines to improve scrap yield and quality. Partnerships with automotive makers and construction firms help secure long-term scrap supply and support sustainability goals. Global leaders also acquire regional recyclers to strengthen collection networks and optimize feedstock sourcing. Growing focus on low-carbon steel and green-material certification pushes companies toward emission-reduction commitments. Strategic initiatives increasingly focus on circular-economy standards, especially in Europe and North America, where policy support remains strong.
Key Player Analysis
- ArcelorMittal
- Nucor Corporation
- Sims Limited
- Schnitzer Steel Industries
- Commercial Metals Company
- Steel Dynamics Inc.
- Tata Steel
- Aurubis AG
- Novelis Inc.
- European Metal Recycling (EMR)
Recent Developments
- In October 2023, Nucor Corporation expanded River Metals Recycling through the Garden Street Iron & Metal deal. The network rose to 19 recycling facilities.
- In July 2023, Commercial Metals Company received a key permit for its West Virginia micro mill. The site is expected to start up in 2025.
- In March 2023, Commercial Metals Company (CMC) acquired Roane Metals Group LLC, a metal recycling company. This acquisition is expected to enhance the security and supply of competitively priced inputs to CMC's steelmaking operations.
Report Coverage
The research report offers an in-depth analysis based on Metal Type, Source, End-Use Industry and Geography. It details leading market players, providing an overview of their business, product offerings, investments, revenue streams, and key applications. Additionally, the report includes insights into the competitive environment, SWOT analysis, current market trends, as well as the primary drivers and constraints. Furthermore, it discusses various factors that have driven market expansion in recent years. The report also explores market dynamics, regulatory scenarios, and technological advancements that are shaping the industry. It assesses the impact of external factors and global economic changes on market growth. Lastly, it provides strategic recommendations for new entrants and established companies to navigate the complexities of the market.
Future Outlook
- Demand will rise as industries shift toward low-emission raw materials.
- Green construction rules will increase recycled steel consumption in buildings.
- Electric-arc furnace adoption will support higher scrap usage in steelmaking plants.
- End-of-life vehicle programs will strengthen automotive scrap supply.
- Digital sorting systems will raise recovery rates for mixed metal streams.
- Circular-economy policies will encourage formal scrap-collection networks.
- Green-steel certification will create new procurement standards in major sectors.
- Recycling of electronics and batteries will expand non-ferrous supply pools.
- Global players will invest in advanced recycling capacity across emerging markets.
- Regional sustainability goals will keep recycled metal demand on a long-term growth path.
Request a Free Sample
Fill in your details and we'll send you a free sample report.
- Sample data tables & charts
- Research methodology
Need a Custom Version of This Report?
Tailor the scope, geography, or segments to your exact requirements.
- Custom geography or segment scope
- Direct access to our analyst team
Frequently Asked Questions
What is the current market size for the Recycled Metal market, and what is its projected size in 2032?
At what Compound Annual Growth Rate is the Recycled Metal market projected to grow between 2024 and 2032?
Which Recycled Metal market segment held the largest share in 2024?
What are the primary factors fueling the growth of the Recycled Metal market?
Who are the leading companies in the Recycled Metal market?
Which region commanded the largest share of the Recycled Metal market in 2024?
Table of Content
Chapter 1. Report Introduction
- 1.1 Report Description & Purpose
- 1.1.1 Report Title & Market Definition
- 1.1.2 Unique Selling Propositions (USP) & Key Differentiators
- 1.1.3 Value Proposition for Stakeholders
- 1.2 Research Objectives
- 1.2.1 Market Sizing Objectives (Volume & Revenue)
- 1.2.2 Segmentation Objectives
- 1.2.3 Competitive Intelligence Objectives
- 1.2.4 Forecast & Scenario Objectives
- 1.3 Report Scope
- 1.3.1 Recycled Metal Scope – Types & Subtypes Covered
- 1.3.2 Geographic Scope – Regions & Countries Covered
- 1.3.3 Historical Period, Base Year & Forecast Period (2024; forecast to 2032)
- 1.3.4 Inclusions & Exclusions
- 1.4 HS Code & Classification Framework
- 1.5 Currency, Units & Pricing Basis
- 1.6 Target Stakeholders
- 1.7 Limitations & Assumptions
Chapter 2. Executive Summary
- 2.1 Global Recycled Metal Market Snapshot
- 2.1.1 Market Size – Historical (2024) & Forecast (2024-2032) (2024: USD 72,329.5 million → 2032: USD 119,705.01 million)
- 2.1.2 Volume & Revenue – Global Totals
- 2.1.3 Key Market Highlights – Top Five Facts
- 2.2 Recycled Metal Market Segmentation Snapshot
- 2.2.1 Market Split by Region – 2024 vs. 2032
- 2.3 Competitive Snapshot
- 2.3.1 Top 10 Players by Revenue Share – 2024
- 2.3.2 Top 10 Players by Volume Share – 2024
- 2.3.3 Recent Strategic Developments (18-Month Summary)
- 2.4 Key Investment Highlights & Strategic Conclusions
Chapter 3. Recycled Metal Market Dynamics & Industry Analysis
- 3.1 Market Overview & Context
- 3.1.1 Recycled Metal Market Position in the Broader Automotive Value Chain
- 3.1.2 OEM vs. Replacement Market Dynamics
- 3.1.3 Market Maturity & Development Stage by Region
- 3.2 Recycled Metal Market Drivers
- 3.3 Recycled Metal Market Restraints & Challenges
- 3.4 Recycled Metal Market Opportunities
- 3.5 Porter's Five Forces Analysis
- 3.5.1 Threat of New Entrants
- 3.5.2 Bargaining Power of Suppliers
- 3.5.3 Bargaining Power of Buyers
- 3.5.4 Threat of Substitutes
- 3.5.5 Competitive Rivalry – Intensity Assessment
- 3.6 Recycled Metal Value Chain Analysis
- 3.6.1 Upstream – Raw Material/Input Suppliers
- 3.6.1.1 Raw Material/Input 1
- 3.6.1.2 Raw Material/Input 2
- 3.6.1.3 Raw Material/Input 3
- 3.6.2 Midstream – Production/Manufacturing/Service Delivery
- 3.6.2.1 Production/Process Overview
- 3.6.2.2 Key Facility Locations & Capacity by Manufacturer
- 3.6.3 Downstream – Distribution & End Consumer
- 3.6.3.1 Primary Channel – B2B/OEM
- 3.6.3.2 Secondary Channels – Dealer, Retail, Online, Direct
- 3.6.4 Value Chain Profitability Analysis
- 3.6.1 Upstream – Raw Material/Input Suppliers
- 3.7 PESTEL Analysis
- 3.7.1 Political Factors
- 3.7.2 Economic Factors
- 3.7.3 Social Factors
- 3.7.4 Technological Factors
- 3.7.5 Environmental Factors
- 3.7.6 Legal Factors
- 3.8 Recycled Metal Supply Chain Analysis
- 3.8.1 Raw Material/Input Supply Risk Assessment
- 3.8.2 Manufacturing Concentration Risk (Geographic Exposure)
- 3.8.3 Trade Disruption Impact Analysis
- 3.9 Regulatory & Policy Landscape
Note: The regulatory and policy landscape section covers regulations based on their applicability to the market, Recycled Metal category, geography, and scope of the study. Only regulatory frameworks with a material impact on operations, compliance, trade, sustainability, or market access are analyzed in detail.
Chapter 4. Key Investment Pockets & Opportunity Analysis
- 4.1 Recycled Metal Market Attractiveness Analysis
- 4.1.1 By Region – Investment Attractiveness Matrix (Volume × CAGR)
- 4.2 Absolute Revenue Growth Opportunity
- 4.2.1 By Region – Absolute USD Growth Through 2032
- 4.3 Incremental Volume Opportunity
- 4.3.1 By Region – Incremental Volume Through 2032
- 4.3.2 Segment – Incremental Volume
- 4.4 Emerging Submarket Opportunity Deep Dive (Subject to Applicability)
- 4.5 Emerging Market Opportunity Scorecards
- 4.5.1 United States
- 4.5.2 Europe
- 4.5.3 Asia
- 4.5.4 Middle East & Africa
Note: Emerging Market Opportunity Scorecards will be included based on relevance and strategic importance. Regions listed are indicative and may vary depending on data availability and market dynamics.
Chapter 5. Recycled Metal Import-Export Analysis & Trade Flows
- 5.1 Global Trade Overview
- 5.1.1 Global Export Value by Country (2024)
- 5.1.2 Global Export Volume by Country (2024)
- 5.1.3 Global Import Value by Country (2024)
- 5.1.4 Global Import Volume by Country (2024)
- 5.1.5 Net Trade Balance by Country (2024)
- 5.2 Export Analysis – Segment
- 5.2.1 Type 1 (HS Code)
- 5.2.2 Type 2 (HS Code)
- 5.2.3 Type 3 (HS Code)
- 5.2.4 Type 4 (HS Code)
- 5.2.5 Type 5 (HS Code)
- 5.3 Import Analysis – Segment
- 5.3.1 Type 1 (HS Code)
- 5.3.2 Type 2 (HS Code)
- 5.3.3 Type 3 (HS Code)
- 5.3.4 Type 4 (HS Code)
- 5.3.5 Type 5 (HS Code)
- 5.4 Average Unit Trade Prices
- 5.4.1 Average Export Price – Segment & Country
- 5.4.2 Average Import Price – Segment & Source Country
- 5.4.3 Price Trends (2024)
- 5.5 Key Trade Route Analysis
- 5.5.1 Trade Route 1
- 5.5.2 Trade Route 2
- 5.5.3 Trade Route 3
- 5.5.4 Trade Route 4
- 5.5.5 Trade Route 5
- 5.6 Trade Policy Impact Assessment
- 5.6.1 US Anti-Dumping & Section 301 Tariffs
- 5.6.2 EU Customs Union Impact
- 5.6.3 Major Free Trade Agreements
- 5.6.4 USMCA Rules of Origin
Note: Trade policy analysis will be included only where relevant to the Recycled Metal market.
Chapter 6. Competitive Landscape & Company Benchmarking
- 6.1 Recycled Metal Market Concentration & Structure
- 6.1.1 Herfindahl-Hirschman Index (HHI) – vs. 2024
- 6.1.2 Tier 1, Tier 2 & Tier 3 Market Structure
- 6.1.3 Global, Regional & Local Player Dynamics
- 6.2 Recycled Metal Market Share Analysis – 2024
- 6.2.1 Global Revenue Share by Company
- 6.2.2 Global Volume Share by Company
- 6.2.3 Regional Revenue Share
- 6.2.4 Market Share Evolution ( vs. 2024)
- 6.2.5 OEM Segment Share by Company
- 6.2.6 Replacement Segment Share by Company
- 6.3 Production/Delivery Capacity & Facility Analysis
- 6.3.1 Global Installed Capacity
- 6.3.2 Capacity Utilization Rates
- 6.3.3 Production/Output Volume
- 6.3.4 Facility Locations & Capacity Map
- 6.3.5 Planned Capacity Additions
- 6.4 Recycled Metal Competitive Benchmarking Matrix
- 6.4.1 Revenue, Volume, CAGR & Profitability Comparison
- 6.4.2 Channel Revenue Mix
- 6.4.3 Geographic Revenue Exposure
- 6.4.4 R&D Intensity
- 6.4.5 Sustainability Maturity
- 6.5 Strategic Developments in Recycled Metal (Last 24 Months)
- 6.5.1 Mergers, Acquisitions & Divestments
- 6.5.2 New Recycled Metal Launches
- 6.5.3 Facility Expansions
- 6.5.4 Strategic Alliances, Joint Ventures & Partnerships
- 6.5.5 Distribution Expansion & Market Entry
- 6.5.6 Sustainability & ESG Initiatives
- 6.6 Competitive Strategy Mapping
- 6.6.1 Leader, Challenger, Follower & Niche Classification
- 6.6.2 Pricing Strategy Comparison
- 6.6.3 Channel Strategy Matrix
Note: Strategic developments are included based on their materiality and the availability of reliable information.
Chapter 7. Global Recycled Metal Market – By Distribution Channel
- 7.1 Segment Overview
- 7.1.1 Volume & Revenue Split by Channel (2024 & 2032)
- 7.1.2 Channel Mix Evolution (2024-2032)
Chapter 8. Regional Market Analysis – Global Overview
- 8.1 Global Regional Overview
- 8.1.1 Regional Volume Share
- 8.1.2 Regional Revenue Share
- 8.1.3 Regional Volume by Region
- 8.1.4 Regional Revenue by Region
- 8.1.5 Regional Forecast Through 2032
- 8.2 Cross-Regional Segment Analysis
- 8.2.1 By Distribution Channel
- 8.2.2 By Brand/Price Tier
Chapter 9. North America Recycled Metal Market
- 9.1 United States
- 9.2 Canada
- 9.3 Mexico
Chapter 10. Europe Recycled Metal Market
- 10.1 Germany
- 10.2 France
- 10.3 Italy
- 10.4 United Kingdom
- 10.5 Spain
- 10.6 Poland
- 10.7 Russia
- 10.8 Netherlands
- 10.9 Belgium
- 10.10 Sweden
- 10.11 Denmark
- 10.12 Norway
- 10.13 Rest of Europe
Chapter 11. Asia Pacific Recycled Metal Market
- 11.1 China
- 11.2 India
- 11.3 Japan
- 11.4 South Korea
- 11.5 Thailand
- 11.6 Indonesia
- 11.7 Vietnam
- 11.8 Malaysia
- 11.9 Australia
- 11.10 Rest of Asia Pacific
Chapter 12. Latin America Recycled Metal Market
- 12.1 Brazil
- 12.2 Argentina
- 12.3 Colombia
- 12.4 Chile
- 12.5 Rest of Latin America
Chapter 13. Middle East Recycled Metal Market
- 13.1 Saudi Arabia
- 13.2 United Arab Emirates
- 13.3 Turkey
- 13.4 Israel
- 13.5 Iran
- 13.6 Rest of the Middle East
Chapter 14. Africa Recycled Metal Market
- 14.1 South Africa
- 14.2 Egypt
- 14.3 Nigeria
- 14.4 Morocco
- 14.5 Rest of Africa
Chapter 15. Recycled Metal Company Profiles
- 15.1 [Company 01]
- 15.1.1 Company Overview
- 15.1.2 Key Management Personnel
- 15.1.3 Products & Services Portfolio
- 15.1.4 Financial Performance
- 15.1.5 Key Market Focus & Geographic Presence
- 15.1.6 Recent Developments & Strategic Initiatives
Note: The company profile list is preliminary and may change based on research findings, market developments, data availability, and client requirements.
Chapter 16. Appendices
- Appendix A – List of Abbreviations & Acronyms
- Appendix B – Industry Classification Code Reference – Full Series
- Appendix C – Production & Capacity Data Tables
- Appendix D – End-Use & Demand Base Tables
- Appendix E – Consumption & Replacement Rate Assumptions
- Appendix F – ASP Reference Tables
- Appendix G – Manufacturing & Facility Database
- Appendix H – Import-Export Data Tables
- Appendix I – Regulatory Summary Tables
- Appendix J – Primary Research Participant List (Anonymized)
- Appendix K – Primary Research Questionnaire Framework
- Appendix L – Data Sources & Bibliography
- Appendix M – Market Size Divergence & Source Comparison
Chapter 17. Research Methodology
- 17.1 Research Framework & Philosophy
- 17.2 Secondary Research – Sources, Hierarchy & Data Extraction
- 17.3 Data Modeling – Bottom-Up & Top-Down Market Sizing
- 17.4 Primary Research – Stakeholder Framework, LOI & Sample Sizes
- 17.5 Forecast Methodology – Regression, Scenario & Sensitivity Analysis
- 17.6 Quality Control – Four-Layer Validation Framework
- 17.7 Limitations & Standard Assumptions
- 17.8 Disclaimer
