
Nigeria ride-hailing resets after Uber leaves in 2026
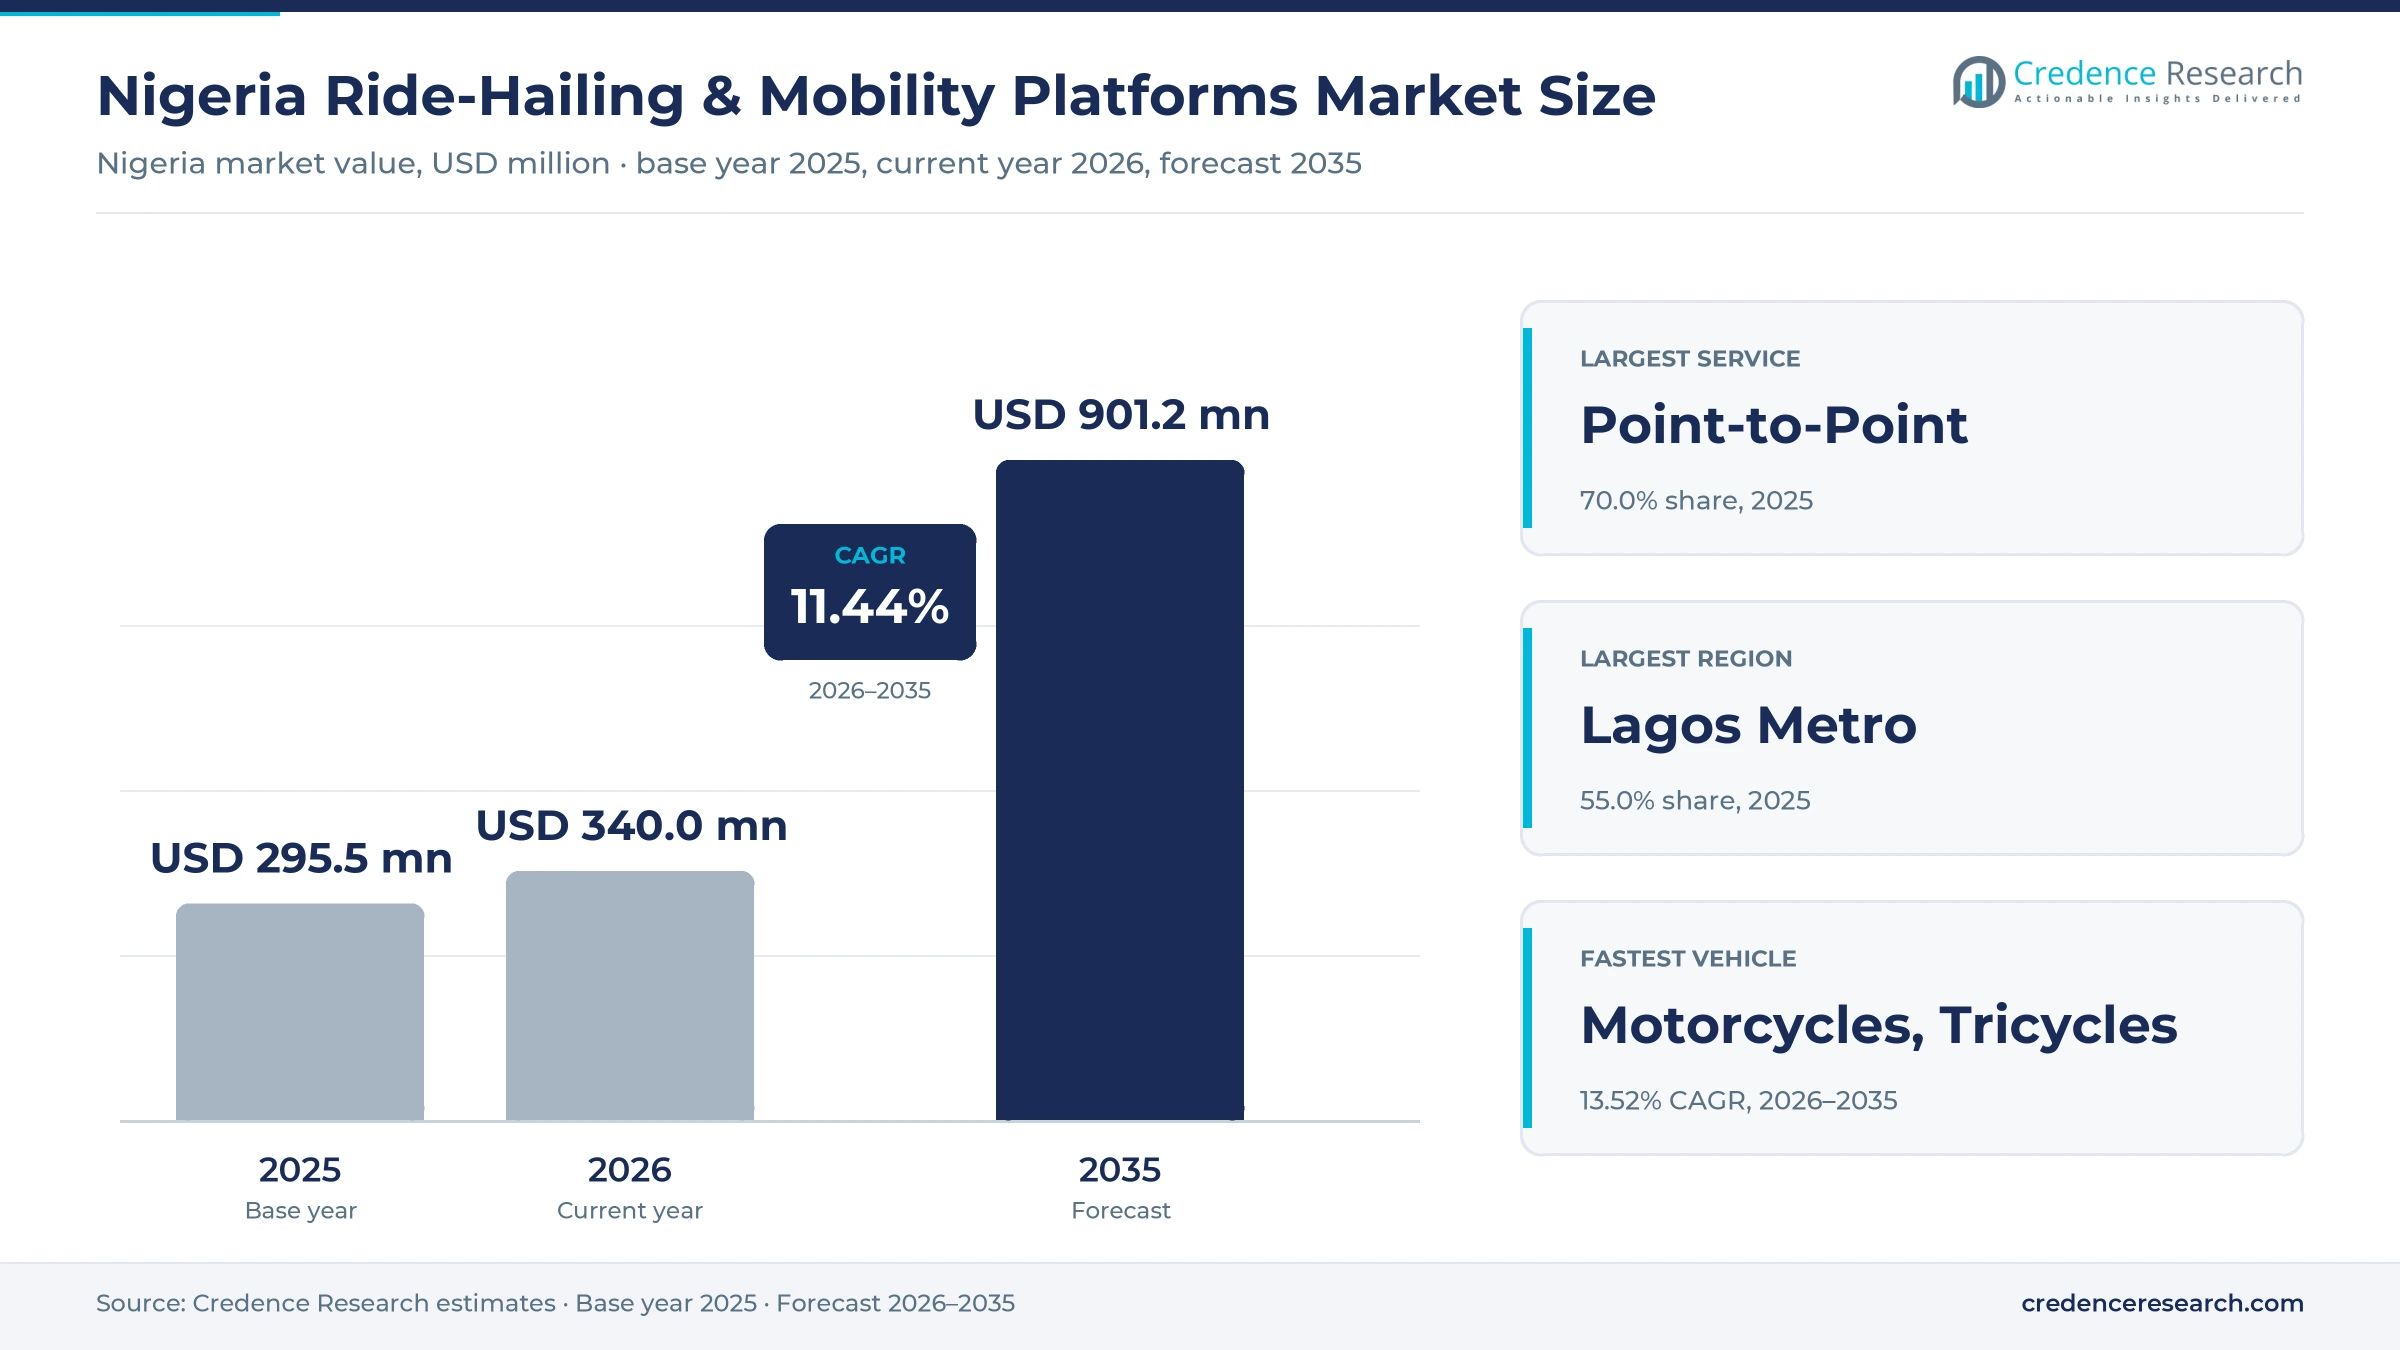
The Nigeria ride-hailing and mobility platforms market was valued at USD 295.5 million in 2025 and is projected to increase from USD 340.0 million in 2026 to USD 901.2 million by 2035, registering a CAGR of 11.44% during 2026–2035. Demand comes from commuters in Lagos, Abuja and Port Harcourt who book by phone as bus and motorcycle fares climb, and from employers that buy staff transport under contract. Lagos Metropolitan Area held the largest regional share, 55.0% in 2025, because the state combines the country's densest travel demand with its largest base of connected users. Other Urban Markets are the fastest-growing region at 12.43% a year as Bolt, inDrive and local apps extend beyond the largest cities. Uber wound down its Nigerian service on Sept. 2, 2026, which moves its riders and drivers toward Bolt, inDrive and LagRide. Fleet supply is also changing, with compressed natural gas conversions and electric tricycles now reaching platform drivers.
What does the Nigerian app-based mobility market count?
The estimate counts platform and operator revenue from trips booked by app or under contract in Nigeria. That revenue includes trip commissions, driver subscriptions, fleet lease and vehicle subscription payments, and corporate transport contracts. Riders usually pay in cash, by card or by transfer, and the fare is either set by the app or negotiated with the driver.
Street-hailed taxis, unbooked okada and keke trips, danfo buses, public rail and bus rapid transit fall outside the count. Food and parcel delivery, vehicle sales and fuel spending are excluded as well. The value chain runs from vehicle importers and assemblers through lessors and fleet partners to apps, drivers, riders and the state agencies that license them.
Nigeria Ride-Hailing & Mobility Platforms Market Insights
- The market grows from USD 295.5 million in 2025 to USD 901.2 million by 2035, an 11.44% CAGR over 2026–2035, as bookings spread beyond the largest metropolitan corridors.
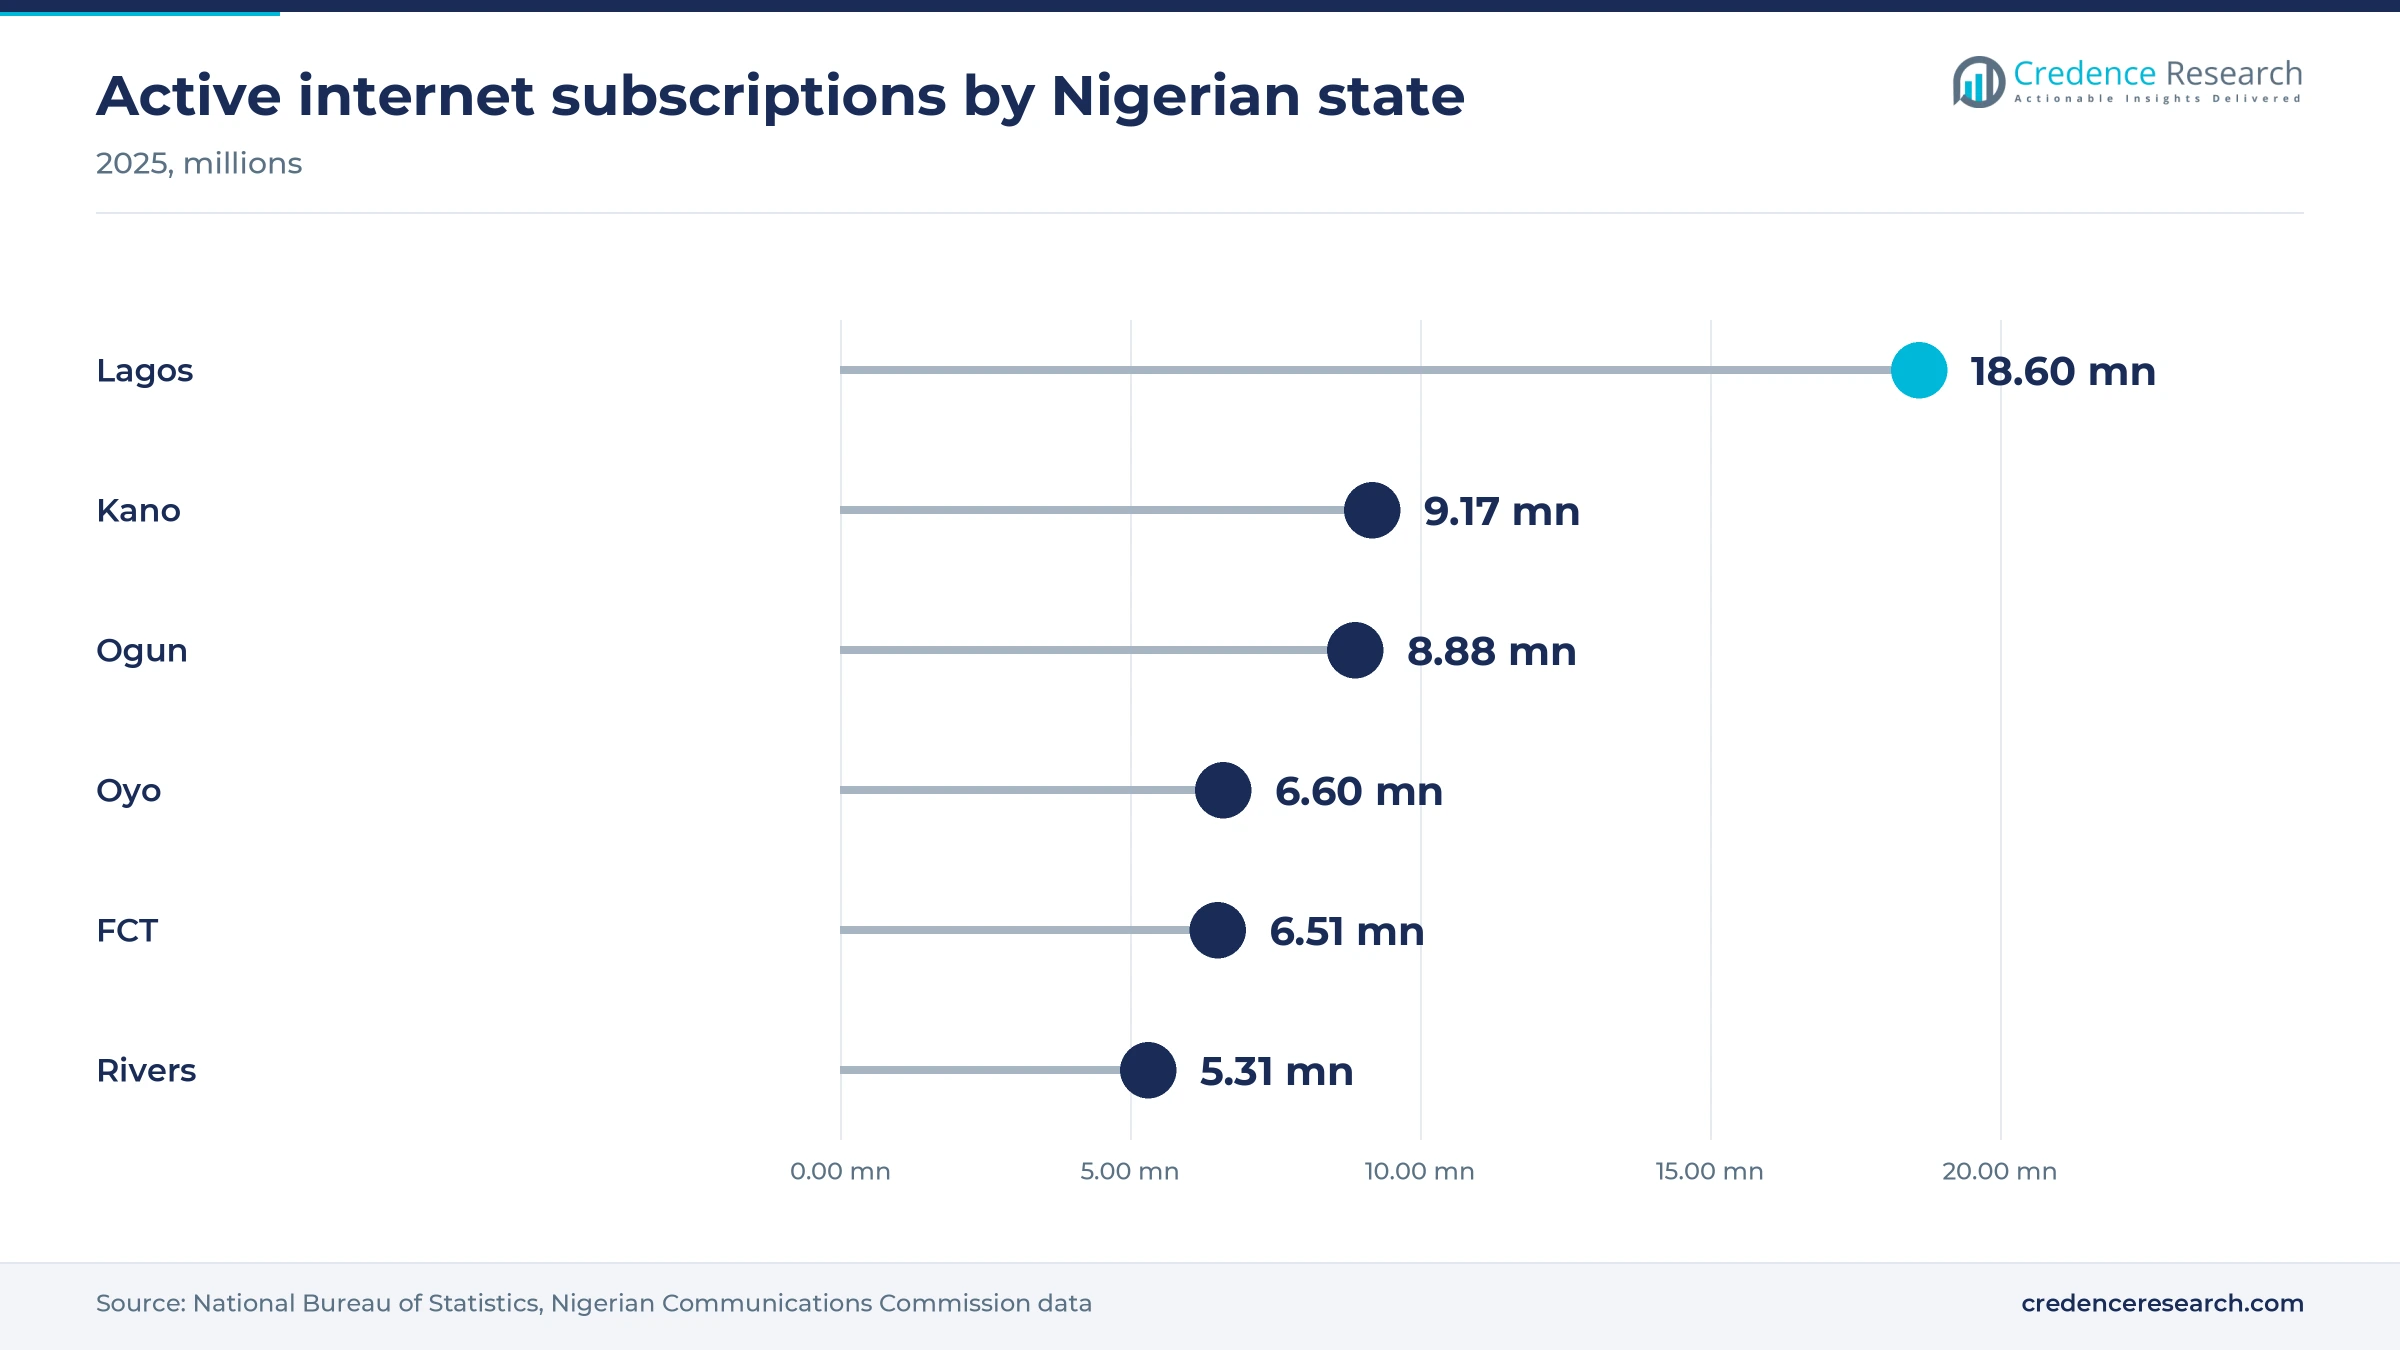
- Lagos Metropolitan Area held 55.0% of 2025 value, supported by 18.60 million active internet subscriptions in Lagos, the highest of any Nigerian state in 2025.
- Point-to-Point Ride-Hailing led service types with 70.0% of 2025 value, because short urban journeys make up most platform bookings.
- Uber wound down its Nigerian operations on Sept. 2, 2026, after 12 years, leaving Bolt, inDrive and LagRide as the largest remaining platforms.
- MAX raised $24 million in January 2026 and targets 250,000 financed drivers by 2027, which makes vehicle finance a central competitive lever.
Point-to-point car trips still earn most platform money
Why do point-to-point trips hold the largest service share?
Based on service type, the market is categorized into point-to-point ride-hailing, airport and intercity mobility, corporate and employee mobility, and scheduled shared mobility. Point-to-Point Ride-Hailing led with 70.0% of 2025 value because LAMATA, the Lagos transport agency, puts daily demand above 20 million trips, according to Nairametrics in April 2026, and apps mostly serve those short journeys. Scheduled shared mobility grows fastest at 13.31% a year as Shuttlers logged 2.1 million trips in 2025 on fixed Lagos and Abuja routes, according to Techeconomy in January 2026.
Which vehicles carry platform trips, and which are gaining?
Based on vehicle type, the market is categorized into economy sedans, premium sedans and SUVs, motorcycles and tricycles, and buses and shuttles. Economy Sedans led with 61.0% of 2025 value because the state-backed LagRide program alone contracted 5,000 GAC vehicles in July 2024, according to BusinessDay. Motorcycles and tricycles grow fastest at 13.52% a year as Bolt began a Lagos electric tricycle pilot with 25 units in May 2025, Techloy reported, and inDrive added a Keke option for trips of about 6 to 7 kilometers in October 2026.
How do on-demand and negotiated fares divide the market?
Based on delivery model, the market is categorized into on-demand, negotiated-fare, scheduled and subscription and pooled services. On-Demand led with 57.0% of 2025 value because Bolt, the broadest app-priced network, operated in 33 Nigerian cities and urban centers in 2024, according to BusinessDay. Negotiated-fare services grow fastest at 13.00% a year as Nairametrics put inDrive commission at 12% to 15% in April 2026, below rates of 20% or more on app-priced rivals, while Rida says riders and drivers agree each fare without commission, according to Legit.ng branded content in August 2023.
Where do platforms and operators earn their revenue?
Based on revenue model, the market is categorized into trip commission, driver subscription, fleet lease and vehicle subscription, and corporate contract income. Trip Commission led with 48.0% of 2025 value because Bolt's driver guide sets a 20% rate on Nigerian rides, Techeconomy reported in September 2026. Fleet lease and vehicle subscription grows fastest at 12.39% a year as MAX has credited more than 100,000 drivers and targets 250,000 by 2027, according to Nairametrics in January 2026. Its Ibadan plant can assemble up to 3,600 two- and three-wheel electric vehicles monthly.
| Segment Group | Leading Sub-segment | Share, 2025 | Fastest-growing Sub-segment | CAGR, 2026–2035 |
|---|---|---|---|---|
| By Service Type | Point-to-Point Ride-Hailing | 70.0% | Scheduled Shared Mobility | 13.31% |
| By Vehicle Type | Economy Sedans | 61.0% | Motorcycles and Tricycles | 13.52% |
| By Delivery Model | On-Demand | 57.0% | Negotiated-Fare | 13.00% |
| By Revenue Model | Trip Commission | 48.0% | Fleet Lease and Vehicle Subscription | 12.39% |
Request a Free Sample
Fill in your details and we'll send you a free sample report.
- Sample data tables & charts
- Research methodology
Connected riders and costly commuting lift app bookings
Expanding digital rider base widens the addressable market
Connectivity sets the ceiling on app bookings, and that ceiling has moved up sharply. The Nigerian Communications Commission recorded 157.4 million internet subscriptions in May 2026, up 11% from a year earlier, while broadband penetration reached 56.1% against 48.8% a year before, Techeconomy reported in August 2026. Nigerian state data for 2025 show 18.60 million active subscriptions in Lagos, 6.51 million in the Federal Capital Territory and 5.31 million in Rivers, according to National Bureau of Statistics figures compiled by Nairametrics. As a result, the three zones with the deepest platform supply are also the best connected. A wider base also helps apps outside the largest metros, and inDrive said in February 2026 that lightweight AI tools for mid-tier devices and unstable connections would be a trend this year.
Urban density and convenience favor booked trips
Crowded cities make a booked door-to-door trip worth paying for, particularly where fixed transit remains thin. World Bank data put Nigeria's 2025 population at 237.5 million and its urban growth at 3.32% a year, which adds riders every year in the largest metros. LAMATA says Lagos alone generates over 20 million trips a day, according to Nairametrics in April 2026. In contrast, the Blue Line rail carried about 3.5 million passengers in 2025, or roughly 15,000 people daily, allAfrica reported in May 2026. Rail therefore covers a small fraction of travel, which leaves a large gap for cars, keke and shuttles. Point-to-Point Ride-Hailing captures most of that gap, with 70.0% of 2025 value.
Clean-energy fleet transition lowers driver running costs
Cheaper fuel is the most direct route to better driver income, so clean-energy supply feeds platform capacity. The Presidential Initiative on CNG said in a January 2026 statement carried by the News Agency of Nigeria that over 100,000 vehicles now use the fuel, up from about 11,000 in 2023. The same statement counted 379 conversion centers and over 4,600 CNG tricycles, with a target of one million vehicles by 2027. Electric supply is smaller but already visible, since LagRide added 100 electric cars in September 2025 with a stated range above 333 kilometers, according to Techeconomy. These fleets also reduce exposure to petrol swings, which matters to the many drivers who lease rather than own vehicles.
Costlier informal transport narrows the fare gap
Fare inflation on buses and motorcycles has made app trips easier to justify for regular commuters. The National Bureau of Statistics Transport Fare Watch for April 2026 put the average intracity bus fare at N1,397.27 per drop, up 39.83% in a year, Nairametrics reported in June 2026. Okada fares rose faster, climbing 56.20% to N1,035.69 over the same period. In February 2026, Lagos recorded the highest intracity bus fare of any state at N1,537.09, according to The Guardian Nigeria. Safety adds a further reason to book, because 81% of respondents in a Bolt-commissioned survey from November 2025, with 250 people surveyed in four cities, said they felt safer on apps than on public transport.
Keke, CNG and flat-fee models reshape the fleet
Shift toward three-wheelers on short urban trips
Platforms are moving down the vehicle ladder to serve shorter and cheaper journeys. Bolt launched electric three-wheelers in Lagos in May 2025 with partner SGX Mobility, starting with 25 units and a goal of 1,000, Techloy reported. Drivers pay a lease-to-own price of N3.2 million after a N208,000 deposit, plus about N6,500 for a daily battery swap. LagRide added smaller vehicles under its Omnia initiative in November 2025, and Gatekeepers News reported in April 2026 that app korope and keke options had reached Lagos commuters. In turn, inDrive launched Keke in October 2026 for trips within about 6 to 7 kilometers, reflecting rules that keep keke off certain major roads.
Rise of flat-fee and lower-commission driver terms
Commission is now the main bargaining point, and rival pricing structures are multiplying as a result. SimpliRide launched in Lagos, Abuja and Port Harcourt in April 2025 with a flat N1,500 daily fee in place of commission, Legit.ng reported. Bolt charged 15% on its electric tricycle pilot, compared with about 25% on many car trips, according to Techloy. The Amalgamated Union of App-Based Transporters of Nigeria now wants commissions held at 10% or less, as reported by Techeconomy in September 2026. Because of this pressure, fixed-fee and lease income should gain weight over time. Credence Research expects Fleet Lease and Vehicle Subscription to grow fastest among revenue models, at 12.39% a year.
Opening in airport access after the FAAN framework
Airport trips offer high fares, and a clearer access framework would make that revenue dependable. The Federal Airports Authority of Nigeria directed Bolt on July 27, 2026, to stop commercial operations at its airports pending a concession agreement, Condia reported. The authority then cleared Bolt on Aug. 27, 2026, and said talks with other operators were continuing. Nairametrics reported rides from Murtala Muhammed airport to Ikeja at up to N30,000 by airport taxi against about N8,000 by e-hailing. Dataphyte found N30,000 on the airport car-hire desk in Abuja, compared with a N20,000 Bolt fare that same day. Operators holding formal airport terms can therefore price well below airport taxis and still earn healthy margins on each trip.
Opening in employer transport and scheduled shuttles
Employers and scheduled commuters offer steadier revenue than single trips, which makes this the clearest opening for new contracts. Shuttlers served more than 10,000 daily commuters and reached about 9.7 million lifetime journeys by January 2026, Techeconomy reported, and it is adding CNG buses to its fleet. Treepz has moved over five million passengers across African markets through shuttles and employee transport, the same publication said. LagRide has also announced a LagRide for Business subscription, according to The Guardian Nigeria. Fuel savings improve the case further, since Shuttlers said alternative-energy vehicles cut its operating expenses by more than half in 2025. Credence Research sees Scheduled Shared Mobility as the fastest service line, at 13.31% a year through 2035.
Fuel, commissions and airport access squeeze margins
Why does petrol volatility hit supply so quickly?
Petrol moved from about N800 a liter on Feb. 28, 2026, to N1,300 to N1,330 by mid-April in Lagos, a rise above 60% in about six weeks, Nairametrics reported. Drivers told the publication that a N20,000 fuel spend now returns far less fare income than before. As a result, drivers log off or cherry-pick trips during price spikes, which lengthens rider waits. CNG conversion and battery swapping for electric tricycles offer partial relief, although only 58 CNG stations across 28 states were open, The Guardian Nigeria reported.
How do commission disputes disrupt service?
App-based drivers in Lagos began a three-day strike in March 2026 with 10 demands, including lower commissions and a regulated base fare, Nairametrics reported. The union then announced an October 2026 Lagos shutdown, seeking a 10% ceiling, Techeconomy reported in September. Earlier, in June 2025, a Lagos Assembly committee ordered an audit of driver payments and agreements, according to Condia. Repeated stoppages hurt riders and platforms alike, so operators are likely to publish clearer trip earnings breakdowns to reduce conflict.
What does airport and state rule uncertainty cost?
The July 2026 FAAN directive used geofencing to block arrival-zone pickups, Condia reported, showing how quickly one agency can close a high-value route. Rules also differ by state, since Rivers officials told drivers in August 2022 to pay N12,000 for registration plus N200 monthly, TechCabal reported. A Ride-Hailing and Smart Mobility Bill was introduced in the National Assembly, according to an August 2025 Afriwise alert, although its final terms remain uncertain. Operators therefore budget for compliance separately in each city where they run.
Can platforms close the safety and vehicle finance gaps?
Safety concerns persist outside the app, with FCT Police recording 263 "one-chance" robbery cases in 2024, Dataphyte reported. Union demands in March 2026 included rider verification, working panic buttons and on-trip insurance. Finance is the second gap, as the earlier LagRide drive-to-own plan needed a N700,000 down payment and daily installments for four years, according to The Guardian Nigeria. Lessors carry default risk as a result, and MAX cut about 150 jobs while pivoting fully to electric vehicle financing, Nairametrics reported.
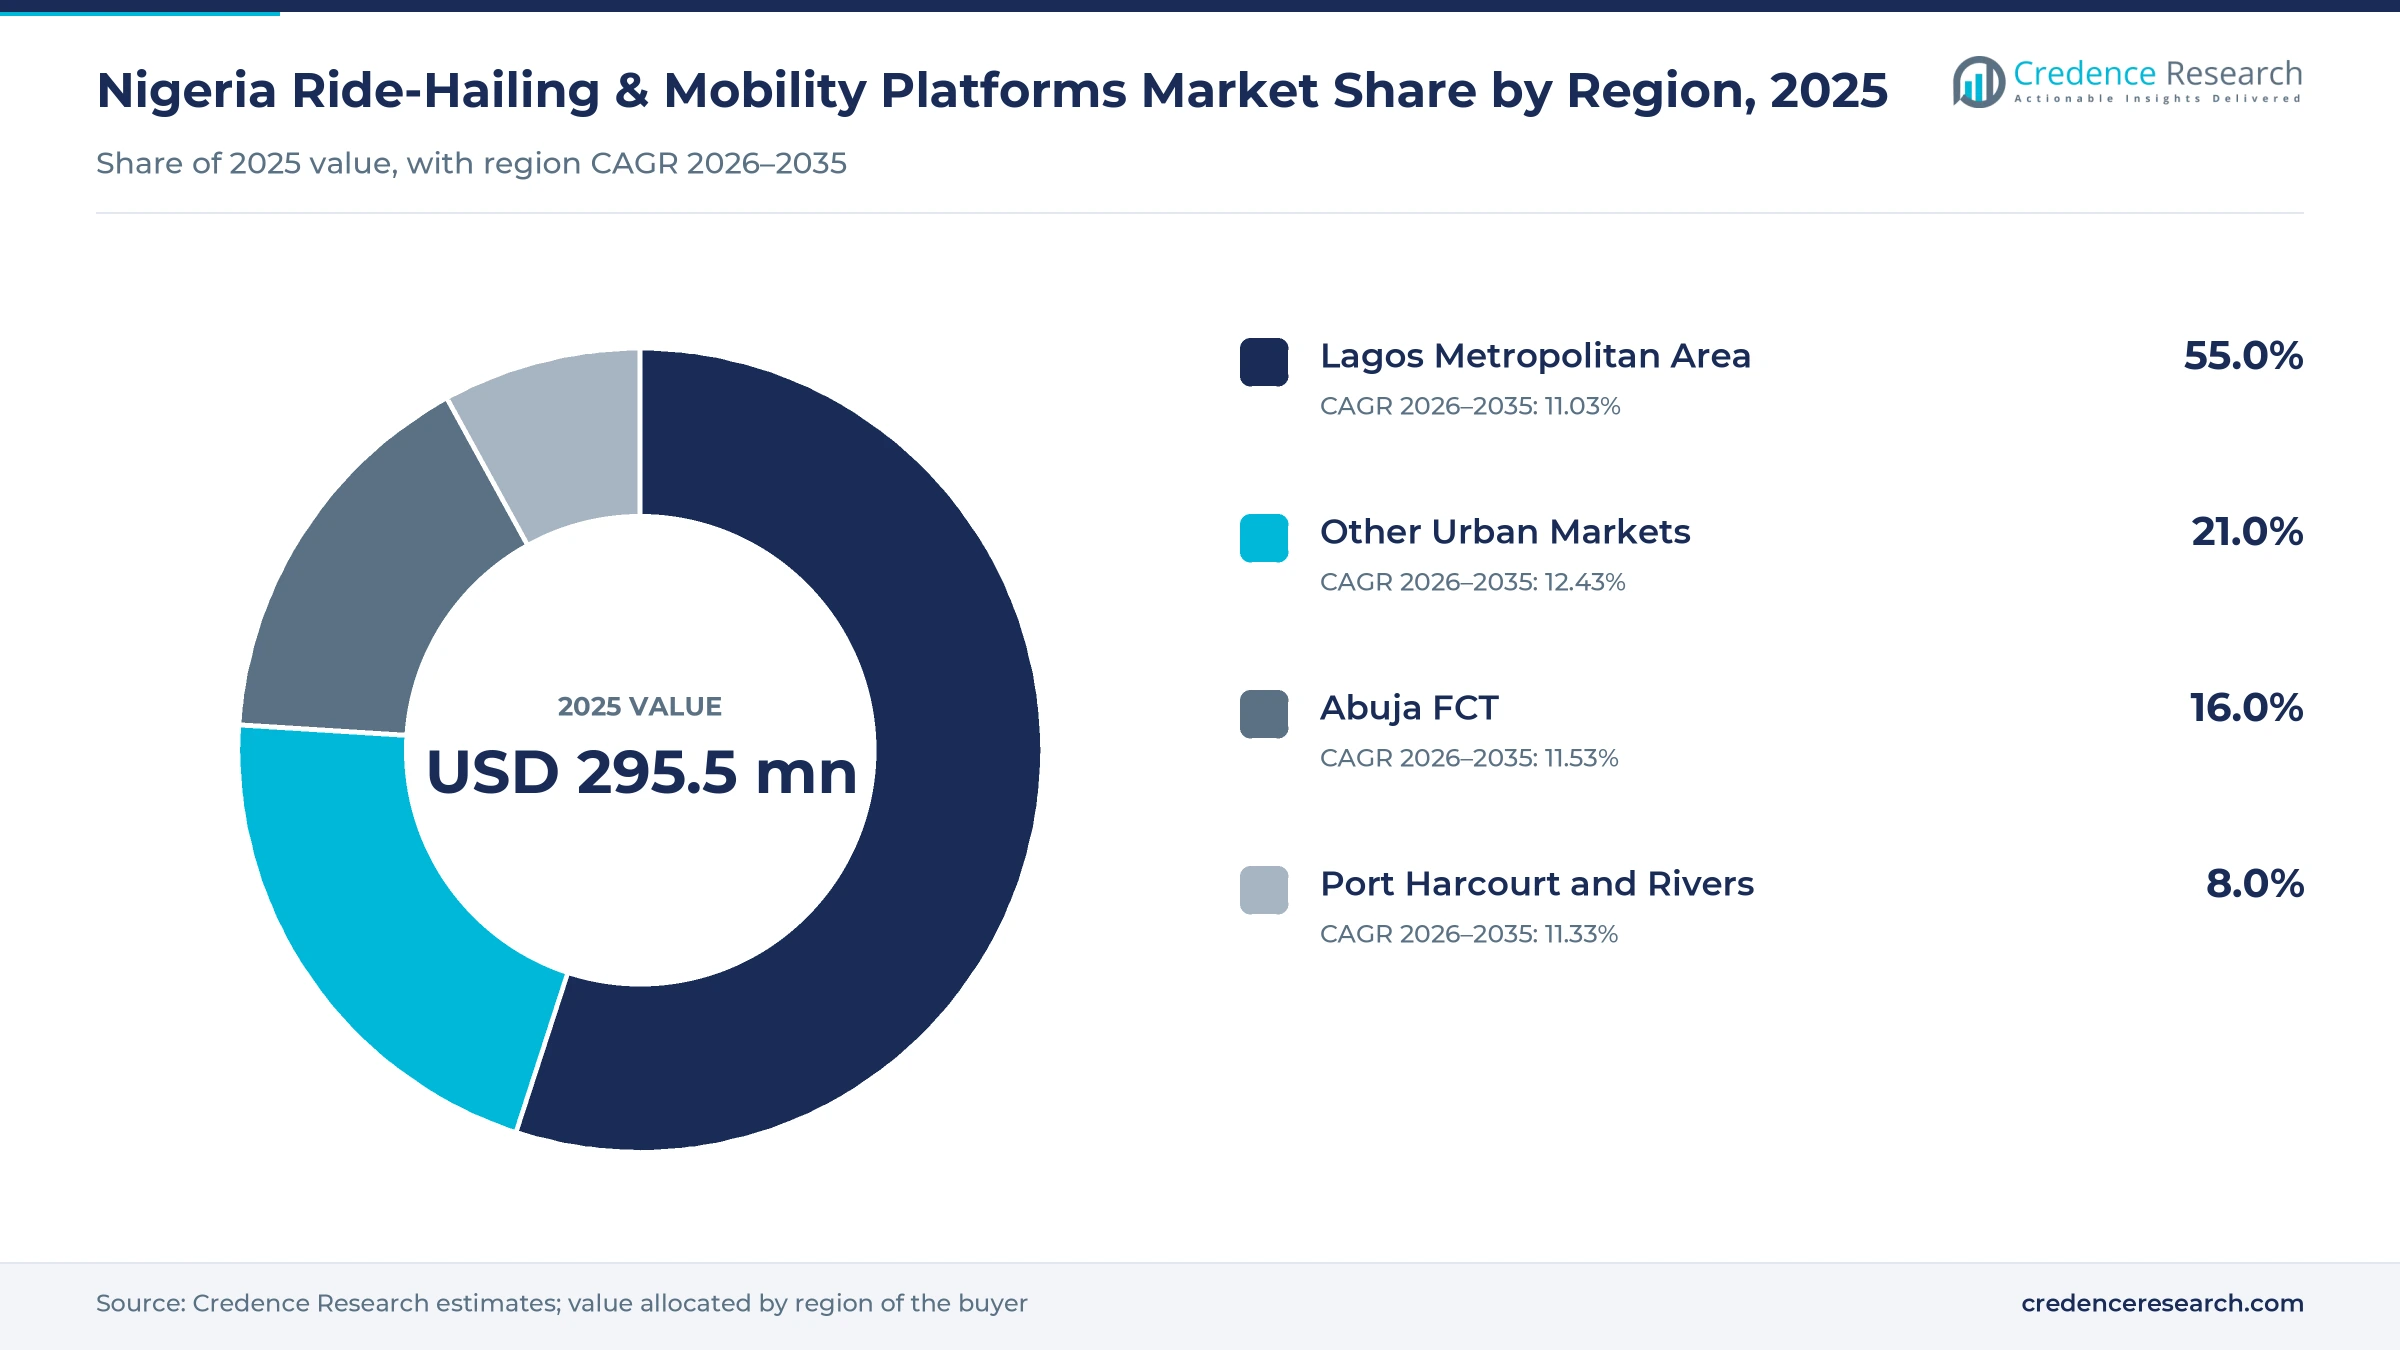
Lagos dominates while secondary cities grow faster
| Region | Value, 2025 (USD million) | Share, 2025 | CAGR, 2026–2035 |
|---|---|---|---|
| Lagos Metropolitan Area | 162.5 | 55.0% | 11.03% |
| Other Urban Markets | 62.1 | 21.0% | 12.43% |
| Abuja FCT | 47.3 | 16.0% | 11.53% |
| Port Harcourt and Rivers | 23.6 | 8.0% | 11.33% |
Lagos Metropolitan Area keeps the largest fleets and contests
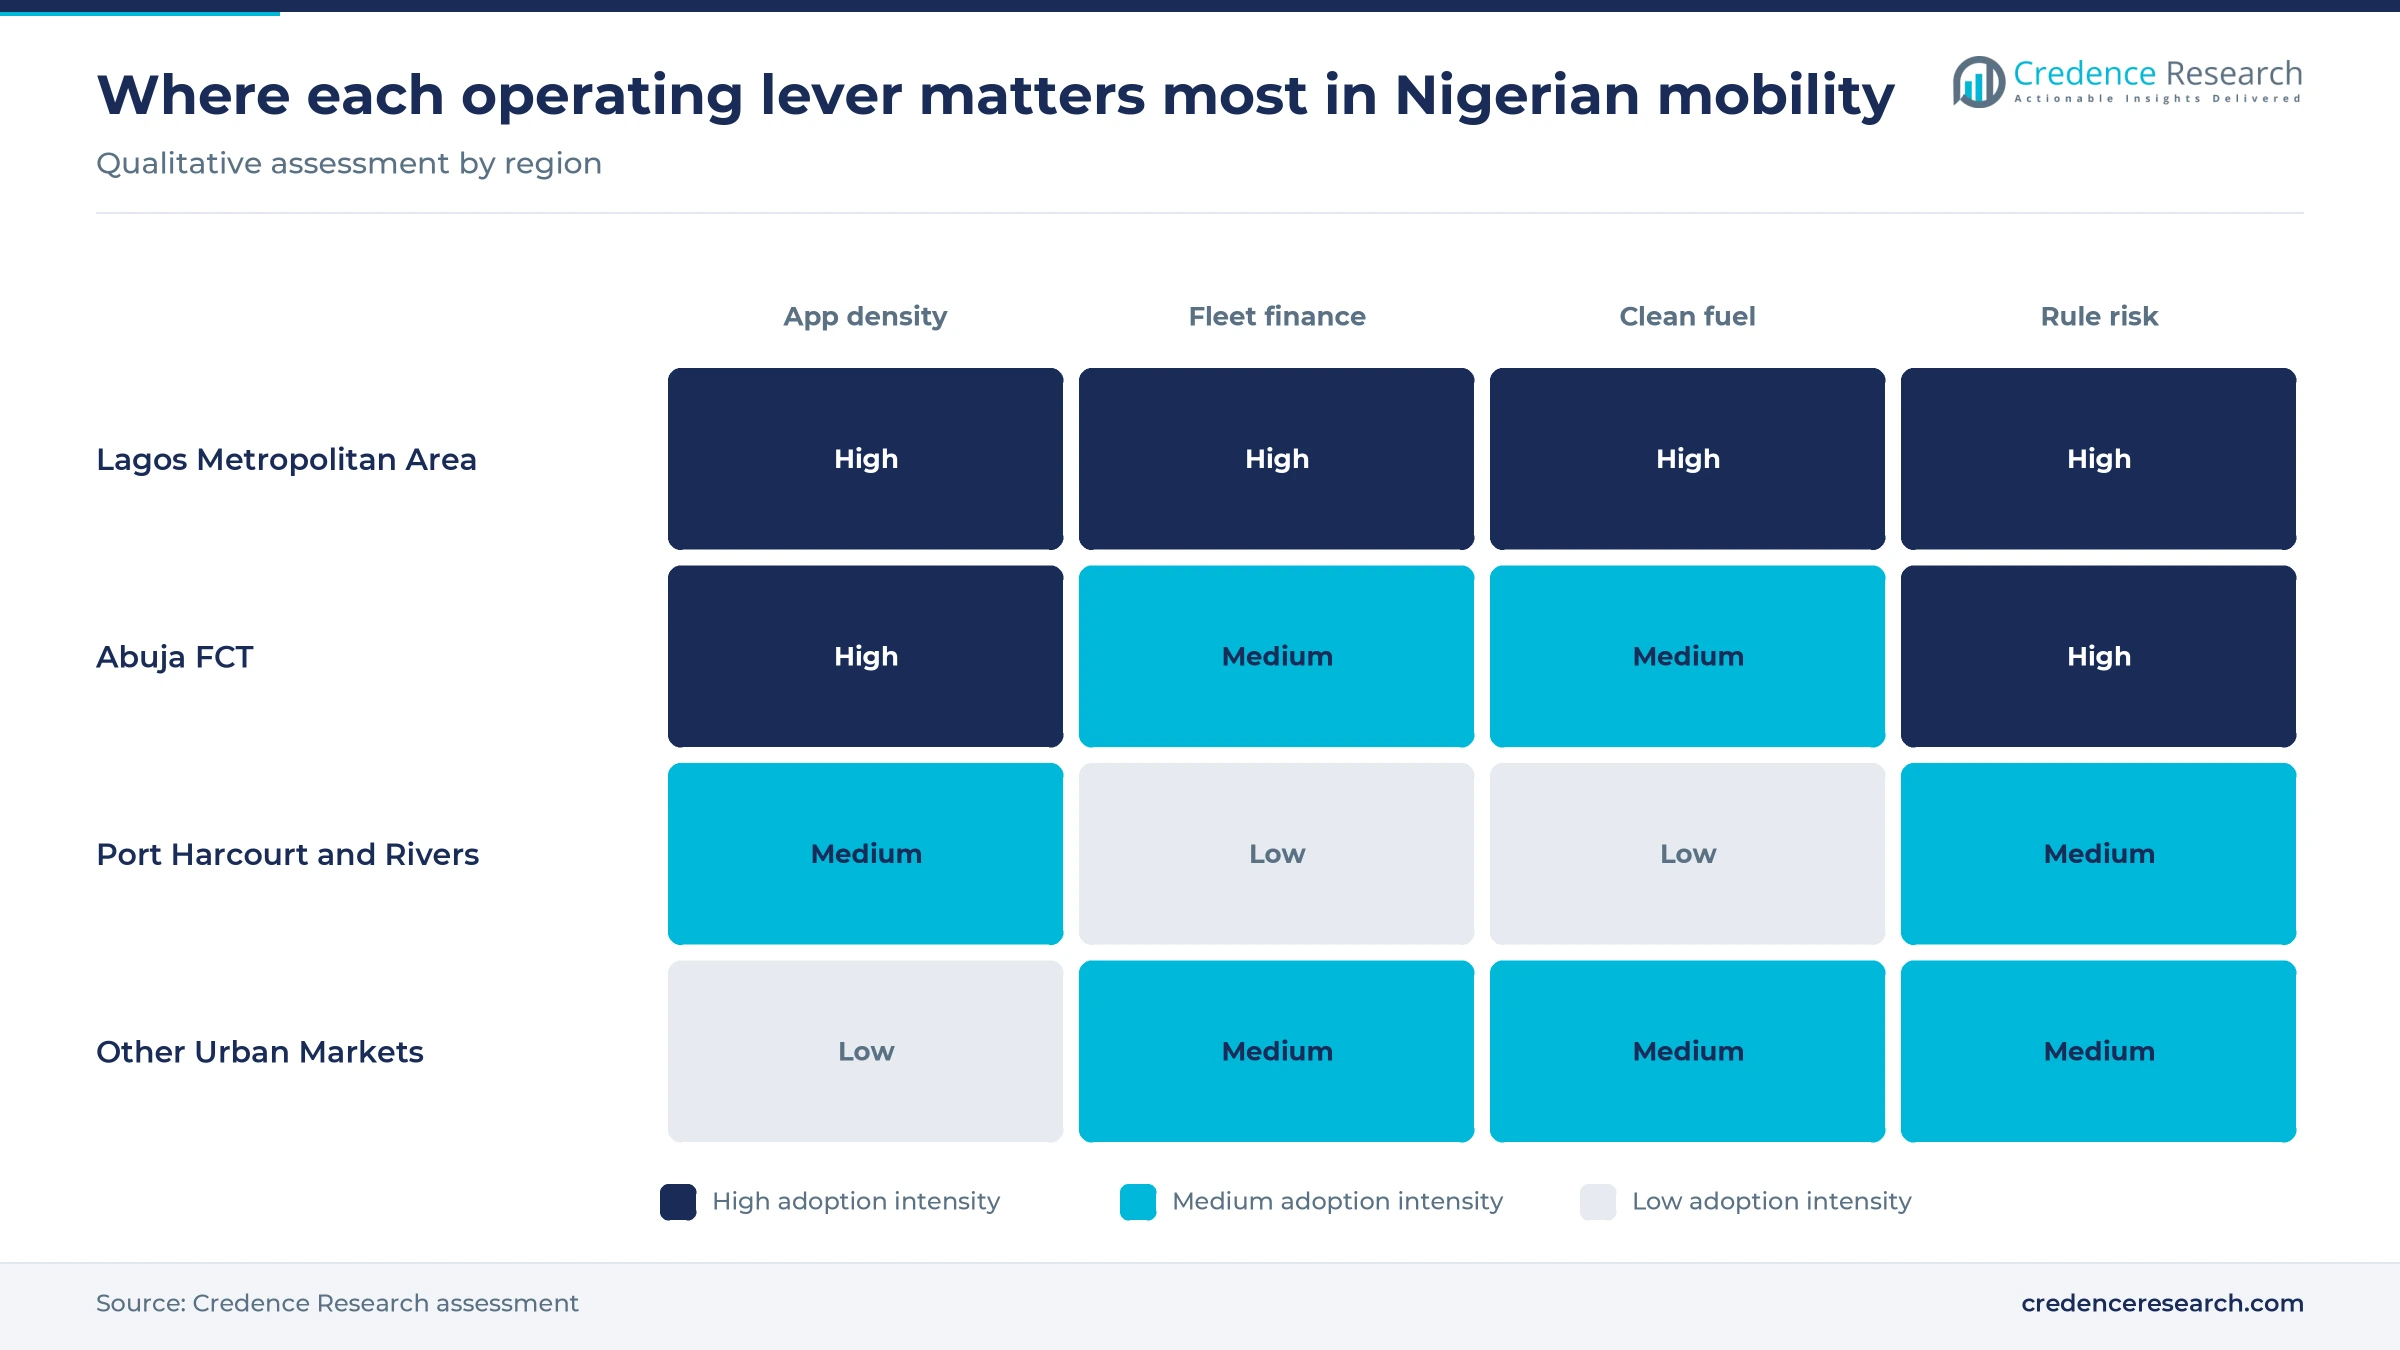
Lagos Metropolitan Area held 55.0% of 2025 value and grows at 11.03% a year. Lagos recorded 18.60 million active internet subscriptions in 2025, nearly three times the Federal Capital Territory, and it hosts the state-backed LagRide fleet. LagRide has stated an aim of capturing at least 70% of Lagos e-hailing, according to The Guardian Nigeria. Growth runs slightly below the national pace because the city is the most contested market and also the main site of driver strikes.
Abuja FCT pairs fixed commuter routes with airport demand
Abuja FCT held 16.0% of 2025 value and grows at 11.53% a year. The territory had 6.51 million active internet subscriptions in 2025, and inDrive chose it as its second Nigerian city in 2023, Techeconomy reported. Shuttlers also runs fixed routes there, which supports regular employer commuting in the capital. Nnamdi Azikiwe airport became a test of access rules in 2026, when Dataphyte documented a driver at position 251 in the queue and fares above Bolt under the FAAN car-hire system.
Port Harcourt and Rivers stays a contested oil-city market
Port Harcourt and Rivers held 8.0% of 2025 value and grows at 11.33% a year. Rivers counted 5.31 million active internet subscriptions in 2025, and Port Harcourt was one of four cities in the Bolt-commissioned rider survey published in November 2025. Bolt has operated in the city since August 2019, Nairametrics reported, and Rida added it in 2023. State charges have tested margins before, including the N12,000 vehicle registration levy reported by TechCabal in 2022.
Other urban markets gain as apps add secondary cities
Other Urban Markets held 21.0% of 2025 value and grow fastest at 12.43% a year. Kano, Ogun, Oyo and Kaduna each counted more than 6 million active internet subscriptions in 2025, which leaves room for apps beyond the largest metros. Bolt reached 33 cities and urban centers in 2024, and Delta-based Pickmeup had expanded to ten cities without earlier app service by November 2020, Arbiterz reported. MAX also assembles electric motorcycles and three-wheelers in Ibadan, close to this demand.
Exits, funding and rules that moved the sector
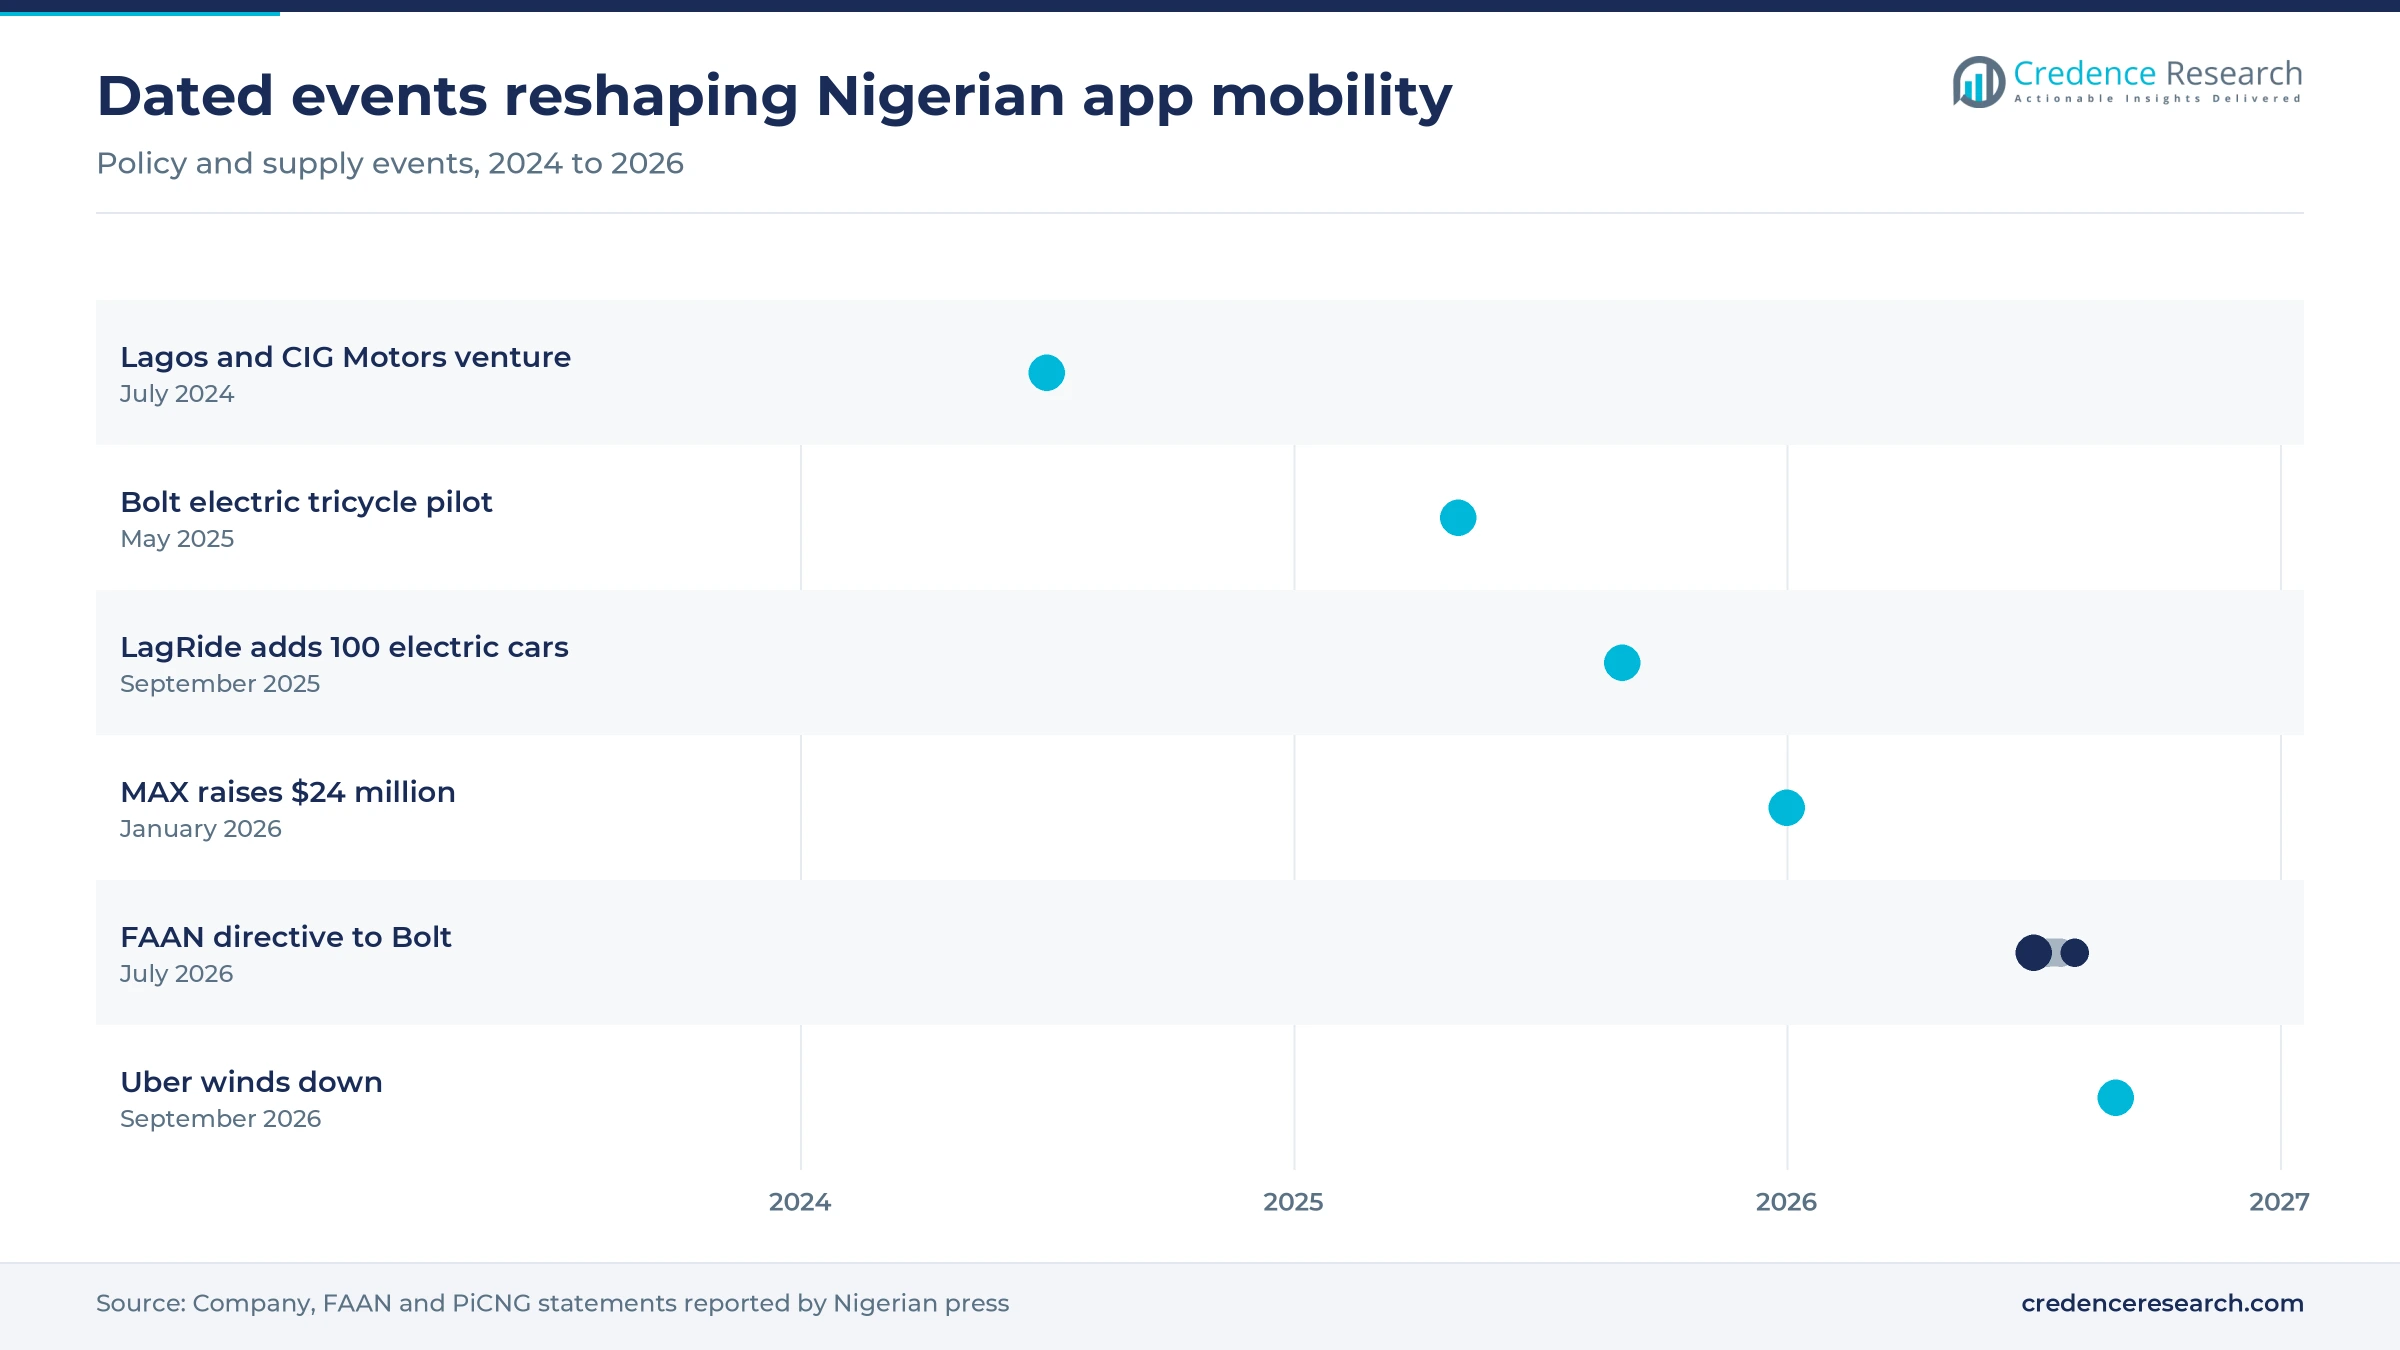
| Development | Status and market relevance |
|---|---|
| In July 2024, Lagos State and CIG Motors signed a $260 million joint venture covering 5,000 GAC vehicles for LagRide, about 1,000 of them electric. | Signed, delivered in tranches and the largest disclosed fleet commitment in the country |
| In May 2025, Bolt and SGX Mobility began a Lagos electric tricycle pilot with 25 units and a battery swap station in Surulere. | Pilot, with a stated goal of 1,000 units if results held |
| In January 2026, MAX raised $24 million in equity and debt to expand electric vehicle financing for drivers. | Closed, with a target of 250,000 financed drivers by 2027 |
| In August 2026, the Federal Airports Authority of Nigeria reached an operational framework with Bolt and cleared it to resume airport services. | Bolt cleared Aug. 27, with talks continuing for other operators |
| In September 2026, Uber wound down its Nigerian operations after 12 years, citing a review of business priorities. | Completed Sept. 2, moving riders and drivers to remaining apps |
Tools that decide cost and rider trust on Nigerian trips
- Price bidding lets a rider and driver agree a fare inside the app, a feature inDrive built on and Bolt now offers as well.
- Geofencing controls where pickups can appear, and FAAN relied on it in 2026 to keep apps out of airport arrival zones.
- Battery swapping cuts charging downtime for tricycle drivers, and Bolt's Surulere site in Lagos charges about N6,500 per daily swap.
- In-app safety tools such as GPS tracking and trip sharing made 97% of riders feel safer in the 2025 survey commissioned by Bolt.
Need a Custom Version of This Report?
Tailor the scope, geography, or segments to your exact requirements.
- Custom geography or segment scope
- Direct access to our analyst team
Bolt and LagRide lead the contest for space Uber left
Competition now centers on Bolt, inDrive and LagRide after Uber ended its Nigerian service on Sept. 2, 2026, following a review of its business priorities. Bolt competes on price and network reach, while inDrive competes on negotiated fares and lower commissions. LagRide relies on state backing and a dedicated GAC fleet, which gives it supply control that asset-light apps lack. Smaller local apps such as Rida and Pickmeup pursue fee differences and cities with thinner coverage. Shuttlers and Treepz sell scheduled seats and employer contracts instead of single trips, so they compete less directly on phone-booked fares. MAX has moved upstream into electric vehicle financing, and that position lets it supply drivers across platforms. The next contest among mobility platforms is for drivers, because the union campaign on commissions makes driver terms as visible as rider prices. Access to compressed natural gas and lease finance should separate operators further.
Which companies shape Nigerian app-based mobility?
| Company | Type | Role in the market |
|---|---|---|
| Bolt | App-priced marketplace | Operated in 33 Nigerian cities and urban centers in 2024 and holds FAAN airport clearance from Aug. 27, 2026. |
| Uber | Former marketplace | Launched in Lagos in 2014 and wound down Nigerian operations on Sept. 2, 2026. |
| inDrive | Negotiated-fare marketplace | Expanded from Lagos to Abuja in 2023 and launched Keke tricycles in October 2026. |
| LagRide | State-backed fleet platform | Linked to the $260 million Lagos and CIG Motors venture for 5,000 GAC vehicles. |
| Rida | Negotiated-fare marketplace | Added Port Harcourt and Benin to Abuja and Lagos in 2023 and states it charges no driver commission. |
| Shuttlers | Scheduled shared mobility | Runs fixed routes in Lagos and Abuja and completed 2.1 million trips in 2025. |
| Treepz | Shuttle and employee transport | Offers long-distance shuttles and corporate deployments and has moved over five million passengers across Africa. |
| MAX | Electric vehicle financier | Credited more than 100,000 drivers and assembles two- and three-wheel vehicles in Ibadan. |
| Pickmeup | Local marketplace | Delta-based app that reported a 15% driver fee and ten-city coverage in November 2020. |
Driver economics will decide who wins Nigerian trips
Credence Research's view is that competition among mobility platforms after Uber will be decided on the supply side rather than by rider discounts. Uber's departure hands volume to the remaining apps, yet it also removes an alternative that many drivers used to balance their income. Bolt therefore holds the strongest position on reach, but it faces the most direct union pressure on commission. inDrive and flat-fee apps gain whenever fuel spikes push drivers to protect margins. The most durable positions should belong to operators that link lower-cost vehicles, predictable airport access and transparent earnings statements, since those three items answer the union demands directly.
How the Nigerian market estimate was built
The report uses 2025 as the base year and 2035 as the forecast year, with market values taken from the Credence Research model. Segment and regional splits are Credence Research estimates built from public evidence, including state internet subscription data, fare statistics, company announcements, regulator statements and press reports on fleets and commissions. A separate bottom-up check of active vehicles, fares, platform take rates and lease payments was used to test the size. Published sources were opened and read for this edition, and no interviews or surveys were conducted by Credence Research.
Fleet finance and cleaner fuels shape growth to 2035
Revenue at Nigerian mobility platforms should reach USD 901.2 million by 2035, growing at 11.44% a year over 2026–2035, with bookings shifting steadily toward cheaper vehicles and secondary cities. The Presidential Initiative on CNG targets one million vehicles by 2027, and MAX targets 250,000 financed drivers in the same year, so both goals are near-term tests of the fleet story. Lagos Metropolitan Area should slip gradually as Other Urban Markets expand, although it stays the largest zone throughout the period. The main risks are petrol swings, unresolved commission disputes and any national or state rules that raise compliance costs before operators have rebuilt supply after Uber's exit.
Frequently Asked Questions
How big is the Nigeria ride-hailing and mobility platforms market?
Which region leads the market?
Which service type is the largest?
Is Uber still operating in Nigeria?
Why are ride-hailing drivers striking in Lagos?
How is clean energy affecting platform fleets?
Which vehicle type is growing fastest?
Which companies operate in this market?
Table of Content
Chapter 1 Market Segmentation
- 1.1 Segmentation Framework
- 1.1.1 Product and Service Classification
- 1.1.2 Application and End-Use Classification
- 1.1.3 Technology and Solution Classification
- 1.1.4 Customer and Distribution Channel Classification
- 1.1.5 Geographic Segmentation
- 1.1.6 Market Segment Definitions and Boundaries
- 1.2 By Service Type
- 1.2.1 Point-to-Point Ride-Hailing
- 1.2.2 Airport and Intercity Mobility
- 1.2.3 Corporate and Employee Mobility
- 1.2.4 Scheduled Shared Mobility
- 1.3 By Vehicle Type
- 1.3.1 Economy Sedans
- 1.3.2 Premium Sedans and SUVs
- 1.3.3 Motorcycles and Tricycles
- 1.3.4 Buses and Shuttles
- 1.4 By Delivery Model
- 1.4.1 On-Demand
- 1.4.2 Negotiated-Fare
- 1.4.3 Scheduled
- 1.4.4 Subscription and Pooled
- 1.5 By Revenue Model
- 1.5.1 Trip Commission
- 1.5.2 Driver Subscription
- 1.5.3 Fleet Lease and Vehicle Subscription
- 1.5.4 Corporate Contract
Chapter 2 Introduction
- 2.1 Report Objectives and Scope
- 2.2 Product Definition and Industry Terminology
- 2.3 Market Inclusions and Exclusions
- 2.4 Research Process
- 2.4.1 Primary Research and Expert Interviews
- 2.4.2 Secondary Research and Source Review
- 2.4.3 Top-Down and Bottom-Up Estimation
- 2.4.4 Data Triangulation and Verification
- 2.5 Market Size Measurement Basis
- 2.5.1 2025: USD 295.5 million → 2035: USD 901.2 million
- 2.6 Historical and Forecast Reference Periods
- 2.6.1 Historical Period: 2018-2025
- 2.6.2 Base Year: 2025
- 2.6.3 Forecast Period: 2025-2035
- 2.7 Research Assumptions and Limitations
Chapter 3 Executive Summary
- 3.1 Market Snapshot and Key Findings
- 3.2 Base-Year Market Size, 2025
- 3.3 Forecast Market Size, 2035
- 3.4 Revenue and Volume Growth Outlook
- 3.5 Key Demand and Supply Indicators
- 3.6 Leading Market Segments
- 3.7 Fastest-Growing Market Opportunities
- 3.8 Regional Performance Highlights
- 3.9 Technology and Industry Transformation
- 3.10 Competitive Landscape Summary
- 3.11 Analyst View and Strategic Implications
Chapter 4 Nigeria Ride-Hailing & Mobility Platforms Market Trends and Developments
- 4.1 Historical Industry Development, 2018-2025
- 4.2 Recent Market Trends and Developments
- 4.3 Demand and Customer Behavior Trends
- 4.4 Technology and Product Innovation
- 4.5 Artificial Intelligence, Automation and Digitalization
- 4.6 Local Manufacturing and Supply Chain Realignment
- 4.7 Industry Partnerships, Mergers and Acquisitions
- 4.8 Sustainability and Circular Economy Developments
- 4.9 Government and Private Sector Investment Trends
- 4.10 Emerging Business Models and Commercialization
- 4.11 Industry Developments and Announcements
Chapter 5 Nigeria Ride-Hailing & Mobility Platforms Market Production, Supply and Demand Analysis
- 5.1 Demand Trend and Consumption Analysis, 2018-2025
- 5.2 Demand Forecast, 2025-2035
- 5.3 Production and Output Trend, 2018-2025
- 5.4 Production and Output Forecast, 2025-2035
- 5.5 Installed Capacity and Capacity Utilization
- 5.6 Company-Wise Production Plants and Statistics
- 5.6.1 Installed Production Capacity
- 5.6.2 Actual Production
- 5.6.3 Planned Capacity and Expansion Targets
- 5.7 Supply Chain Structure and Procurement Trends
- 5.8 Supply-Demand Gap and Bottlenecks
- 5.9 Import Dependence and Sourcing Structure
- 5.10 Contract Manufacturing and Outsourcing
- 5.11 Regional Supply and Demand Concentration
Chapter 6 Nigeria Ride-Hailing & Mobility Platforms Market Pricing Analysis
- 6.1 Pricing Structure and Measurement
- 6.2 Historical Pricing Trends, 2018-2025
- 6.3 Pricing Outlook, 2025-2035
- 6.4 Average Selling Price and Unit Economics
- 6.5 Pricing by Product and Market Segment
- 6.6 Geographic Pricing Differences
- 6.7 Key Input, Energy, Labor and Logistics Costs
- 6.8 Contract Pricing and Purchasing Models
- 6.9 Pricing Sensitivity and Competitive Positioning
- 6.10 Price, Margin and Profitability Implications
Chapter 7 Nigeria Ride-Hailing & Mobility Platforms Market Dynamics
- 7.1 Market Growth Drivers
- 7.1.1 Demand-Side Drivers
- 7.1.2 Technology and Innovation Drivers
- 7.1.3 Infrastructure and Investment Drivers
- 7.1.4 Regulatory and Policy Drivers
- 7.2 Market Restraints
- 7.2.1 Cost and Affordability Constraints
- 7.2.2 Technology and Adoption Barriers
- 7.2.3 Supply Chain and Operational Constraints
- 7.3 Market Challenges
- 7.3.1 Competitive Pressure and Margin Erosion
- 7.3.2 Skills, Infrastructure and Implementation Gaps
- 7.4 Emerging Market Opportunities
- 7.5 Market Dynamics Impact and Time-Horizon Assessment
Chapter 8 Nigeria Ride-Hailing & Mobility Platforms Value Chain Analysis
- 8.1 Industry Value Chain Overview
- 8.2 Upstream Suppliers and Critical Inputs
- 8.3 Technology and Component Providers
- 8.4 Manufacturing or Service Delivery
- 8.5 Distribution, Channel Partners and Integrators
- 8.6 Downstream Applications and End Users
- 8.7 Value Addition and Profit Pools
- 8.8 Vertical Integration and Outsourcing
- 8.9 Supplier Concentration and Risk
- 8.10 Supply Chain Localization and Resilience
Chapter 9 Nigeria Ride-Hailing & Mobility Platforms Market Regulations and Policies
- 9.1 Relevant Laws, Standards and Compliance Frameworks
- 9.2 Product, Service, Safety and Quality Requirements
- 9.3 Government Policies, Incentives and Subsidies
- 9.4 Imports, Exports and Trade Barriers
- 9.5 Public Procurement and Local Content Requirements
- 9.6 Environmental and Sustainability Compliance
- 9.7 Upcoming Policy Changes and Market Implications
Chapter 10 Nigeria Ride-Hailing & Mobility Platforms Market Hotspots and Opportunities
- 10.1 Market Opportunity Mapping and Growth Hotspots
- 10.2 High-Growth Applications and Customer Groups
- 10.3 Underserved Markets and White-Space Opportunities
- 10.4 Emerging Technology and Product Opportunities
- 10.5 New Capacity and Investment Hotspots
- 10.6 Market Entry and Expansion Opportunities
- 10.7 Distribution and Partnership Opportunities
- 10.8 Near-Term and Long-Term Commercial Potential
- 10.9 Opportunity Attractiveness and Execution Risks
Chapter 11 Nigeria Ride-Hailing & Mobility Platforms Market Outlook, 2025-2035
- 11.1 Market Size and Analysis
- 11.1.1 Revenue (Market Measurement: 2025: USD 295.5 million → 2035: USD 901.2 million)
- 11.1.2 Market Volume and Quantity Sold
- 11.1.3 Historical Market Size, 2018-2025
- 11.1.4 Base-Year Market Size, 2025
- 11.2 Market Forecast, 2025-2035
- 11.2.1 Revenue Forecast to 2035
- 11.2.2 Volume Forecast to 2035
- 11.2.3 CAGR and Year-on-Year Growth
- 11.2.4 Incremental Revenue Opportunity
- 11.3 Forecast Assumptions and Scenario Analysis
- 11.3.1 Base-Case Forecast
- 11.3.2 Optimistic and Conservative Scenarios
- 11.3.3 Technology, Pricing and Policy Sensitivities
- 11.4 Market Attractiveness and Growth Outlook
Chapter 12 Nigeria Ride-Hailing & Mobility Platforms Market Segmentation and Outlook
- 12.1 Segmentation Summary and Market Shares, 2025
- 12.2 Largest and Fastest-Growing Segments
- 12.3 By Service Type - Market Size and Forecast, 2025-2035
- 12.3.1 Segment Definition and Scope
- 12.3.2 Historical Market Size, 2018-2025
- 12.3.3 Revenue Forecast, 2025-2035
- 12.3.4 Volume Forecast, 2025-2035
- 12.3.5 Base-Year Market Share, 2025
- 12.3.6 Segment CAGR and Growth Drivers
- 12.3.7 Subsegment Market Size and Forecast
- 12.3.7.1 Point-to-Point Ride-Hailing
- 12.3.7.2 Airport and Intercity Mobility
- 12.3.7.3 Corporate and Employee Mobility
- 12.3.7.4 Scheduled Shared Mobility
- 12.3.8 Subsegment Pricing and Adoption Trends
- 12.3.9 Leading Suppliers and Competition
- 12.3.10 Regional Demand and Opportunities
- 12.4 By Vehicle Type - Market Size and Forecast, 2025-2035
- 12.4.1 Segment Definition and Scope
- 12.4.2 Historical Market Size, 2018-2025
- 12.4.3 Revenue Forecast, 2025-2035
- 12.4.4 Volume Forecast, 2025-2035
- 12.4.5 Base-Year Market Share, 2025
- 12.4.6 Segment CAGR and Growth Drivers
- 12.4.7 Subsegment Market Size and Forecast
- 12.4.7.1 Economy Sedans
- 12.4.7.2 Premium Sedans and SUVs
- 12.4.7.3 Motorcycles and Tricycles
- 12.4.7.4 Buses and Shuttles
- 12.4.8 Subsegment Pricing and Adoption Trends
- 12.4.9 Leading Suppliers and Competition
- 12.4.10 Regional Demand and Opportunities
- 12.5 By Delivery Model - Market Size and Forecast, 2025-2035
- 12.5.1 Segment Definition and Scope
- 12.5.2 Historical Market Size, 2018-2025
- 12.5.3 Revenue Forecast, 2025-2035
- 12.5.4 Volume Forecast, 2025-2035
- 12.5.5 Base-Year Market Share, 2025
- 12.5.6 Segment CAGR and Growth Drivers
- 12.5.7 Subsegment Market Size and Forecast
- 12.5.7.1 On-Demand
- 12.5.7.2 Negotiated-Fare
- 12.5.7.3 Scheduled
- 12.5.7.4 Subscription and Pooled
- 12.5.8 Subsegment Pricing and Adoption Trends
- 12.5.9 Leading Suppliers and Competition
- 12.5.10 Regional Demand and Opportunities
- 12.6 By Revenue Model - Market Size and Forecast, 2025-2035
- 12.6.1 Segment Definition and Scope
- 12.6.2 Historical Market Size, 2018-2025
- 12.6.3 Revenue Forecast, 2025-2035
- 12.6.4 Volume Forecast, 2025-2035
- 12.6.5 Base-Year Market Share, 2025
- 12.6.6 Segment CAGR and Growth Drivers
- 12.6.7 Subsegment Market Size and Forecast
- 12.6.7.1 Trip Commission
- 12.6.7.2 Driver Subscription
- 12.6.7.3 Fleet Lease and Vehicle Subscription
- 12.6.7.4 Corporate Contract
- 12.6.8 Subsegment Pricing and Adoption Trends
- 12.6.9 Leading Suppliers and Competition
- 12.6.10 Regional Demand and Opportunities
- 12.7 Segment Growth Comparison
- 12.8 Segment Attractiveness and Priority Matrix
Chapter 13 Nigeria Ride-Hailing & Mobility Platforms Geographic Market Outlook, 2025-2035
- 13.1 Domestic Market Distribution and Demand Clusters
- 13.2 State- or Province-Wise Market Size and Forecast, 2025-2035
- 13.3 City and Metropolitan Market Outlook
- 13.4 Industrial, Manufacturing and Commercial Clusters
- 13.5 Geographic Concentration of Key End Users
- 13.6 Local Pricing and Purchasing Differences
- 13.7 Domestic Production Facilities and Capacity Map
- 13.8 Local Infrastructure and Project Pipeline
- 13.9 State-Level Policy and Incentive Differences
- 13.10 Subnational Investment Hotspots and Opportunities
- 13.11 Distribution and Logistics Networks
- 13.12 Domestic Competitive Footprint
Chapter 14 Nigeria Ride-Hailing & Mobility Platforms Technology, Innovation and Sustainability Outlook
- 14.1 Technology Landscape and Maturity
- 14.2 Product, Process and Service Innovation
- 14.3 AI, Automation and Digital Tools in the Industry
- 14.4 Technology Adoption and Performance Benchmarking
- 14.5 Innovation Pipeline and R&D Investment
- 14.6 Patent and Intellectual Property Trends
- 14.7 Energy Efficiency and Resource Management
- 14.8 Sustainability, Recycling and Circularity
- 14.9 Technology Roadmap, 2025-2035
- 14.10 Risks of Obsolescence and Technology Substitution
Chapter 15 Nigeria Ride-Hailing & Mobility Platforms Market Key Strategic Imperatives
- 15.1 Growth and Market Entry Priorities
- 15.2 High-Return Products and Segments
- 15.3 Pricing, Profitability and Cost Optimization
- 15.4 Technology Investment and Product Differentiation
- 15.5 Supply Chain Localization and Resilience
- 15.6 Distribution and Customer Acquisition
- 15.7 Partnership, Acquisition and Capacity Strategy
- 15.8 Regional Expansion Priorities
- 15.9 Short-, Medium- and Long-Term Actions
Chapter 16 Competition Outlook
- 16.1 Industry Competition Characteristics
- 16.2 Market Structure and Concentration
- 16.3 Market Share and Competitive Positioning, 2025
- 16.4 Company-Wise Revenue and Product Benchmarking
- 16.5 Production and Service Capacity Benchmarking
- 16.6 Technology, Pricing and Differentiation
- 16.7 Regional Footprint and Distribution Strength
- 16.8 Mergers, Acquisitions and Strategic Alliances
- 16.9 New Entrants and Competitive Threats
- 16.10 Porter's Five Forces and Industry Attractiveness
- 16.11 Competitive Outlook, 2025-2035
Chapter 17 Company Profiles
- 17.1 Company Coverage and Selection Criteria
- 17.2 Bolt
- 17.2.1 Business Description
- 17.2.2 Company Ownership and Geographic Presence
- 17.2.3 Product and Service Portfolio
- 17.2.4 Manufacturing and Operating Footprint
- 17.2.5 Production Capacity and Expansion Plans
- 17.2.6 Financial Performance and Investment
- 17.2.7 Market Share and Competitive Position
- 17.2.8 Technology and Innovation Capabilities
- 17.2.9 Strategic Alliances or Partnerships
- 17.2.10 Recent Developments
- 17.2.11 Growth Strategy and Outlook
- 17.3 Uber
- 17.4 inDrive
- 17.5 LagRide
- 17.6 Rida
- 17.7 Shuttlers
- 17.8 Treepz
- 17.9 MAX
- 17.10 Pickmeup
- 17.11 3YP Technologies
- 17.12 Other Relevant Market Participants
Note: Every listed company is profiled on the structure shown under the first company. The company list is preliminary and may change based on research findings, market developments, data availability and client requirements.
Chapter 18 Disclaimer
- 18.1 Research and Forecast Disclaimer
- 18.2 Data Source and Estimation Limitations
Note: The depth of individual sections depends on data availability for this market. Volume, capacity, trade and other unit-based metrics are included where applicable.

