
City bus contracts anchor Vietnam gas vehicle demand
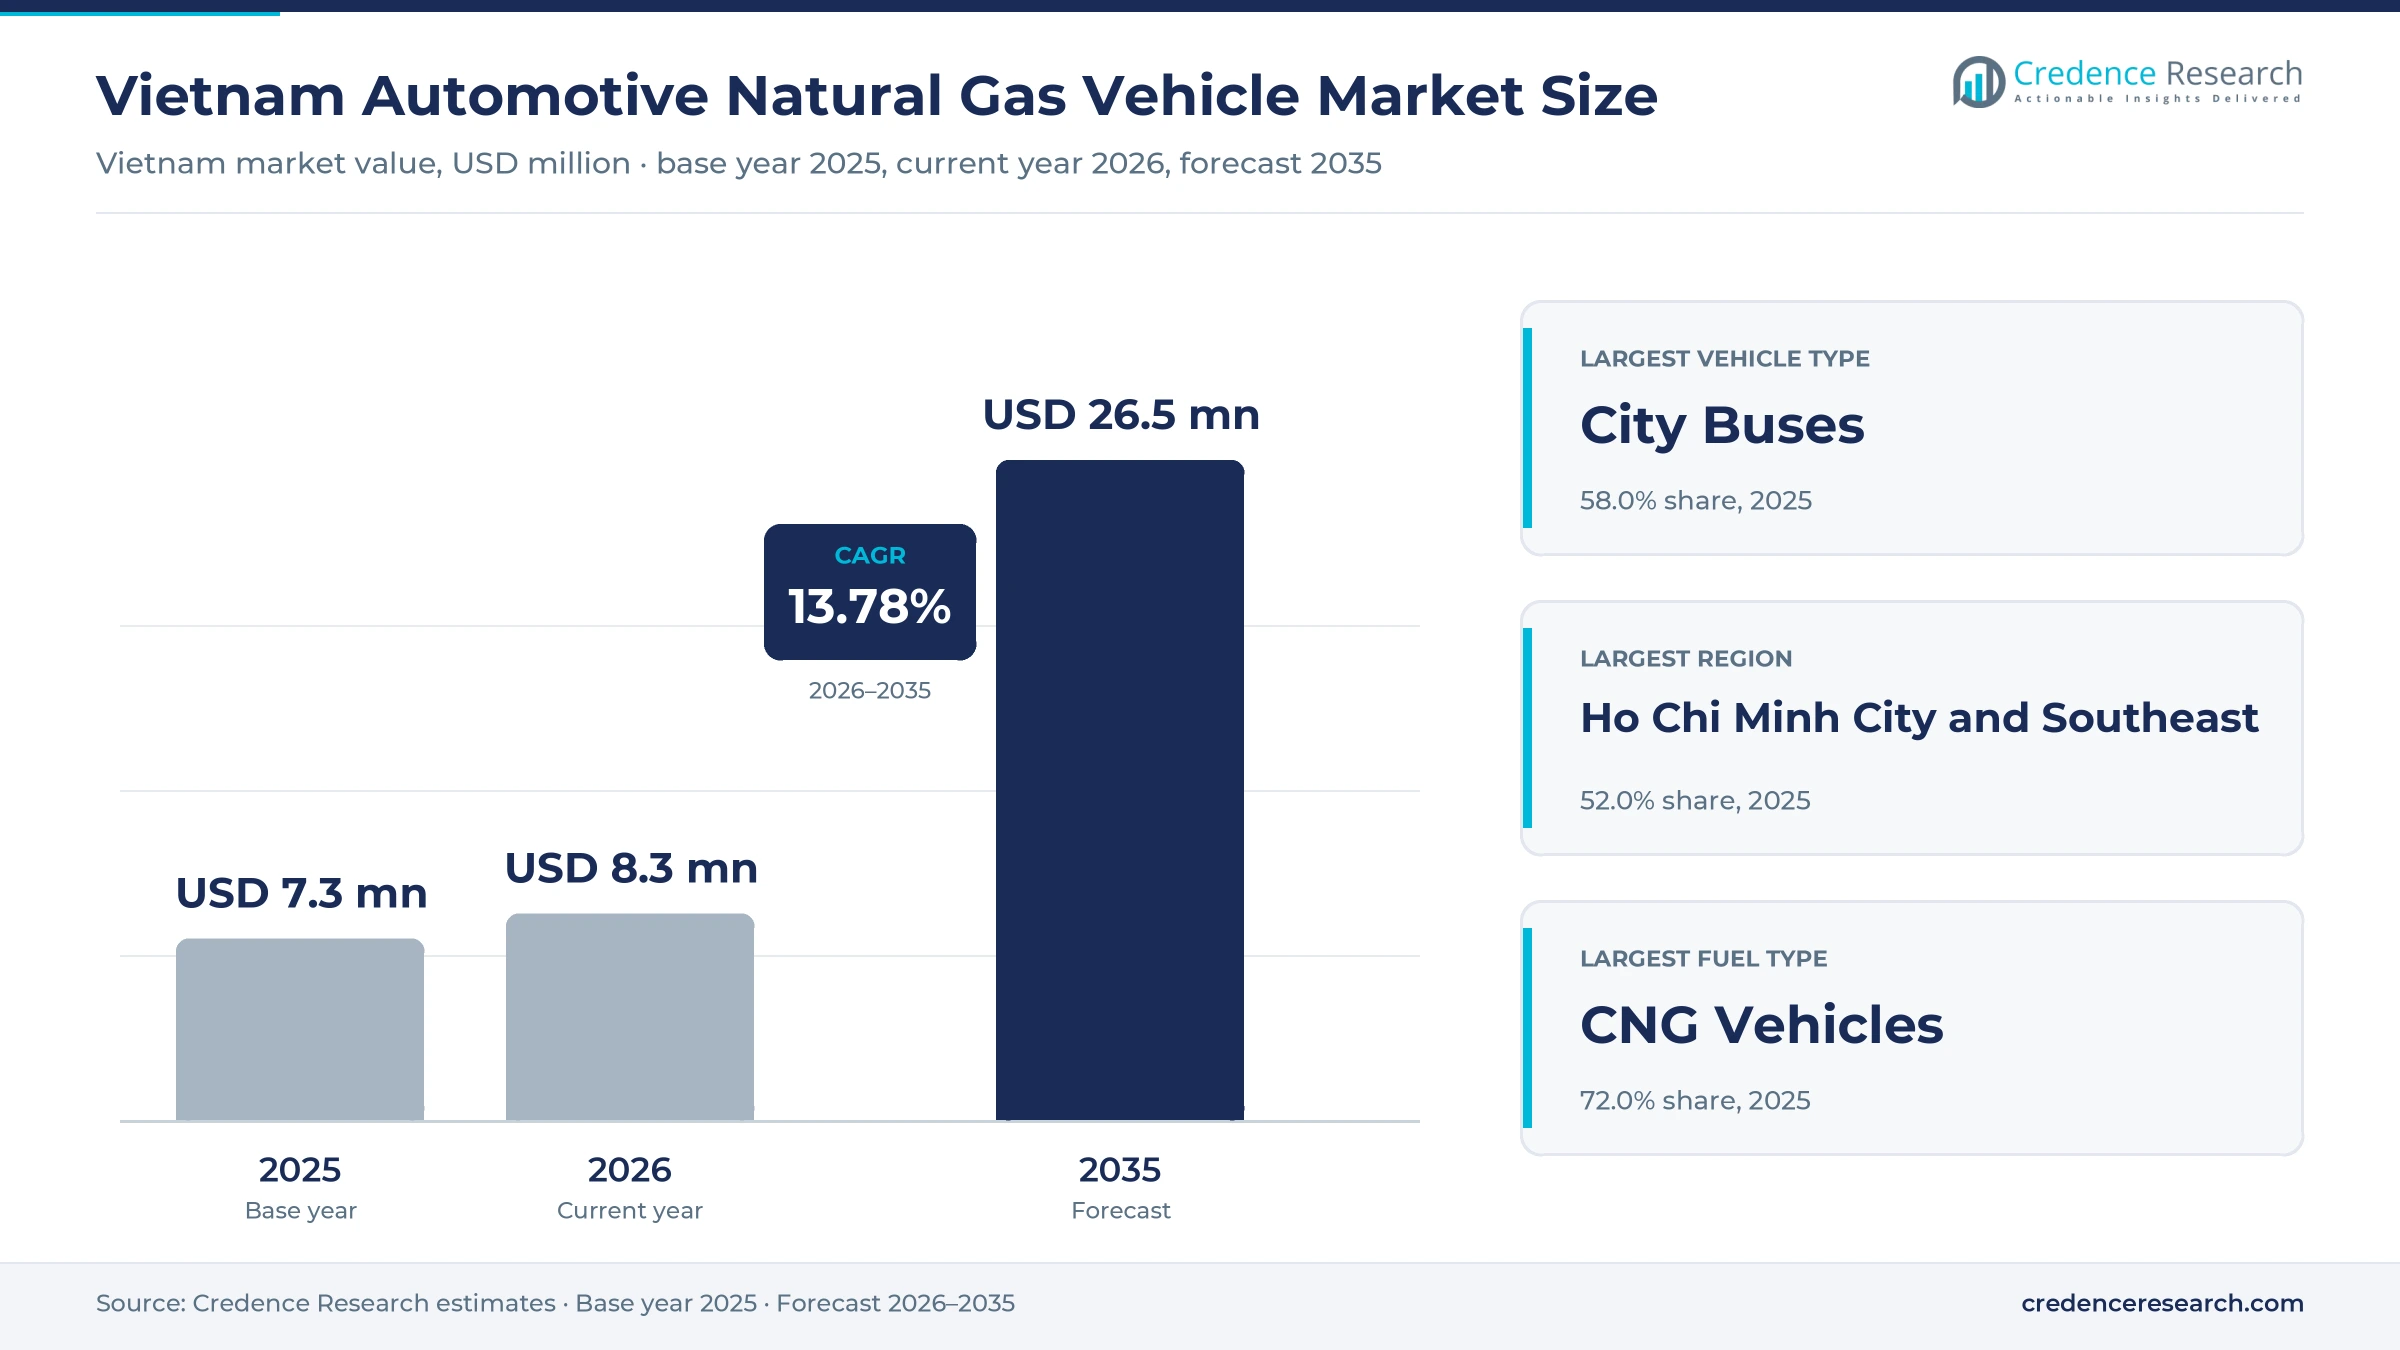
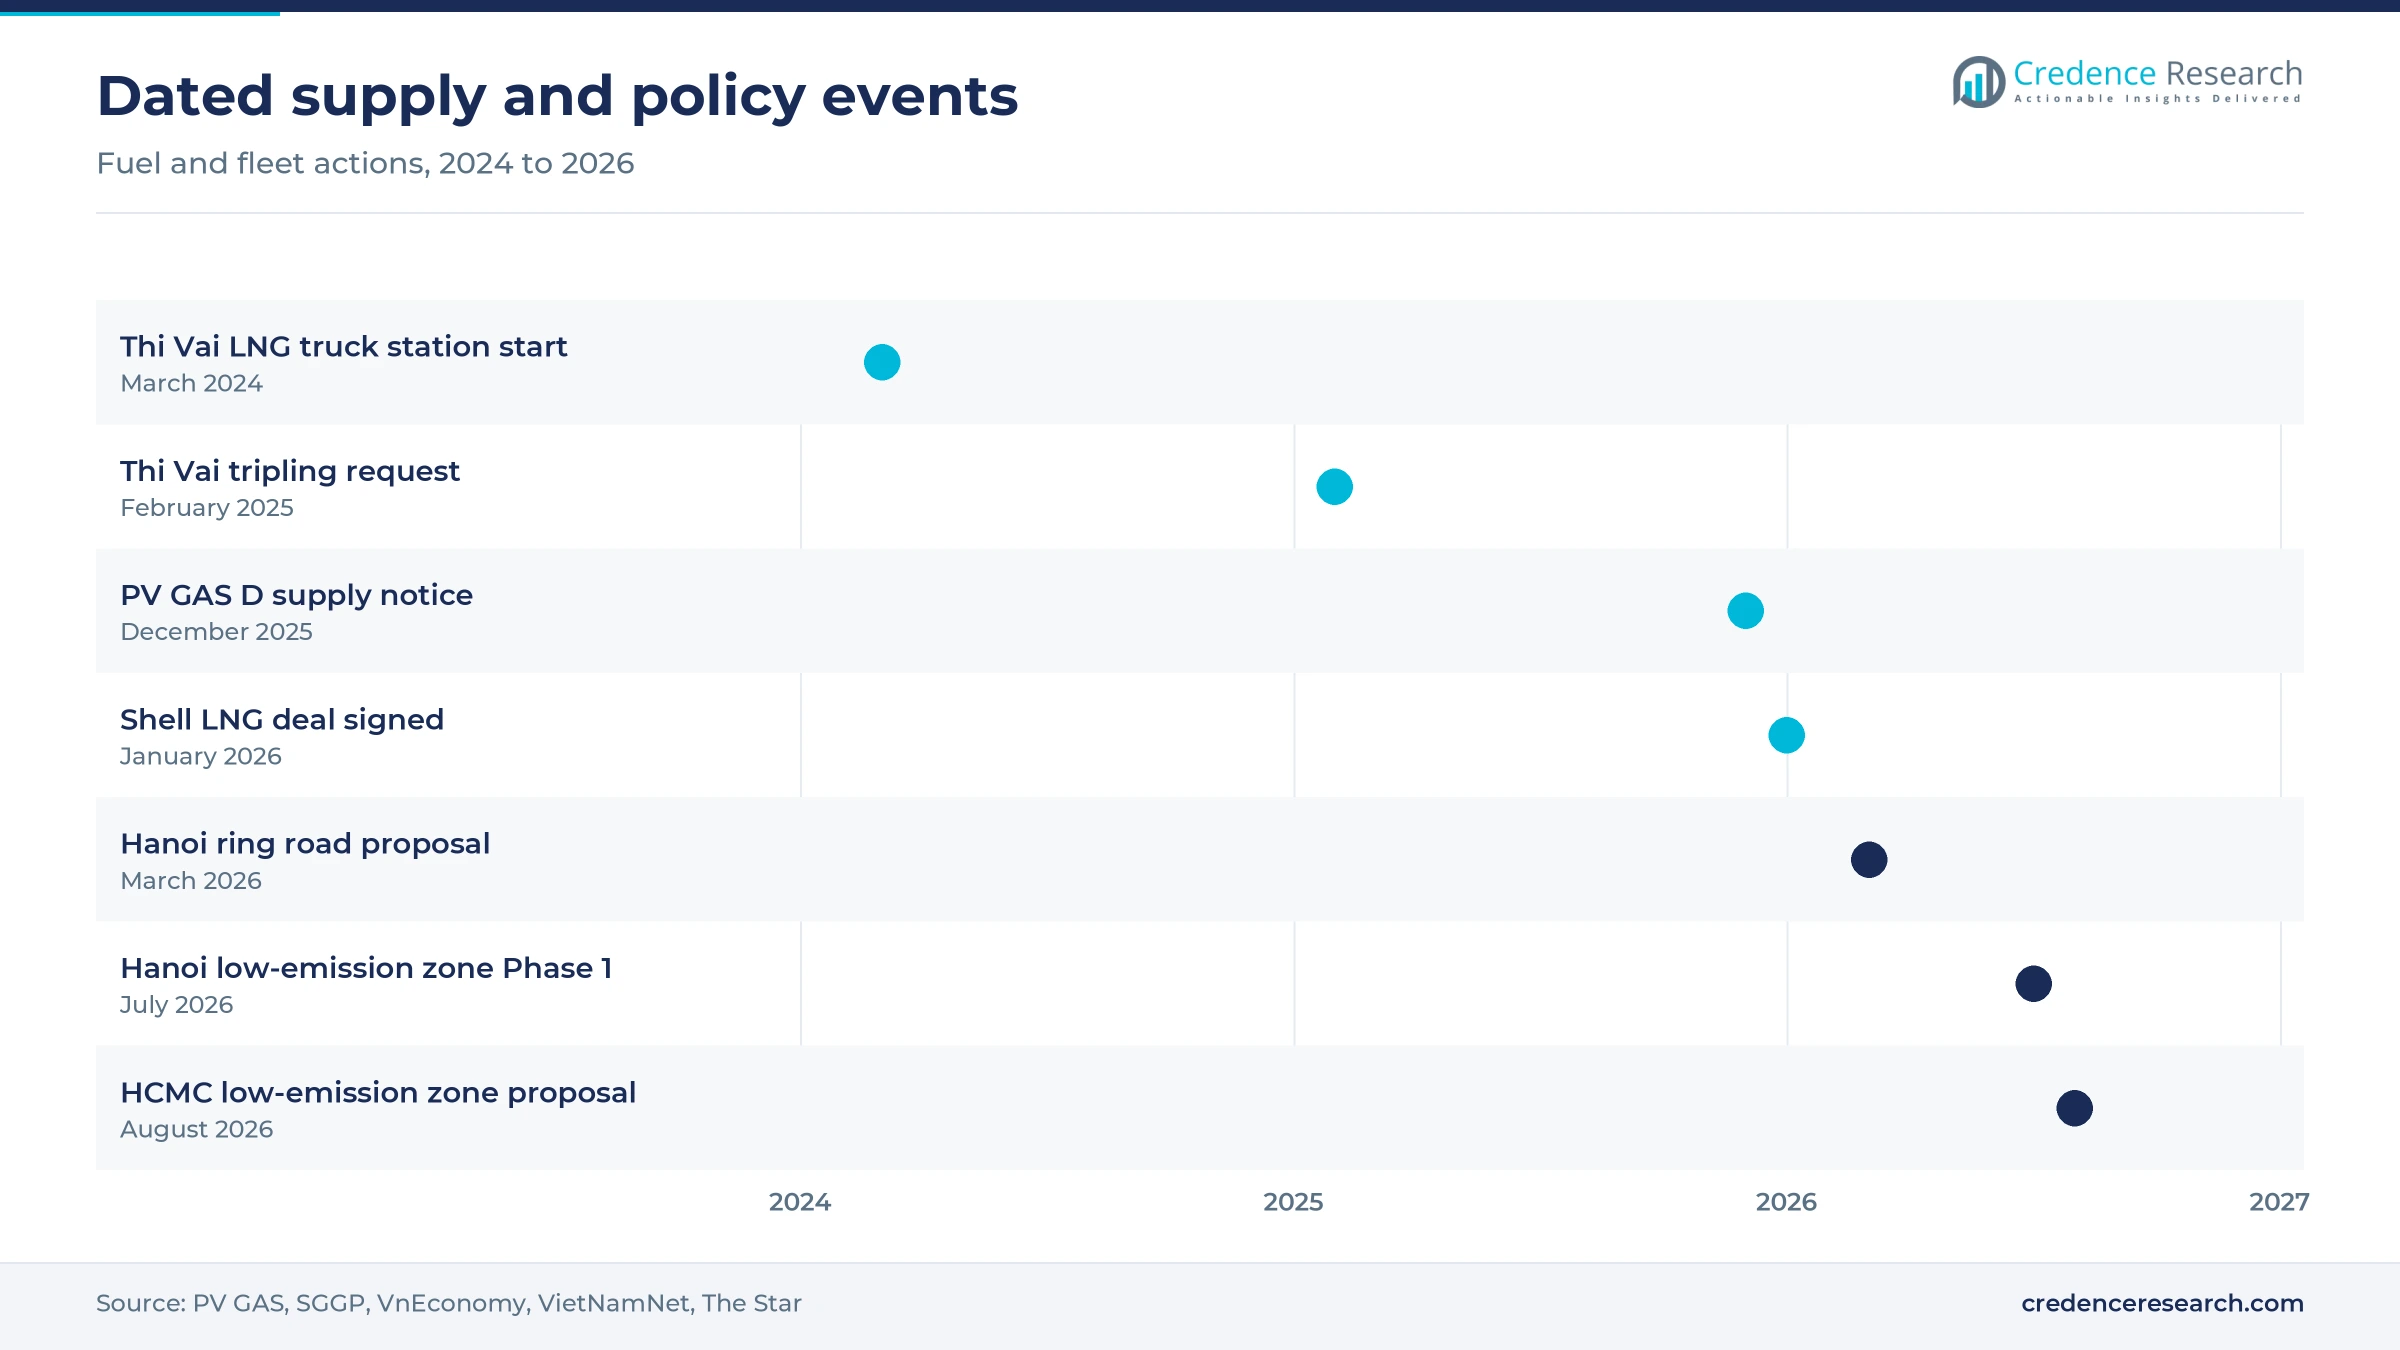
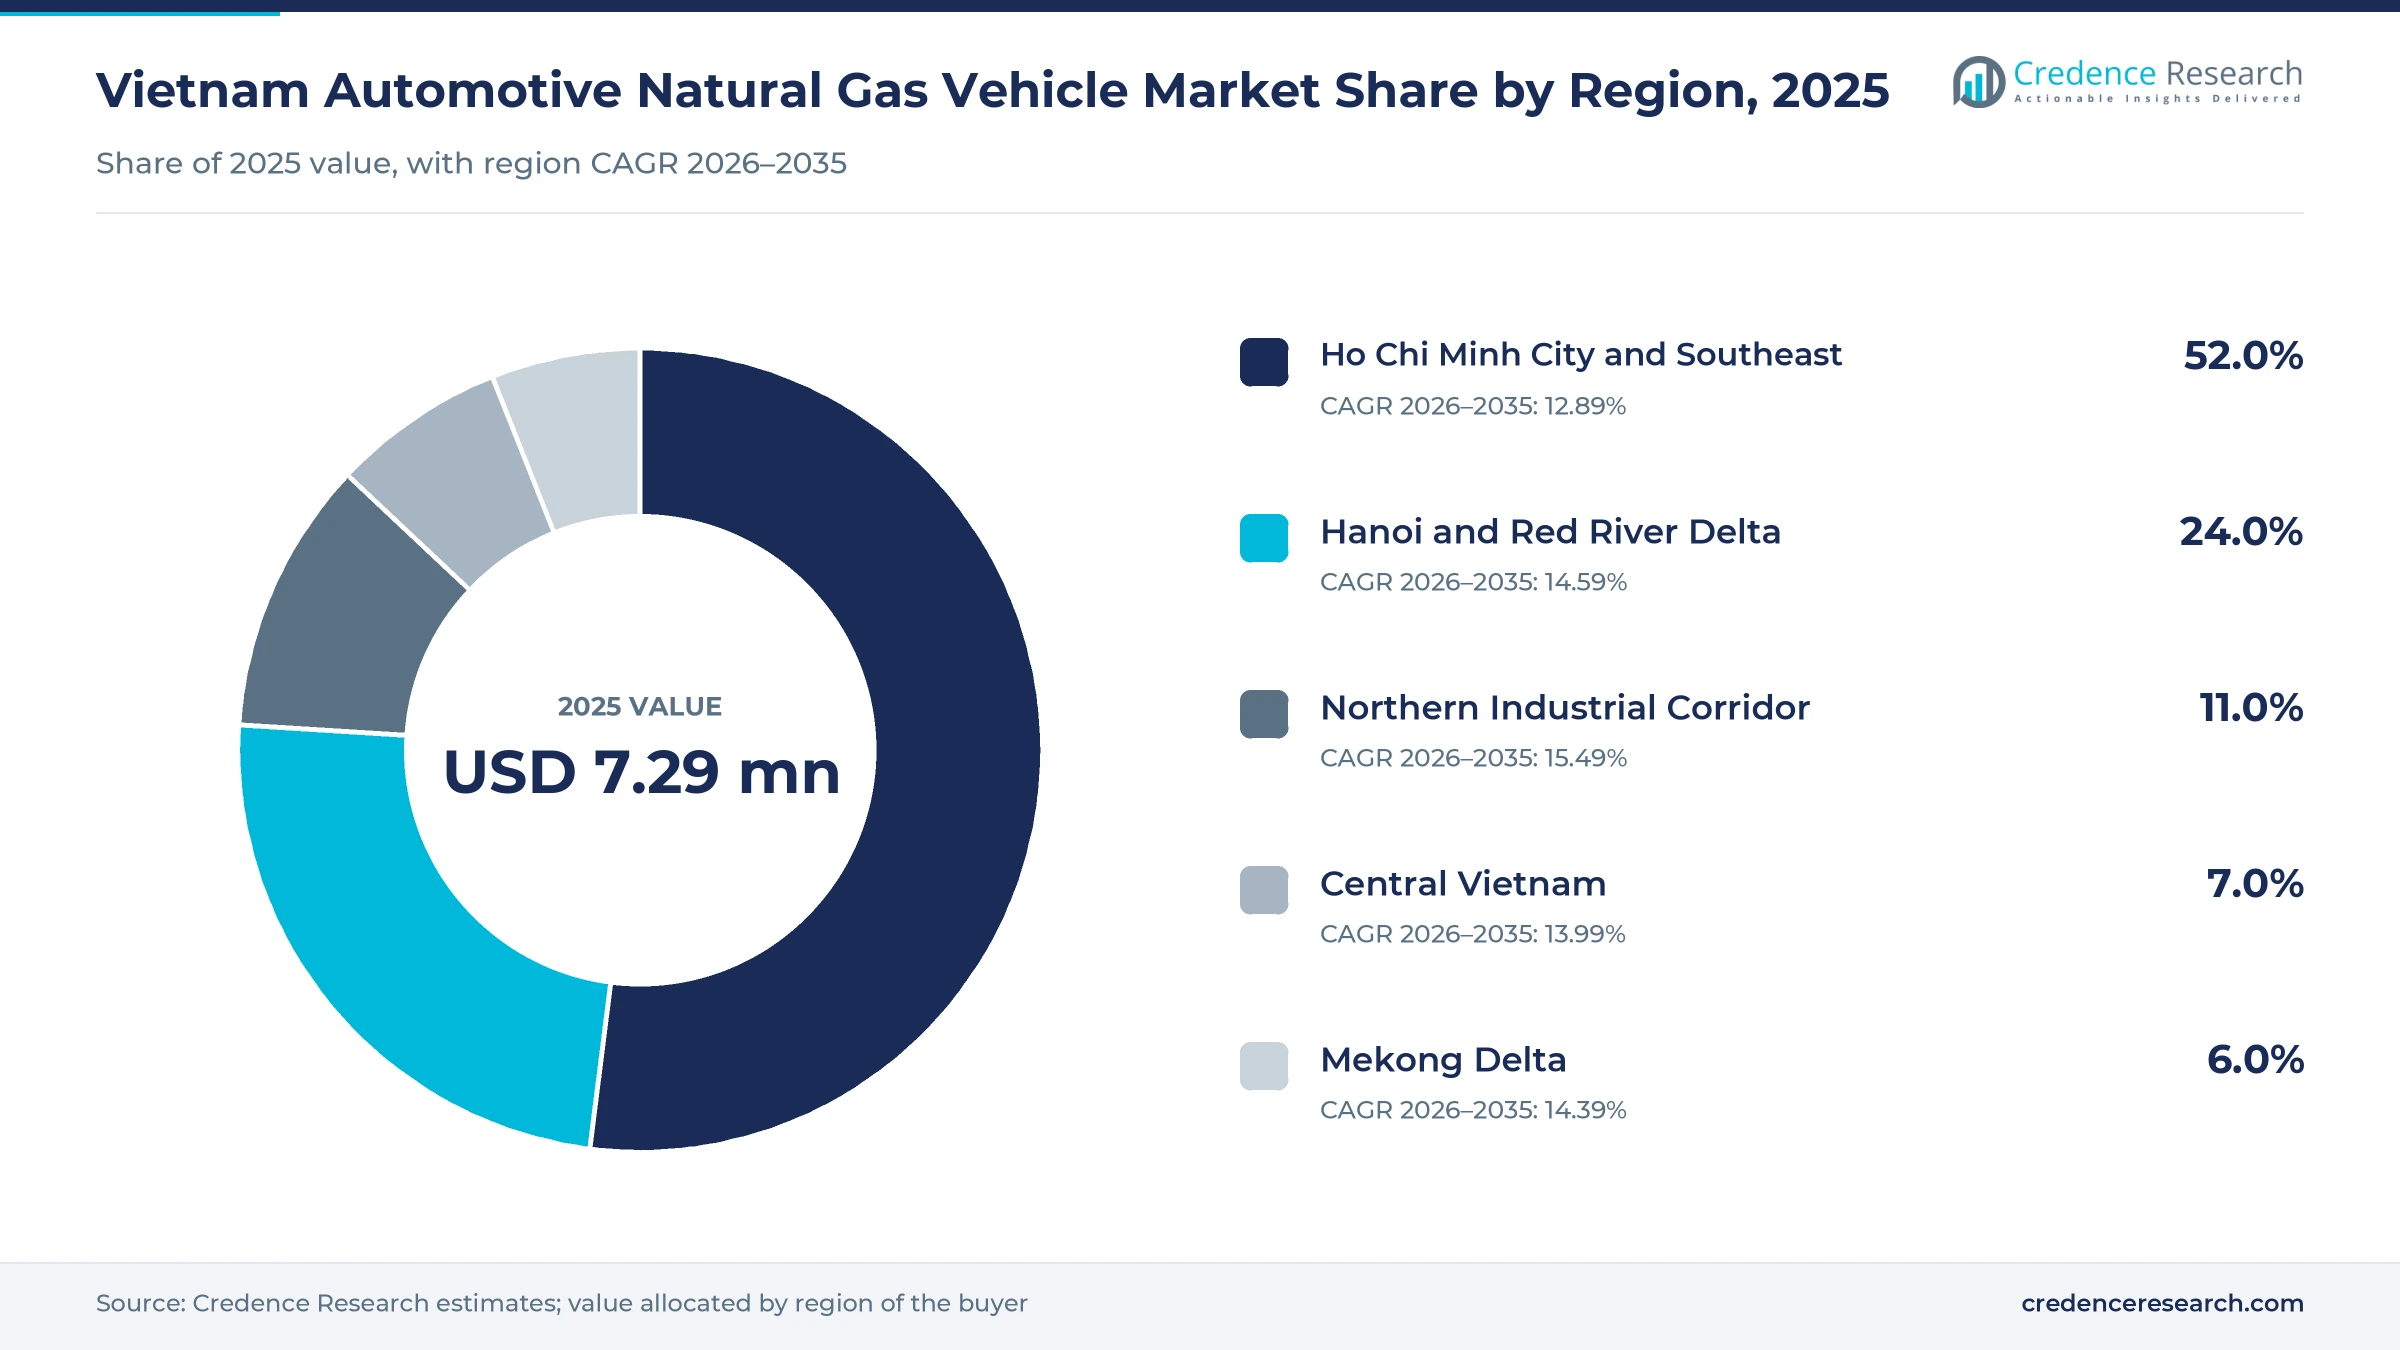
The Vietnam automotive natural gas vehicle market was valued at USD 7.29 million in 2025 and is projected to increase from USD 8.30 million in 2026 to USD 26.5 million by 2035, registering a CAGR of 13.78% during 2026–2035. Demand centers on subsidized city buses, because Hanoi and Ho Chi Minh City both require cleaner fleets on their route contracts, while freight operators face tighter low-emission rules in both cities. Ho Chi Minh City and Southeast held the largest regional share, 52.0% in 2025, because the country's largest CNG bus fleet and main compression plants sit there. Northern Industrial Corridor is the fastest-growing region at 15.49% a year as LNG reaches northern industry by truck and rail. The main commercial change is fuel logistics, since Thi Vai's LNG truck loading station was scheduled to start in March 2024 and Petrovietnam wants the terminal tripled to 3 million tons a year. However, electric buses now compete directly for the same public route contracts.
What does this market count, and who buys the vehicles?
The market counts the value of new factory-built natural gas vehicles and certified fleet conversions sold in Vietnam, across city buses, coaches, trucks, light commercial vehicles and passenger cars. Most buyers are bus cooperatives and private operators that win subsidized route contracts from city transport agencies, then purchase vehicles from assemblers such as SAMCO. Those operators then sign their fuel contracts separately with gas traders.
The count excludes CNG and LNG fuel sales, refueling stations, pipeline gas for factories and LPG vehicles. The value chain runs from PV GAS supply through CNG and LNG distributors to refueling sites, then to vehicle assemblers, conversion workshops and the fleets that operate on city routes and freight corridors.
Vietnam Automotive Natural Gas Vehicle Market Insights
- The market rises from USD 7.29 million in 2025 to USD 26.5 million by 2035, a 13.78% CAGR built on city bus fleets and later freight demand for gas vehicles.
- Ho Chi Minh City and Southeast held 52.0% of 2025 value, since the country's largest CNG bus fleet and its main compression plants operate in that zone.
- City Buses led vehicle types with 58.0% in 2025 because subsidized route contracts in the two largest cities drive most gas vehicle purchases.
- Hanoi proposed in March 2026 that buses inside Ring Road 1 run on electricity or CNG from July 1, 2026, with outer rings following by 2030.
- PV GAS plans to invest over VND 100 trillion during 2026–2030, with LNG infrastructure a priority, which widens fuel access for future gas truck fleets.
Route contracts and CNG fuel shape segment demand
Why do city buses lead vehicle demand?
Based on vehicle type, the market is categorized into city buses, coaches and shuttle buses, medium and heavy trucks, light commercial vehicles and passenger cars. City Buses led with 58.0% of 2025 value because route contracts drive purchases, and Ho Chi Minh City alone ran 542 CNG buses among 2,342 in service, according to Znews in August 2025. Medium and Heavy Trucks grow fastest at 15.93% a year, as truck sales by Vietnam Automobile Manufacturers Association members rose 24% to 70,746 units in 2025, according to The Investor, which gives gas suppliers a far larger fleet to target.
Why does compressed gas dominate fuel choice?
Based on fuel type, the market is categorized into CNG vehicles, LNG vehicles, bi-fuel CNG-gasoline vehicles and dual-fuel LNG-diesel vehicles. CNG Vehicles led with 72.0% of 2025 value because the gas bus fleets reported in Hanoi and Ho Chi Minh City run on compressed gas, including 139 CNG buses in Hanoi by April 2026, according to VnEconomy. LNG Vehicles grow fastest at 16.87% a year from a very small base, as Hanoi's fleet plan models 976 LNG or CNG buses in its first scenario, according to Hanoi Times.
Which customers place most gas vehicle orders?
Based on customer type, the market is categorized into municipal transit authorities, private bus operators, logistics fleets, industrial fleet owners and corporate shuttle providers. Private Bus Operators led with 38.0% of 2025 value because cooperatives and contractors buy the buses that city route contracts require, such as the Quyet Thang and May 19 cooperatives named by SGGP in November 2024. Logistics Fleets grow fastest at 15.57% a year, as the World Bank reported in 2019 that trucks carry 77% of freight tonnage and about 95% of trucks were over five years old, which leaves a sizable replacement pool.
How do gas vehicles reach Vietnamese fleets?
Based on sales channel, the market is categorized into direct OEM sales, government tenders, authorized dealers, fleet conversion specialists and import distributors. Direct OEM Sales led with 42.0% of 2025 value because local assemblers sell straight to fleets, and SAMCO held nearly 100 unused CNG buses priced at VND 2 billion to VND 3 billion each in August 2025, according to Znews. Government Tenders grow fastest at 14.76% a year, as Ho Chi Minh City put 108 subsidized routes out to open bidding during 2024–2025 and plans more tenders from late 2026, according to VietNamNet.
| Segment Group | Leading Sub-segment | Share, 2025 | Fastest-growing Sub-segment | CAGR, 2026–2035 |
|---|---|---|---|---|
| By Vehicle Type | City Buses | 58.0% | Medium and Heavy Trucks | 15.93% |
| By Fuel Type | CNG Vehicles | 72.0% | LNG Vehicles | 16.87% |
| By Customer Type | Private Bus Operators | 38.0% | Logistics Fleets | 15.57% |
| By Sales Channel | Direct OEM Sales | 42.0% | Government Tenders | 14.76% |
Request a Free Sample
Fill in your details and we'll send you a free sample report.
- Sample data tables & charts
- Research methodology
Bus rules and LNG supply lift gas vehicle orders
Hanoi green-bus procurement opens a CNG buying window
Hanoi's fleet rules create the clearest near-term order pipeline for gas buses. The city operated 225 bus routes in March 2026, of which 145 still ran on diesel and only 15 on CNG, according to the Hanoi Center for Traffic Management and Operation. Its proposal would require buses within Ring Road 1 to use electricity or CNG from July 1, 2026, with Ring Road 2 following on Jan. 1, 2028, and Ring Road 3 in 2030. As a result, diesel route contracts that expire must be replaced with compliant vehicles. Hanoi's green fleet reached 699 buses in April 2026, of which 560 were electric, according to VnEconomy, which leaves CNG as the lower-cost compliant option for operators with limited capital.
Commercial vehicle fleet expansion widens the gas truck pool
Commercial fleet growth gives gas suppliers a larger base of potential buyers beyond buses. Commercial vehicle sales above 2 tons climbed more than 37% to 15,252 units in the first quarter of 2025, according to Truck & Bus Builder, using Vietnam Automobile Manufacturers Association data. Passenger cars moved the other way, slipping about 1% to 218,974 units for the year, according to The Investor. Buses and trucks make up 2% of registered vehicles yet produce 65% of transport emissions, according to the World Bank, which puts these fleets at the center of national emission policy. In turn, Medium and Heavy Trucks are the fastest vehicle group at 15.93% a year, although published sales figures do not yet split trucks by fuel.
Gas supply and LNG infrastructure reach new fleet corridors
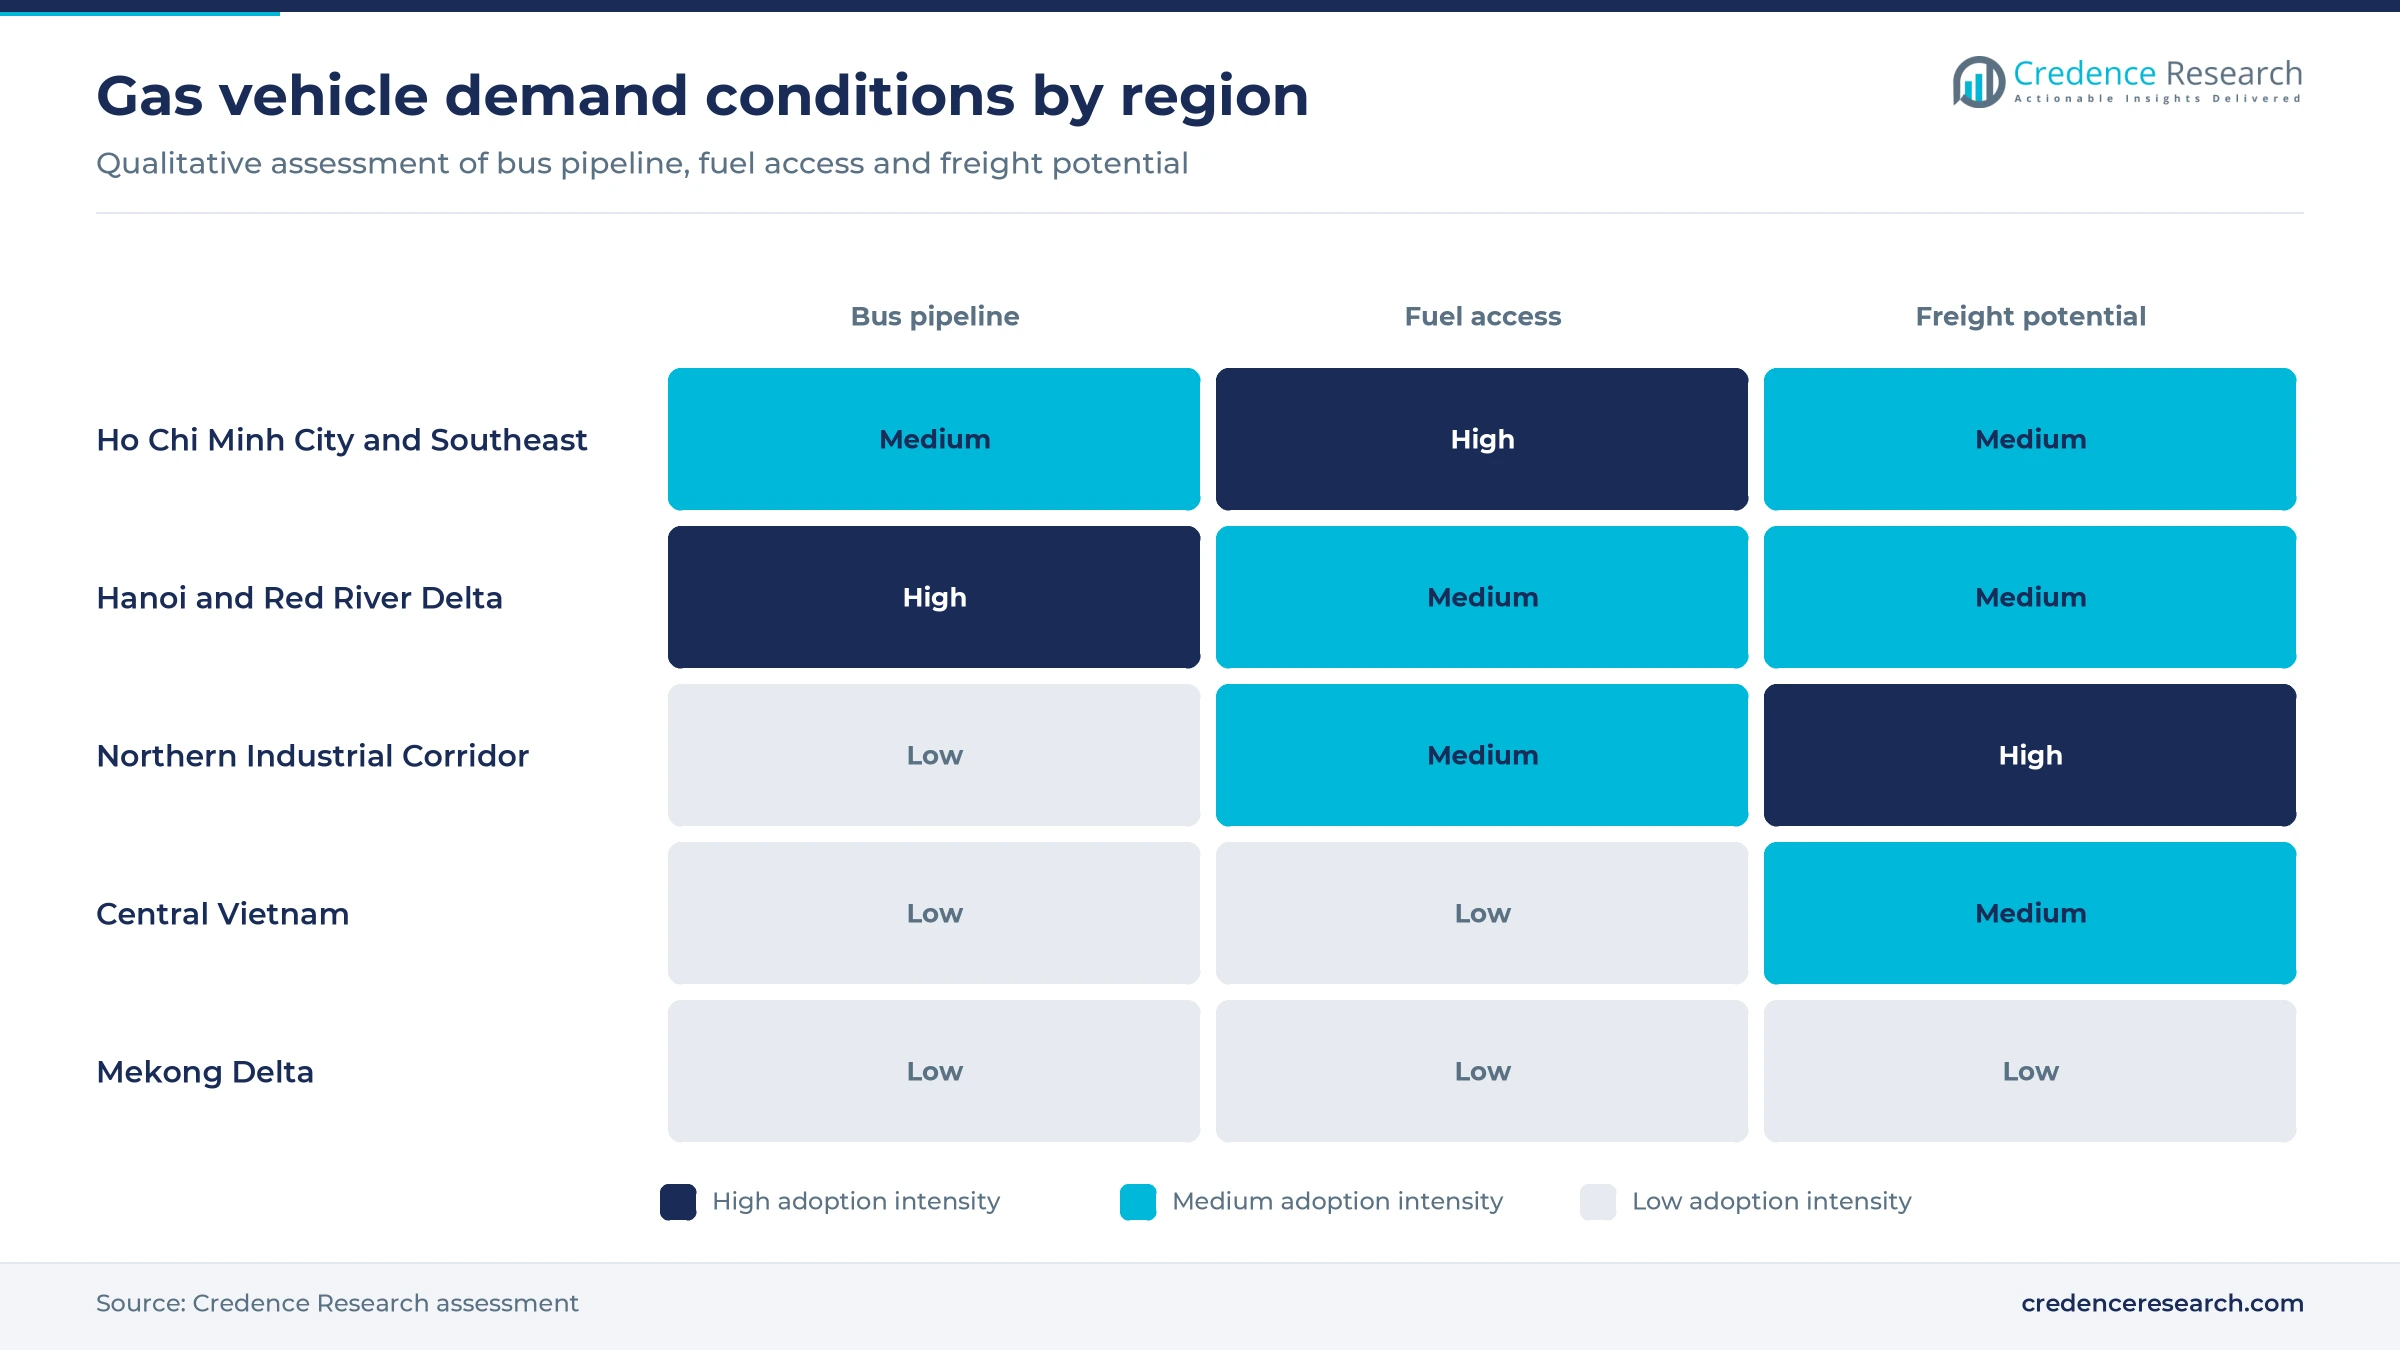
Fuel access decides whether a fleet can buy a gas vehicle, and supply is expanding outward from the Southeast. The Thi Vai terminal opened with 1 million tons of annual capacity in October 2023, and Petrovietnam asked in February 2025 for that figure to triple, according to The Investor. Its LNG truck station was designed for about 190,500 tons a year in phase one and 279,000 tons after phase two, according to SGGP. PV GAS also plans over VND 100 trillion of investment for 2026–2030, and its Vung Ang terminal in Ha Tinh targets the fourth quarter of 2029. Consequently, road-delivered LNG can serve depots far from pipelines, which helps Northern Industrial Corridor gain share over the forecast.
Low-emission zones raise the cost of staying on diesel
Low-emission rules are turning fuel choice into a route-access question for city fleets. Hanoi's May 2026 draft bars trucks under two tons that fail Level 4 emission limits from its pilot zone and sets tighter hours or bans for larger trucks, according to VnEconomy. Ho Chi Minh City proposed in August 2026 a pilot zone of about 930 hectares from mid-2027, with buses first required to use electricity or clean energy, according to The Star. National draft limits also move vehicles registered after 2022 to Level 5 in both cities from 2027, according to VietNamNet. As a result, operators replacing diesel vehicles on downtown routes must compare gas and electric models, and each purchase becomes a multi-year fuel commitment.
Electric buses and LNG logistics reshape the outlook
Shift toward electric buses narrows the CNG share of city fleets
City fleet data shows electric buses taking orders that CNG models once won. Ho Chi Minh City counted 613 electric buses beside its CNG fleet in August 2025, but 1,185 electric and only 182 CNG buses among more than 2,400 active buses in May 2026, according to Seasia. The city also aims for 100% electric buses from 2030, according to VietNamNet in December 2025. The price gap still favors gas, since Znews put an electric bus near VND 6 billion in August 2025, about two to three times the VND 2 billion to VND 3 billion it reported for a CNG bus. As a result, gas vehicle suppliers now sell against battery models on urban routes, and they must argue on purchase price and range rather than on emissions alone.
Rising LNG logistics by road and rail extend gas beyond pipelines
LNG logistics are moving gas away from the pipeline network, which matters for future heavy-vehicle fueling. CNG Viet Nam, the PV GAS subsidiary, received certification to trade LNG on Aug. 29, 2023, according to PV GAS, and it prepared a truck loading facility in Long An the same month. The company then moved LNG by rail from the South to the North in 2024, and it reports over 70% of the domestic CNG market. PV GAS also signed a long-term deal with Shell in January 2026 for about 400,000 tons a year from 2027 to 2031, according to VietNamNet. In turn, the same small-scale LNG network that now serves factories could later supply truck depots.
Hanoi LNG and CNG scenario offers an opening for bus builders
Hanoi offers the largest identifiable opening for gas bus suppliers through 2035. Its initial fleet scenario splits about 2,076 buses into 1,100 electric and 976 LNG or CNG vehicles, while a later scenario still holds 620 gas buses, according to Hanoi Times. The same report counted 1,905 subsidized buses in service, so the gas share could rise several times over from today's level. Hanoi's first CNG routes started in August 2018 under Bao Yen, according to Vietnam News Agency, which gives local operators years of working experience. Because the plan targets 70% to 90% clean buses by 2030, bus builders that pair vehicles with depot refueling could win early contract rounds before later electric-only scenarios take hold.
Fleet conversion offers an opening for trucks and company cars
Conversions offer a lower-cost opening for fleets that cannot wait for factory gas trucks. PV GAS South converted about 600 PetroVietnam vehicles in Ho Chi Minh City and Ba Ria-Vung Tau to CNG, according to PV GAS in 2012, at fuel prices 30% to 50% below gasoline at that time. PV GAS plants at Phu My, My Xuan and Hiep Phuoc, rated at 95 million, 100 million and 20 million cubic meters a year, sit close to those corridors. Southern Gas Trading also proposed four new public stations in November 2024, according to SGGP. As a result, specialists in CNG powertrain kits can target logistics depots located near existing compressed gas supply in the Southeast.
Policy timing and fuel supply limit new gas orders
Electric mandates cap the useful life of new CNG buses
Policy timing is the largest risk for new gas bus orders in the South. Ho Chi Minh City's draft plan set a 2030 cutoff for CNG buses, while a proposed alternative would run them until 2040 and vehicles carry a 20-year legal life, according to SGGP in November 2024. Southern Gas Trading warned in August 2025 that over 400 buses still within service life would be wasted. As a result, cooperatives hesitate on new orders until the cutoff is settled.
A single gas source leaves fleets exposed to supply disputes
Fuel supply can change at short notice because one group controls the commercial gas source. PV GAS D notified Southern Gas Trading on Dec. 18, 2025, that deliveries would stop on Jan. 1, 2026, putting nearly 500 buses and about 80,000 daily trips at risk, according to SGGP. City officials later said more than 300 CNG buses were running normally. A forced switch to diesel or gasoline could raise operating costs by 30% to 40%, which leaves operators exposed.
Refueling capacity has not kept pace with the bus fleet
Thin refueling networks limit the routes where gas vehicles can work. Ho Chi Minh City had only three public transport CNG stations for about 510 buses on 18 routes in December 2025, according to Dai Bieu Nhan Dan. SGGP described those sites as often overloaded and congested in November 2024. SAMCO said its CNG program stopped in 2018 because stations were not expanded, which left its new buses unsold. Consequently, truck fleets outside those corridors have few shared fueling options.
Gas costs have narrowed the fuel saving for fleets
Imported and domestic gas costs are eroding the fuel saving that first justified CNG buses. Domestic output ranged only from about 5.95 billion to 8.08 billion cubic meters a year in 2021–2025, according to VietNamNet, after fields peaked in 2010–2015. CNG prices rose by about USD 1 per million BTU after April 1, 2025, according to SGGP. Hanoi's original saving estimate of about USD 8,308 a year in 2018 therefore needs retesting, because supply now leans more on imported LNG.
The Southeast leads as northern corridors gain fastest
| Region | Value, 2025 (USD million) | Share, 2025 | CAGR, 2026–2035 |
|---|---|---|---|
| Ho Chi Minh City and Southeast | 3.8 | 52.0% | 12.89% |
| Hanoi and Red River Delta | 1.7 | 24.0% | 14.59% |
| Northern Industrial Corridor | 0.8 | 11.0% | 15.49% |
| Central Vietnam | 0.5 | 7.0% | 13.99% |
| Mekong Delta | 0.4 | 6.0% | 14.39% |
Ho Chi Minh City and Southeast keep the largest gas bus base
Ho Chi Minh City and Southeast held a 52.0% share of 2025 market value and grows at 12.89% a year. CNG buses began service in the city with 21 vehicles in August 2011, according to the Government News portal. SAMCO supplies gas buses from the city, and PV GAS runs compression plants at Phu My, My Xuan and Hiep Phuoc. However, the electric fleet plan holds this zone below the national growth rate, because new route contracts increasingly specify battery buses.
Hanoi and Red River Delta hold the clearest bus pipeline
Hanoi and Red River Delta held a 24.0% share of 2025 market value and grows at 14.59% a year. Hanoi targets 851 green buses by the end of 2026, according to VnEconomy, and its ring road timetable forces diesel routes to change. Supply also sits close by, because the Tien Hai plant in Thai Binh adds 200 million cubic meters of annual CNG capacity, according to PV GAS. As a result, this zone could become the main source of new CNG bus orders.
Northern Industrial Corridor gains from LNG reaching factories
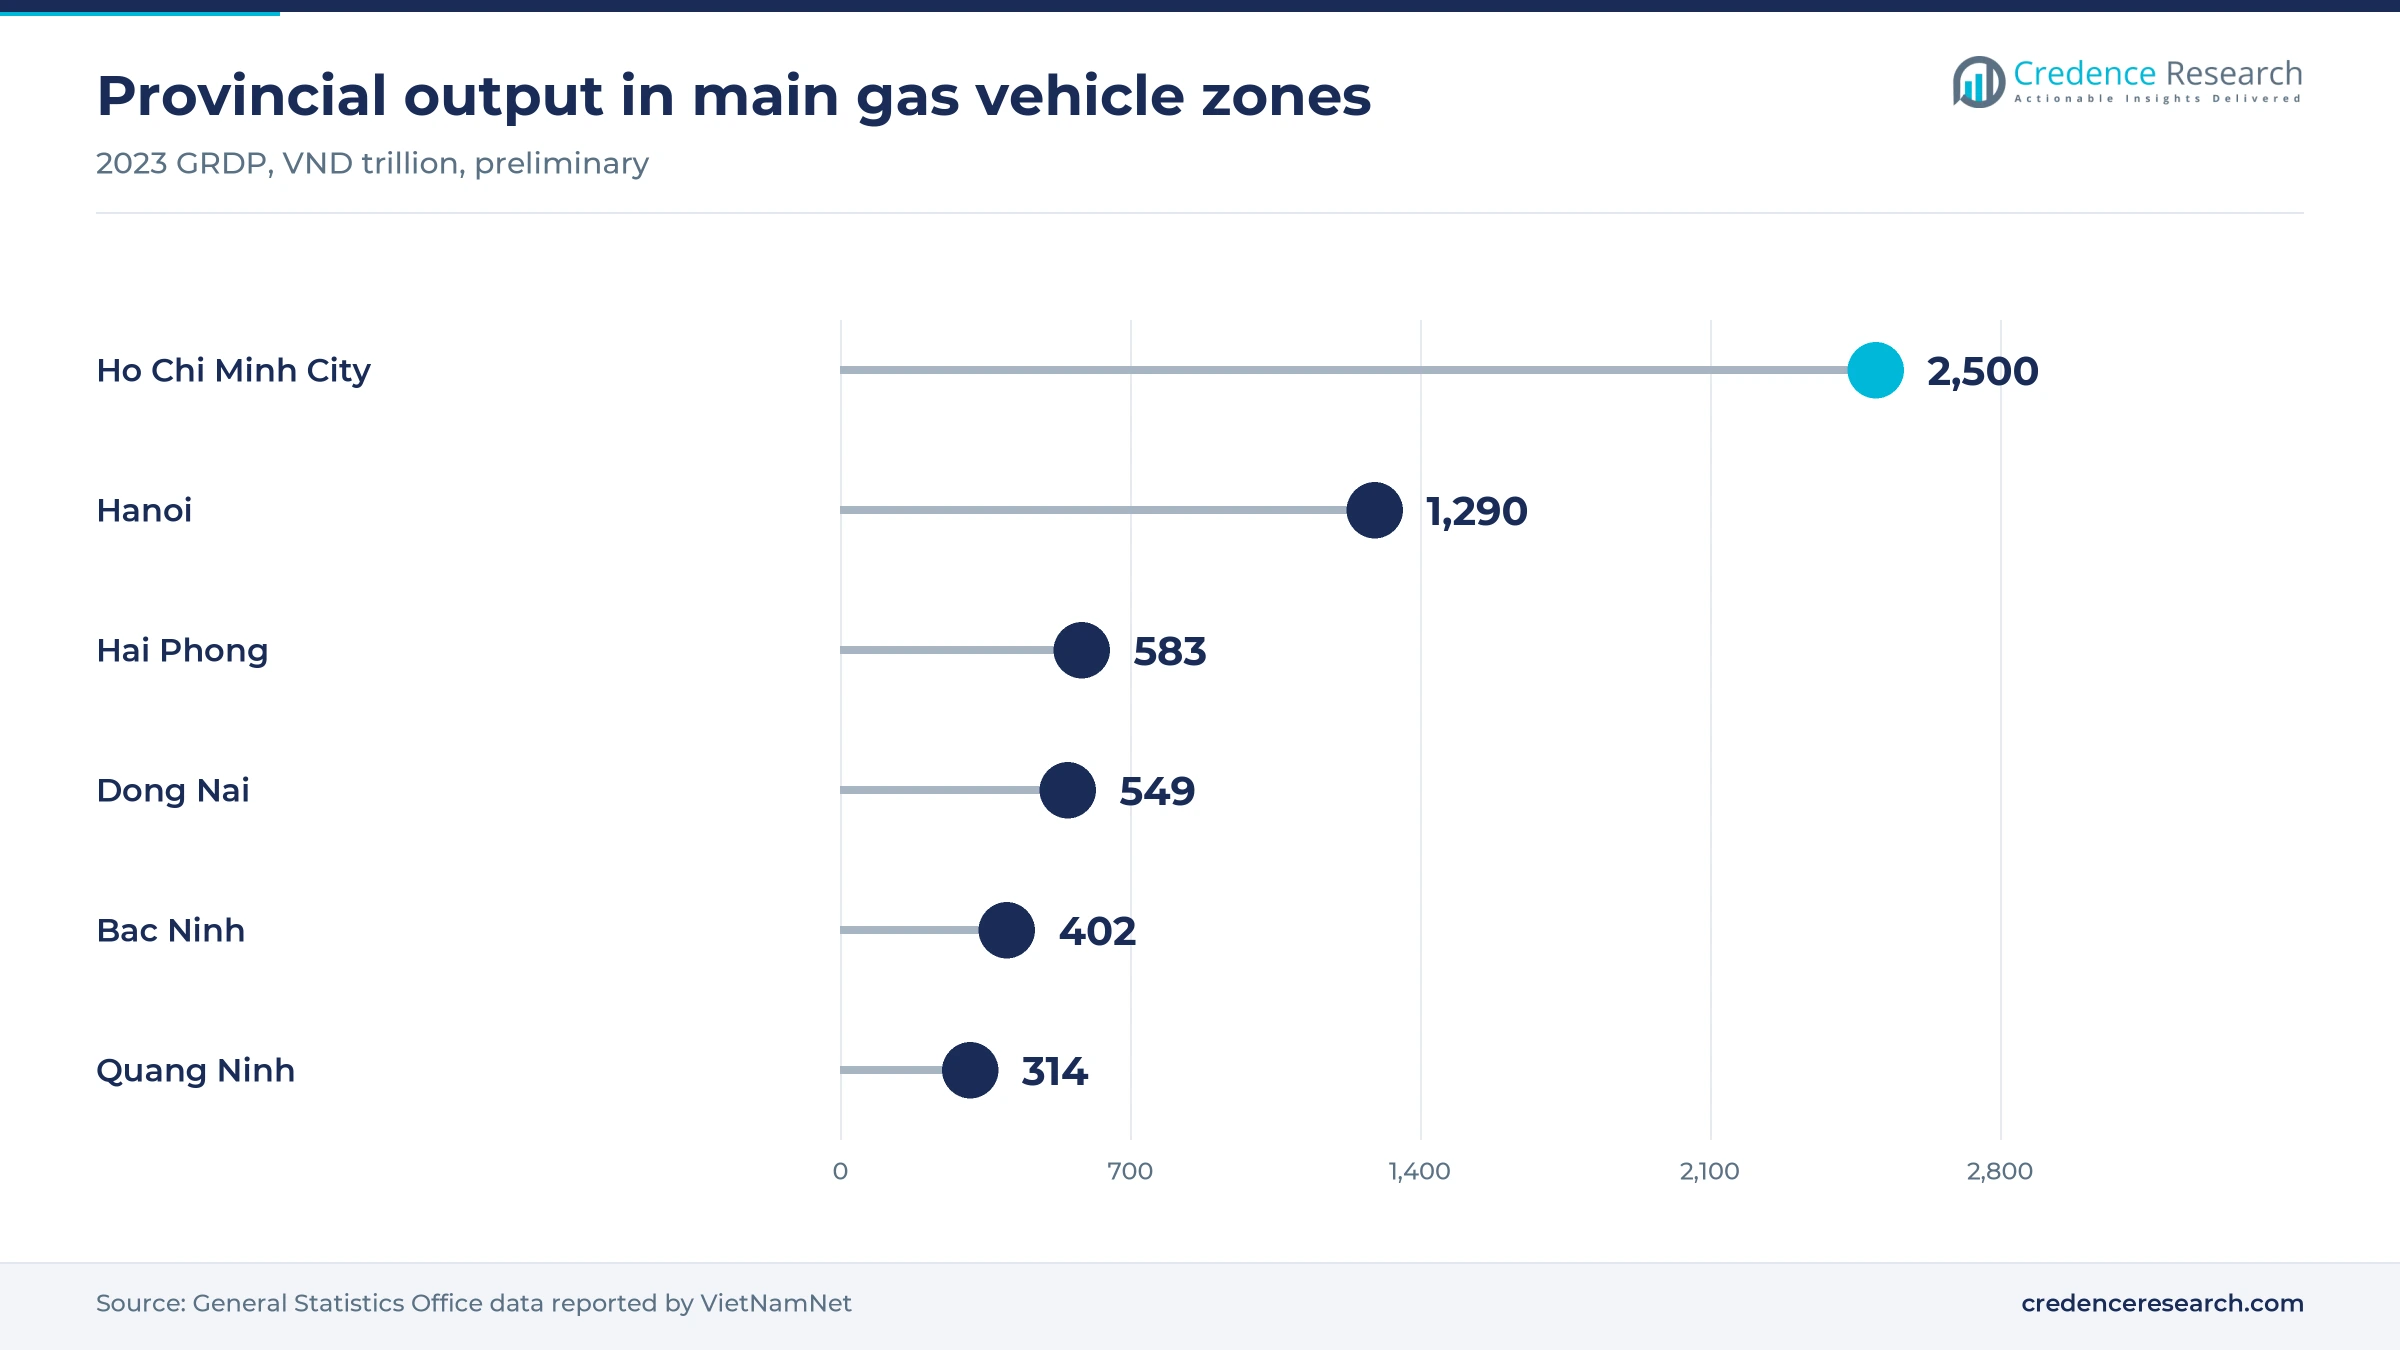
Northern Industrial Corridor held an 11.0% share of 2025 market value and is the fastest-growing zone at 15.49% a year. Bac Ninh recorded 2023 output of VND 401.51 trillion and Quang Ninh VND 313.6 trillion, according to General Statistics Office data reported by VietNamNet. PV GAS also lists a Hai Phong LNG port among its current projects. Because factory freight is dense here, logistics fleets could add gas trucks once LNG depots are in place, although this remains an early market.
Central Vietnam combines assembly capacity with later gas access
Central Vietnam held a 7.0% share of 2025 market value and grows at 13.99% a year. THACO's Chu Lai complex in Quang Nam has a bus plant with a 1,500-unit first phase and a Hyundai commercial vehicle line rated at 10,000 units, according to Hanoi Times. Local fuel access arrives later, since the Vung Ang LNG terminal in Ha Tinh is targeted for the fourth quarter of 2029 at about VND 26.7 trillion, according to The Investor.
Mekong Delta depends on trucked gas and future floating storage
Mekong Delta held a 6.0% share of 2025 market value and grows at 14.39% a year. The nearest LNG logistics point is the Long An truck loading facility and the Thuan Dao satellite station, according to PV GAS in August 2023. PV GAS is also studying floating storage options for the southwest, according to The Investor in December 2025. Until those options mature, gas vehicle demand here stays small, because no large city gas bus fleet was identified in this review.
Fuel disputes and LNG deals marked recent activity
| Development | Status and market relevance |
|---|---|
| In October 2023, PV GAS inaugurated the Thi Vai LNG terminal with 1 million tons of annual capacity at a cost of USD 300 million. | Operating, and the base for LNG truck and rail delivery. |
| In November 2024, Southern Gas Trading proposed four new CNG stations for Ho Chi Minh City buses, according to SGGP. | Proposed, and it responds to overloaded sites. |
| In December 2025, PV GAS D issued Official Letter No. 803 on stopping gas deliveries to Southern Gas Trading from Jan. 1, 2026. | City officials said CNG bus service continued normally. |
| In January 2026, PV GAS signed a long-term LNG deal with Shell for about 400,000 tons a year from 2027 to 2031. | Signed, and it adds contracted import supply. |
| In March 2026, Hanoi proposed a ring road timetable requiring electric or CNG buses from July 1, 2026. | Proposal, and it sets the main CNG buying window. |
Storage and delivery define gas vehicle technology
- Compressed storage keeps gas in high-pressure CNG cylinders on buses such as the 75-passenger SAMCO H75, launched in 2013 according to VietNamNet.
- Emission performance remains the main technical argument, since Hanoi's transport department cited cuts of 53% to 63% in hazardous emissions in June 2019, according to Vietnam News Agency.
- LNG delivery relies on ISO containers moved by truck to satellite stations, which PV GAS described in August 2023 as its method for customers outside pipelines.
- Bi-fuel conversion lets gasoline fleets add CNG tanks while keeping the original fuel, which suits company cars working near southern compression plants.
Need a Custom Version of This Report?
Tailor the scope, geography, or segments to your exact requirements.
- Custom geography or segment scope
- Direct access to our analyst team
Assemblers and gas traders compete on fleet access
Competition splits into vehicle assemblers and gas suppliers, and the second group often decides whether the first can sell. SAMCO is the most visible gas bus assembler, with its H75 model and a stock of unused CNG buses in 2025. THACO AUTO has bus capacity at Chu Lai and also assembles Hyundai commercial vehicles there, while Foton-Auman tractors reach Vietnamese fleets through THACO and Foton's Vietnam sales company. This review found no verified gas model from these truck lines, so gas trucks remain an open field. On the fuel side, PV GAS CNG is the largest CNG trader by its own account and serves over 200 manufacturers. Southern Gas Trading supplied about 146 million cubic meters of CNG in 2024 and fuels Ho Chi Minh City buses, while PV GAS D supplies the gas upstream of it. Competitive position therefore depends on secure fuel contracts as much as on vehicle price.
Assemblers and gas suppliers verified in Vietnam
| Company | Type | Role in the market |
|---|---|---|
| Saigon Transportation Mechanical Corporation (SAMCO) | Bus assembler | Builds CNG city buses and held nearly 100 unused units in 2025 |
| THACO AUTO Corporation | Vehicle assembler | Runs the Chu Lai bus plant and sells Foton-Auman tractors in Vietnam |
| Hyundai Motor Company | OEM partner | Commercial vehicle and minibus lines assembled with THACO in Quang Nam |
| Beiqi Foton Motor Co., Ltd. | Truck OEM | Sells logistics trucks through its Vietnam sales company |
| PV GAS CNG Joint Stock Company | Gas supplier | Trades CNG and LNG by truck and owns one city bus station |
| Southern Gas Trading Joint Stock Company | Gas supplier | Fuels Ho Chi Minh City CNG buses and owns two stations |
| PetroVietnam Low Pressure Gas Distribution JSC | Gas distributor | Supplies input gas for CNG production to Southern Gas Trading |
Gas buses keep a role only where fueling is secured
Credence Research's view is that gas vehicles in Vietnam are a narrow, policy-dependent market rather than a broad alternative fuel story. Ho Chi Minh City's data shows how fast an electric plan can shrink a CNG fleet, yet Hanoi still models a sizable gas role in its first scenario. Buyers should therefore treat fuel contracts and legal cutoff dates as part of the vehicle decision. Trucks offer the larger long-term prize, but no verified gas truck model has reached meaningful sales, so that part of the forecast carries the most uncertainty.
Bus fleet counts and prices underpin these estimates
The report uses 2025 as the base year and forecasts values to 2035. Market values come from the Credence Research model, checked against a bottom-up estimate of reported gas bus fleets, legal vehicle life and reported bus prices. All regional and segment splits are Credence Research estimates built on these inputs. Sources used are government and city transport statements, company releases from PV GAS and THACO, World Bank publications and Vietnamese and regional news reports. No interviews or surveys were conducted for this report at any stage.
Hanoi and freight decide growth through 2035
Value is forecast to rise to USD 26.5 million by 2035 at a 13.78% CAGR, but the path depends on two decisions. Hanoi must keep gas buses in its fleet scenarios beyond the first contract rounds, and Ho Chi Minh City must settle the CNG cutoff date. Freight is the second source of growth, because LNG delivery by truck and rail is widening fuel access in the north. If neither happens, city buses would plateau as electric models take new routes, and growth would fall short of this forecast.
Frequently Asked Questions
How big is the Vietnam automotive natural gas vehicle market?
What growth rate is expected through 2035?
Which vehicle type leads the market?
Which fuel type is growing fastest?
Which region holds the largest share?
Why are electric buses a threat to this market?
What happened with CNG supply in December 2025?
Who are the main companies in this market?
Table of Content
Chapter 1 Market Segmentation
- 1.1 Segmentation Framework
- 1.1.1 Product and Service Classification
- 1.1.2 Application and End-Use Classification
- 1.1.3 Technology and Solution Classification
- 1.1.4 Customer and Distribution Channel Classification
- 1.1.5 Geographic Segmentation
- 1.1.6 Market Segment Definitions and Boundaries
- 1.2 By Vehicle Type
- 1.2.1 City Buses
- 1.2.2 Coaches and Shuttle Buses
- 1.2.3 Medium and Heavy Trucks
- 1.2.4 Light Commercial Vehicles
- 1.2.5 Passenger Cars
- 1.3 By Fuel Type
- 1.3.1 CNG Vehicles
- 1.3.2 LNG Vehicles
- 1.3.3 Bi-Fuel CNG-Gasoline Vehicles
- 1.3.4 Dual-Fuel LNG-Diesel Vehicles
- 1.4 By Customer Type
- 1.4.1 Private Bus Operators
- 1.4.2 Municipal Transit Authorities
- 1.4.3 Logistics Fleets
- 1.4.4 Industrial Fleet Owners
- 1.4.5 Corporate Shuttle Providers
- 1.5 By Sales Channel
- 1.5.1 Direct OEM Sales
- 1.5.2 Government Tenders
- 1.5.3 Authorized Dealers
- 1.5.4 Fleet Conversion Specialists
- 1.5.5 Import Distributors
Chapter 2 Introduction
- 2.1 Report Objectives and Scope
- 2.2 Product Definition and Industry Terminology
- 2.3 Market Inclusions and Exclusions
- 2.4 Research Process
- 2.4.1 Primary Research and Expert Interviews
- 2.4.2 Secondary Research and Source Review
- 2.4.3 Top-Down and Bottom-Up Estimation
- 2.4.4 Data Triangulation and Verification
- 2.5 Market Size Measurement Basis
- 2.5.1 2025: USD 7.29 million → 2035: USD 26.5 million
- 2.6 Historical and Forecast Reference Periods
- 2.6.1 Historical Period: 2018-2025
- 2.6.2 Base Year: 2025
- 2.6.3 Forecast Period: 2025-2035
- 2.7 Research Assumptions and Limitations
Chapter 3 Executive Summary
- 3.1 Market Snapshot and Key Findings
- 3.2 Base-Year Market Size, 2025
- 3.3 Forecast Market Size, 2035
- 3.4 Revenue and Volume Growth Outlook
- 3.5 Key Demand and Supply Indicators
- 3.6 Leading Market Segments
- 3.7 Fastest-Growing Market Opportunities
- 3.8 Regional Performance Highlights
- 3.9 Technology and Industry Transformation
- 3.10 Competitive Landscape Summary
- 3.11 Analyst View and Strategic Implications
Chapter 4 Vietnam Automotive Natural Gas Vehicle Market Trends and Developments
- 4.1 Historical Industry Development, 2018-2025
- 4.2 Recent Market Trends and Developments
- 4.3 Demand and Customer Behavior Trends
- 4.4 Technology and Product Innovation
- 4.5 Artificial Intelligence, Automation and Digitalization
- 4.6 Local Manufacturing and Supply Chain Realignment
- 4.7 Industry Partnerships, Mergers and Acquisitions
- 4.8 Sustainability and Circular Economy Developments
- 4.9 Government and Private Sector Investment Trends
- 4.10 Emerging Business Models and Commercialization
- 4.11 Industry Developments and Announcements
Chapter 5 Vietnam Automotive Natural Gas Vehicle Market Production, Supply and Demand Analysis
- 5.1 Demand Trend and Consumption Analysis, 2018-2025
- 5.2 Demand Forecast, 2025-2035
- 5.3 Production and Output Trend, 2018-2025
- 5.4 Production and Output Forecast, 2025-2035
- 5.5 Installed Capacity and Capacity Utilization
- 5.6 Company-Wise Production Plants and Statistics
- 5.6.1 Installed Production Capacity
- 5.6.2 Actual Production
- 5.6.3 Planned Capacity and Expansion Targets
- 5.7 Supply Chain Structure and Procurement Trends
- 5.8 Supply-Demand Gap and Bottlenecks
- 5.9 Import Dependence and Sourcing Structure
- 5.10 Contract Manufacturing and Outsourcing
- 5.11 Regional Supply and Demand Concentration
Chapter 6 Vietnam Automotive Natural Gas Vehicle Market Pricing Analysis
- 6.1 Pricing Structure and Measurement
- 6.2 Historical Pricing Trends, 2018-2025
- 6.3 Pricing Outlook, 2025-2035
- 6.4 Average Selling Price and Unit Economics
- 6.5 Pricing by Product and Market Segment
- 6.6 Geographic Pricing Differences
- 6.7 Key Input, Energy, Labor and Logistics Costs
- 6.8 Contract Pricing and Purchasing Models
- 6.9 Pricing Sensitivity and Competitive Positioning
- 6.10 Price, Margin and Profitability Implications
Chapter 7 Vietnam Automotive Natural Gas Vehicle Market Dynamics
- 7.1 Market Growth Drivers
- 7.1.1 Demand-Side Drivers
- 7.1.2 Technology and Innovation Drivers
- 7.1.3 Infrastructure and Investment Drivers
- 7.1.4 Regulatory and Policy Drivers
- 7.2 Market Restraints
- 7.2.1 Cost and Affordability Constraints
- 7.2.2 Technology and Adoption Barriers
- 7.2.3 Supply Chain and Operational Constraints
- 7.3 Market Challenges
- 7.3.1 Competitive Pressure and Margin Erosion
- 7.3.2 Skills, Infrastructure and Implementation Gaps
- 7.4 Emerging Market Opportunities
- 7.5 Market Dynamics Impact and Time-Horizon Assessment
Chapter 8 Vietnam Automotive Natural Gas Vehicle Value Chain Analysis
- 8.1 Industry Value Chain Overview
- 8.2 Upstream Suppliers and Critical Inputs
- 8.3 Technology and Component Providers
- 8.4 Manufacturing or Service Delivery
- 8.5 Distribution, Channel Partners and Integrators
- 8.6 Downstream Applications and End Users
- 8.7 Value Addition and Profit Pools
- 8.8 Vertical Integration and Outsourcing
- 8.9 Supplier Concentration and Risk
- 8.10 Supply Chain Localization and Resilience
Chapter 9 Vietnam Automotive Natural Gas Vehicle Market Regulations and Policies
- 9.1 Relevant Laws, Standards and Compliance Frameworks
- 9.2 Product, Service, Safety and Quality Requirements
- 9.3 Government Policies, Incentives and Subsidies
- 9.4 Imports, Exports and Trade Barriers
- 9.5 Public Procurement and Local Content Requirements
- 9.6 Environmental and Sustainability Compliance
- 9.7 Upcoming Policy Changes and Market Implications
Chapter 10 Vietnam Automotive Natural Gas Vehicle Market Hotspots and Opportunities
- 10.1 Market Opportunity Mapping and Growth Hotspots
- 10.2 High-Growth Applications and Customer Groups
- 10.3 Underserved Markets and White-Space Opportunities
- 10.4 Emerging Technology and Product Opportunities
- 10.5 New Capacity and Investment Hotspots
- 10.6 Market Entry and Expansion Opportunities
- 10.7 Distribution and Partnership Opportunities
- 10.8 Near-Term and Long-Term Commercial Potential
- 10.9 Opportunity Attractiveness and Execution Risks
Chapter 11 Vietnam Automotive Natural Gas Vehicle Market Outlook, 2025-2035
- 11.1 Market Size and Analysis
- 11.1.1 Revenue (Market Measurement: 2025: USD 7.29 million → 2035: USD 26.5 million)
- 11.1.2 Market Volume and Quantity Sold
- 11.1.3 Historical Market Size, 2018-2025
- 11.1.4 Base-Year Market Size, 2025
- 11.2 Market Forecast, 2025-2035
- 11.2.1 Revenue Forecast to 2035
- 11.2.2 Volume Forecast to 2035
- 11.2.3 CAGR and Year-on-Year Growth
- 11.2.4 Incremental Revenue Opportunity
- 11.3 Forecast Assumptions and Scenario Analysis
- 11.3.1 Base-Case Forecast
- 11.3.2 Optimistic and Conservative Scenarios
- 11.3.3 Technology, Pricing and Policy Sensitivities
- 11.4 Market Attractiveness and Growth Outlook
Chapter 12 Vietnam Automotive Natural Gas Vehicle Market Segmentation and Outlook
- 12.1 Segmentation Summary and Market Shares, 2025
- 12.2 Largest and Fastest-Growing Segments
- 12.3 By Vehicle Type - Market Size and Forecast, 2025-2035
- 12.3.1 Segment Definition and Scope
- 12.3.2 Historical Market Size, 2018-2025
- 12.3.3 Revenue Forecast, 2025-2035
- 12.3.4 Volume Forecast, 2025-2035
- 12.3.5 Base-Year Market Share, 2025
- 12.3.6 Segment CAGR and Growth Drivers
- 12.3.7 Subsegment Market Size and Forecast
- 12.3.7.1 City Buses
- 12.3.7.2 Coaches and Shuttle Buses
- 12.3.7.3 Medium and Heavy Trucks
- 12.3.7.4 Light Commercial Vehicles
- 12.3.7.5 Passenger Cars
- 12.3.8 Subsegment Pricing and Adoption Trends
- 12.3.9 Leading Suppliers and Competition
- 12.3.10 Regional Demand and Opportunities
- 12.4 By Fuel Type - Market Size and Forecast, 2025-2035
- 12.4.1 Segment Definition and Scope
- 12.4.2 Historical Market Size, 2018-2025
- 12.4.3 Revenue Forecast, 2025-2035
- 12.4.4 Volume Forecast, 2025-2035
- 12.4.5 Base-Year Market Share, 2025
- 12.4.6 Segment CAGR and Growth Drivers
- 12.4.7 Subsegment Market Size and Forecast
- 12.4.7.1 CNG Vehicles
- 12.4.7.2 LNG Vehicles
- 12.4.7.3 Bi-Fuel CNG-Gasoline Vehicles
- 12.4.7.4 Dual-Fuel LNG-Diesel Vehicles
- 12.4.8 Subsegment Pricing and Adoption Trends
- 12.4.9 Leading Suppliers and Competition
- 12.4.10 Regional Demand and Opportunities
- 12.5 By Customer Type - Market Size and Forecast, 2025-2035
- 12.5.1 Segment Definition and Scope
- 12.5.2 Historical Market Size, 2018-2025
- 12.5.3 Revenue Forecast, 2025-2035
- 12.5.4 Volume Forecast, 2025-2035
- 12.5.5 Base-Year Market Share, 2025
- 12.5.6 Segment CAGR and Growth Drivers
- 12.5.7 Subsegment Market Size and Forecast
- 12.5.7.1 Private Bus Operators
- 12.5.7.2 Municipal Transit Authorities
- 12.5.7.3 Logistics Fleets
- 12.5.7.4 Industrial Fleet Owners
- 12.5.7.5 Corporate Shuttle Providers
- 12.5.8 Subsegment Pricing and Adoption Trends
- 12.5.9 Leading Suppliers and Competition
- 12.5.10 Regional Demand and Opportunities
- 12.6 By Sales Channel - Market Size and Forecast, 2025-2035
- 12.6.1 Segment Definition and Scope
- 12.6.2 Historical Market Size, 2018-2025
- 12.6.3 Revenue Forecast, 2025-2035
- 12.6.4 Volume Forecast, 2025-2035
- 12.6.5 Base-Year Market Share, 2025
- 12.6.6 Segment CAGR and Growth Drivers
- 12.6.7 Subsegment Market Size and Forecast
- 12.6.7.1 Direct OEM Sales
- 12.6.7.2 Government Tenders
- 12.6.7.3 Authorized Dealers
- 12.6.7.4 Fleet Conversion Specialists
- 12.6.7.5 Import Distributors
- 12.6.8 Subsegment Pricing and Adoption Trends
- 12.6.9 Leading Suppliers and Competition
- 12.6.10 Regional Demand and Opportunities
- 12.7 Segment Growth Comparison
- 12.8 Segment Attractiveness and Priority Matrix
Chapter 13 Vietnam Automotive Natural Gas Vehicle End-Use and Application Market Outlook
- 13.1 End-Use Industry and Customer Demand Structure
- 13.2 Leading Applications and Customer Groups
- 13.3 End-Use Market Size, Share and Forecast
- 13.4 Major End-Use Industry Deep Dives
- 13.4.1 Customer Requirements and Use Cases
- 13.4.2 Demand and Replacement Cycles
- 13.4.3 Technical and Regulatory Considerations
- 13.4.4 Purchasing and Procurement Models
- 13.4.5 Leading Vendors and Distribution Channels
- 13.4.6 Forecast and Commercial Opportunities
- 13.5 Emerging Applications and Cross-Segment Demand
- 13.6 End-Use Industry Investment Priorities
Chapter 14 Vietnam Automotive Natural Gas Vehicle Geographic Market Outlook, 2025-2035
- 14.1 Domestic Market Distribution and Demand Clusters
- 14.2 State- or Province-Wise Market Size and Forecast, 2025-2035
- 14.3 City and Metropolitan Market Outlook
- 14.4 Industrial, Manufacturing and Commercial Clusters
- 14.5 Geographic Concentration of Key End Users
- 14.6 Local Pricing and Purchasing Differences
- 14.7 Domestic Production Facilities and Capacity Map
- 14.8 Local Infrastructure and Project Pipeline
- 14.9 State-Level Policy and Incentive Differences
- 14.10 Subnational Investment Hotspots and Opportunities
- 14.11 Distribution and Logistics Networks
- 14.12 Domestic Competitive Footprint
Chapter 15 Vietnam Automotive Natural Gas Vehicle Technology, Innovation and Sustainability Outlook
- 15.1 Technology Landscape and Maturity
- 15.2 Product, Process and Service Innovation
- 15.3 AI, Automation and Digital Tools in the Industry
- 15.4 Technology Adoption and Performance Benchmarking
- 15.5 Innovation Pipeline and R&D Investment
- 15.6 Patent and Intellectual Property Trends
- 15.7 Energy Efficiency and Resource Management
- 15.8 Sustainability, Recycling and Circularity
- 15.9 Technology Roadmap, 2025-2035
- 15.10 Risks of Obsolescence and Technology Substitution
Chapter 16 Vietnam Automotive Natural Gas Vehicle Market Key Strategic Imperatives
- 16.1 Growth and Market Entry Priorities
- 16.2 High-Return Products and Segments
- 16.3 Pricing, Profitability and Cost Optimization
- 16.4 Technology Investment and Product Differentiation
- 16.5 Supply Chain Localization and Resilience
- 16.6 Distribution and Customer Acquisition
- 16.7 Partnership, Acquisition and Capacity Strategy
- 16.8 Regional Expansion Priorities
- 16.9 Short-, Medium- and Long-Term Actions
Chapter 17 Competition Outlook
- 17.1 Industry Competition Characteristics
- 17.2 Market Structure and Concentration
- 17.3 Market Share and Competitive Positioning, 2025
- 17.4 Company-Wise Revenue and Product Benchmarking
- 17.5 Production and Service Capacity Benchmarking
- 17.6 Technology, Pricing and Differentiation
- 17.7 Regional Footprint and Distribution Strength
- 17.8 Mergers, Acquisitions and Strategic Alliances
- 17.9 New Entrants and Competitive Threats
- 17.10 Porter's Five Forces and Industry Attractiveness
- 17.11 Competitive Outlook, 2025-2035
Chapter 18 Company Profiles
- 18.1 Company Coverage and Selection Criteria
- 18.2 Saigon Transportation Mechanical Corporation (SAMCO)
- 18.2.1 Business Description
- 18.2.2 Company Ownership and Geographic Presence
- 18.2.3 Product and Service Portfolio
- 18.2.4 Manufacturing and Operating Footprint
- 18.2.5 Production Capacity and Expansion Plans
- 18.2.6 Financial Performance and Investment
- 18.2.7 Market Share and Competitive Position
- 18.2.8 Technology and Innovation Capabilities
- 18.2.9 Strategic Alliances or Partnerships
- 18.2.10 Recent Developments
- 18.2.11 Growth Strategy and Outlook
- 18.3 Hyundai Motor Company
- 18.4 Zyle Daewoo Bus Corporation
- 18.5 THACO AUTO Corporation
- 18.6 Yutong Bus Co., Ltd.
- 18.7 Beiqi Foton Motor Co., Ltd.
- 18.8 Xiamen King Long United Automotive Industry Co., Ltd.
- 18.9 PV GAS CNG Joint Stock Company
- 18.10 PetroVietnam Low Pressure Gas Distribution JSC
- 18.11 Southern Gas Trading Joint Stock Company
- 18.12 Other Relevant Market Participants
Note: Every listed company is profiled on the structure shown under the first company. The company list is preliminary and may change based on research findings, market developments, data availability and client requirements.
Chapter 19 Disclaimer
- 19.1 Research and Forecast Disclaimer
- 19.2 Data Source and Estimation Limitations
Note: The depth of individual sections depends on data availability for this market. Volume, capacity, trade and other unit-based metrics are included where applicable.

