
Fleet renewal and robots set the regional spending pace
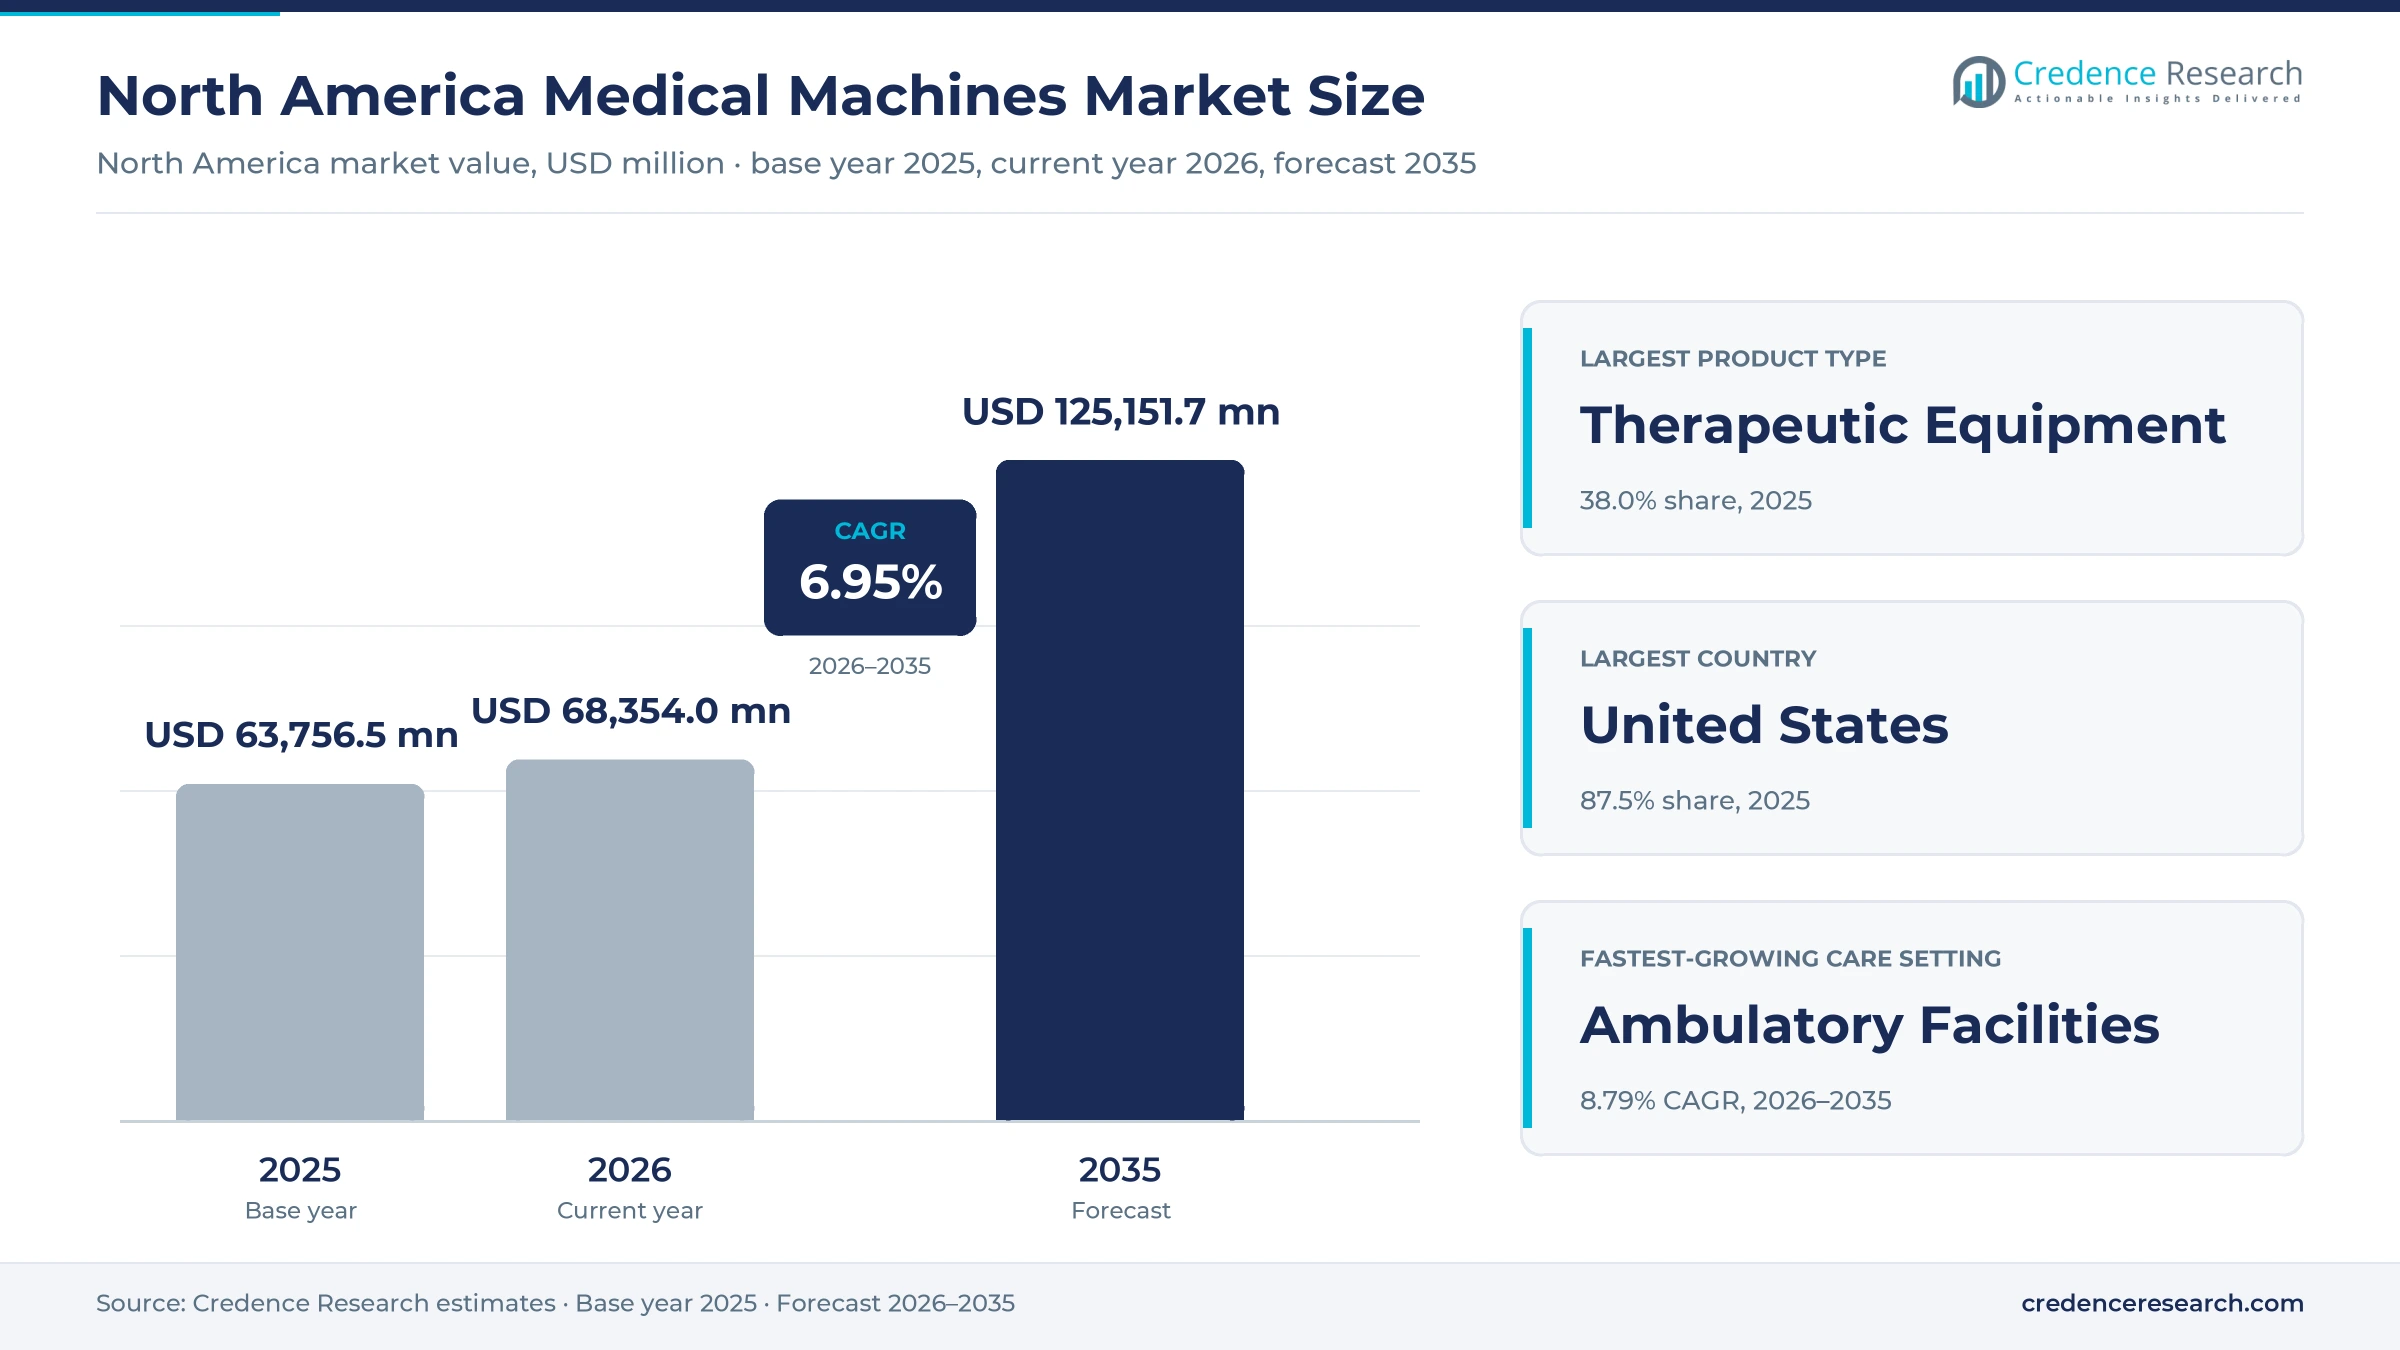
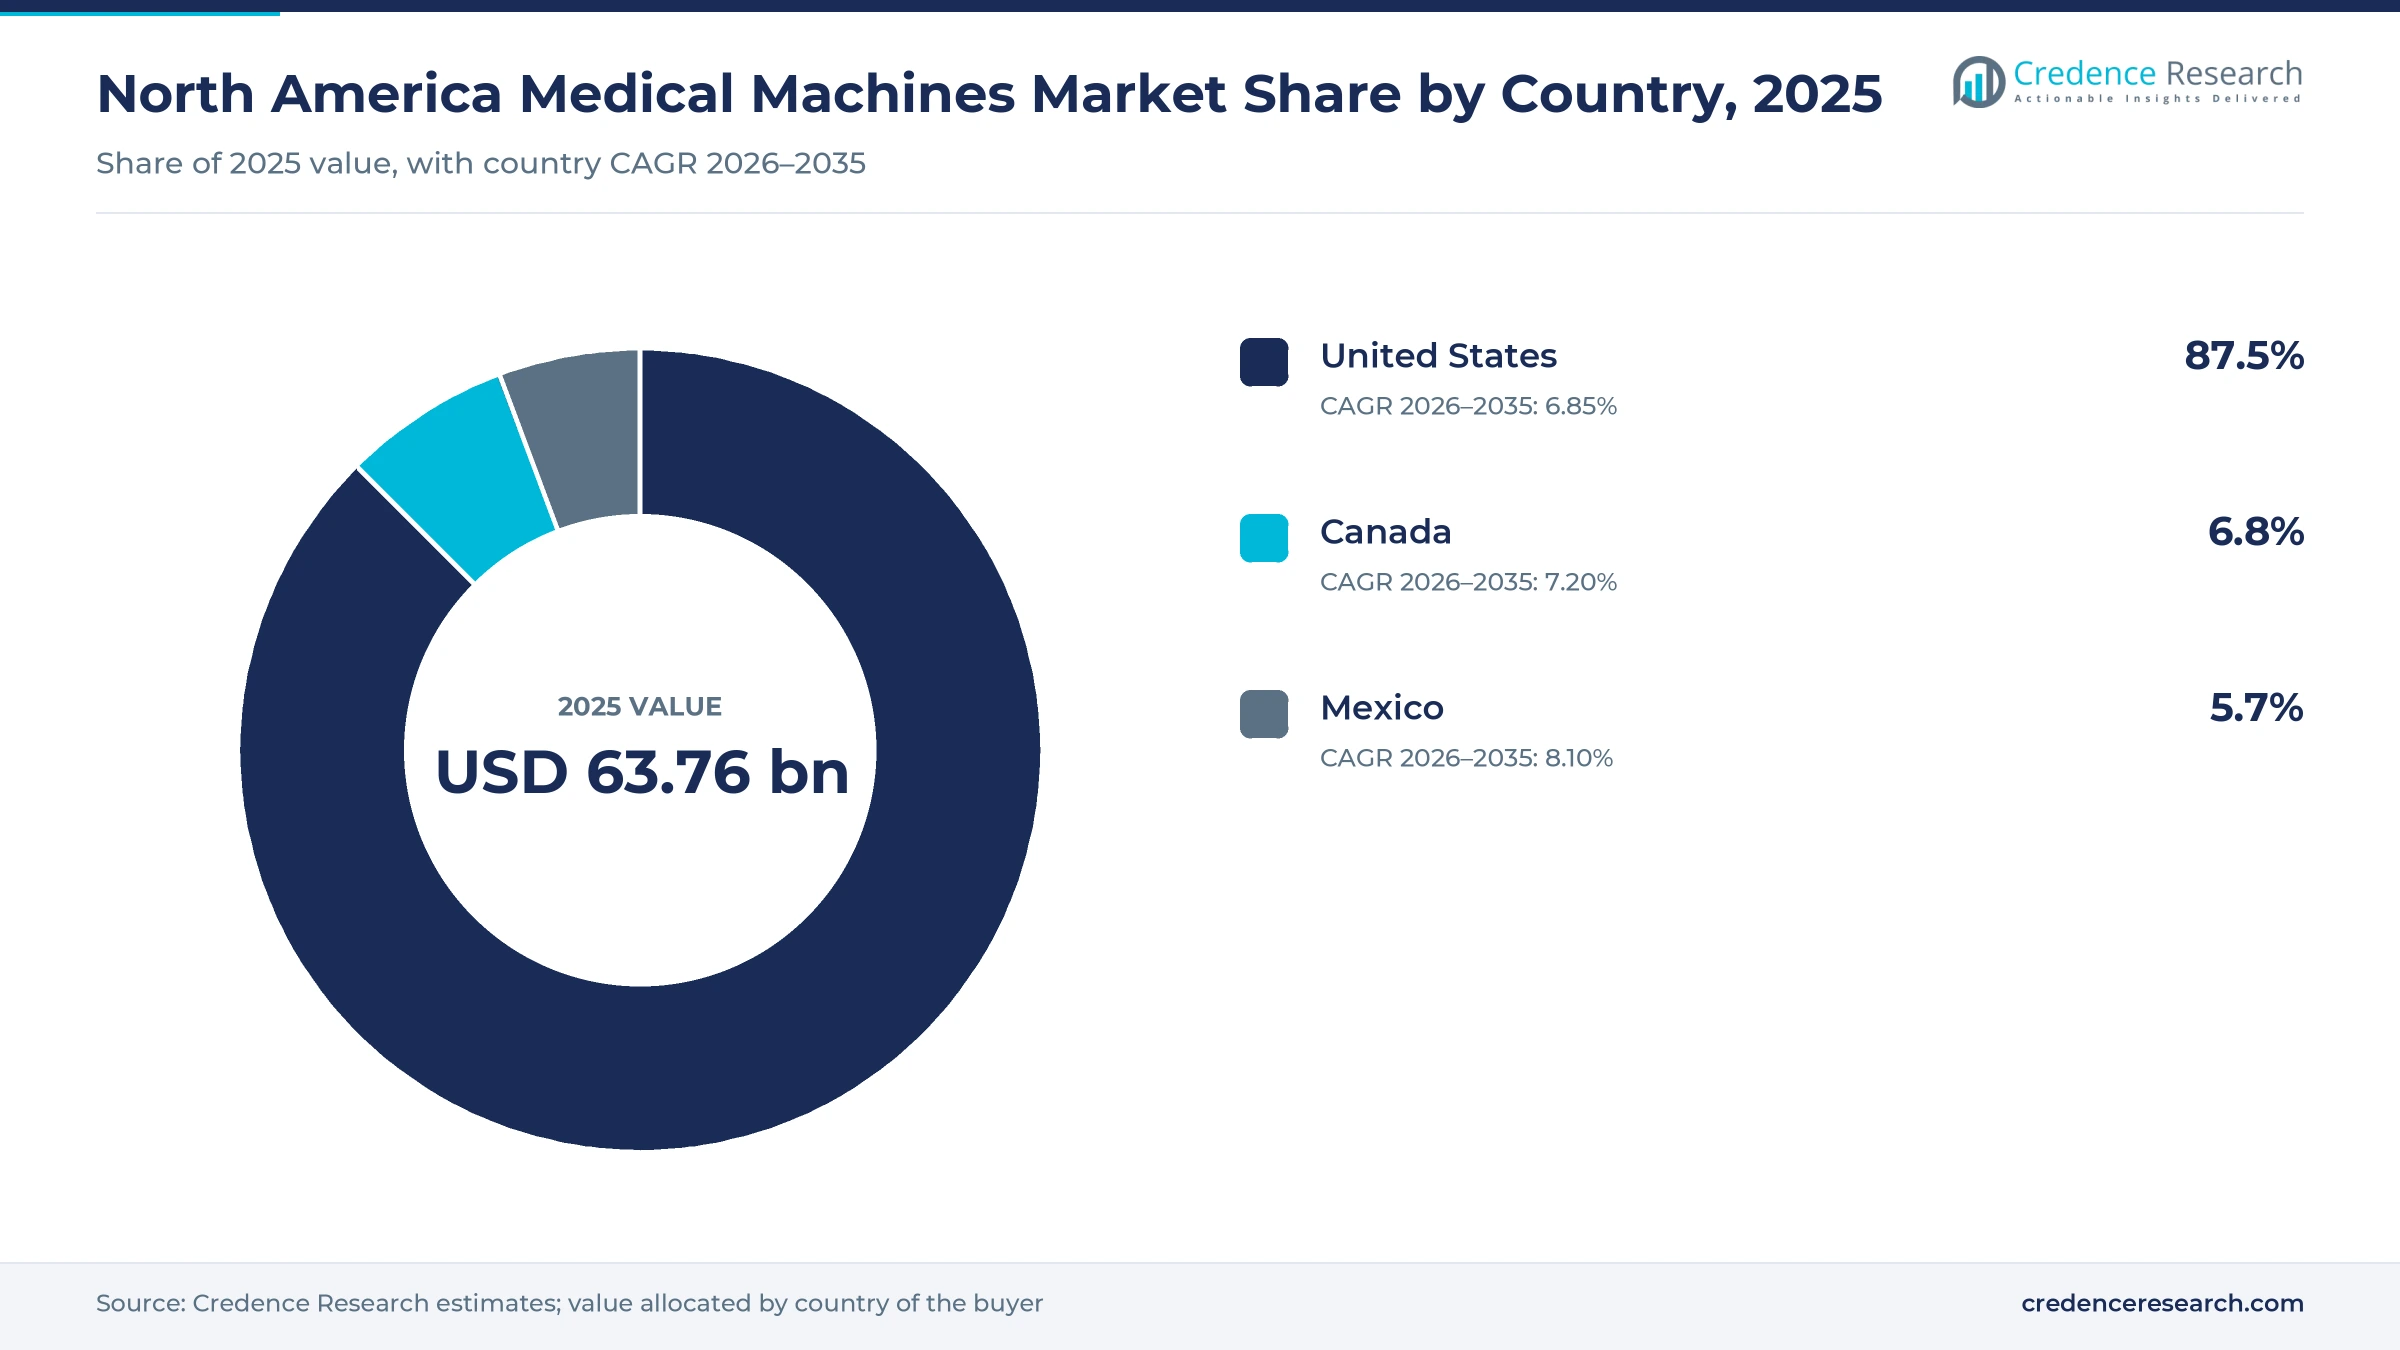
The North America medical machines market was valued at USD 63.76 billion in 2025 and is projected to increase from USD 68.35 billion in 2026 to USD 125.15 billion by 2035, registering a CAGR of 6.95% during 2026–2035. Demand comes from hospitals replacing scanners and robots bought before the pandemic, a surgical shift toward automation, and Medicare rules that move complex procedures into outpatient rooms. United States held the largest share, 87.5% in 2025, because its hospital systems buy most of the premium imaging and robotic platforms sold on the continent. Mexico is the fastest-growing country at 8.10% a year, supported by a federal program announced in January 2026 to buy 816 high-technology units for public institutions. On the technology side, the FDA cleared the Photonova Spectra photon-counting CT system from GE HealthCare in March 2026, which gives American hospitals a second whole-body photon-counting supplier and a fresh reason to reassess older CT rooms during the current renewal cycle.
What counts as a medical machine in this North American estimate?
The medical machines estimate counts powered capital equipment that diagnoses, monitors or treats patients, including CT, MRI, ultrasound and x-ray systems, bedside and remote monitors, surgical robots, dialysis machines, radiation therapy systems and procedural equipment. Hospitals usually buy medical machines through capital budgets, multiyear leases or group contracts, and they often pair a purchase with a long service agreement.
Implants, disposable instruments, reagents and pharmaceuticals fall outside the estimate, even when they are used alongside a counted machine. The value chain runs from component suppliers and contract plants, many of them in Mexico, through original manufacturers, distributors and integrators, and on to hospital systems, outpatient operators, public purchasing agencies and households using home equipment.
North America Medical Machines Market Insights
- The market grows from USD 63.76 billion in 2025 to USD 125.15 billion by 2035, a 6.95% CAGR over 2026–2035, as installed fleets are renewed and robots spread.
- The United States held 87.5% of value in 2025, while Mexico is the fastest-growing country at 8.10% a year on federal equipment purchasing.
- Therapeutic equipment led product types with 38.0% of 2025 value, supported by surgical robot placements and the large installed base of dialysis stations.
- Medicare added 560 codes to the ambulatory surgical center procedure list for 2026, which moves capital equipment decisions beyond the hospital campus and into outpatient operators.
- Siemens Healthineers and Philips each announced American plant or supply investments of about $150 million or more during 2025, while federal tariff reviews were getting underway.
Therapeutic systems and hospital buyers anchor 2025 value
Why therapeutic equipment leads and monitoring grows fastest
Based on product type, the market is categorized into diagnostic imaging systems, patient monitoring systems, therapeutic equipment and procedural support equipment. Therapeutic Equipment led with 38.0% of 2025 value because surgical robots and dialysis platforms combine high unit values with steady installation, and MedPAC counted 138,500 hemodialysis stations in 2023. Patient Monitoring Systems grow fastest at 7.79% a year as Medicare added CPT code 99445 for 2026, which pays for device supply across 2 to 15 days of monthly data transmission, according to Health Recovery Solutions. Shorter episodes therefore become billable, which widens the use of patient monitoring devices outside inpatient wards.
How hospital campuses keep the lead as outpatient sites gain
Based on care setting, the market is categorized into hospital campuses, ambulatory facilities, home care and long-term care facilities. Hospital Campuses led with 71.0% of 2025 value because they run the highest-cost imaging and robotic rooms, and Becker's ASC reported a 2026 outpatient conversion factor of $91.415 against $56.322 for surgical centers. Ambulatory Facilities grow fastest at 8.79% a year as Medicare added 560 codes to the surgical center list in its November 2025 final rule, including ablations and spine fusion. Operators then need catheterization rooms, imaging and mapping systems they rarely purchased before.
Why private health systems dominate purchasing decisions
Based on end user, the market is categorized into private health systems, independent providers, public purchasing bodies and households. Private Health Systems led with 66.0% of 2025 value because integrated networks control most premium capital, and Intuitive said in January 2026 that 70% of its surgical center opportunity sits in centers affiliated with existing network customers. Households grow fastest at 8.68% a year from a small base as home treatment widens, and MedPAC data show home modalities rose from about 7% of dialysis patients in 2012 to about 10% in 2022, supporting demand for kidney dialysis equipment.
How connected fleets lead while intelligent systems scale
Based on technology, the market is categorized into intelligent systems, connected conventional systems and standalone conventional systems. Connected Conventional Systems led with 51.0% of 2025 value because most installed monitors and scanners already link to hospital networks, and the FDA treats software-bearing devices with connectivity as cyber devices under rules effective since March 2023. Intelligent Systems grow fastest at 8.90% a year as regulators had authorized 1,430 AI-enabled devices by December 2025, including 1,094 in radiology, according to AuntMinnie. Buyers increasingly compare these functions in scanner tenders, which pushes older standalone equipment toward replacement at the next budget cycle.
| Segment Group | Leading Sub-segment | Share, 2025 | Fastest-growing Sub-segment | CAGR, 2026–2035 |
|---|---|---|---|---|
| By Product Type | Therapeutic Equipment | 38.0% | Patient Monitoring Systems | 7.79% |
| By Care Setting | Hospital Campuses | 71.0% | Ambulatory Facilities | 8.79% |
| By End User | Private Health Systems | 66.0% | Households | 8.68% |
| By Technology | Connected Conventional Systems | 51.0% | Intelligent Systems | 8.90% |
Request a Free Sample
Fill in your details and we'll send you a free sample report.
- Sample data tables & charts
- Research methodology
Aging fleets and surgical robots lift capital budgets
Replacement-led capital renewal after the pandemic pause
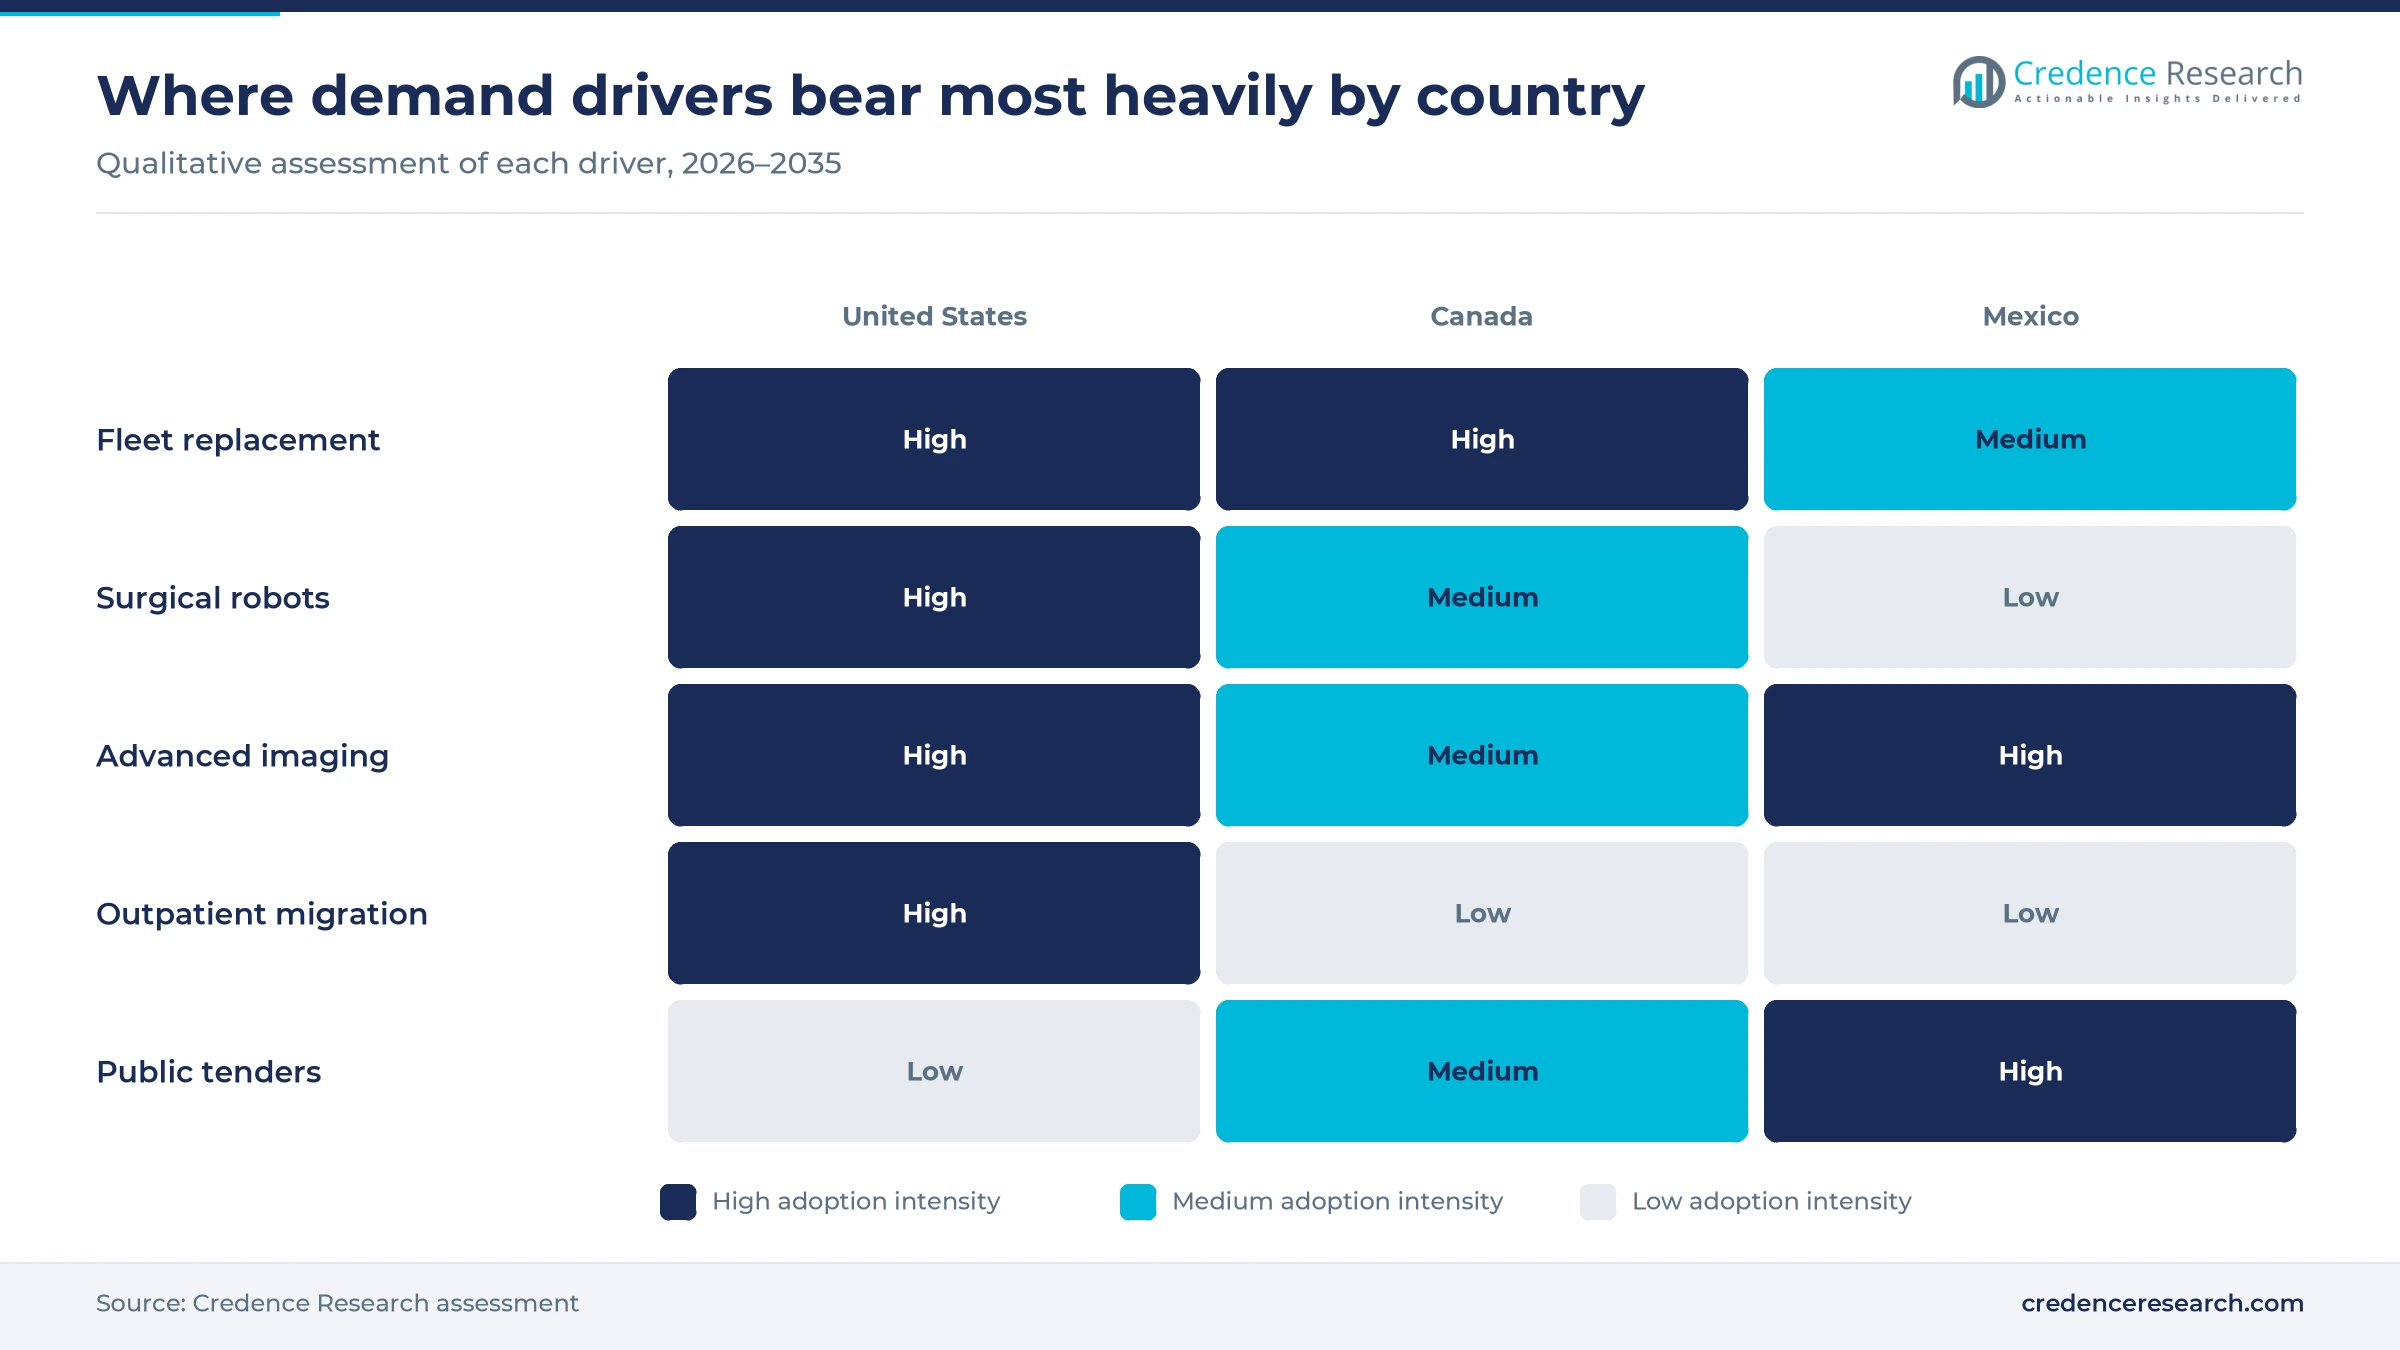
Capital renewal is the steadiest source of demand for medical machines because hospitals deferred purchases during the pandemic and now face aged fleets. GE HealthCare chief executive Peter Arduini told investors in July 2025 that American hospitals were replacing an aging installed base after that pause, according to MedTech Dive. Robotic fleets show the same pattern, because Intuitive reported 146 trade-in transactions in the fourth quarter of 2025, up from 62 a year earlier. In Canada, the national imaging inventory counted 544 CT and 403 MRI units in 2022-2023, and about one-third of them were at least 10 years old. The Canadian Association of Radiologists advises that clinical life should not exceed 15 years, so the backlog carries a clear deadline for provincial buyers.
Surgical automation adoption widens the robot base
Surgical automation lifts therapeutic spending because each new robot brings a costly console, a service contract and recurring training needs. MDDI reported in January 2026 that American da Vinci procedures rose 15% in 2025 to more than 2 million, and that Intuitive placed 1,721 systems worldwide, including 870 da Vinci 5 units. The same report said the da Vinci 5 had gained FDA clearance for several cardiac procedures, which opens a specialty the platform previously could not address. Competition also widened in December 2025, when Medtronic announced FDA clearance of Hugo for urologic procedures, a field of about 230,000 American surgeries a year. As a result, hospitals considering robotic-assisted surgery now have more than one multiport supplier.
Advanced imaging modernization follows the cancer burden
Imaging modernization draws on oncology and cardiac workloads that older scanners handle slowly. Cancer Statistics, 2026 projects about 2,114,850 new cancer cases and 626,140 deaths in the United States in 2026, according to the American Cancer Society, and many of those patients need repeated CT, MRI and PET studies. Medicare payment also supports screening volume, because AuntMinnie reported that low-dose CT lung screening moved to a $106.81 rate for 2026. This matters most for older CT and MRI rooms, where longer scan times limit the number of studies each shift can complete. Hospitals that intend to absorb those studies without adding staff therefore favor faster scanners and workflow automation when they refresh older rooms.
Outpatient migration creates a second buyer group
Medicare policy now creates a second capital buyer alongside the hospital. Becker's ASC reported that the 2026 rule adds 289 procedures already paid in hospital outpatient departments plus 271 removed from the inpatient-only list to the surgical center list. It also removes 285 services from the inpatient-only list in 2026 and phases that list out over three years. Cardiac catheter ablation became payable in surgical centers from January 2026, according to Cardiovascular Business, so electrophysiology groups need mapping, fluoroscopy and recording equipment in new settings. Intuitive told investors that surgical center volume remains small but is growing faster than its American total, and it began by focusing on higher-volume centers that can sustain a robotic program.
Photon-counting CT and home care reshape equipment plans
Shift toward photon-counting CT in American flagship hospitals
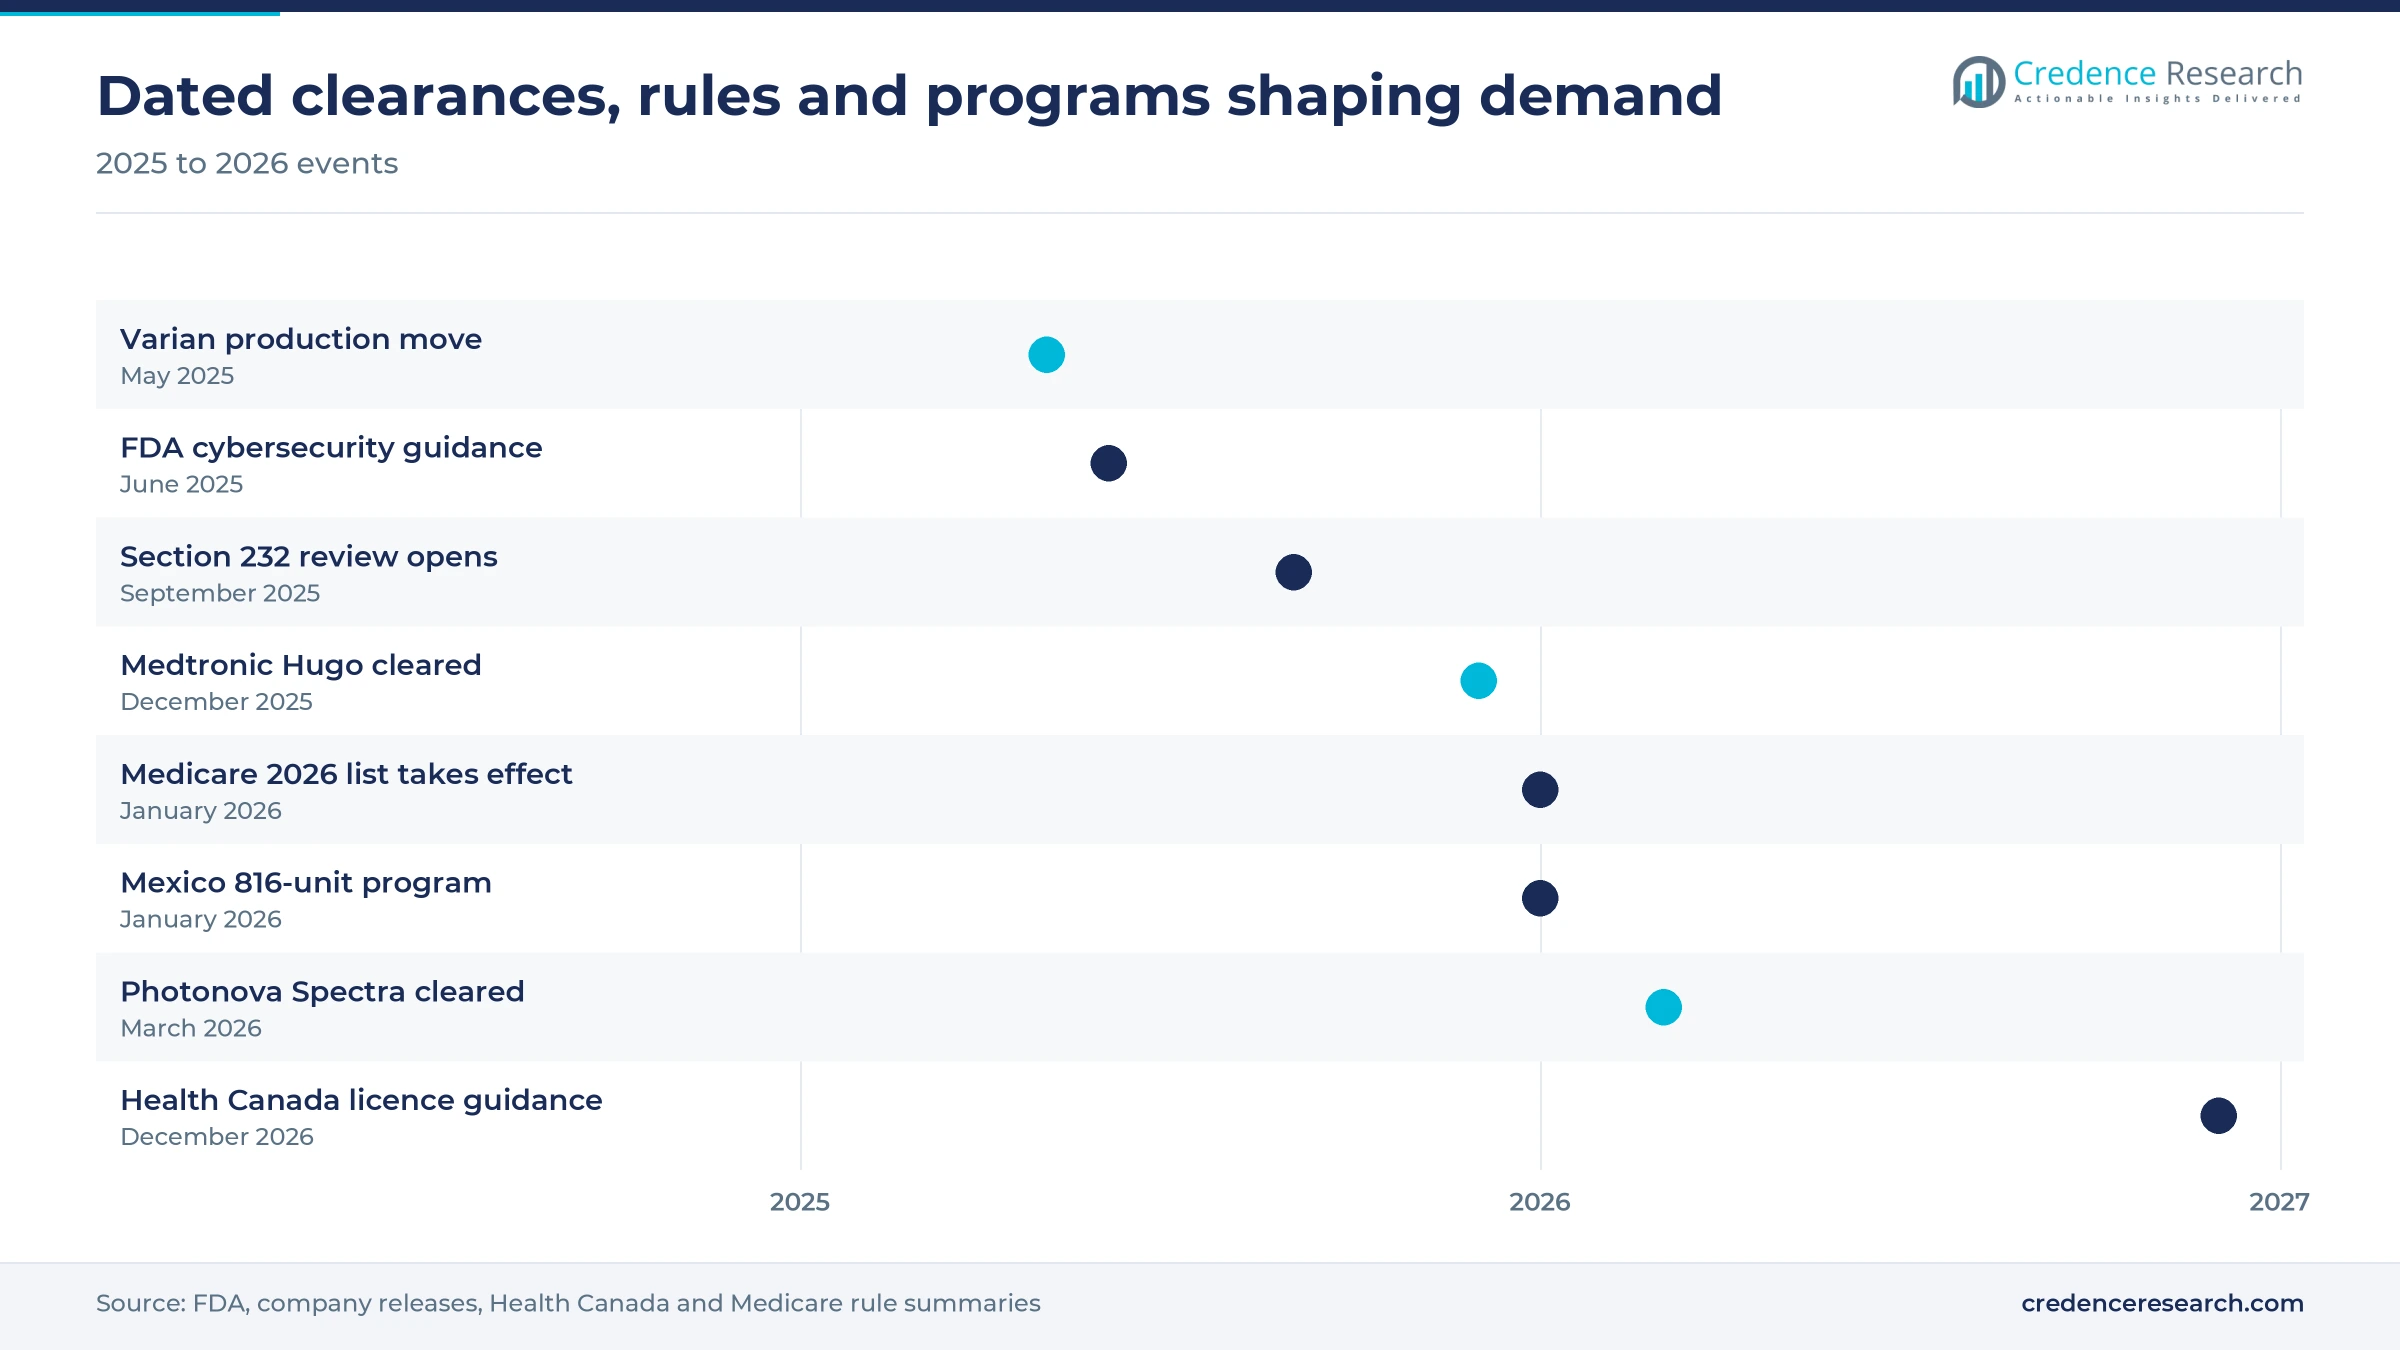
Photon-counting CT is shifting from a single-supplier whole-body technology into a contested category, since MedTech Dive reported that Siemens Healthineers had the first such machine, cleared in 2021, and that change affects flagship room plans. GE HealthCare said its Photonova Spectra, cleared in March 2026, uses Deep Silicon detectors with 8-bin spectral resolution and a 0.23-second rotation. The company also said the system can be installed in existing CT-ready rooms with minimal changes, which removes a common construction cost from the business case. UW-Madison served as the first American clinical evaluation site, while Stanford Medicine ran research on it, which gives the program 2 named American sites. Because the release said the system was not yet for sale in Canada, American hospitals will see this competition first, and Canadian provinces will likely evaluate it at a later replacement round.
Rise of AI functions in imaging purchases
AI functions are moving from separate software purchases into the specification of the machine itself. AuntMinnie reported in July 2026 that radiology accounted for 76.5% of AI-enabled authorizations through December 2025, citing a study in Cureus. In Canada, national inventory data show that sites using AI on CT rose from 47 to 98, an increase of 108.5%. GE HealthCare also said its new CT reconstruction relies on NVIDIA GPU acceleration to handle up to 50 times more data than a conventional scanner. Philips likewise tied its plan of more than $150 million in American manufacturing and research, announced in August 2025, to AI-powered technology, so procurement teams increasingly score computing capacity alongside image quality.
Opportunity in equipment for hospital-level care at home
Home-based acute care offers an opening for monitor, infusion and dialysis suppliers now that its payment horizon is longer. The American Medical Association reported in March 2026 that the Consolidated Appropriations Act extended the Medicare waiver through 2030, and 366 programs across 139 health systems in 37 states already hold approval. Becker's ASC noted that some systems had hesitated to start programs without that long-term certainty. New billing also helps, because the 2026 fee schedule set the short-episode monitoring code at a national rate of $52.11. Suppliers that package connected kits with logistics and support can therefore sell to home healthcare operators and hospital programs that lack experience running equipment outside their own walls.
Opportunity in Mexican public purchasing and Canadian renewal
Public programs in Mexico and Canada offer an opening for suppliers that can handle tenders and long service commitments. Por Esto reported in January 2026 that federal officials plan 816 high-technology units for 2026, at an estimated 11,257 million pesos, across IMSS, ISSSTE, IMSS-Bienestar, Pemex and national institutes. IMSS alone bought 123 units, including 67 mammography systems, 42 CT scanners, 12 MRI systems and two angiographs, and reported savings of 45% through reverse auction. Canada adds a separate pipeline, since Canadian Healthcare Technology, citing the Fraser Institute, reported in March 2026 that median MRI waits reached 18.1 weeks and the country ranked 27th of 31 on MRI per capita. Vendors therefore need sharper pricing in Mexico and stronger wait-time evidence for Canadian provinces.
Tariffs, staffing and payment limit purchase timing
Section 232 tariffs add cost and planning risk
Trade policy is the largest near-term cost risk for imported medical machines. The Commerce Department opened a Section 232 investigation in September 2025 that, according to Baker Donelson, covers CT scanners, MRI machines and x-ray equipment. Intuitive already expects tariffs to cost about 1.2% of net revenue in 2026, up from about 65 basis points in 2025. Hospitals could therefore face higher quotes on long-lead equipment, and suppliers are responding with local plants and selective price increases.
Technologist shortages limit how fast scanners earn back
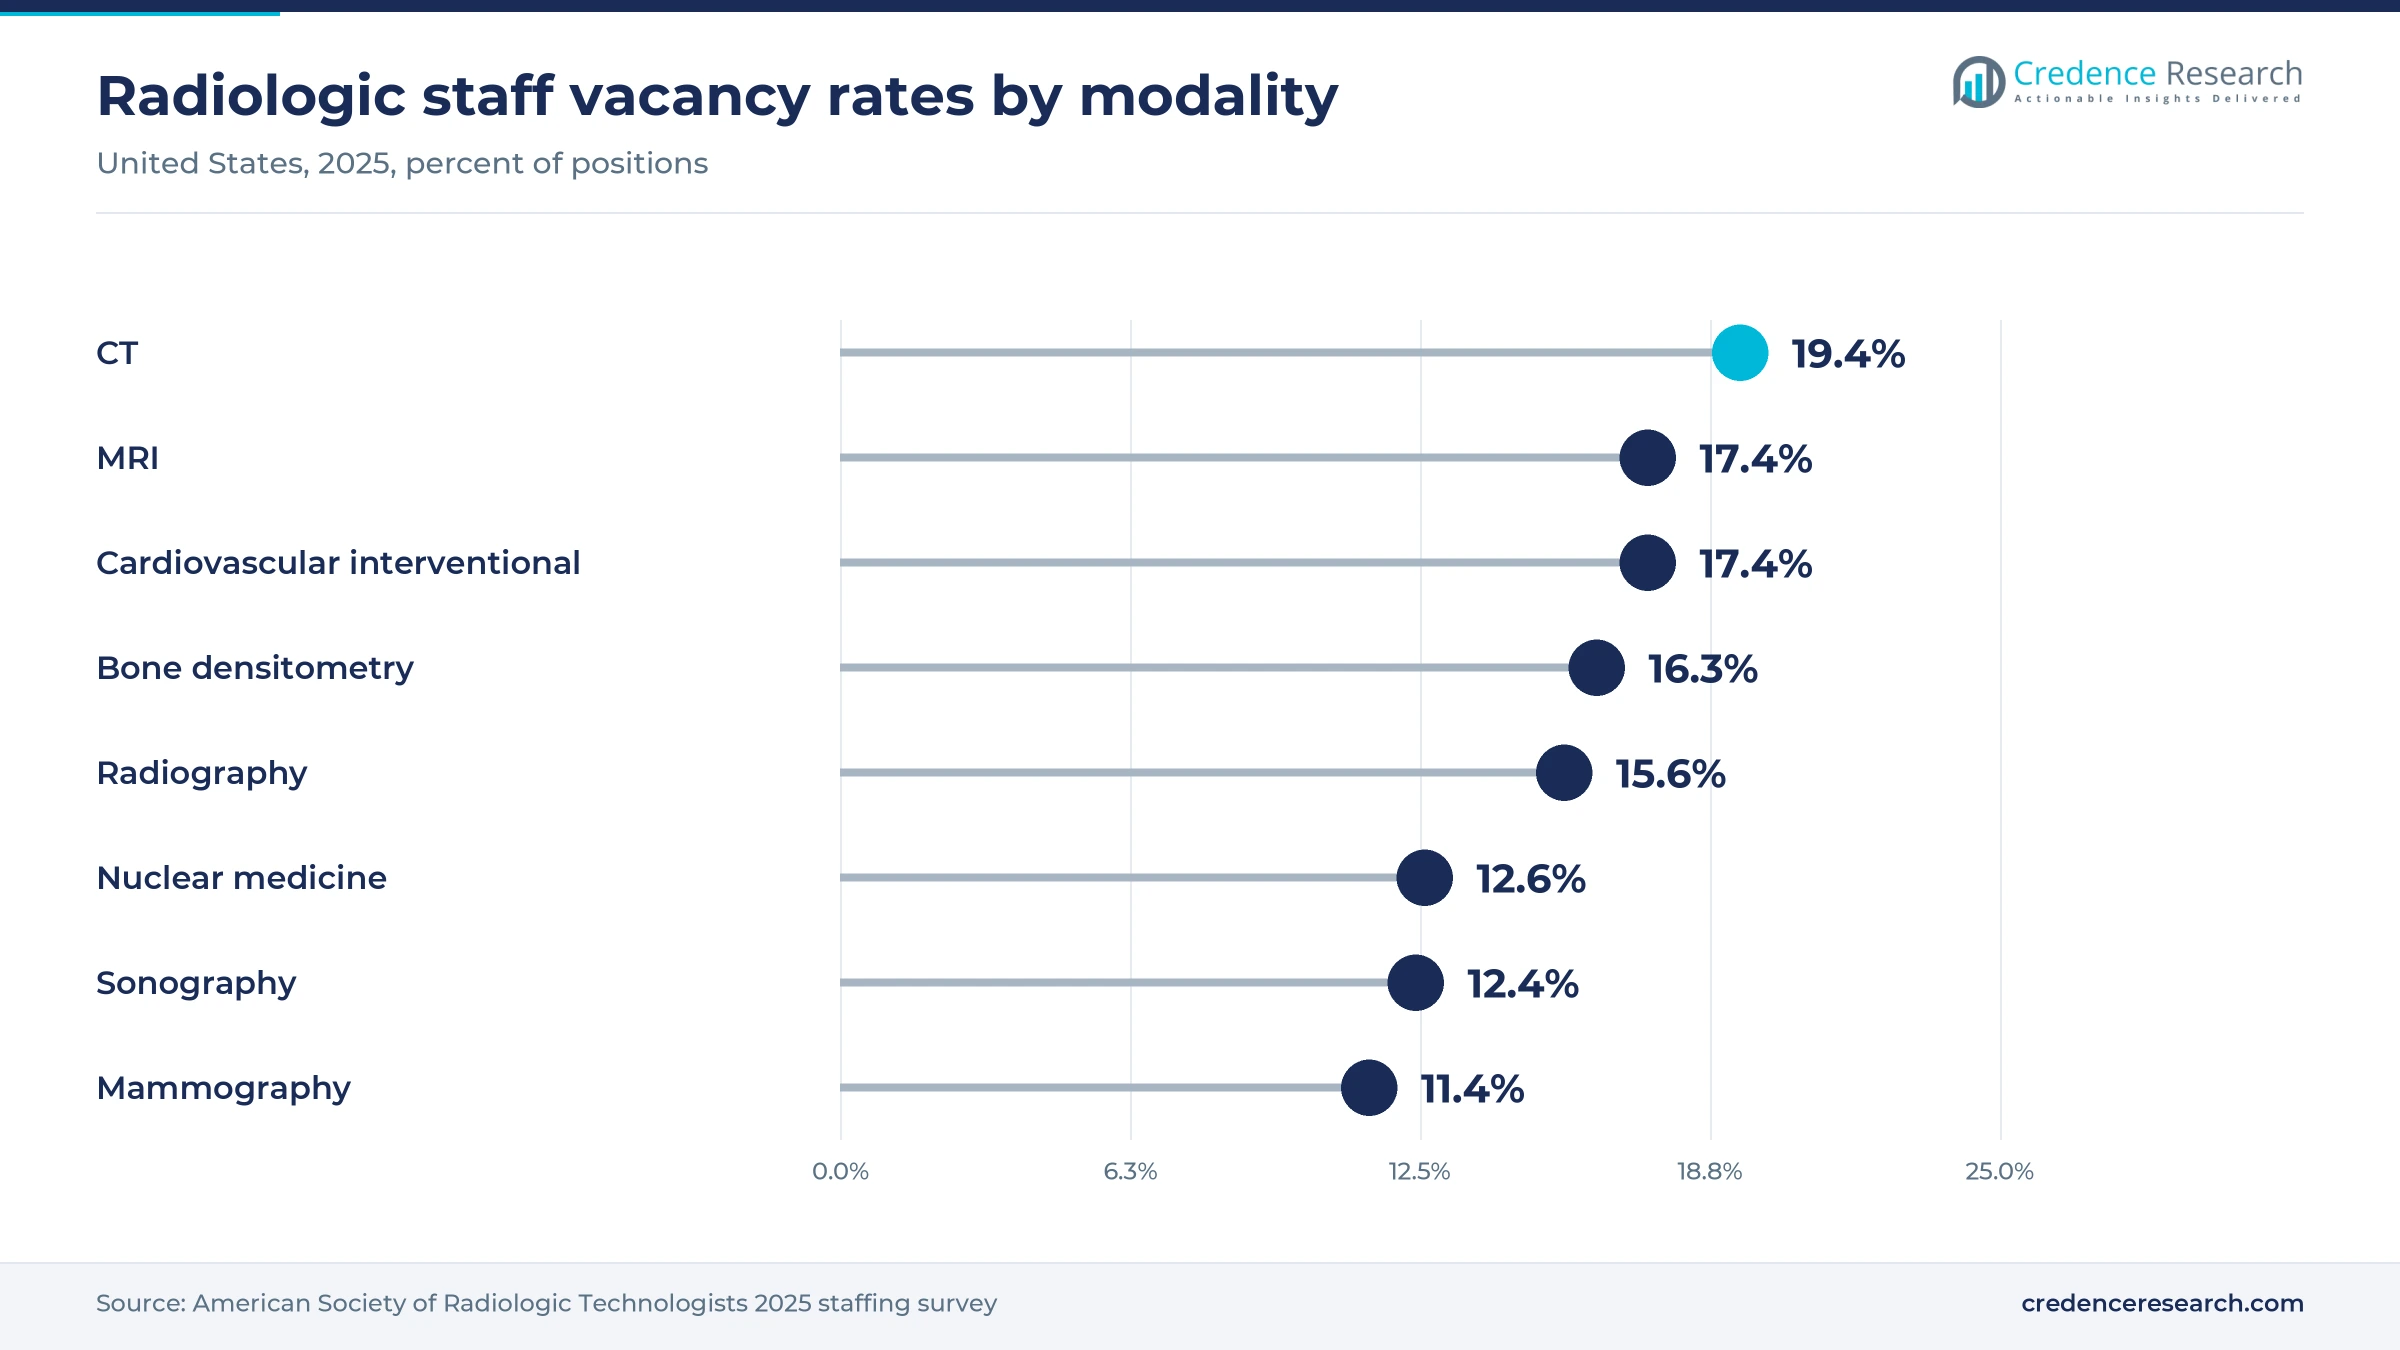
Staffing limits the return on a new scanner because a room without technologists cannot generate studies. The American Society of Radiologic Technologists reported CT vacancies of 19.4% in its 2025 survey, up from 17.7% in 2023, and MRI vacancies of 17.4%. Hospitals with empty posts often delay added capacity or extend existing hours instead. GE HealthCare answers with automated positioning on its newest CT, although such tools reduce the workload rather than remove the need for qualified staff.
Payment pressure tightens hospital capital budgets
Federal coverage changes threaten the operating margins that fund capital plans. Becker's Hospital Review reported in September 2025 that the impact of the One Big Beautiful Bill Act could cost hospitals $25 billion a year. The 2026 outpatient update of 2.6% also offers limited headroom against equipment and labor inflation, which weighs on demand. Smaller and rural providers are the most exposed, so they tend to stretch asset lives, turn to leases or buy refurbished systems instead of new platforms.
Cybersecurity rules raise lifecycle obligations
Connectivity brings regulatory duties that last well beyond the sale. Section 524B took effect in March 2023, and final FDA guidance issued in June 2025 added detail on what manufacturers must submit. Morgan Lewis noted in November 2025 that the FDA can deny authorization on cybersecurity grounds alone and that patching duties continue across the product life. Older connected fleets therefore carry extra risk for hospitals, and suppliers must fund longer software support, which raises the total cost of ownership for buyers.
The United States dominates while Mexico buys fastest
| Country | Value, 2025 (USD billion) | Share, 2025 | CAGR, 2026–2035 |
|---|---|---|---|
| United States | 55.79 | 87.5% | 6.85% |
| Canada | 4.34 | 6.8% | 7.20% |
| Mexico | 3.63 | 5.7% | 8.10% |
United States holds the premium equipment base
The United States held 87.5% of 2025 regional value and grows at 6.85% a year, slightly below the regional rate because the base is already large. Its lead rests on robotic volume and early access to new imaging, as American da Vinci activity exceeded 2 million procedures in 2025. Supplier investment reinforces the position, since Siemens Healthineers announced $150 million in May 2025 for American facilities, including moving Varian radiation system production from Baja California to Palo Alto.
Canada replaces older scanners under provincial budgets
Canada held 6.8% of 2025 regional value and grows at 7.20% a year, because provincial budgets set most renewal timing. National inventory data show that nearly three-quarters of SPECT units are at least 10 years old, and CT waits stand at 8.8 weeks, according to the Fraser Institute. Distribution is also regulated closely, since Health Canada requires importers and distributors to hold an establishment licence. Its updated guidance, effective December 2026, allows the regulator to attach conditions to those licences.
Mexico combines export plants with federal buying
Mexico held 5.7% of 2025 regional value and is the fastest-growing country at 8.10% a year. Public demand matters here, as the domestic device market is about $8 billion, with 52% bought by the public sector, according to industry group AMID in February 2026. Production is a much larger story, because AMID puts device exports at about $22 billion annually and direct jobs above 175,000. Members also plan up to $400 million of investment during 2026 to 2030, and local supply can shorten service lead times for public buyers.
Clearances and public tenders reset the 2025-2026 agenda
| Development | Status and market relevance |
|---|---|
| In March 2026, GE HealthCare announced FDA 510(k) clearance of the Photonova Spectra photon-counting CT system | Cleared in the United States; the company said it was preparing commercial availability, with UW-Madison as first clinical evaluation site |
| In January 2026, Mexican health officials announced a 2026 purchase of 816 high-technology units for public institutions | Budgeted at an estimated 11,257 million pesos, with CT, MRI, mammography, linear accelerators and nuclear medicine across all 32 states |
| In January 2026, Intuitive announced FDA clearance of the da Vinci 5 for several cardiac procedures | Cleared with non-Force Feedback instruments, which extends the newest platform into a new specialty |
| In December 2025, Medtronic announced FDA clearance of its Hugo robotic system for urologic procedures | Covers prostatectomy, nephrectomy and cystectomy, which gives American hospitals a further multiport option |
| In May 2025, Siemens Healthineers announced a $150 million investment in American facilities | Moves Varian production to Palo Alto and adds supply depots in New Jersey and California, plus a Charlotte experience center |
Detectors, robots and software define the next fleet
- Photon-counting detectors capture spectral and high-resolution data in one scan, and GE HealthCare now offers a silicon-based design that competes for premium CT budgets.
- Multiport surgical robots are adding force feedback, cardiac indications and more suppliers, which changes how hospitals compare platforms at trade-in.
- AI-enabled reconstruction and triage bring heavier computing into the scanner, so buyers must plan for GPU hardware and software updates during the service term.
- Short-episode remote monitoring uses connected home kits that can bill under newer Medicare codes, which makes shorter programs viable for smaller provider groups.
Need a Custom Version of This Report?
Tailor the scope, geography, or segments to your exact requirements.
- Custom geography or segment scope
- Direct access to our analyst team
Five suppliers compete on installed base and local output
Competition centers on installed base, service coverage and the ability to bundle financing with equipment. GE HealthCare, Siemens Healthineers and Philips contest imaging, monitoring and image-guided therapy, while Intuitive Surgical and Medtronic contest robotic surgery. Intuitive reported that operating leases represented 47% of da Vinci placements in the fourth quarter of 2025, which shows how manufacturers use their own balance sheets to win buyers. Local production has become a competitive tool during the tariff review. Philips announced a plan in August 2025 to expand its Reedsville, Pennsylvania transducer plant and Siemens Healthineers moved Varian assembly to California. Canadian and Mexican accounts often depend on licensed distributors and public tenders, which favors suppliers with established local partners. Price pressure is sharpest in Mexico, where reverse auctions now shape federal buying.
Companies profiled and their roles in this market
| Company | Type | Role in the market |
|---|---|---|
| GE HealthCare | Imaging and monitoring manufacturer | Photonova Spectra photon-counting CT, cleared in the United States in March 2026 |
| Medtronic | Surgical robot and device manufacturer | Hugo robotic system, cleared for urologic procedures in December 2025 |
| Siemens Healthineers | Imaging and radiation therapy manufacturer | Varian radiation systems, with production moved to Palo Alto under a 2025 plan |
| Intuitive Surgical | Surgical robot manufacturer | da Vinci 5 platform, with over 2 million American procedures in 2025 |
| Philips | Imaging and image-guided therapy manufacturer | Reedsville ultrasound transducers and Plymouth, Minnesota image-guided therapy expansion |
Replacement cycles matter more than new sites through 2035
Credence Research's view is that replacement timing, rather than new hospital construction, will decide most purchasing through 2035. American buyers have reliable reasons to renew, including aged fleets and competing robots and CT platforms. However, the same buyers face tariff exposure, technologist vacancies and thinner payment, so they will favor equipment that shortens scan or procedure times and that fits existing rooms. Medical machines suppliers with leasing programs, trade-in terms and local plants should hold an advantage. Mexico offers the fastest growth, although its reverse auctions will compress margins and reward vendors with lean service networks.
How the estimate was built
The report uses 2025 as the base year, 2026 as the estimate year and 2035 as the forecast year. Market values come from the Credence Research model, and country, segment and growth splits are Credence Research estimates. Inputs include regulator pages, Medicare rule summaries, national inventories, company releases and earnings commentary, and trade press reports named in the text. No interviews or surveys were conducted for this edition of the report. Product shares are the most assumption-heavy estimates, because few public sources separate machines from wider medical device spending.
Outpatient and home sites gain share by 2035
The market is forecast to reach USD 125.15 billion by 2035, and the mix of buyers should look noticeably different by then. Hospital campuses will keep the largest share of 2035 demand, yet ambulatory operators will buy more catheterization, imaging and robotic equipment as Medicare completes its inpatient-only phaseout. Home kits should grow alongside the waiver through 2030, provided Congress keeps payment in place afterward. Intelligent systems will take share from standalone equipment as older machines reach retirement age. Canada and Mexico will remain smaller markets, but public programs there will offer the clearest visible tender pipelines.
Frequently Asked Questions
How big is the North America medical machines market?
Which country leads the market?
Which country grows fastest?
Which product type holds the largest share?
What is driving replacement demand?
How do Medicare changes affect equipment demand?
What are the main challenges for buyers and suppliers?
Who are the key companies in the market?
Table of Content
Chapter 1 Market Segmentation
- 1.1 Segmentation Framework
- 1.1.1 Product and Service Classification
- 1.1.2 Application and End-Use Classification
- 1.1.3 Technology and Solution Classification
- 1.1.4 Customer and Distribution Channel Classification
- 1.1.5 Geographic Segmentation
- 1.1.6 Market Segment Definitions and Boundaries
- 1.2 By Product Type
- 1.2.1 Therapeutic Equipment
- 1.2.2 Diagnostic Imaging Systems
- 1.2.3 Patient Monitoring Systems
- 1.2.4 Procedural Support Equipment
- 1.3 By Care Setting
- 1.3.1 Hospital Campuses
- 1.3.2 Ambulatory Facilities
- 1.3.3 Home Care
- 1.3.4 Long-Term Care Facilities
- 1.4 By End User
- 1.4.1 Private Health Systems
- 1.4.2 Independent Providers
- 1.4.3 Public Purchasing Bodies
- 1.4.4 Households
- 1.5 By Technology
- 1.5.1 Connected Conventional Systems
- 1.5.2 Intelligent Systems
- 1.5.3 Standalone Conventional Systems
- 1.6 By Country
- 1.6.1 United States
- 1.6.2 Canada
- 1.6.3 Mexico
Chapter 2 Introduction
- 2.1 Report Objectives and Scope
- 2.2 Product Definition and Industry Terminology
- 2.3 Market Inclusions and Exclusions
- 2.4 Research Process
- 2.4.1 Primary Research and Expert Interviews
- 2.4.2 Secondary Research and Source Review
- 2.4.3 Top-Down and Bottom-Up Estimation
- 2.4.4 Data Triangulation and Verification
- 2.5 Market Size Measurement Basis
- 2.5.1 2025: USD 63.76 billion → 2035: USD 125.15 billion
- 2.6 Historical and Forecast Reference Periods
- 2.6.1 Historical Period: 2018-2025
- 2.6.2 Base Year: 2025
- 2.6.3 Forecast Period: 2025-2035
- 2.7 Research Assumptions and Limitations
Chapter 3 Executive Summary
- 3.1 Market Snapshot and Key Findings
- 3.2 Base-Year Market Size, 2025
- 3.3 Forecast Market Size, 2035
- 3.4 Revenue and Volume Growth Outlook
- 3.5 Key Demand and Supply Indicators
- 3.6 Leading Market Segments
- 3.7 Fastest-Growing Market Opportunities
- 3.8 Regional Performance Highlights
- 3.9 Technology and Industry Transformation
- 3.10 Competitive Landscape Summary
- 3.11 Analyst View and Strategic Implications
Chapter 4 North America Medical Machines Market Trends and Developments
- 4.1 Historical Industry Development, 2018-2025
- 4.2 Recent Market Trends and Developments
- 4.3 Demand and Customer Behavior Trends
- 4.4 Technology and Product Innovation
- 4.5 Artificial Intelligence, Automation and Digitalization
- 4.6 Local Manufacturing and Supply Chain Realignment
- 4.7 Industry Partnerships, Mergers and Acquisitions
- 4.8 Sustainability and Circular Economy Developments
- 4.9 Government and Private Sector Investment Trends
- 4.10 Emerging Business Models and Commercialization
- 4.11 Industry Developments and Announcements
Chapter 5 North America Medical Machines Market Production, Supply and Demand Analysis
- 5.1 Demand Trend and Consumption Analysis, 2018-2025
- 5.2 Demand Forecast, 2025-2035
- 5.3 Production and Output Trend, 2018-2025
- 5.4 Production and Output Forecast, 2025-2035
- 5.5 Installed Capacity and Capacity Utilization
- 5.6 Company-Wise Production Plants and Statistics
- 5.6.1 Installed Production Capacity
- 5.6.2 Actual Production
- 5.6.3 Planned Capacity and Expansion Targets
- 5.7 Supply Chain Structure and Procurement Trends
- 5.8 Supply-Demand Gap and Bottlenecks
- 5.9 Import Dependence and Sourcing Structure
- 5.10 Contract Manufacturing and Outsourcing
- 5.11 Regional Supply and Demand Concentration
Chapter 6 North America Medical Machines Market Pricing Analysis
- 6.1 Pricing Structure and Measurement
- 6.2 Historical Pricing Trends, 2018-2025
- 6.3 Pricing Outlook, 2025-2035
- 6.4 Average Selling Price and Unit Economics
- 6.5 Pricing by Product and Market Segment
- 6.6 Geographic Pricing Differences
- 6.7 Key Input, Energy, Labor and Logistics Costs
- 6.8 Contract Pricing and Purchasing Models
- 6.9 Pricing Sensitivity and Competitive Positioning
- 6.10 Price, Margin and Profitability Implications
Chapter 7 North America Medical Machines Market Dynamics
- 7.1 Market Growth Drivers
- 7.1.1 Demand-Side Drivers
- 7.1.2 Technology and Innovation Drivers
- 7.1.3 Infrastructure and Investment Drivers
- 7.1.4 Regulatory and Policy Drivers
- 7.2 Market Restraints
- 7.2.1 Cost and Affordability Constraints
- 7.2.2 Technology and Adoption Barriers
- 7.2.3 Supply Chain and Operational Constraints
- 7.3 Market Challenges
- 7.3.1 Competitive Pressure and Margin Erosion
- 7.3.2 Skills, Infrastructure and Implementation Gaps
- 7.4 Emerging Market Opportunities
- 7.5 Market Dynamics Impact and Time-Horizon Assessment
Chapter 8 North America Medical Machines Value Chain Analysis
- 8.1 Industry Value Chain Overview
- 8.2 Upstream Suppliers and Critical Inputs
- 8.3 Technology and Component Providers
- 8.4 Manufacturing or Service Delivery
- 8.5 Distribution, Channel Partners and Integrators
- 8.6 Downstream Applications and End Users
- 8.7 Value Addition and Profit Pools
- 8.8 Vertical Integration and Outsourcing
- 8.9 Supplier Concentration and Risk
- 8.10 Supply Chain Localization and Resilience
Chapter 9 North America Medical Machines Market Regulations and Policies
- 9.1 Relevant Laws, Standards and Compliance Frameworks
- 9.2 Product, Service, Safety and Quality Requirements
- 9.3 Government Policies, Incentives and Subsidies
- 9.4 Imports, Exports and Trade Barriers
- 9.5 Public Procurement and Local Content Requirements
- 9.6 Environmental and Sustainability Compliance
- 9.7 Upcoming Policy Changes and Market Implications
Chapter 10 North America Medical Machines Market Hotspots and Opportunities
- 10.1 Market Opportunity Mapping and Growth Hotspots
- 10.2 High-Growth Applications and Customer Groups
- 10.3 Underserved Markets and White-Space Opportunities
- 10.4 Emerging Technology and Product Opportunities
- 10.5 New Capacity and Investment Hotspots
- 10.6 Market Entry and Expansion Opportunities
- 10.7 Distribution and Partnership Opportunities
- 10.8 Near-Term and Long-Term Commercial Potential
- 10.9 Opportunity Attractiveness and Execution Risks
Chapter 11 North America Medical Machines Market Outlook, 2025-2035
- 11.1 Market Size and Analysis
- 11.1.1 Revenue (Market Measurement: 2025: USD 63.76 billion → 2035: USD 125.15 billion)
- 11.1.2 Market Volume and Quantity Sold
- 11.1.3 Historical Market Size, 2018-2025
- 11.1.4 Base-Year Market Size, 2025
- 11.2 Market Forecast, 2025-2035
- 11.2.1 Revenue Forecast to 2035
- 11.2.2 Volume Forecast to 2035
- 11.2.3 CAGR and Year-on-Year Growth
- 11.2.4 Incremental Revenue Opportunity
- 11.3 Forecast Assumptions and Scenario Analysis
- 11.3.1 Base-Case Forecast
- 11.3.2 Optimistic and Conservative Scenarios
- 11.3.3 Technology, Pricing and Policy Sensitivities
- 11.4 Market Attractiveness and Growth Outlook
Chapter 12 North America Medical Machines Market Segmentation and Outlook
- 12.1 Segmentation Summary and Market Shares, 2025
- 12.2 Largest and Fastest-Growing Segments
- 12.3 By Product Type - Market Size and Forecast, 2025-2035
- 12.3.1 Segment Definition and Scope
- 12.3.2 Historical Market Size, 2018-2025
- 12.3.3 Revenue Forecast, 2025-2035
- 12.3.4 Volume Forecast, 2025-2035
- 12.3.5 Base-Year Market Share, 2025
- 12.3.6 Segment CAGR and Growth Drivers
- 12.3.7 Subsegment Market Size and Forecast
- 12.3.7.1 Therapeutic Equipment
- 12.3.7.2 Diagnostic Imaging Systems
- 12.3.7.3 Patient Monitoring Systems
- 12.3.7.4 Procedural Support Equipment
- 12.3.8 Subsegment Pricing and Adoption Trends
- 12.3.9 Leading Suppliers and Competition
- 12.3.10 Regional Demand and Opportunities
- 12.4 By Care Setting - Market Size and Forecast, 2025-2035
- 12.4.1 Segment Definition and Scope
- 12.4.2 Historical Market Size, 2018-2025
- 12.4.3 Revenue Forecast, 2025-2035
- 12.4.4 Volume Forecast, 2025-2035
- 12.4.5 Base-Year Market Share, 2025
- 12.4.6 Segment CAGR and Growth Drivers
- 12.4.7 Subsegment Market Size and Forecast
- 12.4.7.1 Hospital Campuses
- 12.4.7.2 Ambulatory Facilities
- 12.4.7.3 Home Care
- 12.4.7.4 Long-Term Care Facilities
- 12.4.8 Subsegment Pricing and Adoption Trends
- 12.4.9 Leading Suppliers and Competition
- 12.4.10 Regional Demand and Opportunities
- 12.5 By End User - Market Size and Forecast, 2025-2035
- 12.5.1 Segment Definition and Scope
- 12.5.2 Historical Market Size, 2018-2025
- 12.5.3 Revenue Forecast, 2025-2035
- 12.5.4 Volume Forecast, 2025-2035
- 12.5.5 Base-Year Market Share, 2025
- 12.5.6 Segment CAGR and Growth Drivers
- 12.5.7 Subsegment Market Size and Forecast
- 12.5.7.1 Private Health Systems
- 12.5.7.2 Independent Providers
- 12.5.7.3 Public Purchasing Bodies
- 12.5.7.4 Households
- 12.5.8 Subsegment Pricing and Adoption Trends
- 12.5.9 Leading Suppliers and Competition
- 12.5.10 Regional Demand and Opportunities
- 12.6 By Technology - Market Size and Forecast, 2025-2035
- 12.6.1 Segment Definition and Scope
- 12.6.2 Historical Market Size, 2018-2025
- 12.6.3 Revenue Forecast, 2025-2035
- 12.6.4 Volume Forecast, 2025-2035
- 12.6.5 Base-Year Market Share, 2025
- 12.6.6 Segment CAGR and Growth Drivers
- 12.6.7 Subsegment Market Size and Forecast
- 12.6.7.1 Connected Conventional Systems
- 12.6.7.2 Intelligent Systems
- 12.6.7.3 Standalone Conventional Systems
- 12.6.8 Subsegment Pricing and Adoption Trends
- 12.6.9 Leading Suppliers and Competition
- 12.6.10 Regional Demand and Opportunities
- 12.7 By Country - Market Size and Forecast, 2025-2035
- 12.7.1 Segment Definition and Scope
- 12.7.2 Historical Market Size, 2018-2025
- 12.7.3 Revenue Forecast, 2025-2035
- 12.7.4 Volume Forecast, 2025-2035
- 12.7.5 Base-Year Market Share, 2025
- 12.7.6 Segment CAGR and Growth Drivers
- 12.7.7 Subsegment Market Size and Forecast
- 12.7.7.1 United States
- 12.7.7.2 Canada
- 12.7.7.3 Mexico
- 12.7.8 Subsegment Pricing and Adoption Trends
- 12.7.9 Leading Suppliers and Competition
- 12.7.10 Regional Demand and Opportunities
- 12.8 Segment Growth Comparison
- 12.9 Segment Attractiveness and Priority Matrix
Chapter 13 North America Medical Machines End-Use and Application Market Outlook
- 13.1 End-Use Industry and Customer Demand Structure
- 13.2 Leading Applications and Customer Groups
- 13.3 End-Use Market Size, Share and Forecast
- 13.4 Major End-Use Industry Deep Dives
- 13.4.1 Customer Requirements and Use Cases
- 13.4.2 Demand and Replacement Cycles
- 13.4.3 Technical and Regulatory Considerations
- 13.4.4 Purchasing and Procurement Models
- 13.4.5 Leading Vendors and Distribution Channels
- 13.4.6 Forecast and Commercial Opportunities
- 13.5 Emerging Applications and Cross-Segment Demand
- 13.6 End-Use Industry Investment Priorities
Chapter 14 North America Medical Machines Geographic Market Outlook, 2025-2035
- 14.1 Regional Market Size and Country-Level Shares, 2025
- 14.2 Country Market Size Comparison, 2025
- 14.3 Country Market Forecasts, 2025-2035
- 14.4 Subregional Industrial and Demand Clusters
- 14.5 Intra-Regional Pricing and Cost Differences
- 14.6 Cross-Border Trade and Supply Networks
- 14.7 Regional Supply and Demand Balances
- 14.8 Country Opportunity Comparison and Prioritization
Note: Every listed country is covered on the structure shown under the first country.
Chapter 15 North America Medical Machines Technology, Innovation and Sustainability Outlook
- 15.1 Technology Landscape and Maturity
- 15.2 Product, Process and Service Innovation
- 15.3 AI, Automation and Digital Tools in the Industry
- 15.4 Technology Adoption and Performance Benchmarking
- 15.5 Innovation Pipeline and R&D Investment
- 15.6 Patent and Intellectual Property Trends
- 15.7 Energy Efficiency and Resource Management
- 15.8 Sustainability, Recycling and Circularity
- 15.9 Technology Roadmap, 2025-2035
- 15.10 Risks of Obsolescence and Technology Substitution
Chapter 16 North America Medical Machines Market Key Strategic Imperatives
- 16.1 Growth and Market Entry Priorities
- 16.2 High-Return Products and Segments
- 16.3 Pricing, Profitability and Cost Optimization
- 16.4 Technology Investment and Product Differentiation
- 16.5 Supply Chain Localization and Resilience
- 16.6 Distribution and Customer Acquisition
- 16.7 Partnership, Acquisition and Capacity Strategy
- 16.8 Regional Expansion Priorities
- 16.9 Short-, Medium- and Long-Term Actions
Chapter 17 Competition Outlook
- 17.1 Industry Competition Characteristics
- 17.2 Market Structure and Concentration
- 17.3 Market Share and Competitive Positioning, 2025
- 17.4 Company-Wise Revenue and Product Benchmarking
- 17.5 Production and Service Capacity Benchmarking
- 17.6 Technology, Pricing and Differentiation
- 17.7 Regional Footprint and Distribution Strength
- 17.8 Mergers, Acquisitions and Strategic Alliances
- 17.9 New Entrants and Competitive Threats
- 17.10 Porter's Five Forces and Industry Attractiveness
- 17.11 Competitive Outlook, 2025-2035
Chapter 18 Company Profiles
- 18.1 Company Coverage and Selection Criteria
- 18.2 GE HealthCare
- 18.2.1 Business Description
- 18.2.2 Company Ownership and Geographic Presence
- 18.2.3 Product and Service Portfolio
- 18.2.4 Manufacturing and Operating Footprint
- 18.2.5 Production Capacity and Expansion Plans
- 18.2.6 Financial Performance and Investment
- 18.2.7 Market Share and Competitive Position
- 18.2.8 Technology and Innovation Capabilities
- 18.2.9 Strategic Alliances or Partnerships
- 18.2.10 Recent Developments
- 18.2.11 Growth Strategy and Outlook
- 18.3 Medtronic
- 18.4 Siemens Healthineers
- 18.5 Intuitive Surgical
- 18.6 Philips
- 18.7 Other Relevant Market Participants
Note: Every listed company is profiled on the structure shown under the first company. The company list is preliminary and may change based on research findings, market developments, data availability and client requirements.
Chapter 19 Disclaimer
- 19.1 Research and Forecast Disclaimer
- 19.2 Data Source and Estimation Limitations
Note: The depth of individual sections depends on data availability for this market. Volume, capacity, trade and other unit-based metrics are included where applicable.

