
Packaging and pipe renewal anchor rigid plastic demand
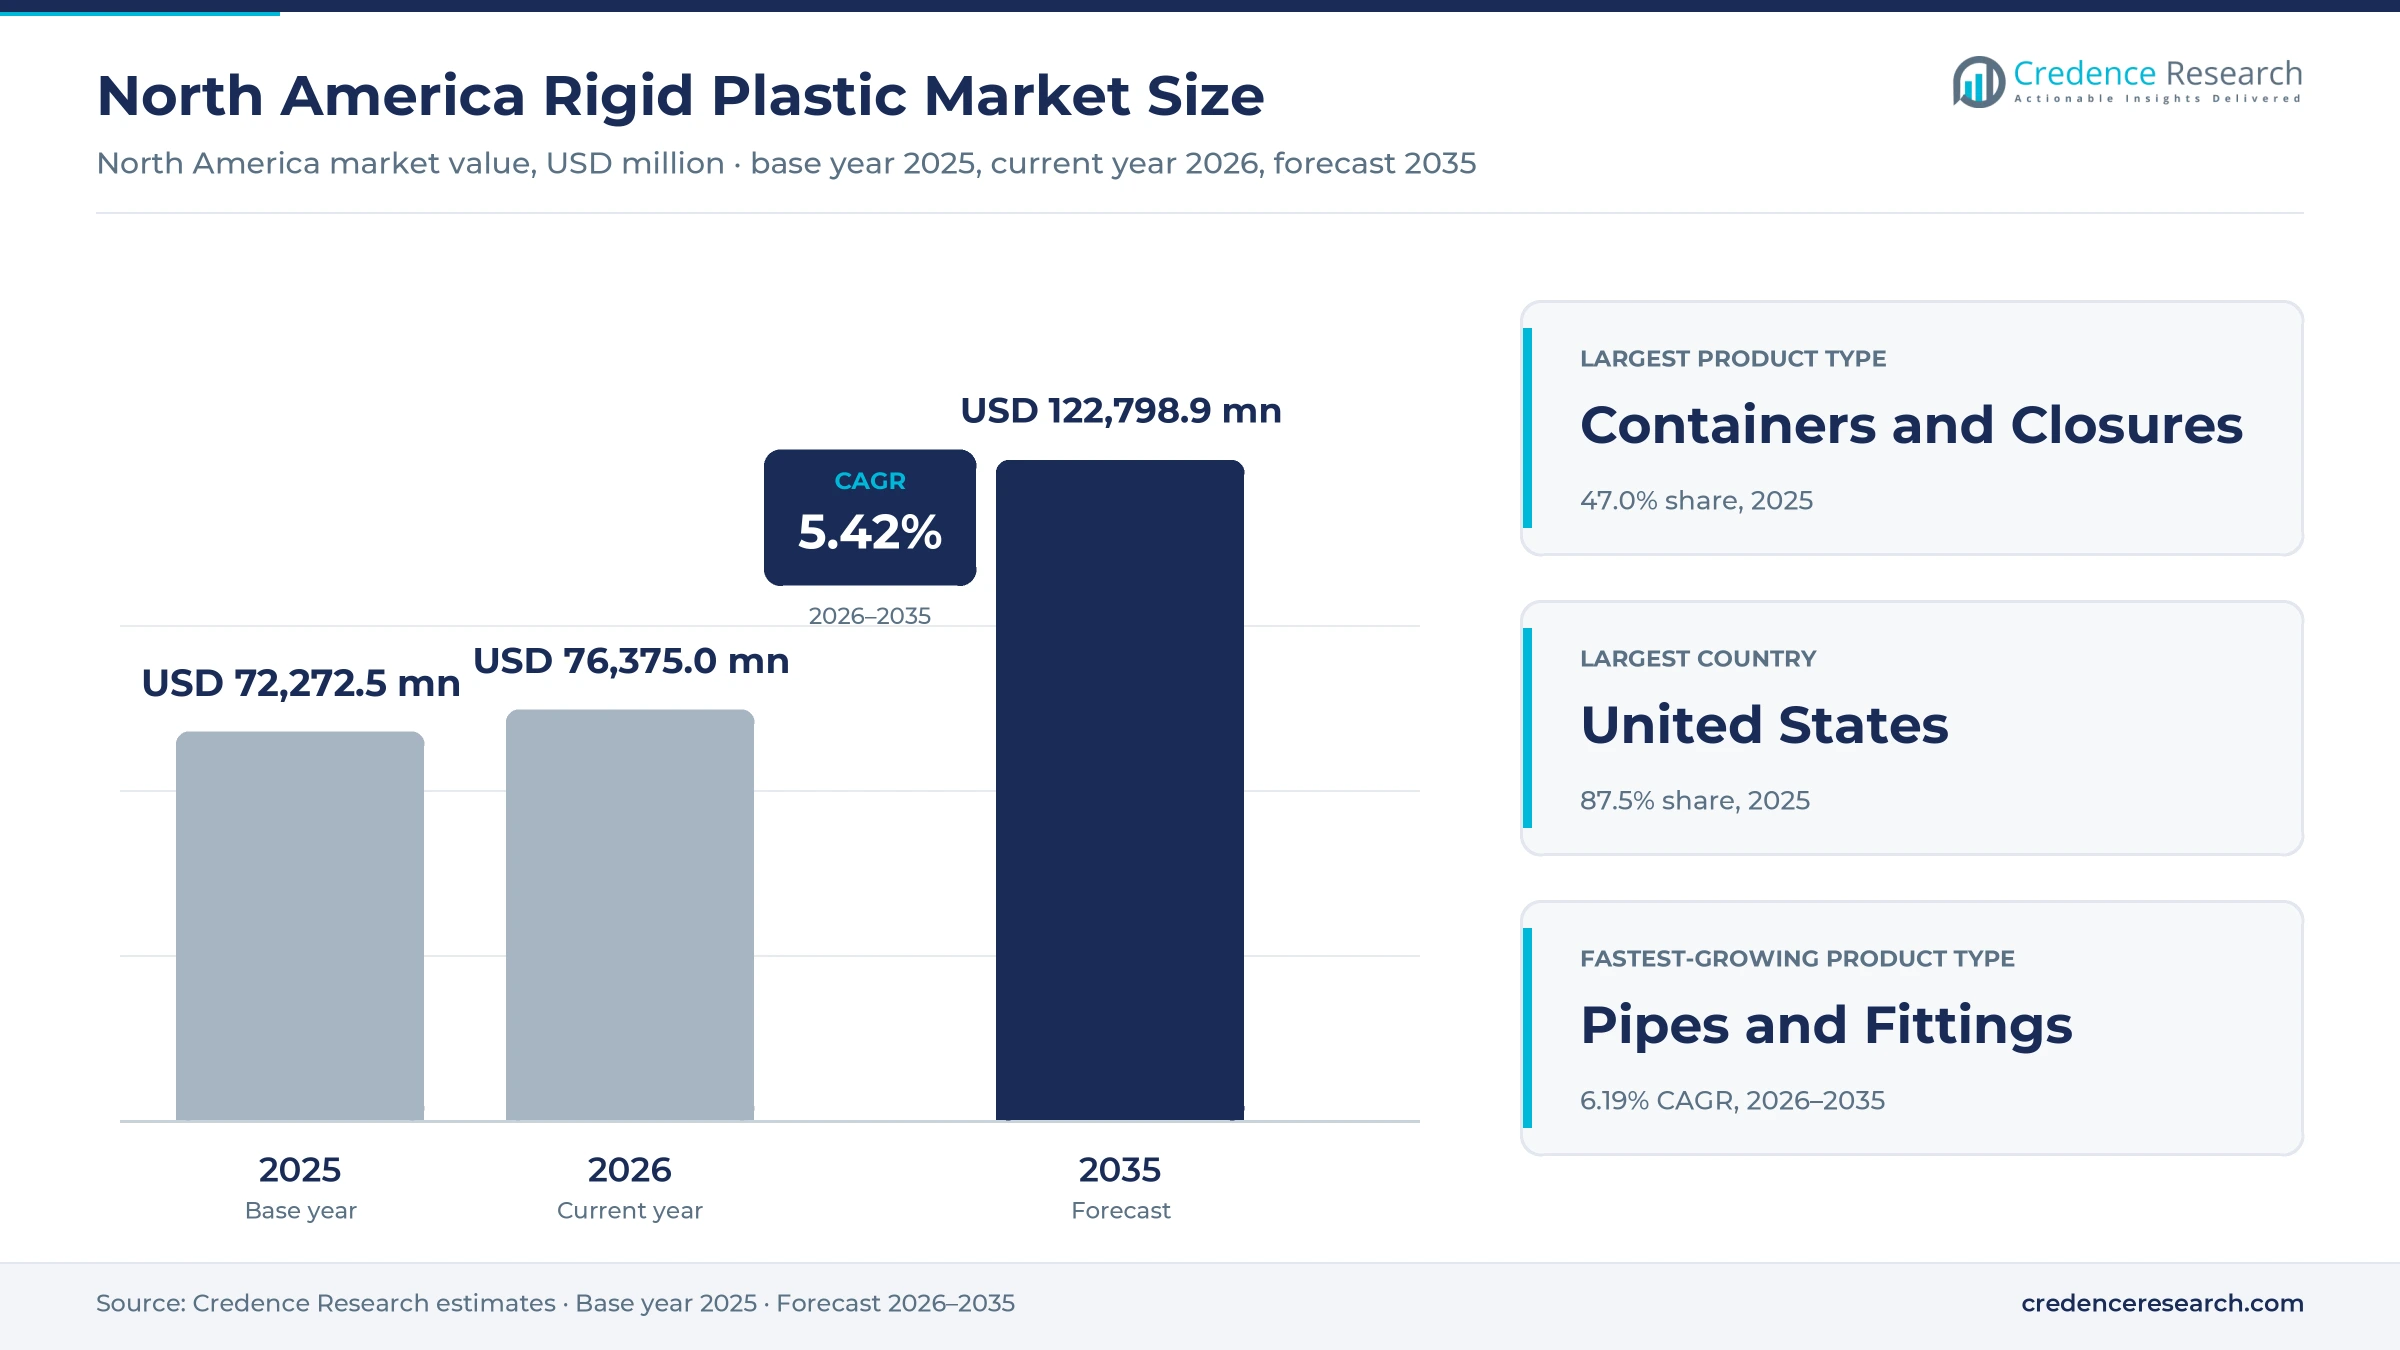
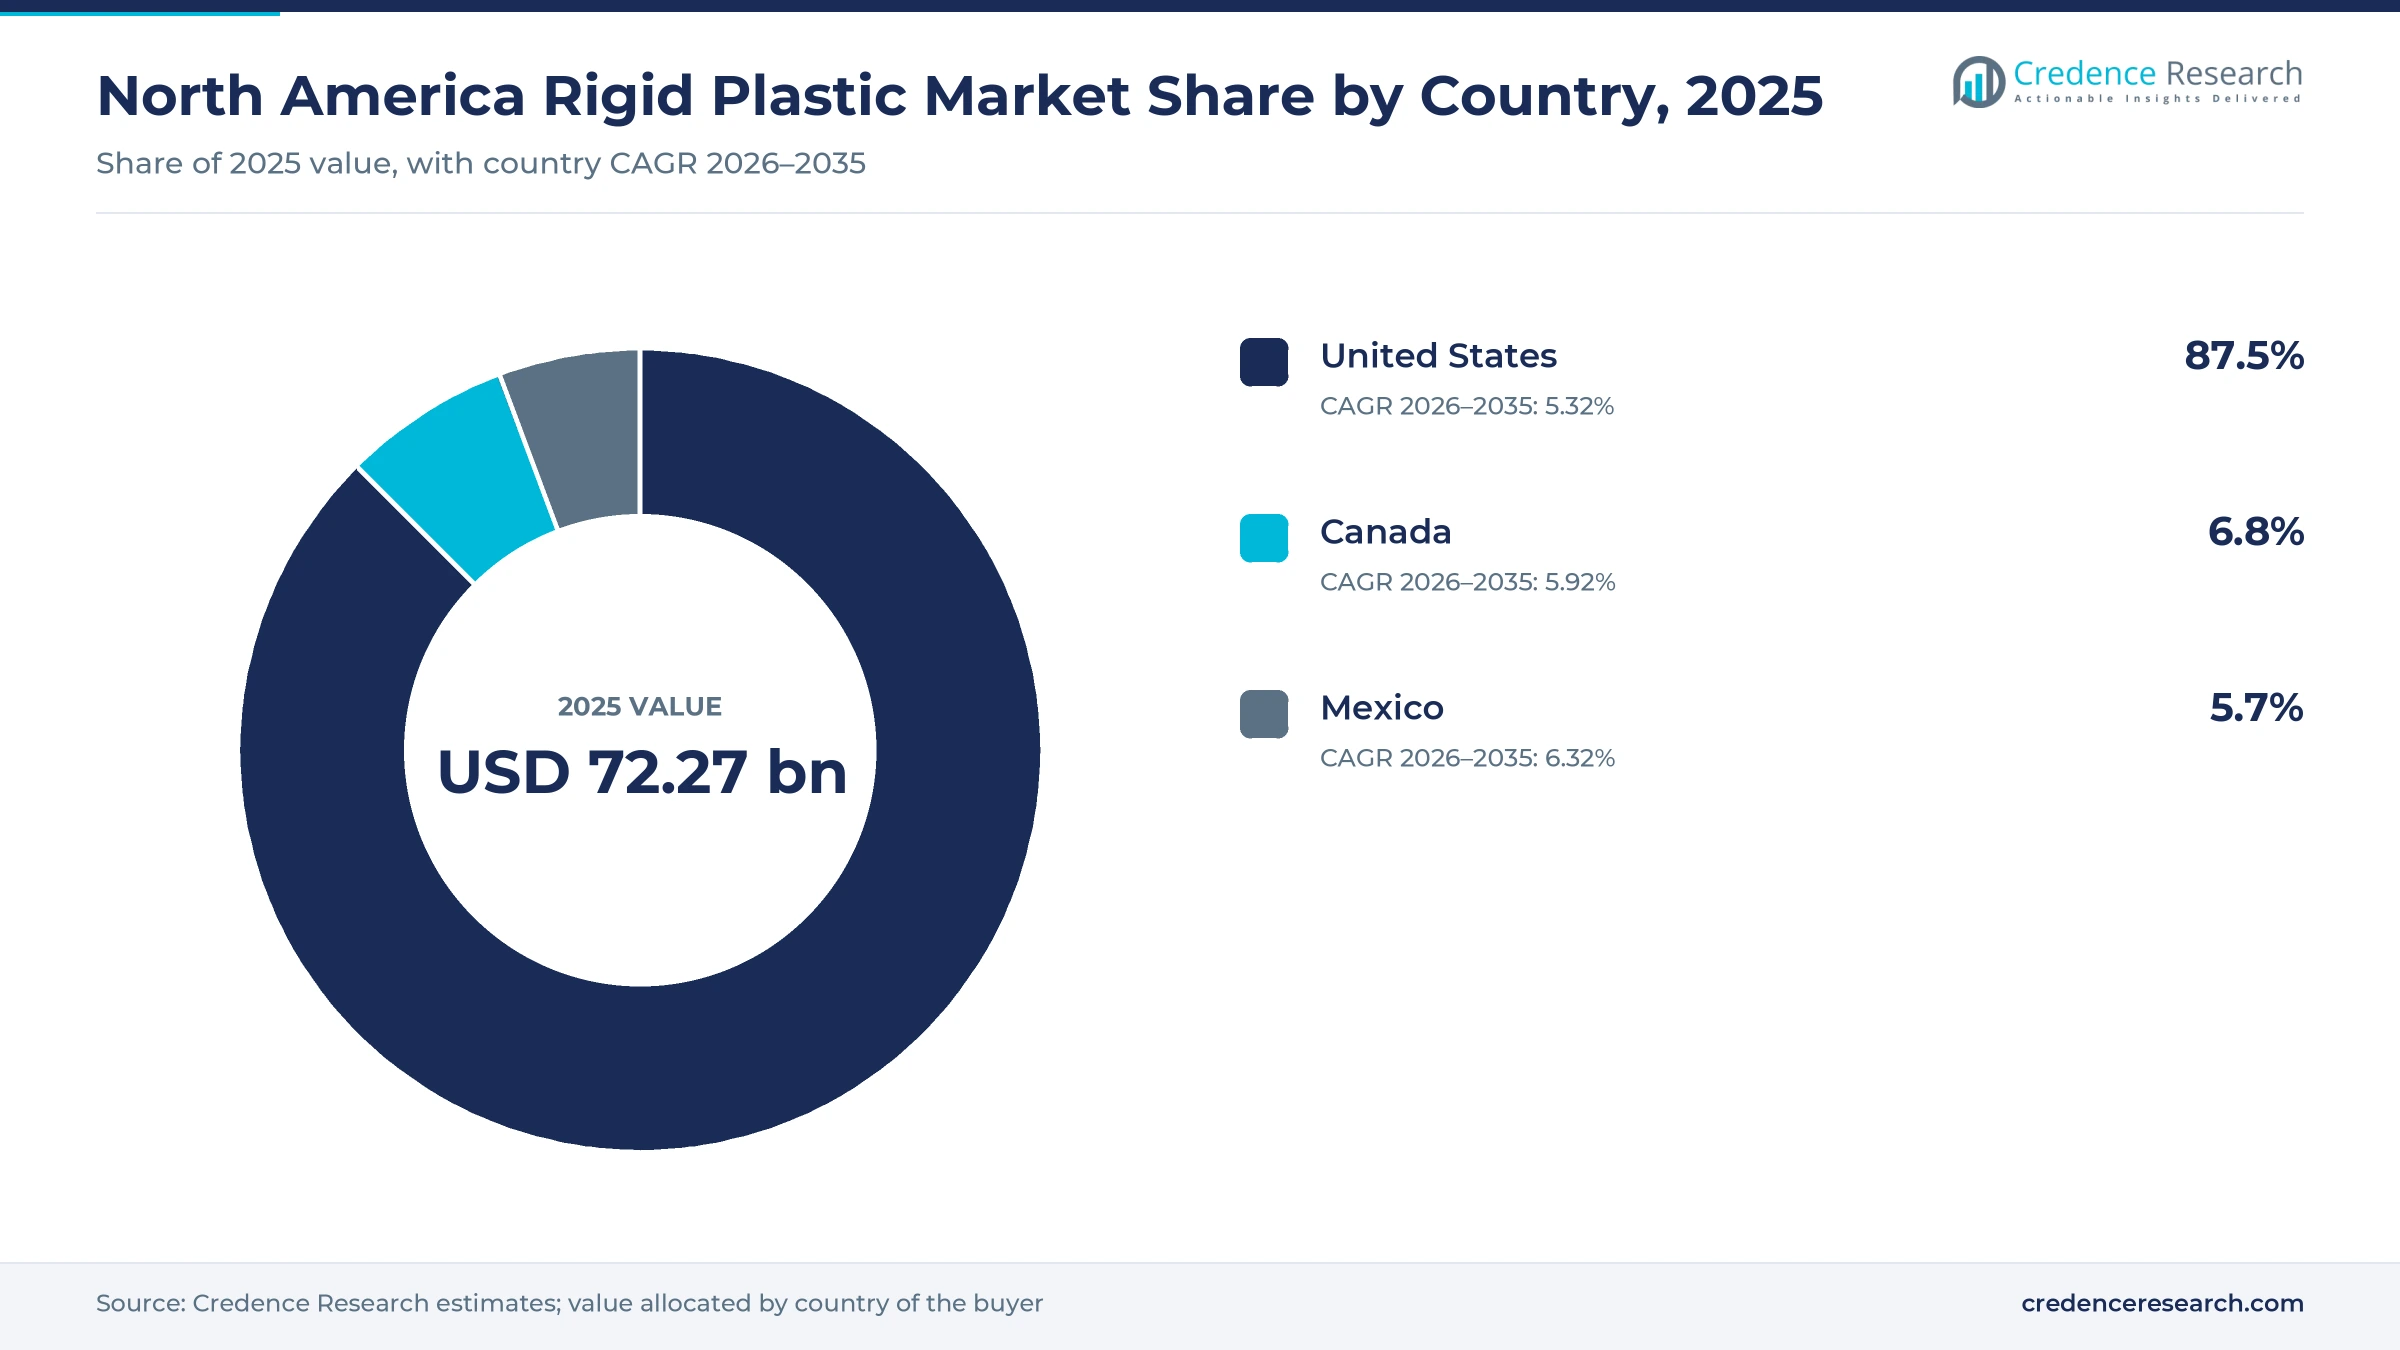
The North America rigid plastic market was valued at USD 72.27 billion in 2025 and is projected to increase from USD 76.38 billion in 2026 to USD 122.80 billion by 2035, registering a CAGR of 5.42% during 2026–2035. Demand comes from food, beverage and household containers bought on repeat contracts, from water and drainage pipe, and from qualified parts for vehicles and medical devices. The United States held the largest share, 87.5% in 2025, because its plastic products industry and water programs dwarf those of its neighbors. Mexico is the fastest-growing country at 6.32% a year, supported by a 122.6 billion peso federal water program and medical molding investment along the northern border. Regulation is also changing buying decisions across the region, and California approved its final SB 54 packaging regulations on May 1, 2026, setting a 25% plastic source reduction target by 2032, while the U.S. FDA aligned device quality rules with ISO 13485 in February 2026.
What does the North America rigid plastic market count and how do buyers purchase?
The market counts the value of formed, self-supporting plastic goods sold in the United States, Canada and Mexico, including bottles, tubs, closures, pipe, fittings, profiles, panels and molded components. Brand owners usually buy on annual or multi-year supply contracts, while pipe and fitting buyers order through specialist distributors, contractors and utility tenders.
Flexible films, bags, pouches, foams and unprocessed resin sold to converters are excluded from the count. The value chain runs from resin producers and compounders through injection, blow molding, extrusion and thermoforming converters to brand owners, utilities, builders and device and vehicle manufacturers.
North America Rigid Plastic Market Insights
- The market rises from USD 72.27 billion in 2025 to USD 122.80 billion by 2035 at a 5.42% CAGR, led by repeat packaging orders and funded water pipe replacement.
- The United States held 87.5% of 2025 value, reflecting a plastic products industry with 673,600 employees in 2024, according to the Plastics Industry Association.
- Containers and Closures led product types with 60.0% of 2025 value, supported by bottled water consumption of 47.7 gallons per person in 2025.
- The FDA Quality Management System Regulation took effect on Feb. 2, 2026, adding ISO 13485:2016 by reference and raising the value of qualified device molders across the region.
- Novolex, Amcor and Georgia-Pacific all made packaging deals during 2025, while Atkore sold its HDPE pipe business to Infra Pipes in April 2026.
Containers lead value while pipes post the fastest growth
Containers lead on repeat orders while pipes grow on funded renewal
Based on product type, the market is categorized into containers and closures, pipes and fittings, profiles and panels, and molded components. Containers and Closures led with 60.0% of 2025 value because filled goods are bought repeatedly, and the International Bottled Water Association reported in May 2026 that Americans drank 47.7 gallons of bottled water per person in 2025. Pipes and Fittings grow fastest at 6.28% a year as EPA surveys cited by Pew in September 2024 put 20-year drinking water needs at $625 billion and clean water needs at $630.1 billion.
Polyolefins lead while engineering grades gain from vehicle and device parts
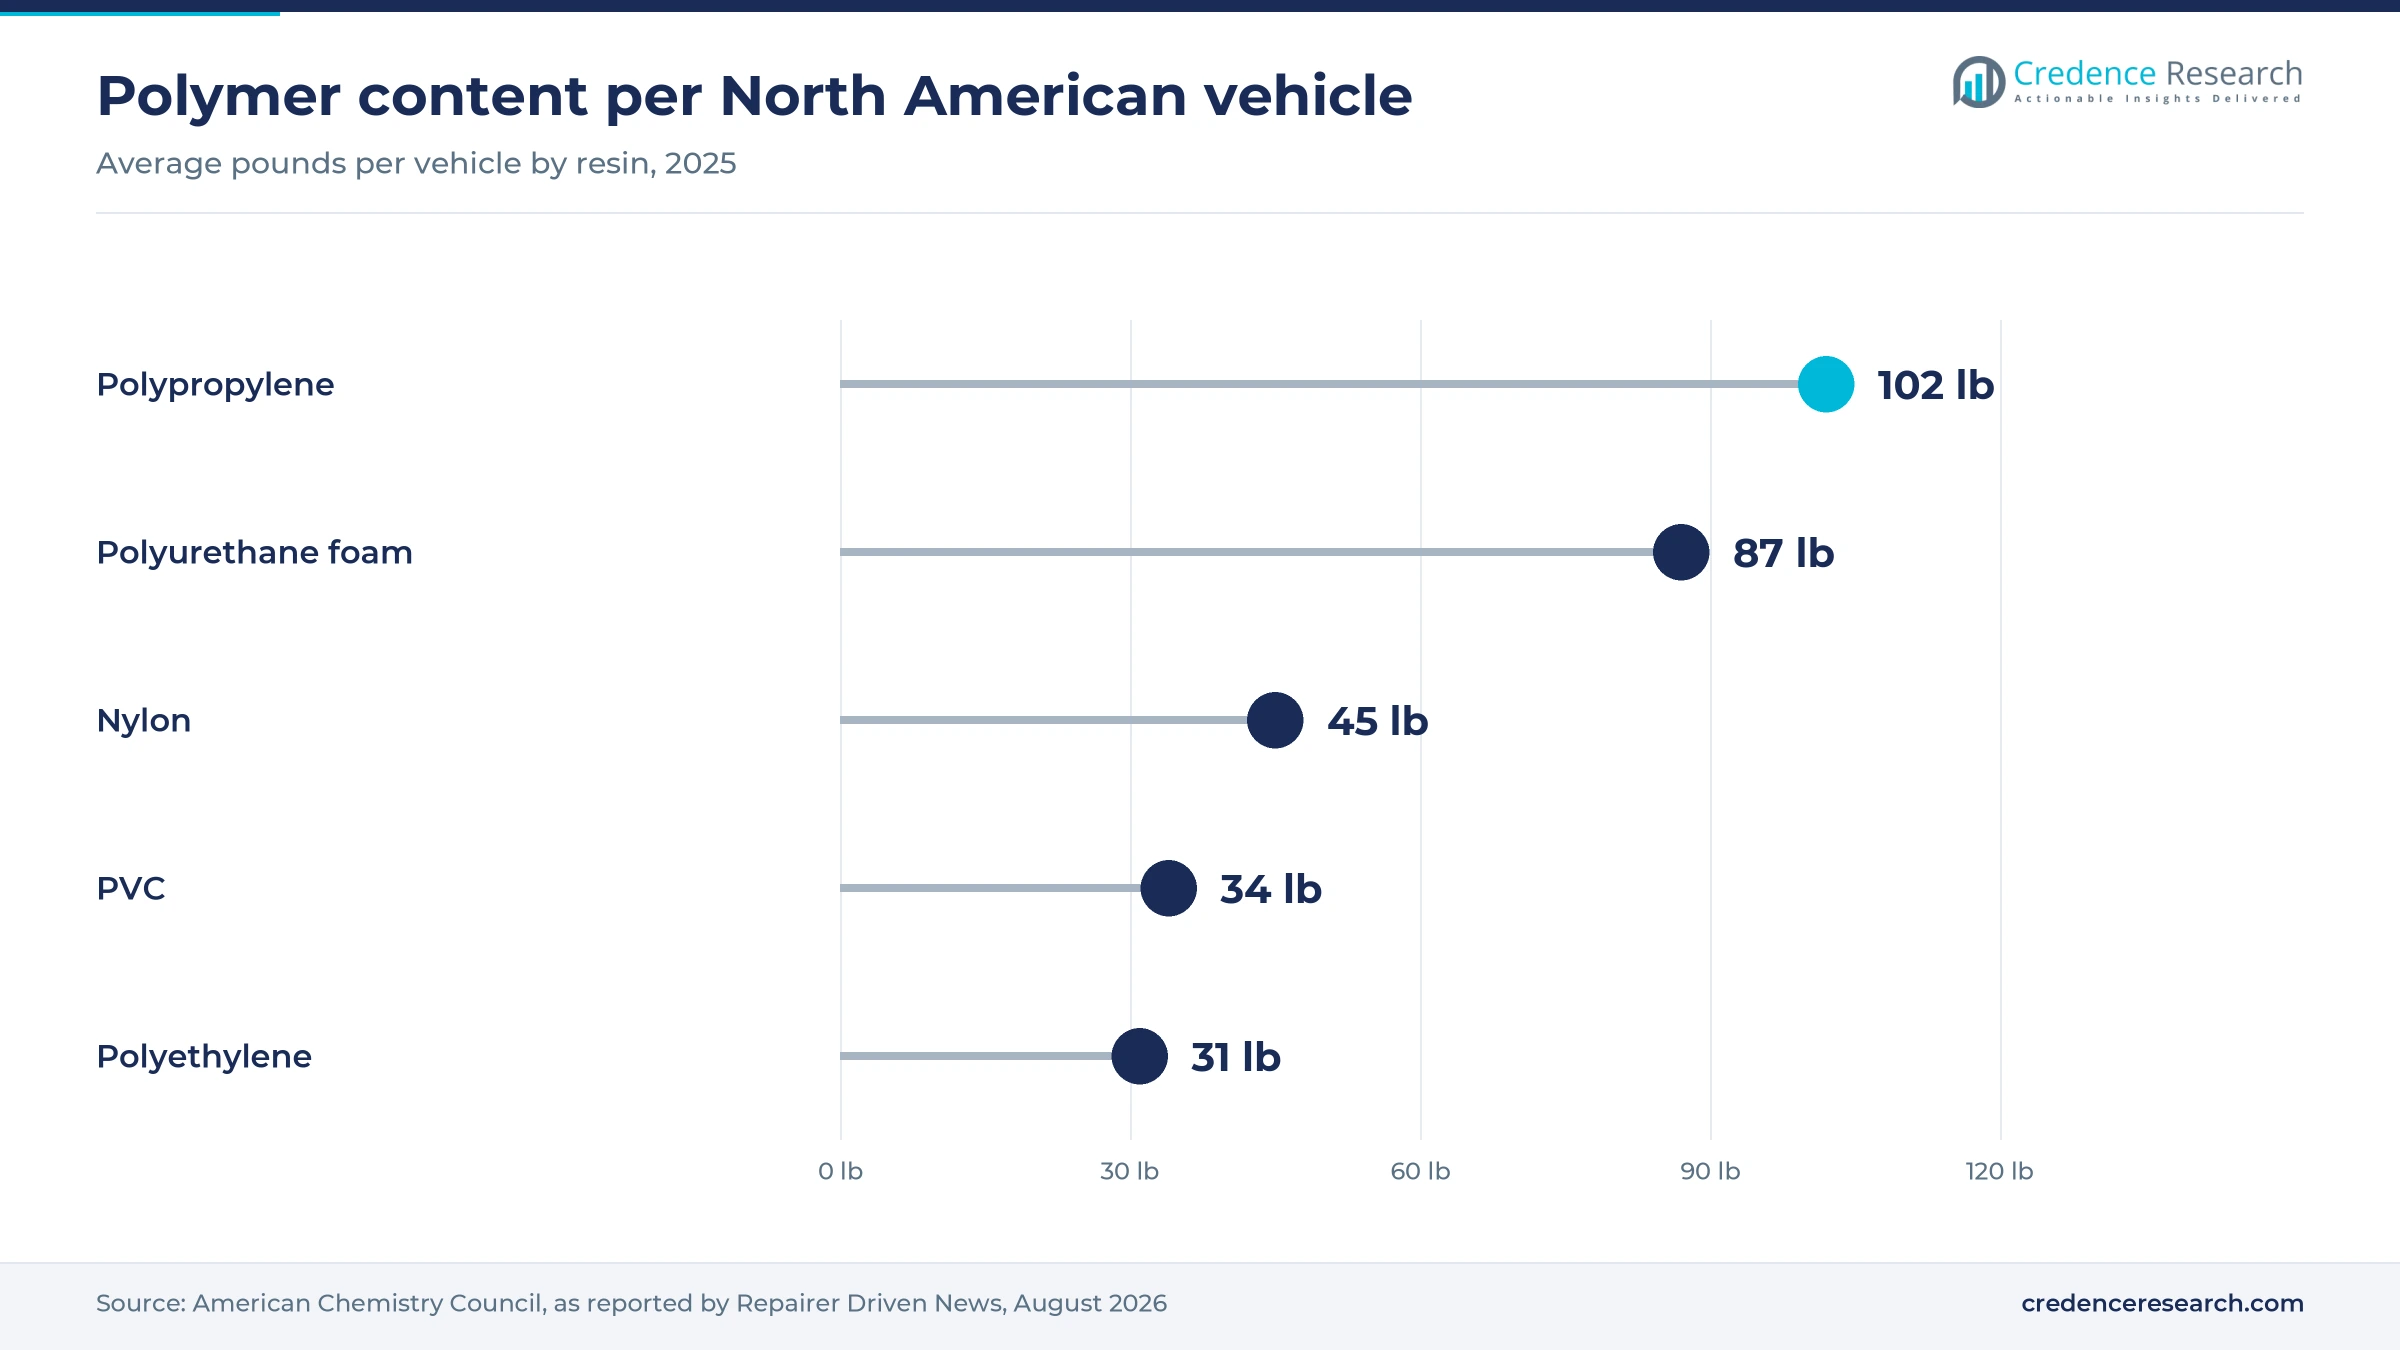
Based on resin type, the market is categorized into polyolefins, rigid PVC, PET and styrenic and engineering thermoplastics. Polyolefins led with 44.0% of 2025 value because polyethylene and polypropylene serve HDPE containers, drainage pipe and vehicle parts, and Advanced Drainage Systems alone buys more than 1.0 billion pounds of resin a year, according to its fiscal 2026 annual filing. Styrenic and Engineering Thermoplastics grow fastest at 6.06% a year as the American Chemistry Council reported in August 2026 that each North American vehicle carried 45 pounds of nylon in 2025.
Packaging leads value while automotive and medical parts gain share
Based on end-use industry, the market is categorized into packaging, building and infrastructure, automotive and medical, and electrical, agriculture and consumer goods. Packaging led with 62.0% of 2025 value because beverage containers turn over quickly, and bottled water alone held 45.5% of U.S. refreshment beverage volume in 2025, according to the International Bottled Water Association. Automotive and Medical grow fastest at 6.29% a year as plastic content reached 428 pounds per North American vehicle in 2025, up 18% in a decade, according to the American Chemistry Council.
Direct contracts dominate while OEM programs add qualified volume
Based on sales channel, the market is categorized into direct key account contracts, specialist product distributors and OEM program supply. Direct Key Account Contracts led with 58.0% of 2025 value because large converters build capacity near filling customers, as ALPLA showed in October 2026 when Packaging Insights reported 36 jobs at a planned North Las Vegas bottle plant. OEM Program Supply grows fastest at 6.21% a year as Innova Engineered Plastics opened a Mexicali plant on Sept. 26, 2025, offering molding up to 900 tons and complete assembly lines for device customers.
| Segment Group | Leading Sub-segment | Share, 2025 | Fastest-growing Sub-segment | CAGR, 2026–2035 |
|---|---|---|---|---|
| By Product Type | Containers and Closures | 60.0% | Pipes and Fittings | 6.28% |
| By Resin Type | Polyolefins | 44.0% | Styrenic and Engineering Thermoplastics | 6.06% |
| By End-Use Industry | Packaging | 62.0% | Automotive and Medical | 6.29% |
| By Sales Channel | Direct Key Account Contracts | 58.0% | OEM Program Supply | 6.21% |
Request a Free Sample
Fill in your details and we'll send you a free sample report.
- Sample data tables & charts
- Research methodology
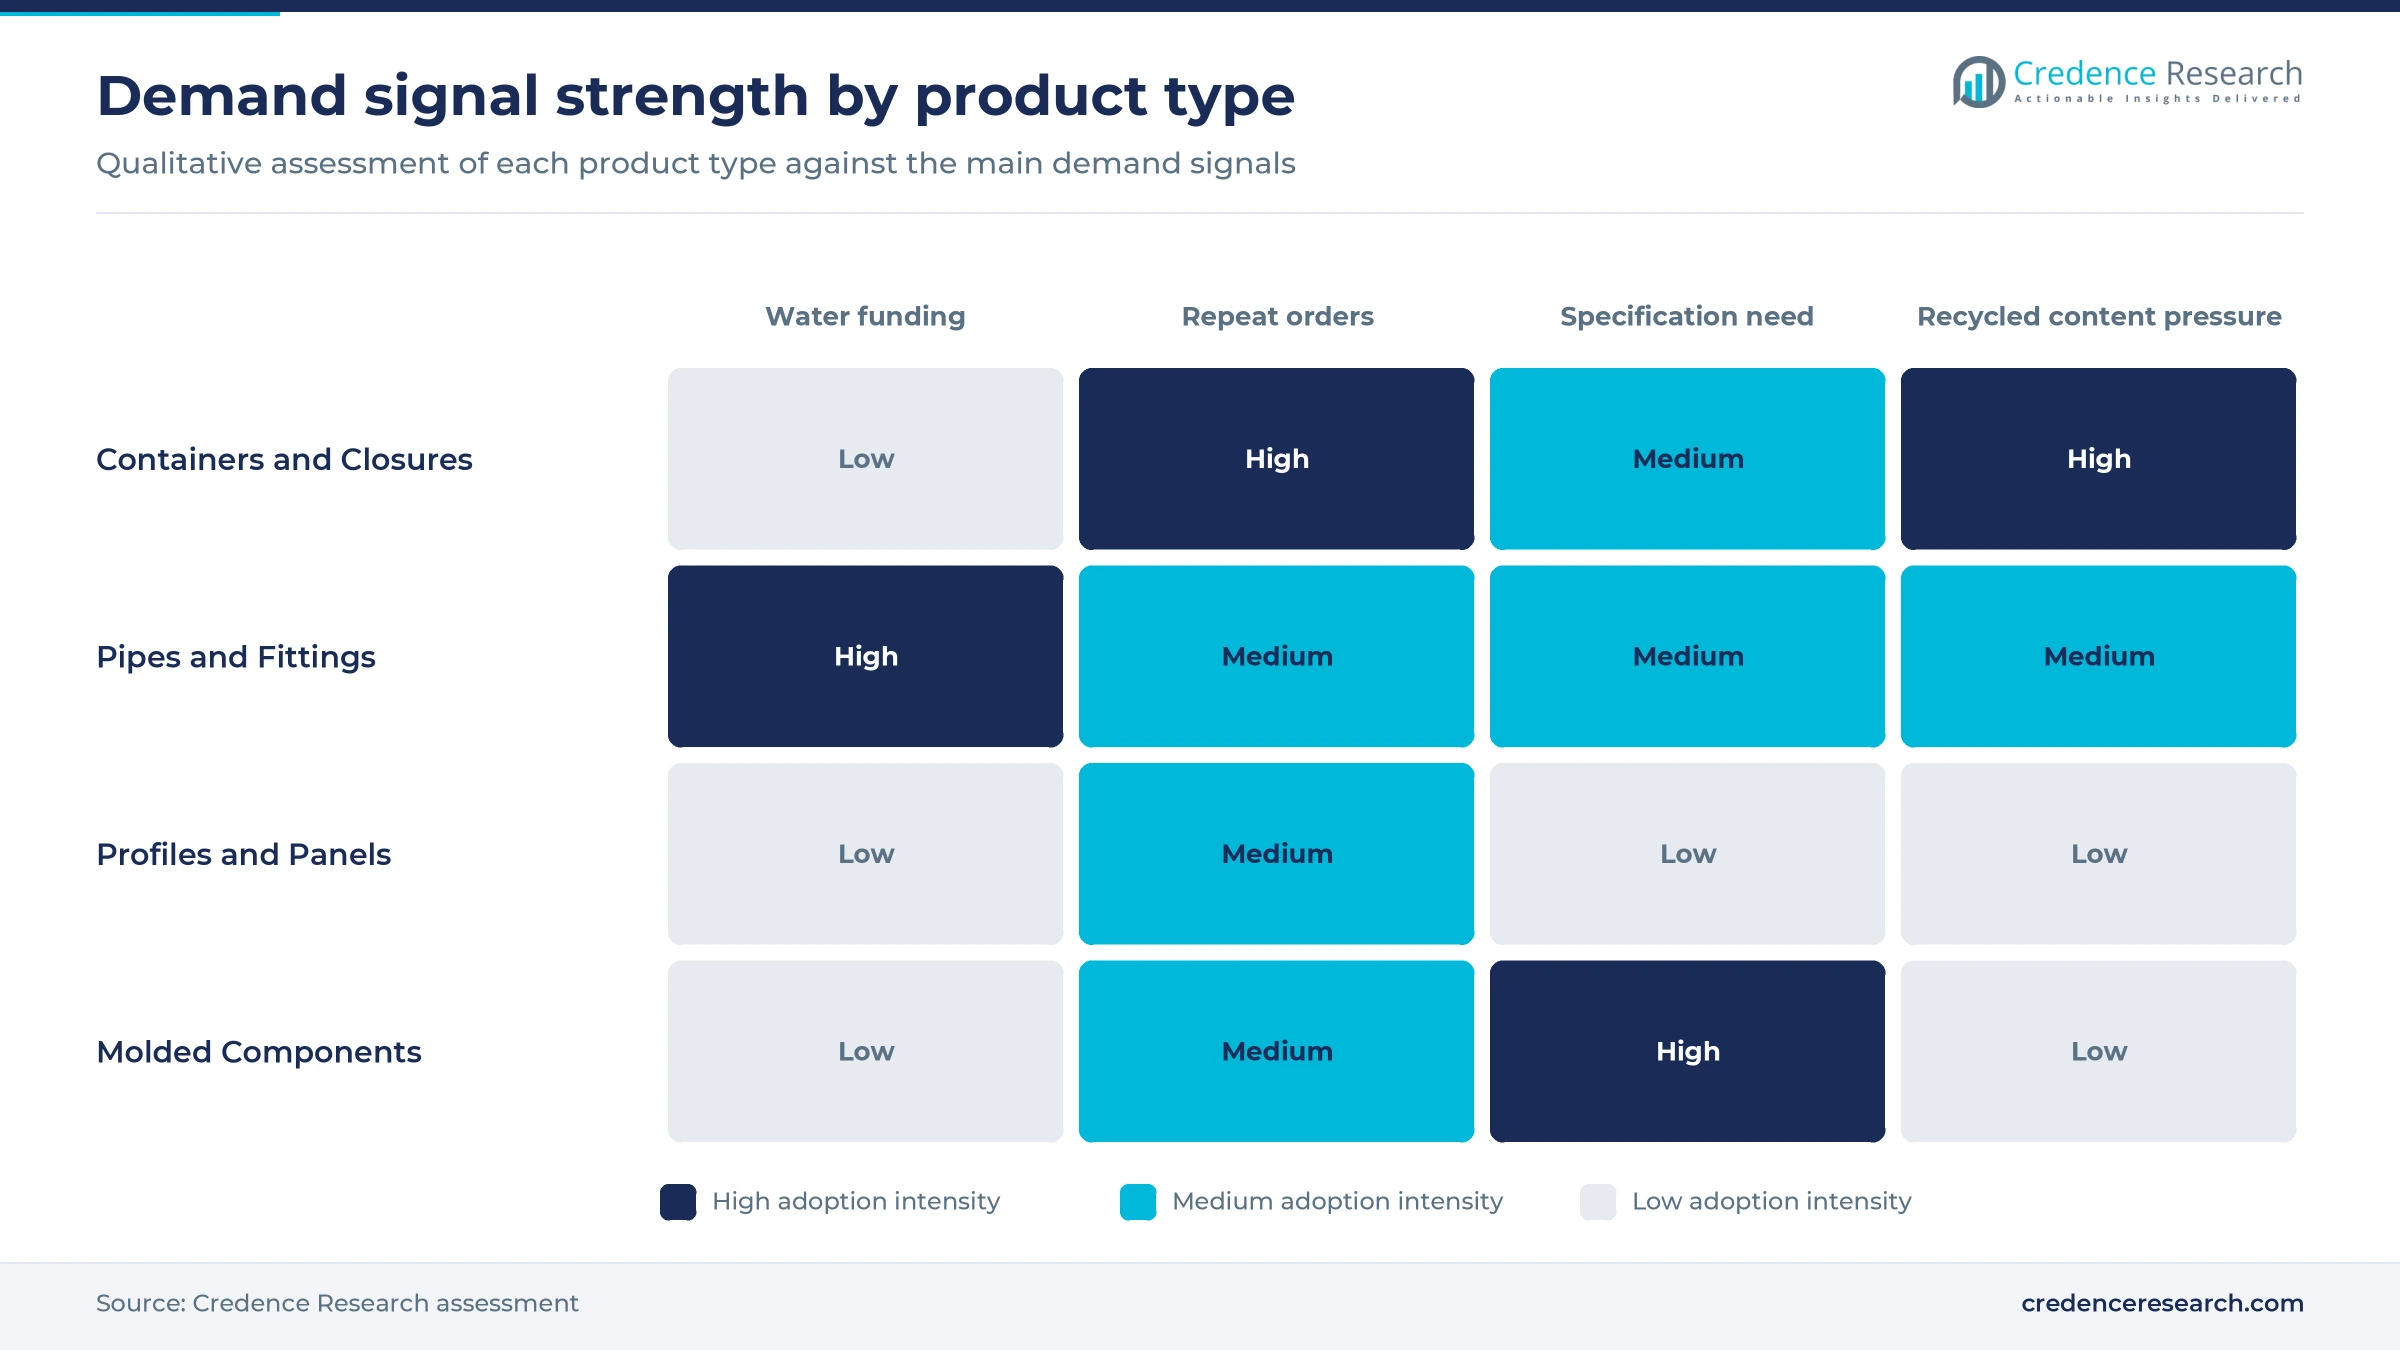
Water funding and repeat packaging orders drive demand
Water infrastructure renewal lifts pipe and fitting orders
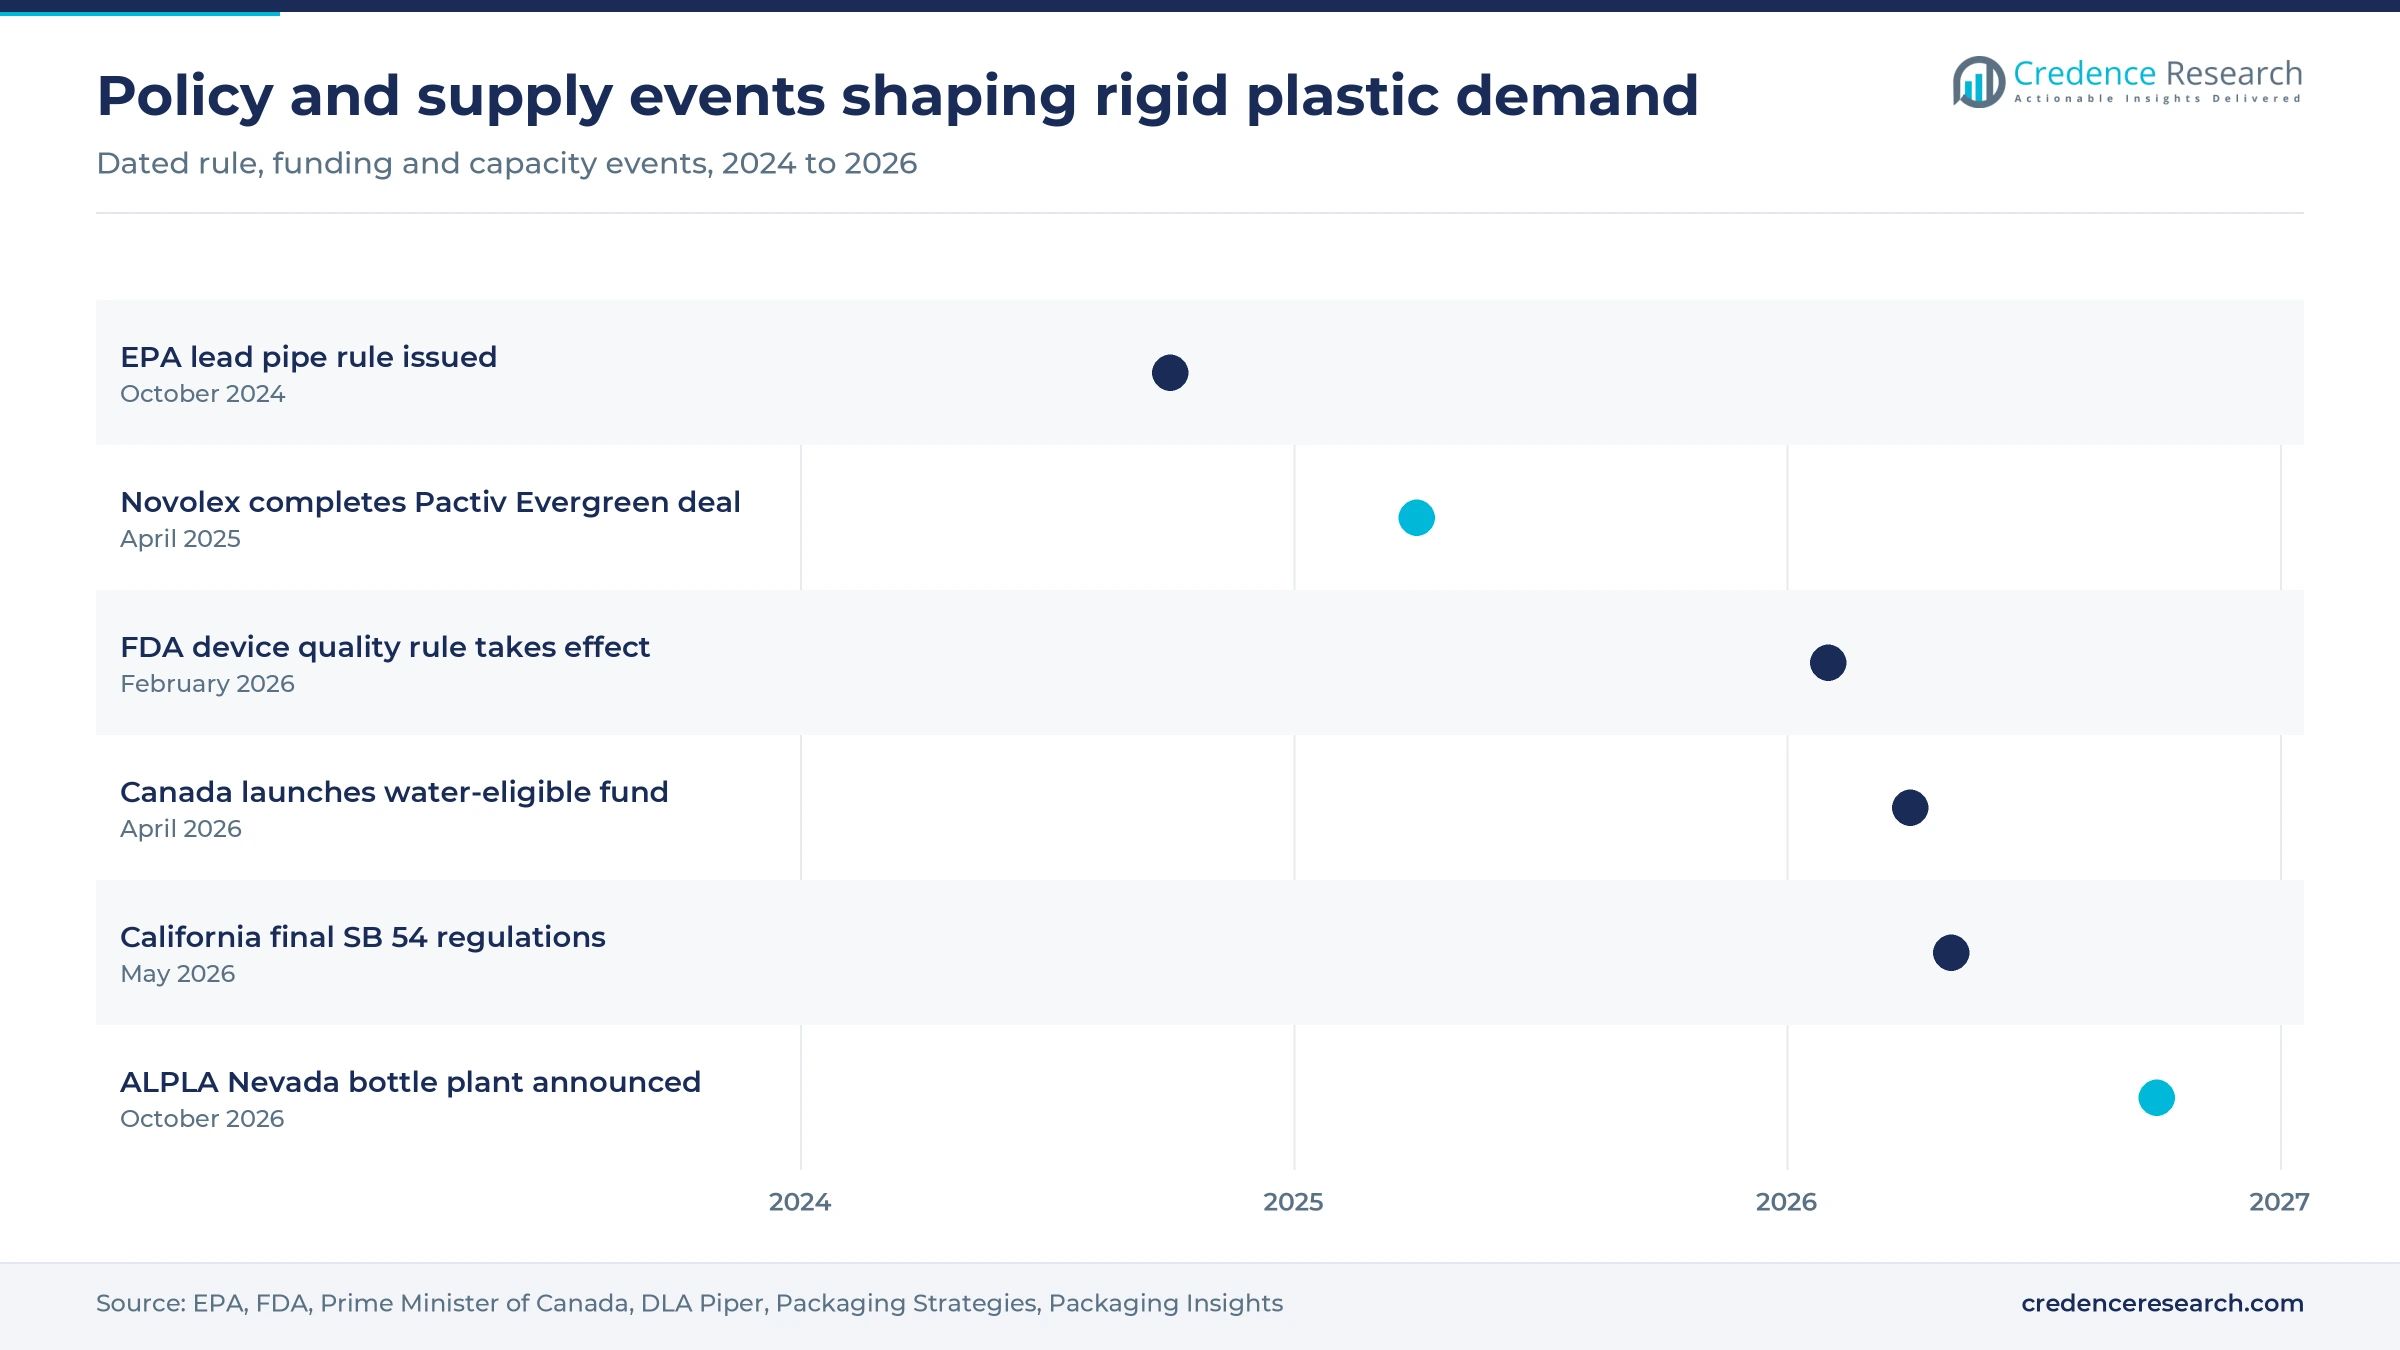
Water infrastructure renewal gives pipe systems the clearest public funding signal in the region. The EPA issued its Lead and Copper Rule Improvements on Oct. 8, 2024, requiring drinking water systems to replace lead pipes within 10 years, and it estimated that up to nine million homes were served by legacy lead lines. The Bipartisan Infrastructure Law set aside $15 billion over five years for that replacement work. Canada then launched its C$51 billion Build Communities Strong Fund on April 7, 2026, which covers local water systems. In Mexico, Conagua lists 122.6 billion pesos for 17 strategic water projects from 2025 to 2030. As a result, Pipes and Fittings expand at 6.28% a year through 2035.
Recurring packaging replenishment keeps converters running
Recurring packaging replenishment gives converters a steady base because filled goods are consumed and reordered within weeks or months. The International Bottled Water Association reported in May 2026 that U.S. consumption equaled about 380 single-serve bottles per person in 2025. Converters are adding capacity near those fillers, and Plastics News reported in November 2025 that Plastipak would add 15 jobs to the 340 at Pineville, Louisiana. ALPLA plans to open its North Las Vegas extrusion blow molding plant in spring 2027, serving food, beverage, beauty and home care customers. Silgan said in April 2026 that destocking in its custom containers business had ended in the first quarter. This recurring base explains the 60.0% share held by Containers and Closures.
Medical and engineering specifications favor qualified molders
Specification-led medical and engineering demand rewards molders that can document process control, which limits how quickly buyers can switch suppliers. The FDA Quality Management System Regulation took effect on Feb. 2, 2026, adding ISO 13485:2016 by reference for device makers selling in the United States. Molders are building for that work, and Plastics News reported on July 22, 2026, that Arterex added a clean room at Tecate, Mexico. Innova Engineered Plastics said its Mexicali plant was pursuing ISO 13485:2016 and AS9100 certification when it opened in September 2025. Vehicles add a second specification channel, since the American Chemistry Council counted 102 pounds of polypropylene per North American vehicle in 2025. Together these programs also support healthcare packaging lines that share the same qualified plants.
Consolidation widens national reach for the largest suppliers
Consolidation is giving the largest suppliers wider national reach, which matters to brand owners that want one contract across several plants. Novolex completed its $6.7 billion acquisition of Pactiv Evergreen on April 1, 2025, creating a group with more than 250 brands and 39,000 products across the United States, Canada and Mexico. Amcor closed its Berry Global merger by April 30, 2025, and it told investors in August 2026 that it captured $285 million of synergies in fiscal 2026. Plastics News reported on Sept. 9, 2025, that Georgia-Pacific would buy Anchor Packaging, ranked No. 8 among North American thermoformers. In pipe, Advanced Drainage Systems closed its purchase of the NDS water management business on Feb. 2, 2026.
Recycled content and producer fees reshape rigid formats
Shift toward recycled resin changes bottle and pipe sourcing
Recycled resin is moving from a marketing claim to a sourcing line, though supply remains uneven across the region. NAPCOR reported in December 2025 that recycled content in U.S. PET bottles averaged 15.9% in 2024, above the three-year average of 13.7%. Thermoforms are joining that stream, with 264 million pounds collected in the United States and Canada in 2024, up 52%. In pipe, Advanced Drainage Systems converts about 225 million pounds of recycled HDPE and 140 million pounds of recycled polypropylene a year. ALPLA and Coca-Cola FEMSA plan a $60 million plant in Cunduacán, Tabasco, that would yield 35,000 metric tons of recycled PET a year, according to Recycling Today, which supports recycled-content packaging programs in Mexico.
Rising producer fees push container redesign in California
Rising producer responsibility costs are pushing brand owners to redesign containers before the first invoices arrive. California approved final SB 54 regulations on May 1, 2026, and DLA Piper reported in June 2026 that first annual producer invoices are due in early 2027. The law seeks a 25% plastic source reduction by 2032, with a 10% interim target for 2027, and a 65% plastic recycling rate by Jan. 1, 2032. Producers must also contribute $500 million a year to a mitigation fund. Packaging World reported that no more than 8% of the source reduction can come from added recycled content, and that clear, unpigmented PET could lower fees by 5%. As a result, right-sizing and pigment removal now shape many container briefs.
Opportunity in Canadian housing-enabling water mains
Canada offers an opening for pipe and fitting suppliers because new federal money is reaching small municipal water jobs. The first tranche of the Build Communities Strong Fund named 13 projects with C$300 million in federal funding, and Smart Water Magazine counted nine water or wastewater projects worth over C$190 million in April 2026. Those projects include C$108 million for water and sewer upgrades in Iqaluit and C$29 million for sewer upgrades in Regina. The provincial stream alone carries C$17.2 billion over 10 years, including housing-enabling water and wastewater systems. Advanced Drainage Systems already owns manufacturing plants in Canada, while Canada grows at 5.92% a year, above the regional rate of 5.42%.
Opportunity in data center and electrical conduit programs
Data center and electrical programs offer an opening for conduit, fittings and enclosed parts as those projects move to larger scale. Atkore said on May 5, 2026, that growth in plastic pipe, conduit and fittings supported its volumes, and it described data center demand as growing at a double-digit rate. Advanced Drainage Systems said on May 21, 2026, that it plans to pursue growth in segments such as data centers. Innova Engineered Plastics lists data centers and AI solutions among the sectors served from its Mexicali plant. In Mexico, Anipac reported that the electrical sector grew 3% in 2025, faster than the 2.5% recorded for the plastics industry overall. These programs favor suppliers with national distribution and code-listed products.
PVC pricing, litigation and trade reviews weigh on makers
PVC pipe pricing squeezes margins as resin costs rise
PVC pipe margins are under pressure because selling prices and input costs have moved in opposite directions. Otter Tail reported for the third quarter of 2026 that its plastics segment saw average prices fall 9%, while PVC resin and other input costs rose 10% and volume fell 5%. Westlake also said its nine-month prices fell 1%, primarily on lower pipe and fittings prices. Smaller regional extruders are the most exposed to this squeeze. Mitigation depends on cost pass-through and on new capacity that lowers unit cost.
PVC pipe antitrust cases add legal costs and scrutiny
Antitrust litigation has added direct costs and closer buyer scrutiny for PVC pipe makers. Westlake agreed in March 2026 to pay $67 million to direct purchasers, while Atkore recorded a $136.5 million liability after settling with two of three classes. Otter Tail subsidiaries agreed to pay $103.5 million across three classes, without admitting wrongdoing. A U.S. Department of Justice investigation and a British Columbia suit remain open, according to company filings. Utilities and distributors may respond by requiring more price transparency in tenders.
Weak bottle collection limits recycled resin supply
Recycled resin targets are harder to meet because collection has weakened in the largest market. The U.S. PET bottle collection rate fell to 30.2% in 2024 from 32.5% a year earlier, according to NAPCOR and imports reached a record 23% of recycled PET supply. This gap affects bottle makers that have promised content levels to brand owners, and California needs a 65% plastic recycling rate by 2032. New recycling capacity, such as the plant planned for Tabasco, is one available remedy.
USMCA annual reviews cloud cross-border part programs
Trade uncertainty delays cross-border part programs because molders follow vehicle assembly decisions. INEGI data published on Jan. 9, 2026, showed Mexico built 3,953,494 light vehicles in 2025, down 0.90%. Anipac said tariff tensions were pausing investment, and USTR said on July 1, 2026, that the United States did not agree to renew the USMCA in its current form. White & Case said this triggers annual joint reviews, while the pact stays in force through July 1, 2036. Suppliers can reduce that risk by qualifying second sites in another country.
United States demand dwarfs Canada and Mexico
| Country | Value, 2025 (USD billion) | Share, 2025 | CAGR, 2026–2035 |
|---|---|---|---|
| United States | 63.24 | 87.5% | 5.32% |
| Canada | 4.91 | 6.8% | 5.92% |
| Mexico | 4.12 | 5.7% | 6.32% |
United States leads on industry scale and water funding
The United States held 87.5% of 2025 value and grows at 5.32% a year, slightly below the regional rate because its base is so large. For 2024, the Plastics Industry Association counted 10,228 plastic products establishments with $275.7 billion in shipments. Pipe capacity continues to expand, and Villages-News reported in June 2026 that Charlotte Pipe finished a $25 million, 54,700-square-foot expansion of its Wildwood, Florida, plant, which makes PVC pipe for plumbing and irrigation. Housing weakness remains the main near-term drag on these orders.
Canada gains from federal water and housing programs
Canada held 6.8% of 2025 value and grows at 5.92% a year as federal funding reaches municipal water systems. Canadian Industry Statistics lists 2,636 plastic product establishments in 2025 and C$33.4 billion of shipments in 2023. Regulation remains a factor for food service formats, because the Federal Court of Appeal upheld the listing behind the Single-use Plastics Prohibition Regulations on Jan. 30, 2026. That ruling keeps pressure on problematic plastics in food service ware, while pipe, fitting and durable molded goods remain outside those bans.
Mexico grows fastest on water projects and device molding
Mexico held 5.7% of 2025 value and is the fastest-growing country at 6.32% a year, helped by federal water projects and border manufacturing. Anipac said the national plastics industry grew 2.5% in 2025, with health, food and general consumption supporting demand while automotive work slowed. Device molding is adding depth in Baja California, with the Arterex clean room at Tecate and the Innova plant at Mexicali. The planned ALPLA and Coca-Cola FEMSA plant in Tabasco would add a local recycled PET source for bottle makers.
Deals and plants reshaped supply from 2025 to 2026
| Development | Status and market relevance |
|---|---|
| In April 2025, Novolex completed its $6.7 billion acquisition of Pactiv Evergreen, with a footprint across the United States, Canada and Mexico. | Completed; widens food and beverage packaging supply |
| In February 2026, Advanced Drainage Systems closed its acquisition of NDS, the water management business of Norma Group. | Completed; adds water management products |
| In April 2026, Atkore sold its HDPE Pipe & Conduit business to Infra Pipes and kept a 10% stake in the combined entity. | Completed; five plants moved to the combined business |
| In June 2026, Charlotte Pipe and Foundry marked a $25 million expansion of its PVC pipe plant in Wildwood, Florida. | Opened; adds plumbing and irrigation pipe capacity |
| In October 2026, ALPLA announced a North Las Vegas plant for extrusion blow molded bottles, due to open in spring 2027. | Planned; second ALPLA plant in the western United States |
Four conversion processes split the rigid product range
- Injection molding makes closures, device housings and vehicle parts, and Innova Engineered Plastics now runs presses up to 900 tons at Mexicali for regulated customers.
- Blow molding forms bottles and larger containers, and ALPLA is installing extrusion blow molding machines at North Las Vegas for beauty and home care bottles.
- Extrusion produces pipe, conduit, profiles and panels, and Advanced Drainage Systems operates 64 plants for its pipe and water management lines, including joint ventures.
- Thermoforming shapes trays, cups and clamshells from sheet, and 264 million pounds of PET thermoforms were collected in the United States and Canada in 2024, according to NAPCOR.
Need a Custom Version of This Report?
Tailor the scope, geography, or segments to your exact requirements.
- Custom geography or segment scope
- Direct access to our analyst team
Consolidated converters face regional pipe specialists
Competition splits into two groups that rarely meet head to head. Packaging converters such as Novolex, Amcor, Plastipak, ALPLA and Silgan compete on plant proximity, light-weighting, recycled content and contract coverage for national brands. Pipe producers such as Advanced Drainage Systems, Westlake Pipe & Fittings, Atkore and Charlotte Pipe and Foundry compete on distribution reach, product approvals and freight distance, because pipe is costly to ship. Advanced Drainage Systems says its pipe has been displacing reinforced concrete, corrugated steel and PVC in several end markets, which sets it against other materials as well as rival resins. Consolidation is sharpening scale differences, as Amcor targets $650 million of Berry synergies over three years. Regional molders still hold medical and vehicle programs where qualification records matter more than scale.
Companies profiled and their roles in this market
| Company | Type | Role in the market |
|---|---|---|
| Novolex (Pactiv Evergreen) | Packaging converter | Food and beverage packaging, combined April 2025, with plants in the United States, Canada and Mexico |
| Amcor plc | Packaging converter | Global rigid packaging business enlarged by the Berry Global merger in April 2025 |
| Plastipak Holdings | Bottle maker | Blow molding, expanding at Pineville, Louisiana, in late 2025 |
| ALPLA Group | Bottle maker | North Las Vegas plant planned for 2027 and PET recycling venture in Tabasco with Coca-Cola FEMSA |
| Silgan Holdings | Closures and containers | Dispensing and specialty closures, and custom containers for North American food and personal care |
| Advanced Drainage Systems | Pipe producer | Thermoplastic drainage pipe and water management, 64 plants, Canadian plants and Mexican joint venture |
| Westlake Pipe & Fittings | Pipe producer | PVC pipe and fittings within the Westlake housing and infrastructure business |
| Atkore | Pipe and conduit producer | Plastic pipe, conduit and fittings, after selling its HDPE business in April 2026 |
| Charlotte Pipe and Foundry | Pipe producer | PVC pipe for plumbing and irrigation, expanded at Wildwood, Florida, in 2026 |
Pipe renewal offers visibility as packaging matures
Credence Research's view is that pipe and fittings offer the most visible demand in the rigid plastic market, because funded replacement work is written into rule and budget for years ahead. Packaging remains the larger pool, but it behaves as a mature replacement business in which recycled content and California fees will decide who keeps contracts. Buyers should expect PVC pricing to stay contested after the 2026 antitrust settlements, while the 9% price decline at Otter Tail shows how quickly margins can shift. Device and vehicle molders with ISO 13485 records hold the strongest pricing position through the forecast period.
How Credence Research estimated this regional market
The report uses 2025 as the base year and 2026–2035 as the forecast period, with market values from the Credence Research model. Country, segment and channel splits are Credence Research estimates informed by public data, including industry shipment statistics, regulator releases, company filings, trade association reports and trade press. No interviews or surveys were conducted for this edition, and estimated shares should be read as directional rather than as audited figures.
Specification work and renewal spending shape 2035
By 2035 the rigid plastic market reaches USD 122.80 billion, with growth concentrated in funded pipe replacement and qualified molded parts rather than in additional container units. Lead service line deadlines and Canadian and Mexican water programs should keep pipe orders firm even when housing slows. Packaging value will depend on how California fees spread to other states, and on whether recycled PET supply recovers from the 2024 collection decline. The annual USMCA joint reviews that began after July 2026 remain the main swing factor for vehicle and device programs in Mexico, and suppliers with plants on both sides of the border are best placed to absorb that outcome.
Frequently Asked Questions
How big is the North America rigid plastic market?
Which country leads the market?
Which country grows fastest?
Which product type is largest?
Why are pipes and fittings growing fastest?
How does California SB 54 affect rigid packaging?
What are the main challenges?
Who are the leading companies?
Table of Content
Chapter 1 Market Segmentation
- 1.1 Segmentation Framework
- 1.1.1 Product and Service Classification
- 1.1.2 Application and End-Use Classification
- 1.1.3 Technology and Solution Classification
- 1.1.4 Customer and Distribution Channel Classification
- 1.1.5 Geographic Segmentation
- 1.1.6 Market Segment Definitions and Boundaries
- 1.2 By Product Type
- 1.2.1 Containers and Closures
- 1.2.2 Pipes and Fittings
- 1.2.3 Profiles and Panels
- 1.2.4 Molded Components
- 1.3 By Resin Type
- 1.3.1 Polyolefins
- 1.3.2 Rigid PVC
- 1.3.3 PET
- 1.3.4 Styrenic and Engineering Thermoplastics
- 1.4 By End-Use Industry
- 1.4.1 Packaging
- 1.4.2 Building and Infrastructure
- 1.4.3 Automotive and Medical
- 1.4.4 Electrical, Agriculture and Consumer Goods
- 1.5 By Sales Channel
- 1.5.1 Direct Key Account Contracts
- 1.5.2 Specialist Product Distributors
- 1.5.3 OEM Program Supply
- 1.6 By Country
- 1.6.1 United States
- 1.6.2 Canada
- 1.6.3 Mexico
Chapter 2 Introduction
- 2.1 Report Objectives and Scope
- 2.2 Product Definition and Industry Terminology
- 2.3 Market Inclusions and Exclusions
- 2.4 Research Process
- 2.4.1 Primary Research and Expert Interviews
- 2.4.2 Secondary Research and Source Review
- 2.4.3 Top-Down and Bottom-Up Estimation
- 2.4.4 Data Triangulation and Verification
- 2.5 Market Size Measurement Basis
- 2.5.1 2025: USD 72.27 billion → 2035: USD 122.80 billion
- 2.6 Historical and Forecast Reference Periods
- 2.6.1 Historical Period: 2018-2025
- 2.6.2 Base Year: 2025
- 2.6.3 Forecast Period: 2025-2035
- 2.7 Research Assumptions and Limitations
Chapter 3 Executive Summary
- 3.1 Market Snapshot and Key Findings
- 3.2 Base-Year Market Size, 2025
- 3.3 Forecast Market Size, 2035
- 3.4 Revenue and Volume Growth Outlook
- 3.5 Key Demand and Supply Indicators
- 3.6 Leading Market Segments
- 3.7 Fastest-Growing Market Opportunities
- 3.8 Regional Performance Highlights
- 3.9 Technology and Industry Transformation
- 3.10 Competitive Landscape Summary
- 3.11 Analyst View and Strategic Implications
Chapter 4 North America Rigid Plastic Market Trends and Developments
- 4.1 Historical Industry Development, 2018-2025
- 4.2 Recent Market Trends and Developments
- 4.3 Demand and Customer Behavior Trends
- 4.4 Technology and Product Innovation
- 4.5 Artificial Intelligence, Automation and Digitalization
- 4.6 Local Manufacturing and Supply Chain Realignment
- 4.7 Industry Partnerships, Mergers and Acquisitions
- 4.8 Sustainability and Circular Economy Developments
- 4.9 Government and Private Sector Investment Trends
- 4.10 Emerging Business Models and Commercialization
- 4.11 Industry Developments and Announcements
Chapter 5 North America Rigid Plastic Market Production, Supply and Demand Analysis
- 5.1 Demand Trend and Consumption Analysis, 2018-2025
- 5.2 Demand Forecast, 2025-2035
- 5.3 Production and Output Trend, 2018-2025
- 5.4 Production and Output Forecast, 2025-2035
- 5.5 Installed Capacity and Capacity Utilization
- 5.6 Company-Wise Production Plants and Statistics
- 5.6.1 Installed Production Capacity
- 5.6.2 Actual Production
- 5.6.3 Planned Capacity and Expansion Targets
- 5.7 Supply Chain Structure and Procurement Trends
- 5.8 Supply-Demand Gap and Bottlenecks
- 5.9 Import Dependence and Sourcing Structure
- 5.10 Contract Manufacturing and Outsourcing
- 5.11 Regional Supply and Demand Concentration
Chapter 6 North America Rigid Plastic Market Pricing Analysis
- 6.1 Pricing Structure and Measurement
- 6.2 Historical Pricing Trends, 2018-2025
- 6.3 Pricing Outlook, 2025-2035
- 6.4 Average Selling Price and Unit Economics
- 6.5 Pricing by Product and Market Segment
- 6.6 Geographic Pricing Differences
- 6.7 Key Input, Energy, Labor and Logistics Costs
- 6.8 Contract Pricing and Purchasing Models
- 6.9 Pricing Sensitivity and Competitive Positioning
- 6.10 Price, Margin and Profitability Implications
Chapter 7 North America Rigid Plastic Market Dynamics
- 7.1 Market Growth Drivers
- 7.1.1 Demand-Side Drivers
- 7.1.2 Technology and Innovation Drivers
- 7.1.3 Infrastructure and Investment Drivers
- 7.1.4 Regulatory and Policy Drivers
- 7.2 Market Restraints
- 7.2.1 Cost and Affordability Constraints
- 7.2.2 Technology and Adoption Barriers
- 7.2.3 Supply Chain and Operational Constraints
- 7.3 Market Challenges
- 7.3.1 Competitive Pressure and Margin Erosion
- 7.3.2 Skills, Infrastructure and Implementation Gaps
- 7.4 Emerging Market Opportunities
- 7.5 Market Dynamics Impact and Time-Horizon Assessment
Chapter 8 North America Rigid Plastic Value Chain Analysis
- 8.1 Industry Value Chain Overview
- 8.2 Upstream Suppliers and Critical Inputs
- 8.3 Technology and Component Providers
- 8.4 Manufacturing or Service Delivery
- 8.5 Distribution, Channel Partners and Integrators
- 8.6 Downstream Applications and End Users
- 8.7 Value Addition and Profit Pools
- 8.8 Vertical Integration and Outsourcing
- 8.9 Supplier Concentration and Risk
- 8.10 Supply Chain Localization and Resilience
Chapter 9 North America Rigid Plastic Market Regulations and Policies
- 9.1 Relevant Laws, Standards and Compliance Frameworks
- 9.2 Product, Service, Safety and Quality Requirements
- 9.3 Government Policies, Incentives and Subsidies
- 9.4 Imports, Exports and Trade Barriers
- 9.5 Public Procurement and Local Content Requirements
- 9.6 Environmental and Sustainability Compliance
- 9.7 Upcoming Policy Changes and Market Implications
Chapter 10 North America Rigid Plastic Market Hotspots and Opportunities
- 10.1 Market Opportunity Mapping and Growth Hotspots
- 10.2 High-Growth Applications and Customer Groups
- 10.3 Underserved Markets and White-Space Opportunities
- 10.4 Emerging Technology and Product Opportunities
- 10.5 New Capacity and Investment Hotspots
- 10.6 Market Entry and Expansion Opportunities
- 10.7 Distribution and Partnership Opportunities
- 10.8 Near-Term and Long-Term Commercial Potential
- 10.9 Opportunity Attractiveness and Execution Risks
Chapter 11 North America Rigid Plastic Market Outlook, 2025-2035
- 11.1 Market Size and Analysis
- 11.1.1 Revenue (Market Measurement: 2025: USD 72.27 billion → 2035: USD 122.80 billion)
- 11.1.2 Market Volume and Quantity Sold
- 11.1.3 Historical Market Size, 2018-2025
- 11.1.4 Base-Year Market Size, 2025
- 11.2 Market Forecast, 2025-2035
- 11.2.1 Revenue Forecast to 2035
- 11.2.2 Volume Forecast to 2035
- 11.2.3 CAGR and Year-on-Year Growth
- 11.2.4 Incremental Revenue Opportunity
- 11.3 Forecast Assumptions and Scenario Analysis
- 11.3.1 Base-Case Forecast
- 11.3.2 Optimistic and Conservative Scenarios
- 11.3.3 Technology, Pricing and Policy Sensitivities
- 11.4 Market Attractiveness and Growth Outlook
Chapter 12 North America Rigid Plastic Market Segmentation and Outlook
- 12.1 Segmentation Summary and Market Shares, 2025
- 12.2 Largest and Fastest-Growing Segments
- 12.3 By Product Type - Market Size and Forecast, 2025-2035
- 12.3.1 Segment Definition and Scope
- 12.3.2 Historical Market Size, 2018-2025
- 12.3.3 Revenue Forecast, 2025-2035
- 12.3.4 Volume Forecast, 2025-2035
- 12.3.5 Base-Year Market Share, 2025
- 12.3.6 Segment CAGR and Growth Drivers
- 12.3.7 Subsegment Market Size and Forecast
- 12.3.7.1 Containers and Closures
- 12.3.7.2 Pipes and Fittings
- 12.3.7.3 Profiles and Panels
- 12.3.7.4 Molded Components
- 12.3.8 Subsegment Pricing and Adoption Trends
- 12.3.9 Leading Suppliers and Competition
- 12.3.10 Regional Demand and Opportunities
- 12.4 By Resin Type - Market Size and Forecast, 2025-2035
- 12.4.1 Segment Definition and Scope
- 12.4.2 Historical Market Size, 2018-2025
- 12.4.3 Revenue Forecast, 2025-2035
- 12.4.4 Volume Forecast, 2025-2035
- 12.4.5 Base-Year Market Share, 2025
- 12.4.6 Segment CAGR and Growth Drivers
- 12.4.7 Subsegment Market Size and Forecast
- 12.4.7.1 Polyolefins
- 12.4.7.2 Rigid PVC
- 12.4.7.3 PET
- 12.4.7.4 Styrenic and Engineering Thermoplastics
- 12.4.8 Subsegment Pricing and Adoption Trends
- 12.4.9 Leading Suppliers and Competition
- 12.4.10 Regional Demand and Opportunities
- 12.5 By End-Use Industry - Market Size and Forecast, 2025-2035
- 12.5.1 Segment Definition and Scope
- 12.5.2 Historical Market Size, 2018-2025
- 12.5.3 Revenue Forecast, 2025-2035
- 12.5.4 Volume Forecast, 2025-2035
- 12.5.5 Base-Year Market Share, 2025
- 12.5.6 Segment CAGR and Growth Drivers
- 12.5.7 Subsegment Market Size and Forecast
- 12.5.7.1 Packaging
- 12.5.7.2 Building and Infrastructure
- 12.5.7.3 Automotive and Medical
- 12.5.7.4 Electrical, Agriculture and Consumer Goods
- 12.5.8 Subsegment Pricing and Adoption Trends
- 12.5.9 Leading Suppliers and Competition
- 12.5.10 Regional Demand and Opportunities
- 12.6 By Sales Channel - Market Size and Forecast, 2025-2035
- 12.6.1 Segment Definition and Scope
- 12.6.2 Historical Market Size, 2018-2025
- 12.6.3 Revenue Forecast, 2025-2035
- 12.6.4 Volume Forecast, 2025-2035
- 12.6.5 Base-Year Market Share, 2025
- 12.6.6 Segment CAGR and Growth Drivers
- 12.6.7 Subsegment Market Size and Forecast
- 12.6.7.1 Direct Key Account Contracts
- 12.6.7.2 Specialist Product Distributors
- 12.6.7.3 OEM Program Supply
- 12.6.8 Subsegment Pricing and Adoption Trends
- 12.6.9 Leading Suppliers and Competition
- 12.6.10 Regional Demand and Opportunities
- 12.7 By Country - Market Size and Forecast, 2025-2035
- 12.7.1 Segment Definition and Scope
- 12.7.2 Historical Market Size, 2018-2025
- 12.7.3 Revenue Forecast, 2025-2035
- 12.7.4 Volume Forecast, 2025-2035
- 12.7.5 Base-Year Market Share, 2025
- 12.7.6 Segment CAGR and Growth Drivers
- 12.7.7 Subsegment Market Size and Forecast
- 12.7.7.1 United States
- 12.7.7.2 Canada
- 12.7.7.3 Mexico
- 12.7.8 Subsegment Pricing and Adoption Trends
- 12.7.9 Leading Suppliers and Competition
- 12.7.10 Regional Demand and Opportunities
- 12.8 Segment Growth Comparison
- 12.9 Segment Attractiveness and Priority Matrix
Chapter 13 North America Rigid Plastic End-Use and Application Market Outlook
- 13.1 End-Use Industry and Customer Demand Structure
- 13.2 Leading Applications and Customer Groups
- 13.3 End-Use Market Size, Share and Forecast
- 13.4 Major End-Use Industry Deep Dives
- 13.4.1 Customer Requirements and Use Cases
- 13.4.2 Demand and Replacement Cycles
- 13.4.3 Technical and Regulatory Considerations
- 13.4.4 Purchasing and Procurement Models
- 13.4.5 Leading Vendors and Distribution Channels
- 13.4.6 Forecast and Commercial Opportunities
- 13.5 Emerging Applications and Cross-Segment Demand
- 13.6 End-Use Industry Investment Priorities
Chapter 14 North America Rigid Plastic Geographic Market Outlook, 2025-2035
- 14.1 Regional Market Size and Country-Level Shares, 2025
- 14.2 Country Market Size Comparison, 2025
- 14.3 Country Market Forecasts, 2025-2035
- 14.4 Subregional Industrial and Demand Clusters
- 14.5 Intra-Regional Pricing and Cost Differences
- 14.6 Cross-Border Trade and Supply Networks
- 14.7 Regional Supply and Demand Balances
- 14.8 Country Opportunity Comparison and Prioritization
Note: Every listed country is covered on the structure shown under the first country.
Chapter 15 North America Rigid Plastic Technology, Innovation and Sustainability Outlook
- 15.1 Technology Landscape and Maturity
- 15.2 Product, Process and Service Innovation
- 15.3 AI, Automation and Digital Tools in the Industry
- 15.4 Technology Adoption and Performance Benchmarking
- 15.5 Innovation Pipeline and R&D Investment
- 15.6 Patent and Intellectual Property Trends
- 15.7 Energy Efficiency and Resource Management
- 15.8 Sustainability, Recycling and Circularity
- 15.9 Technology Roadmap, 2025-2035
- 15.10 Risks of Obsolescence and Technology Substitution
Chapter 16 North America Rigid Plastic Market Key Strategic Imperatives
- 16.1 Growth and Market Entry Priorities
- 16.2 High-Return Products and Segments
- 16.3 Pricing, Profitability and Cost Optimization
- 16.4 Technology Investment and Product Differentiation
- 16.5 Supply Chain Localization and Resilience
- 16.6 Distribution and Customer Acquisition
- 16.7 Partnership, Acquisition and Capacity Strategy
- 16.8 Regional Expansion Priorities
- 16.9 Short-, Medium- and Long-Term Actions
Chapter 17 Competition Outlook
- 17.1 Industry Competition Characteristics
- 17.2 Market Structure and Concentration
- 17.3 Market Share and Competitive Positioning, 2025
- 17.4 Company-Wise Revenue and Product Benchmarking
- 17.5 Production and Service Capacity Benchmarking
- 17.6 Technology, Pricing and Differentiation
- 17.7 Regional Footprint and Distribution Strength
- 17.8 Mergers, Acquisitions and Strategic Alliances
- 17.9 New Entrants and Competitive Threats
- 17.10 Porter's Five Forces and Industry Attractiveness
- 17.11 Competitive Outlook, 2025-2035
Chapter 18 Company Profiles
- 18.1 Company Coverage and Selection Criteria
- 18.2 Pactiv Evergreen (Novolex business)
- 18.2.1 Business Description
- 18.2.2 Company Ownership and Geographic Presence
- 18.2.3 Product and Service Portfolio
- 18.2.4 Manufacturing and Operating Footprint
- 18.2.5 Production Capacity and Expansion Plans
- 18.2.6 Financial Performance and Investment
- 18.2.7 Market Share and Competitive Position
- 18.2.8 Technology and Innovation Capabilities
- 18.2.9 Strategic Alliances or Partnerships
- 18.2.10 Recent Developments
- 18.2.11 Growth Strategy and Outlook
- 18.3 Amcor plc
- 18.4 Plastipak Holdings
- 18.5 Advanced Drainage Systems
- 18.6 Graham Packaging
- 18.7 Silgan Holdings
- 18.8 Westlake Pipe & Fittings
- 18.9 Atkore
- 18.10 ALPLA Group
- 18.11 Charlotte Pipe and Foundry
- 18.12 Other Relevant Market Participants
Note: Every listed company is profiled on the structure shown under the first company. The company list is preliminary and may change based on research findings, market developments, data availability and client requirements.
Chapter 19 Disclaimer
- 19.1 Research and Forecast Disclaimer
- 19.2 Data Source and Estimation Limitations
Note: The depth of individual sections depends on data availability for this market. Volume, capacity, trade and other unit-based metrics are included where applicable.

