Market Overview:
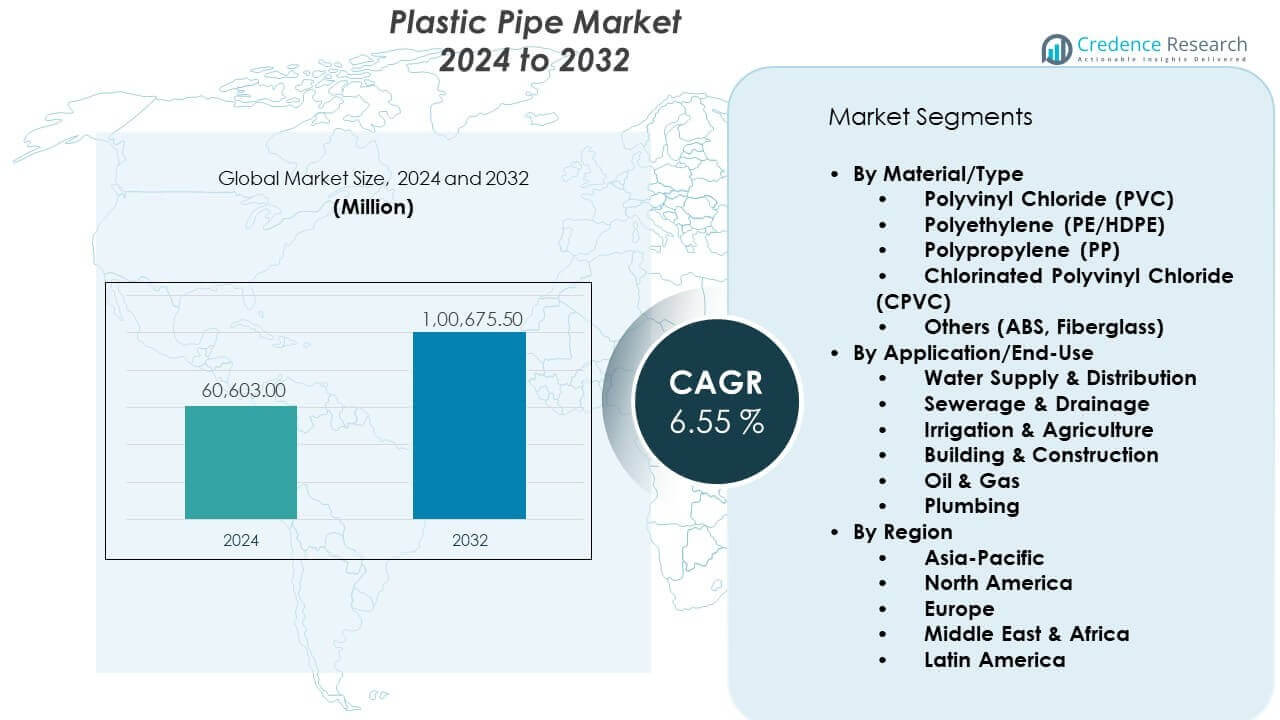
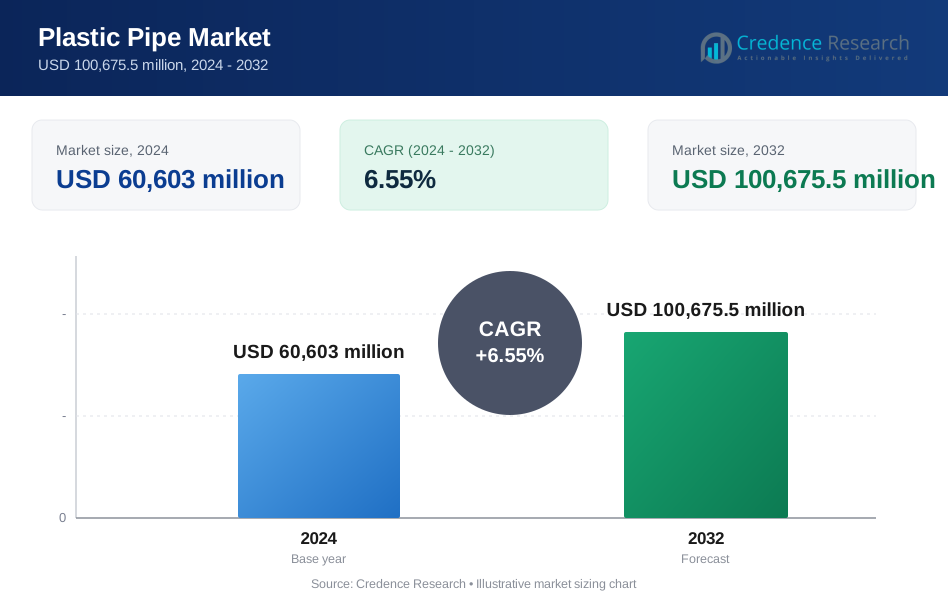
The Plastic pipe market is projected to grow from USD 60,603 million in 2024 to USD 100,675.5 million by 2032. The market is expected to expand at a CAGR of 6.55% during the forecast period from 2024 to 2032.
| REPORT ATTRIBUTE | DETAILS |
|---|---|
| Historical Period | 2020-2023 |
| Base Year | 2024 |
| Forecast Period | 2025-2032 |
| Plastic Pipe Market Size 2024 | USD 60,603 million |
| Plastic Pipe Market, CAGR | 6.55% |
| Plastic Pipe Market Size 2032 | USD 100,675.5 million |
The Plastic pipe market benefits from strong demand in water supply and sanitation projects. Governments focus on replacing aging metal pipelines with corrosion-resistant plastic alternatives. Urbanization increases the need for sewage and drainage networks. Agriculture relies on plastic pipes for efficient irrigation systems. Industrial users prefer plastic pipes for chemical resistance and easy installation. Lightweight designs reduce transport and labor costs. Energy efficiency goals encourage the use of plastic pipes in district heating and cooling networks. Real estate growth further supports consistent market demand.
Asia Pacific leads the Plastic pipe market due to rapid urban growth and infrastructure spending. China and India drive demand through housing, irrigation, and water treatment projects. Southeast Asia shows strong momentum from urban expansion. North America remains a mature market, supported by pipeline replacement and industrial use. Europe maintains steady demand due to strict water management standards. The Middle East emerges as a key growth region, driven by desalination and construction projects. Africa shows early-stage growth as basic water infrastructure expands.
Market Insights:
- The Plastic pipe market stood at USD 60,603 million in 2024 and is projected to reach USD 100,675.5 million by 2032, growing at a CAGR of 6.55% due to steady infrastructure and construction demand.
- Asia-Pacific (45%), North America (25%), and Europe (20%) lead regional demand, driven by urban infrastructure investment, pipeline replacement programs, and strict water management standards.
- Middle East & Africa, with around 6% share, is the fastest-growing region, supported by desalination projects, water scarcity solutions, and large-scale construction activity.
- By application, Water Supply & Distribution accounts for about 40%, while Sewerage & Drainage holds nearly 22%, supported by municipal infrastructure upgrades.
- By material, PVC represents around 48% share, followed by PE/HDPE at nearly 32%, reflecting cost efficiency, durability, and flexibility advantages.
Market Drivers:
Expansion Of Urban Water Supply And Sanitation Infrastructure Projects
Governments invest heavily in urban water networks to support population growth. Municipal bodies replace old metal pipelines with plastic alternatives. Plastic pipes resist corrosion and leakage under varied conditions. The Plastic pipe market benefits from lower maintenance requirements. Urban housing projects demand reliable plumbing systems. Contractors prefer plastic pipes due to easy handling. Faster installation shortens project timelines. Public funding supports large-scale pipeline deployment. Infrastructure renewal sustains long-term demand.
- For instance, JM Eagle supplied over 300 miles of PVC water pipe for the Los Angeles Clean Water Program, supporting pressure ratings up to 235 psi and reducing leak-related maintenance needs across municipal zones.
Rising Agricultural Irrigation And Water Efficiency Requirements
Agriculture depends on efficient water delivery systems. Plastic pipes support drip and sprinkler irrigation networks. Farmers prefer lightweight materials for field deployment. Plastic pipes reduce water loss through controlled flow. The Plastic pipe market gains from expanding irrigated land. Governments promote micro-irrigation adoption programs. Plastic materials handle fertilizer and chemical exposure well. Flexible layouts suit varied farm sizes. Water conservation goals strengthen adoption rates.
- For instance, Jain Irrigation deployed HDPE piping systems across more than 1.2 million hectares globally, achieving water savings above 40% in drip irrigation projects through precision flow control.
Growth Of Residential And Commercial Construction Activities
Housing demand rises due to urban migration trends. Commercial buildings require durable plumbing systems. Plastic pipes support hot and cold water distribution. Builders favor materials with long service life. The Plastic pipe market aligns with real estate growth. Plastic pipes lower labor and transport costs. Design flexibility supports modern building layouts. Compliance with building codes improves acceptance. Construction activity sustains steady pipe consumption.
Increasing Industrial Demand For Corrosion-Resistant Piping Systems
Industries handle aggressive fluids and chemicals. Plastic pipes resist corrosion better than metal options. Chemical plants prefer plastic for safety reasons. The Plastic pipe market serves diverse industrial processes. Manufacturing units seek cost-efficient piping solutions. Plastic pipes reduce downtime due to low failure rates. Lightweight systems simplify plant modifications. Energy and mining sectors also adopt plastic piping. Industrial expansion supports consistent demand growth.
Market Trends:
Shift Toward Advanced Polymer Materials And Composite Pipe Designs
Manufacturers develop pipes with improved polymer blends. Advanced materials enhance pressure tolerance and durability. Composite designs extend product lifespan. The Plastic pipe market reflects material innovation trends. End users seek higher performance under extreme conditions. Improved polymers support broader industrial use. Research focuses on thermal and chemical stability. Product differentiation increases market competition. Innovation shapes future product portfolios.
- For instance, Aliaxis introduced reinforced polymer piping systems tested beyond 1,000 hours of chemical exposure and rated for continuous operation above 90°C in industrial fluid applications.
Rising Preference For Flexible And Modular Piping Systems
End users value flexible piping layouts. Modular systems ease expansion and repair tasks. Plastic pipes adapt well to compact installations. The Plastic pipe market follows modular construction trends. Flexible designs reduce joint failures. Contractors prefer systems with fewer fittings. Space-saving layouts suit dense urban projects. Modular piping improves operational efficiency. Demand grows across residential and commercial segments.
- For instance, Astral Limited expanded its modular CPVC piping range with push-fit systems that cut installation time by nearly 30% in high-rise residential plumbing projects.
Integration Of Digital Monitoring And Smart Pipeline Solutions
Pipeline monitoring gains importance in large networks. Sensors track flow and pressure changes. Plastic pipes support integration with monitoring tools. The Plastic pipe market aligns with smart infrastructure trends. Utilities aim to reduce leakage detection time. Digital systems improve maintenance planning. Smart pipelines lower operational risks. Technology adoption improves system reliability. Utilities drive demand for advanced pipe solutions.
Growing Focus On Lightweight Logistics And Supply Chain Efficiency
Logistics efficiency influences material choice decisions. Plastic pipes reduce transport fuel consumption. Lightweight products improve handling safety. The Plastic pipe market supports cost-efficient supply chains. Manufacturers optimize packaging and distribution models. Faster delivery supports project schedules. Reduced breakage lowers transit losses. Supply chain efficiency improves contractor satisfaction. Logistics trends shape purchasing preferences.
Market Challenges Analysis:
Volatility In Raw Material Prices And Supply Chain Disruptions
Plastic pipes rely on petroleum-based raw materials. Price volatility affects production cost stability. Supply chain disruptions impact material availability. The Plastic pipe market faces margin pressure during price swings. Manufacturers struggle with cost forecasting accuracy. Small producers face higher financial risk. Inventory management becomes more complex. Delays affect project delivery schedules. Cost control remains a major challenge.
Regulatory Scrutiny And Environmental Compliance Pressures
Regulators monitor plastic usage across industries. Environmental concerns affect public perception. The Plastic pipe market faces compliance obligations. Waste management rules increase operational complexity. Certification requirements raise entry barriers. Manufacturers invest in compliance systems. Policy differences across regions create uncertainty. Approval delays slow product launches. Regulatory pressure challenges market expansion.
Market Opportunities:
Expansion Of Water Infrastructure In Emerging Economies
Emerging economies invest in basic water access. Governments prioritize clean water distribution. Plastic pipes suit large-scale deployment needs. The Plastic pipe market gains from infrastructure gaps. Rapid urban growth supports new pipeline networks. Low installation cost improves project feasibility. International funding supports water projects. Long service life attracts public agencies. Emerging markets offer strong volume potential.
Development Of Sustainable And Recyclable Plastic Pipe Solutions
Sustainability gains importance across industries. Manufacturers develop recyclable plastic pipes. Eco-friendly materials improve brand acceptance. The Plastic pipe market aligns with circular economy goals. Green certifications support product differentiation. Builders seek sustainable construction materials. Innovation reduces environmental impact concerns. Sustainable solutions unlock new customer segments. Environmental focus creates long-term growth paths.
Market Segmentation Analysis:
By Material/Type
Polyvinyl Chloride (PVC) dominates demand due to low cost and strong durability. PVC suits water supply, drainage, and housing networks. Polyethylene (PE/HDPE) gains share in high-pressure and underground applications. HDPE offers flexibility, impact resistance, and long service life. Polypropylene (PP) serves industrial piping due to thermal and chemical stability. Chlorinated Polyvinyl Chloride (CPVC) supports hot water and industrial fluid transport. Others, including ABS and fiberglass, address niche needs that require strength or temperature tolerance. Material selection depends on pressure, temperature, and chemical exposure.
- For instance, Supreme Industries manufactures PVC and HDPE pipes certified up to PN16 pressure classes, supporting municipal and industrial networks.
By Application/End-Use
Water supply and distribution represent the largest application base. Municipal projects prefer plastic pipes for corrosion resistance. Sewerage and drainage systems use plastic for leak prevention and smooth flow. Irrigation and agriculture depend on plastic pipes for efficient water delivery. Building and construction rely on plastic pipes for plumbing and HVAC support. Oil and gas use plastic pipes in low-pressure and non-corrosive transport lines. Plumbing applications benefit from easy installation and long life. The Plastic pipe market supports diverse end uses through adaptable material properties.
- For instance, Advanced Drainage Systems supplies HDPE drainage pipes with load ratings exceeding H-20 standards, supporting large municipal stormwater systems across North America.
Segmentation:
By Material/Type- Polyvinyl Chloride (PVC)
- Polyethylene (PE/HDPE)
- Polypropylene (PP)
- Chlorinated Polyvinyl Chloride (CPVC)
- Others (ABS, Fiberglass)
- Water Supply & Distribution
- Sewerage & Drainage
- Irrigation & Agriculture
- Building & Construction
- Oil & Gas
- Plumbing
- North America
- U.S.
- Canada
- Mexico
- Europe
- Germany
- France
- U.K.
- Italy
- Spain
- Rest of Europe
- Asia Pacific
- China
- Japan
- India
- South Korea
- South-east Asia
- Rest of Asia Pacific
- Latin America
- Brazil
- Argentina
- Rest of Latin America
- Middle East & Africa
- GCC Countries
- South Africa
- Rest of the Middle East and Africa
Regional Analysis:
Asia-Pacific
Asia-Pacific holds the largest share of the Plastic pipe market, accounting for about 45% of global demand. Rapid urban growth drives strong need for water supply and sanitation systems. China leads regional consumption due to large infrastructure programs. India follows with rising irrigation and housing projects. Southeast Asian countries expand municipal networks to support urbanization. Local manufacturing capacity supports cost efficiency. Government-backed infrastructure spending sustains long-term demand.
North America And Europe
North America represents nearly 25% of the Plastic pipe market share. Replacement of aging pipelines supports stable demand across the United States and Canada. Industrial and residential construction also contribute to steady consumption. Europe accounts for around 20% of global demand. Strict water management regulations drive adoption of durable plastic piping. Western Europe focuses on pipeline upgrades and energy-efficient buildings. Eastern Europe shows moderate growth through infrastructure modernization.
Middle East & Africa And Latin America
The Middle East & Africa region holds close to 6% share of the Plastic pipe market. Water scarcity increases demand for desalination and distribution pipelines. Gulf countries invest heavily in construction and utility projects. Africa shows gradual growth from basic water access programs. Latin America accounts for about 4% of global demand. Brazil and Mexico lead regional consumption through urban and agricultural use. Infrastructure development supports steady regional expansion.
Key Player Analysis:
- JM Eagle Inc.
- China Lesso Group Holdings Limited
- Astral Limited
- Finolex Industries Limited
- Supreme Industries Limited
- Advanced Drainage Systems Inc.
- Aliaxis Group
- Prince Pipes and Fittings Limited
Competitive Analysis:
The Plastic pipe market shows moderate to high competition among global and regional manufacturers. Large players focus on scale, product range, and distribution reach. Cost leadership remains a key strategy in price-sensitive regions. Product quality and compliance standards shape buyer preferences. Companies invest in capacity expansion to meet infrastructure demand. Brand strength supports long-term contracts with utilities and builders. Regional firms compete through localized pricing and faster delivery. Technology upgrades improve durability and pressure performance. Strategic partnerships help firms expand regional presence. Competition remains steady across residential, agricultural, and industrial demand centers.
Recent Developments:
- Astral Limited executed three significant acquisitions in 2025, marking aggressive expansion beyond its core piping business. In August 2025, the company announced the acquisition of 80% equity stake in Nexelon Chem Private Limited, completed on 5 November 2025. This acquisition strengthens Astral's chemical compound portfolio for specialized applications. Simultaneously, Astral moved to acquire the remaining 20% stake in its subsidiary Astral Coatings (formerly Gem Paints) for Rs. 75 crore, with completion expected by 31 October 2025. This transaction consolidates full control over the coatings business, which generated Rs. 1,960.90 million in turnover during FY 2025. In April 2025, Astral's board also approved the acquisition of Al-Aziz Plastics for up to Rs. 33 crore in cash consideration, further consolidating the plastic piping business.
- Supreme Industries completed its transformational acquisition of Orbia Wavin's pipes and fittings business on 31 July 2025 for USD 30 million (approximately Rs. 250 crore). The acquisition includes three manufacturing facilities in Banmore (Madhya Pradesh), Hyderabad (Telangana), and Neemrana (Rajasthan), adding 71,000-73,000 MT/year of production capacity to Supreme's portfolio. Critically, the transaction includes a long-term technology licensing agreement granting Supreme exclusive access to Orbia Wavin's advanced water management solutions for drinking water, wastewater, and stormwater management across India and SAARC countries for seven years. This acquisition expanded Supreme's total installed piping capacity to 870,000 MT/year as of March 2025, with expectations to reach 1 million MT/year by end of FY 2025-26.
- In its 31 March 2025 annual results announcement, China Lesso unveiled an expanded plastic piping portfolio with strategic product innovation initiatives. The company launched specialized pipes for hydrogen and oil transmission, addressing emerging energy infrastructure needs while maintaining its core position in municipal water supply and residential construction applications. Revenue reached RMB 27.03 billion in 2024, with the plastic piping systems division contributing RMB 22.82 billion (84.4% of total). The company operates 30+ advanced production bases across 19 Chinese provinces and international locations, supported by a distributor network of 2,978 independent dealers. China Lesso's strategic focus has shifted toward accelerating overseas expansion and localization through technology-driven innovation, aiming to diversify revenue streams and leverage smart intelligent manufacturing capabilities to deliver environmentally efficient piping solutions.
Report Coverage:
The research report offers an in-depth analysis based on By Material/Type and By Application/End-Use segments. It details leading market players, providing an overview of their business, product offerings, investments, revenue streams, and key applications. Additionally, the report includes insights into the competitive environment, SWOT analysis, current market trends, as well as the primary drivers and constraints. Furthermore, it discusses various factors that have driven market expansion in recent years. The report also explores market dynamics, regulatory scenarios, and technological advancements that are shaping the industry. It assesses the impact of external factors and global economic changes on market growth. Lastly, it provides strategic recommendations for new entrants and established companies to navigate the complexities of the market.
Future Outlook:
- Infrastructure investment will continue to support steady demand growth
- Urban water management projects will remain a major consumption driver
- Agricultural irrigation systems will sustain volume demand
- Lightweight materials will gain preference in construction projects
- Product innovation will focus on durability and pressure tolerance
- Emerging economies will offer strong expansion opportunities
- Compliance standards will influence material selection decisions
- Local manufacturing will improve supply chain efficiency
- Strategic partnerships will support regional expansion
- Sustainability focus will shape future product development
Request a Free Sample
Fill in your details and we'll send you a free sample report.
- Sample data tables & charts
- Research methodology
Need a Custom Version of This Report?
Tailor the scope, geography, or segments to your exact requirements.
- Custom geography or segment scope
- Direct access to our analyst team
Frequently Asked Questions
What is the current market size for Plastic pipe market, and what is its projected size in 2032?
At what Compound Annual Growth Rate is the Plastic pipe market projected to grow between 2025 and 2032?
Which Plastic pipe market segment held the largest share in 2024?
What are the primary factors fueling the growth of the Plastic pipe market?
Who are the leading companies in the Plastic pipe market?
Which region commanded the largest share of the Plastic pipe market in 2024?
Table of Content
Chapter 1 Market Segmentation
- 1.1 Segmentation Framework
- 1.1.1 Product and Service Classification
- 1.1.2 Application and End-Use Classification
- 1.1.3 Technology and Solution Classification
- 1.1.4 Customer and Distribution Channel Classification
- 1.1.5 Geographic Segmentation
- 1.1.6 Market Segment Definitions and Boundaries
Chapter 2 Introduction
- 2.1 Report Objectives and Scope
- 2.2 Product Definition and Industry Terminology
- 2.3 Market Inclusions and Exclusions
- 2.4 Research Process
- 2.4.1 Primary Research and Expert Interviews
- 2.4.2 Secondary Research and Source Review
- 2.4.3 Top-Down and Bottom-Up Estimation
- 2.4.4 Data Triangulation and Verification
- 2.5 Market Size Measurement Basis
- 2.5.1 2024: USD 60,603 million → 2032: USD 100,675.5 million
- 2.6 Historical and Forecast Reference Periods
- 2.6.1 Base Year: 2024
- 2.6.2 Forecast Period: 2024-2032
- 2.7 Research Assumptions and Limitations
Chapter 3 Executive Summary
- 3.1 Market Snapshot and Key Findings
- 3.2 Base-Year Market Size, 2024
- 3.3 Forecast Market Size, 2032
- 3.4 Revenue and Volume Growth Outlook
- 3.5 Key Demand and Supply Indicators
- 3.6 Leading Market Segments
- 3.7 Fastest-Growing Market Opportunities
- 3.8 Regional Performance Highlights
- 3.9 Technology and Industry Transformation
- 3.10 Competitive Landscape Summary
- 3.11 Analyst View and Strategic Implications
Chapter 4 Global Plastic Pipe Market Trends and Developments
- 4.1 Historical Industry Development
- 4.2 Recent Market Trends and Developments
- 4.3 Demand and Customer Behavior Trends
- 4.4 Technology and Product Innovation
- 4.5 Artificial Intelligence, Automation and Digitalization
- 4.6 Local Manufacturing and Supply Chain Realignment
- 4.7 Industry Partnerships, Mergers and Acquisitions
- 4.8 Sustainability and Circular Economy Developments
- 4.9 Government and Private Sector Investment Trends
- 4.10 Emerging Business Models and Commercialization
- 4.11 Industry Developments and Announcements
Chapter 5 Global Plastic Pipe Market Production, Supply and Demand Analysis
- 5.1 Demand Trend and Consumption Analysis
- 5.2 Demand Forecast, 2024-2032
- 5.3 Production and Output Trend
- 5.4 Production and Output Forecast, 2024-2032
- 5.5 Installed Capacity and Capacity Utilization
- 5.6 Company-Wise Production Plants and Statistics
- 5.6.1 Installed Production Capacity
- 5.6.2 Actual Production
- 5.6.3 Planned Capacity and Expansion Targets
- 5.7 Supply Chain Structure and Procurement Trends
- 5.8 Supply-Demand Gap and Bottlenecks
- 5.9 Import Dependence and Sourcing Structure
- 5.10 Contract Manufacturing and Outsourcing
- 5.11 Regional Supply and Demand Concentration
Chapter 6 Global Plastic Pipe Market Pricing Analysis
- 6.1 Pricing Structure and Measurement
- 6.2 Historical Pricing Trends
- 6.3 Pricing Outlook, 2024-2032
- 6.4 Average Selling Price and Unit Economics
- 6.5 Pricing by Product and Market Segment
- 6.6 Geographic Pricing Differences
- 6.7 Key Input, Energy, Labor and Logistics Costs
- 6.8 Contract Pricing and Purchasing Models
- 6.9 Pricing Sensitivity and Competitive Positioning
- 6.10 Price, Margin and Profitability Implications
Chapter 7 Global Plastic Pipe Market Dynamics
- 7.1 Market Growth Drivers
- 7.1.1 Demand-Side Drivers
- 7.1.2 Technology and Innovation Drivers
- 7.1.3 Infrastructure and Investment Drivers
- 7.1.4 Regulatory and Policy Drivers
- 7.2 Market Restraints
- 7.2.1 Cost and Affordability Constraints
- 7.2.2 Technology and Adoption Barriers
- 7.2.3 Supply Chain and Operational Constraints
- 7.3 Market Challenges
- 7.3.1 Competitive Pressure and Margin Erosion
- 7.3.2 Skills, Infrastructure and Implementation Gaps
- 7.4 Emerging Market Opportunities
- 7.5 Market Dynamics Impact and Time-Horizon Assessment
Chapter 8 Global Plastic Pipe Value Chain Analysis
- 8.1 Industry Value Chain Overview
- 8.2 Upstream Suppliers and Critical Inputs
- 8.3 Technology and Component Providers
- 8.4 Manufacturing or Service Delivery
- 8.5 Distribution, Channel Partners and Integrators
- 8.6 Downstream Applications and End Users
- 8.7 Value Addition and Profit Pools
- 8.8 Vertical Integration and Outsourcing
- 8.9 Supplier Concentration and Risk
- 8.10 Supply Chain Localization and Resilience
Chapter 9 Global Plastic Pipe Market Regulations and Policies
- 9.1 Relevant Laws, Standards and Compliance Frameworks
- 9.2 Product, Service, Safety and Quality Requirements
- 9.3 Government Policies, Incentives and Subsidies
- 9.4 Imports, Exports and Trade Barriers
- 9.5 Public Procurement and Local Content Requirements
- 9.6 Environmental and Sustainability Compliance
- 9.7 Upcoming Policy Changes and Market Implications
Chapter 10 Global Plastic Pipe Market Hotspots and Opportunities
- 10.1 Market Opportunity Mapping and Growth Hotspots
- 10.2 High-Growth Applications and Customer Groups
- 10.3 Underserved Markets and White-Space Opportunities
- 10.4 Emerging Technology and Product Opportunities
- 10.5 New Capacity and Investment Hotspots
- 10.6 Market Entry and Expansion Opportunities
- 10.7 Distribution and Partnership Opportunities
- 10.8 Near-Term and Long-Term Commercial Potential
- 10.9 Opportunity Attractiveness and Execution Risks
Chapter 11 Global Plastic Pipe Market Outlook, 2024-2032
- 11.1 Market Size and Analysis
- 11.1.1 Revenue (Market Measurement: 2024: USD 60,603 million → 2032: USD 100,675.5 million)
- 11.1.2 Market Volume and Quantity Sold
- 11.1.3 Historical Market Size
- 11.1.4 Base-Year Market Size, 2024
- 11.2 Market Forecast, 2024-2032
- 11.2.1 Revenue Forecast to 2032
- 11.2.2 Volume Forecast to 2032
- 11.2.3 CAGR and Year-on-Year Growth
- 11.2.4 Incremental Revenue Opportunity
- 11.3 Forecast Assumptions and Scenario Analysis
- 11.3.1 Base-Case Forecast
- 11.3.2 Optimistic and Conservative Scenarios
- 11.3.3 Technology, Pricing and Policy Sensitivities
- 11.4 Market Attractiveness and Growth Outlook
Chapter 12 Global Plastic Pipe Market Segmentation and Outlook
- 12.1 Segmentation Summary and Market Shares, 2024
- 12.2 Largest and Fastest-Growing Segments
- 12.3 Segment Growth Comparison
- 12.4 Segment Attractiveness and Priority Matrix
Chapter 13 Global Plastic Pipe Geographic Market Outlook, 2024-2032
- 13.1 Regional Market Size and Share, 2024
- 13.2 Regional Market Forecast, 2024-2032
- 13.3 Regional Pricing, Production and Demand Differences
- 13.4 North America
- 13.4.1 United States
- 13.4.2 Canada
- 13.4.3 Mexico
- 13.5 Europe
- 13.5.1 Germany
- 13.5.2 France
- 13.5.3 Italy
- 13.5.4 United Kingdom
- 13.5.5 Spain
- 13.5.6 Poland
- 13.5.7 Russia
- 13.5.8 Netherlands
- 13.5.9 Belgium
- 13.5.10 Sweden
- 13.5.11 Denmark
- 13.5.12 Norway
- 13.5.13 Rest of Europe
- 13.6 Asia Pacific
- 13.6.1 China
- 13.6.2 India
- 13.6.3 Japan
- 13.6.4 South Korea
- 13.6.5 Thailand
- 13.6.6 Indonesia
- 13.6.7 Vietnam
- 13.6.8 Malaysia
- 13.6.9 Australia
- 13.6.10 Rest of Asia Pacific
- 13.7 Latin America
- 13.7.1 Brazil
- 13.7.2 Argentina
- 13.7.3 Colombia
- 13.7.4 Chile
- 13.7.5 Rest of Latin America
- 13.8 Middle East
- 13.8.1 Saudi Arabia
- 13.8.2 United Arab Emirates
- 13.8.3 Turkey
- 13.8.4 Israel
- 13.8.5 Iran
- 13.8.6 Rest of the Middle East
- 13.9 Africa
- 13.9.1 South Africa
- 13.9.2 Egypt
- 13.9.3 Nigeria
- 13.9.4 Morocco
- 13.9.5 Rest of Africa
- 13.10 Regional Investment, Policy and Supply Chain Differences
- 13.11 Regional Competitive Landscape
- 13.12 Geographic Growth Hotspots
Chapter 14 Global Plastic Pipe Technology, Innovation and Sustainability Outlook
- 14.1 Technology Landscape and Maturity
- 14.2 Product, Process and Service Innovation
- 14.3 AI, Automation and Digital Tools in the Industry
- 14.4 Technology Adoption and Performance Benchmarking
- 14.5 Innovation Pipeline and R&D Investment
- 14.6 Patent and Intellectual Property Trends
- 14.7 Energy Efficiency and Resource Management
- 14.8 Sustainability, Recycling and Circularity
- 14.9 Technology Roadmap, 2024-2032
- 14.10 Risks of Obsolescence and Technology Substitution
Chapter 15 Global Plastic Pipe Market Key Strategic Imperatives
- 15.1 Growth and Market Entry Priorities
- 15.2 High-Return Products and Segments
- 15.3 Pricing, Profitability and Cost Optimization
- 15.4 Technology Investment and Product Differentiation
- 15.5 Supply Chain Localization and Resilience
- 15.6 Distribution and Customer Acquisition
- 15.7 Partnership, Acquisition and Capacity Strategy
- 15.8 Regional Expansion Priorities
- 15.9 Short-, Medium- and Long-Term Actions
Chapter 16 Competition Outlook
- 16.1 Industry Competition Characteristics
- 16.2 Market Structure and Concentration
- 16.3 Market Share and Competitive Positioning, 2024
- 16.4 Company-Wise Revenue and Product Benchmarking
- 16.5 Production and Service Capacity Benchmarking
- 16.6 Technology, Pricing and Differentiation
- 16.7 Regional Footprint and Distribution Strength
- 16.8 Mergers, Acquisitions and Strategic Alliances
- 16.9 New Entrants and Competitive Threats
- 16.10 Porter's Five Forces and Industry Attractiveness
- 16.11 Competitive Outlook, 2024-2032
Chapter 17 Company Profiles
- 17.1 Company Coverage and Selection Criteria
- 17.2 Leading Market Participants – Standard Profile Structure
- 17.2.1 Business Description
- 17.2.2 Company Ownership and Geographic Presence
- 17.2.3 Product and Service Portfolio
- 17.2.4 Manufacturing and Operating Footprint
- 17.2.5 Production Capacity and Expansion Plans
- 17.2.6 Financial Performance and Investment
- 17.2.7 Market Share and Competitive Position
- 17.2.8 Technology and Innovation Capabilities
- 17.2.9 Strategic Alliances or Partnerships
- 17.2.10 Recent Developments
- 17.2.11 Growth Strategy and Outlook
- 17.3 Other Relevant Market Participants
Note: Every listed company is profiled on the structure shown under the first company. The company list is preliminary and may change based on research findings, market developments, data availability and client requirements.
Chapter 18 Disclaimer
- 18.1 Research and Forecast Disclaimer
- 18.2 Data Source and Estimation Limitations
Note: The depth of individual sections depends on data availability for this market. Volume, capacity, trade and other unit-based metrics are included where applicable.