
Market Overview
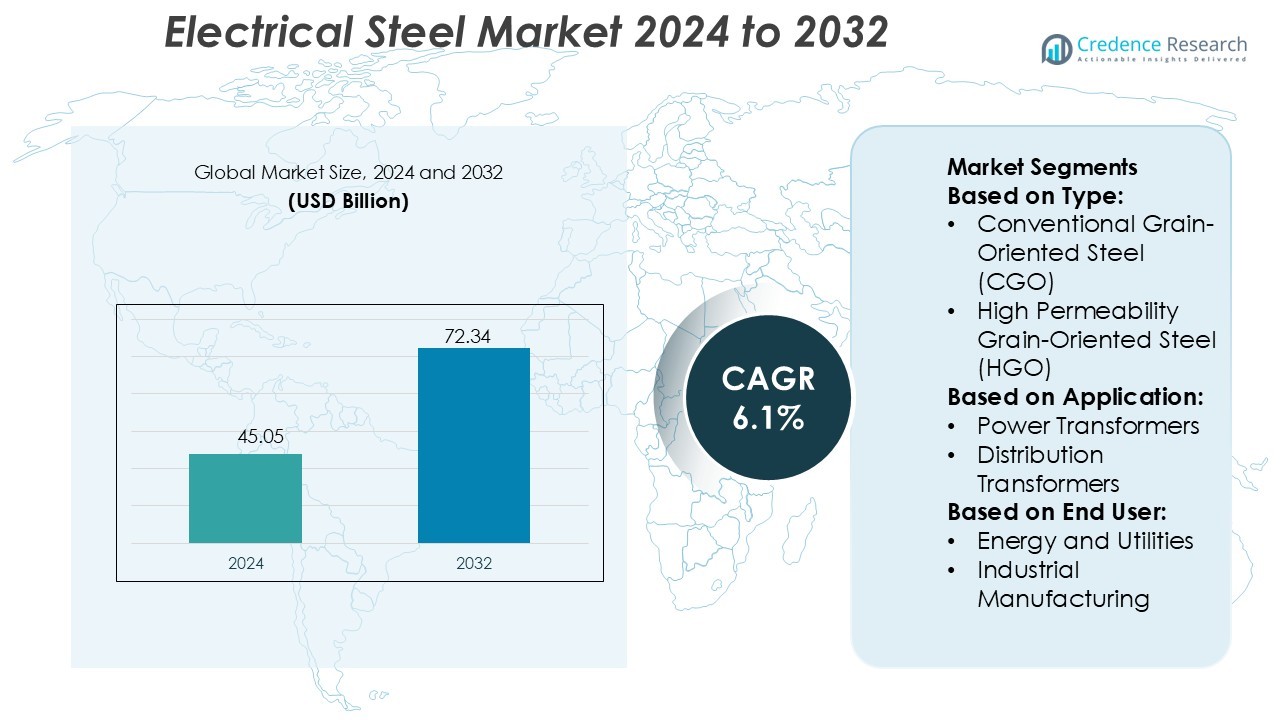
Electrical Steel Market was valued USD 45.05 billion in 2024 and is anticipated to reach USD 72.34 billion by 2032, at a CAGR of 6.1% during the forecast period.
| REPORT ATTRIBUTE | DETAILS |
|---|---|
| Historical Period | 2020-2023 |
| Base Year | 2024 |
| Forecast Period | 2025-2032 |
| Electrical Steel Market Size 2024 | USD 45.05 Billion |
| Electrical Steel Market, CAGR | 6.1% |
| Electrical Steel Market Size 2032 | USD 72.34 Billion |
The electrical steel market is shaped by major producers, including ArcelorMittal, Baosteel Group, Emirates Steel, JFE Steel Corporation, Nippon Steel Corporation, NUCOR, Outokumpu, POSCO, Tata Steel, and Thyssenkrupp. These companies compete through high-grade grain-oriented and non-oriented steel offerings for transformers, generators, and electric motors used in power grids, industries, and electric vehicles. Product innovation focuses on low-loss laminations, improved magnetic permeability, and thin-gauge designs to support energy-efficient equipment. Asia Pacific stands as the leading region with a 45% market share, driven by rapid industrialization, expanding power infrastructure, and large-scale manufacturing of EV motors, transformers, and household appliances. Continuous capacity expansion and technological upgrades strengthen the competitive landscape worldwide.
Market Insights
- The Electrical Steel Market was valued at USD 45.05 billion in 2024 and is anticipated to reach USD 72.34 billion by 2032, growing at a 6.1% CAGR during the forecast period.
- Growth is driven by rising demand for power transformers, generators, and electric motors across industrial, commercial, and renewable energy applications, supported by grid modernization and rapid adoption of electric vehicles.
- Grain-oriented electrical steel holds the dominant segment share due to strong consumption in power transformers and high-efficiency distribution networks, while non-oriented grades expand in motors and automotive applications.
- Competition remains strong as producers focus on thin-gauge designs, low-loss laminations, and high magnetic permeability, while regulatory pressure and fluctuating raw material prices act as market restraints.
- Asia Pacific leads with 45% of global share, driven by large-scale manufacturing, infrastructure development, and strong EV production, followed by Europe and North America with growing investments in energy-efficient equipment and smart grid technologies.
Market Segmentation Analysis:
By Type
Conventional grain-oriented (CGO) steel holds the dominant share of the electrical steel market with nearly 55% in 2024. CGO steel supports stable magnetic flux and reduces iron loss, making it a preferred choice for power transformer cores and high-efficiency voltage regulation. Its lower cost and wide availability also benefit large-scale grid deployment in emerging economies. High-permeability grain-oriented (HGO) steel continues to grow due to superior magnetic permeability and reduced energy loss, which supports advanced power transmission equipment and smart grid upgrades.
- For instance, Thyssenkrupp’s powercore® H 085-23 grade at 0.23 mm thickness achieves a typical core loss of 0.59 W/kg at 50 Hz and 1.5 T, while ensuring a guaranteed polarization of 1.91 T at 800 A/m.
By Application
Power transformers account for close to 48% of the electrical steel market in 2024, establishing the segment as the largest application area. Rising power consumption, renewable energy integration, and transmission line expansions drive the need for high-grade electrical steel in transformer cores. Distribution transformers follow, supported by rapid urbanization and rural electrification programs. Utilities prefer electrical steel due to core stability, high permeability, and improved energy efficiency, especially for long-distance transmission and high-voltage applications.
- For instance, POSCO's "PG-Core" line includes several grades at 0.35 mm thickness, such as 35PG145 or 35PG155. The guaranteed maximum core loss for this grade is indeed 1.55 W/kg (at 50 Hz and 1.5 T, specifically the W15/50 value is 0.98 W/kg typical, but the guaranteed max W17/50 is 1.55 W/kg).
By End-User
Energy and utilities represent the dominant end-user segment with a market share of nearly 52% in 2024. Growing grid modernization, substation capacity expansion, and replacement of aging transformers boost electrical steel demand. Industrial manufacturing also contributes steadily as motors, generators, and HVAC systems require magnetic-efficient steel to reduce power loss and enhance operating efficiency. Electrification of industries and renewable power projects further strengthen this segment, reinforcing electrical steel as a critical material for energy-efficient equipment.
Key Growth Drivers
Rising Demand for Power and Distribution Transformers
Growth in electricity consumption, grid modernization, and renewable energy capacity boosts transformer production. Power and distribution transformers require grain-oriented and non-oriented electrical steel for core efficiency and minimal power loss. Utilities invest in transmission upgrades to reduce line losses and improve reliability. Electrification of rural regions and smart grid expansion also create steady demand. Increased grid-scale solar and wind projects need high-efficiency transformers for stable power flow, strengthening demand across both developed and emerging economies.
- For instance, Boeing’s 702SP all-electric platform uses four 25-cm Xenon Ion Propulsion System (XIPS) thrusters, each having passed a 16,250-hour life test with 14,134 on–off cycles and a total xenon throughput of ~170 kg.
Rapid Industrial Automation and Motor Production
Automation in manufacturing, automotive, and consumer goods sectors drives strong demand for high-performance electric motors. Non-oriented electrical steel is widely used in motors, generators, compressors, and pumps to deliver high magnetic permeability and reduced core loss. Industries adopt energy-efficient motors to meet strict standards and cut operating costs. Expansion of HVAC, robotics, and industrial drives further accelerates steel usage. Growing electric vehicle (EV) motor production also supports demand, as EV motors require thin-gauge, high-grade electrical steel for improved torque and efficiency.
- For instance, Tata Steel subsidiary Cogent Power launched a new cold-rolled grain-oriented grade M080-23DR at its Orb works in Newport, South Wales, which the company reports “reduces electricity losses by 20 % to 30 % compared with conventional grain-oriented grades”.
Boost in Electric Vehicle Adoption and Charging Infrastructure
Global EV adoption continues to rise due to emission policies, battery cost reductions, and government incentives. Electrical steel is essential in traction motors, charging stations, and onboard power conversion systems. Automakers are shifting to higher-grade materials to enhance performance and extend driving range. Charging infrastructure expansion increases production of grid transformers and converters, reinforcing market growth. As EV penetration accelerates across passenger and commercial segments, demand for premium non-oriented electrical steel grades increases.
Key Trends & Opportunities
Shift Toward High-Efficiency Electrical Steel Grades
Manufacturers develop high-permeability, low-loss electrical steel to meet rising efficiency standards. Thin-gauge grades support energy-efficient motors and transformers, enabling lower heat generation and reduced power losses. Demand rises in sectors such as EVs, industrial automation, and renewable energy. Steelmakers invest in coating improvements, advanced rolling techniques, and silicon content optimization. Customers prioritize premium materials that support long service life and regulatory compliance, creating strong growth opportunities in high-yield specialty grades.
- For instance, ORBCOMM's ST 6100 satellite modem is engineered for industrial IoT and maritime connectivity, providing reliable, two-way messaging for tracking and monitoring fixed and mobile assets in remote areas.
Surge in Renewable Energy and Smart Grid Integration
Solar, wind, and hydro projects require transformers, generators, and power converters made from electrical steel. Governments invest in smart grids to enhance stability and integrate varying renewable sources. These systems need high-grade materials to minimize losses and withstand continuous load cycles. Offshore wind farms and utility-scale solar parks further expand demand. Investments in grid digitalization, voltage regulation equipment, and substation upgrades open additional opportunities for steel producers and transformer manufacturers.
- For instance, Nippon Steel’s grain-oriented grade ORIENTCORE HI-B™ achieves a “building factor” of 0.80 W/kg at 1.7 T and 50 Hz in a single-phase 0.30 mm core test, compared to 1.00 W/kg for its earlier CGO grade.
Key Challenges
Volatility in Raw Material Prices and Production Costs
Silicon, iron ore, and energy costs highly influence electrical steel pricing. Market players face margin pressure when raw materials fluctuate, especially during economic disruptions or supply shortages. Production requires advanced technologies like precision rolling, annealing, and coating, increasing operational costs. Manufacturers struggle to balance high-grade quality with competitive pricing, limiting profitability. Sudden demand surges in automotive and power sectors further strain supply, complicating cost forecasting and procurement planning.
High Market Entry Barriers and Technology Complexity
Electrical steel production demands advanced metallurgical expertise, large capital investment, and strict quality control. Few global producers have the capability to supply high-grade, thin-gauge material at scale. New entrants face challenges in developing coating capabilities, reducing core losses, and meeting performance certifications. OEMs prefer established suppliers due to reliability requirements, creating limited room for new players. These barriers slow market expansion and restrict competition, especially in premium product categories.
Regional Analysis
North America
North America commands 26% of the electrical steel market, supported by strong demand from power infrastructure, renewable projects, and electric vehicle development. The U.S. leads the region due to grid modernization, transformer upgrades, and rapid EV manufacturing expansion. Canada follows with rising investments in clean power and industrial electrification. Favorable policies supporting energy efficiency and domestic steel production strengthen supply chains. Manufacturers focus on high-grade electrical steel for motors and transformers with better magnetic performance and lower energy losses. Strong industrial automation and data center growth further contribute to sustained demand across equipment and power applications.
Europe
Europe holds 23% of the market, driven by energy transition programs, industrial electrification, and electric mobility. Germany leads production and consumption of grain-oriented and non-oriented electrical steel for transformers, charging infrastructure, and EV motors. France, the U.K., and Italy invest in smart grids and renewable connection systems, increasing transformer replacements. Strict carbon regulations push steelmakers toward low-emission steel production and recycling initiatives. Growth in railway electrification and industrial automation also supports consumption. Collaborations between automotive OEMs and electrical steel suppliers enhance development of high-efficiency motor laminations, supporting demand in regional automotive hubs.
Asia Pacific
Asia Pacific dominates the global market with a 45% share, led by China, Japan, South Korea, and India. Rapid industrialization, urbanization, and rising electricity consumption drive strong demand for transformers, motors, and power distribution equipment. China is a major producer and consumer, supported by massive grid expansion and EV manufacturing. Japan and South Korea lead in high-grade non-oriented steel for efficient electric motors. India expands renewable power capacity and transmission networks, boosting transformer requirements. Growing production of household appliances, industrial machinery, and vehicles further strengthens regional consumption, making Asia Pacific the fastest-growing market.
Latin America
Latin America holds a 4% share, with demand concentrated in Brazil, Mexico, and Argentina. Grid modernization, renewable energy projects, and rising industrial electrification support market growth. Brazil leads due to transformer manufacturing, hydroelectric power projects, and expanding automotive production. Mexico benefits from industrial exports and rising adoption of efficient motors in manufacturing plants. Government initiatives to reduce energy losses in power networks increase transformer replacements. Local steelmakers partner with global suppliers for advanced magnetic steel grades, improving system efficiency. Despite moderate growth, increasing renewable capacity and industrial investments support long-term demand.
Middle East & Africa
The Middle East & Africa account for 2% of the market, driven by energy infrastructure upgrades, utility capacity expansion, and industrial development. Gulf countries invest in smart grids, solar projects, and high-efficiency transformers to support rising electricity consumption. Saudi Arabia and UAE lead adoption due to manufacturing diversification and power distribution modernization. African markets like South Africa and Egypt focus on reducing transmission losses and increasing electrification rates. Import dependence remains high, and partnerships with global steel manufacturers ensure material availability. Long-term regional demand grows as renewable power installations and industrial projects expand.
Market Segmentations:
By Type:
- Conventional Grain-Oriented Steel (CGO)
- High Permeability Grain-Oriented Steel (HGO)
By Application:
- Power Transformers
- Distribution Transformers
By End User:
- Energy and Utilities
- Industrial Manufacturing
By Geography
- North America
- U.S.
- Canada
- Mexico
- Europe
- Germany
- France
- U.K.
- Italy
- Spain
- Rest of Europe
- Asia Pacific
- China
- Japan
- India
- South Korea
- South-east Asia
- Rest of Asia Pacific
- Latin America
- Brazil
- Argentina
- Rest of Latin America
- Middle East & Africa
- GCC Countries
- South Africa
- Rest of the Middle East and Africa
Competitive Landscape
The competitive landscape of the electrical steel market includes Thyssenkrupp, POSCO, NUCOR, JFE Steel Corporation, Tata Steel, Outokumpu, Baosteel Group, Nippon Steel Corporation, Emirates Steel, and ArcelorMittal. The electrical steel market shows strong competition, shaped by capacity expansions, technological upgrades, and product innovation. Manufacturers focus on high-grade grain-oriented and non-oriented steel to support power transformers, motors, generators, and electric vehicle components. Companies compete by improving magnetic permeability, reducing core losses, and designing thin-gauge laminations that enhance efficiency in rotating and static machines. Sustainability strategies such as low-carbon steelmaking, recycling programs, and energy-efficient smelting processes strengthen market positioning. Strategic mergers, long-term supply agreements with transformer and motor producers, and investments in automation and digital quality control help maintain production accuracy and cost competitiveness. Asia leads in large-scale manufacturing and export capacity, while Europe focuses on premium, energy-efficient grades aligned with environmental standards. The rise of renewable power, electric mobility, and grid modernization increases demand for customized electrical steel products, pushing manufacturers to expand geographically, develop localized facilities, and enhance material performance for high-efficiency electrical systems.
Key Player Analysis
- Thyssenkrupp
- POSCO
- NUCOR
- JFE Steel Corporation
- Tata Steel
- Outokumpu
- Baosteel Group
- Nippon Steel Corporation
- Emirates Steel
- ArcelorMittal
Recent Developments
- In February 2025, ArcelorMittal announced its plans to establish an advanced manufacturing facility for non-grain-oriented electrical steel (NOES) in Alabama. This facility, entirely owned by ArcelorMittal, aims to produce up to 150,000 metric tons of NOES annually.
- In January 2025, the Steel Authority of India Limited (SAIL) and John Cockerill India (JCIL) announced plans to establish a downstream plant for producing of cold-rolled grain-oriented (CRGO) and non-oriented (CRNO) electrical steel.
- In October 2024, JSW Group has signed a MoU with POSCO Group of Korea to develop an integrated steel plant in India, aiming an capacity of 5 million tonnes/annum initially. This partnership aims to improve India's steel production capabilities while also exploring opportunities in battery materials and renewable energy sectors, particularly for electric vehicles.
- In October 2024, JFE Steel Corporation, in collaboration with JSW Steel Limited, announced the acquisition of thyssenkrupp Electrical Steel India Private Limited, a key manufacturer of electrical steel sheets located in Nashik, Maharashtra.
Report Coverage
The research report offers an in-depth analysis based on Type, Application, End-User and Geography. It details leading market players, providing an overview of their business, product offerings, investments, revenue streams, and key applications. Additionally, the report includes insights into the competitive environment, SWOT analysis, current market trends, as well as the primary drivers and constraints. Furthermore, it discusses various factors that have driven market expansion in recent years. The report also explores market dynamics, regulatory scenarios, and technological advancements that are shaping the industry. It assesses the impact of external factors and global economic changes on market growth. Lastly, it provides strategic recommendations for new entrants and established companies to navigate the complexities of the market.
Future Outlook
- Demand will rise due to rapid expansion of power transmission and distribution networks.
- Electric vehicle manufacturing will increase consumption of high-grade non-oriented electrical steel.
- Renewable energy projects will drive need for transformers, generators, and advanced magnetic materials.
- Manufacturers will invest in thin-gauge steel and low-loss laminations to improve motor efficiency.
- Recycling and low-carbon steelmaking will gain importance in meeting sustainability goals.
- Automation and digital quality control will enhance production accuracy and material consistency.
- Partnerships between steelmakers and EV or transformer companies will strengthen long-term supply chains.
- Asia Pacific will continue to dominate due to industrial expansion and strong domestic manufacturing.
- Smart grid deployment and electrification of industries will boost demand for grain-oriented grades.
- High-efficiency home appliances and industrial machinery will increase consumption across global markets.
Request a Free Sample
Fill in your details and we'll send you a free sample report.
- Sample data tables & charts
- Research methodology
Need a Custom Version of This Report?
Tailor the scope, geography, or segments to your exact requirements.
- Custom geography or segment scope
- Direct access to our analyst team
Frequently Asked Questions
What is the current market size for the Edible Offal Market, and what is its projected size in 2032?
At what Compound Annual Growth Rate is the Edible Offal Market projected to grow between 2025 and 2032?
Which Edible Offal Market segment held the largest share in 2024?
What are the primary factors fueling the growth of the Edible Offal Market?
Who are the leading companies in the Edible Offal Market?
Which region commanded the largest share of the Edible Offal Market in 2024?
Table of Content
Chapter 1 Market Segmentation
- 1.1 Segmentation Framework
- 1.1.1 Product and Service Classification
- 1.1.2 Application and End-Use Classification
- 1.1.3 Technology and Solution Classification
- 1.1.4 Customer and Distribution Channel Classification
- 1.1.5 Geographic Segmentation
- 1.1.6 Market Segment Definitions and Boundaries
Chapter 2 Introduction
- 2.1 Report Objectives and Scope
- 2.2 Product Definition and Industry Terminology
- 2.3 Market Inclusions and Exclusions
- 2.4 Research Process
- 2.4.1 Primary Research and Expert Interviews
- 2.4.2 Secondary Research and Source Review
- 2.4.3 Top-Down and Bottom-Up Estimation
- 2.4.4 Data Triangulation and Verification
- 2.5 Market Size Measurement Basis
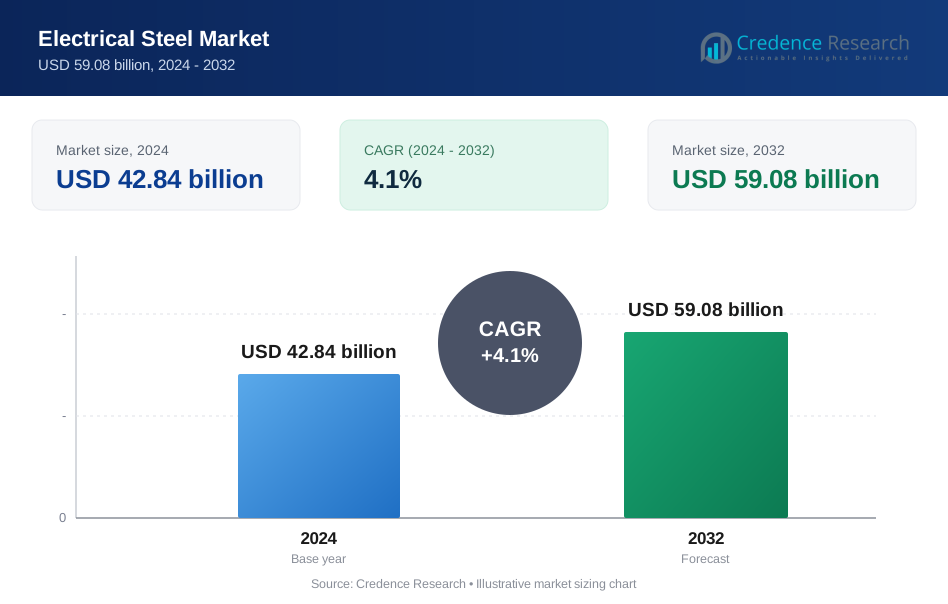
- 2.5.1 2024: USD 42.84 billion → 2032: USD 59.08 billion
- 2.6 Historical and Forecast Reference Periods
- 2.6.1 Base Year: 2024
- 2.6.2 Forecast Period: 2024-2032
- 2.7 Research Assumptions and Limitations
Chapter 3 Executive Summary
- 3.1 Market Snapshot and Key Findings
- 3.2 Base-Year Market Size, 2024
- 3.3 Forecast Market Size, 2032
- 3.4 Revenue and Volume Growth Outlook
- 3.5 Key Demand and Supply Indicators
- 3.6 Leading Market Segments
- 3.7 Fastest-Growing Market Opportunities
- 3.8 Regional Performance Highlights
- 3.9 Technology and Industry Transformation
- 3.10 Competitive Landscape Summary
- 3.11 Analyst View and Strategic Implications
Chapter 4 Global Electrical Steel Market Trends and Developments
- 4.1 Historical Industry Development
- 4.2 Recent Market Trends and Developments
- 4.3 Demand and Customer Behavior Trends
- 4.4 Technology and Product Innovation
- 4.5 Artificial Intelligence, Automation and Digitalization
- 4.6 Local Manufacturing and Supply Chain Realignment
- 4.7 Industry Partnerships, Mergers and Acquisitions
- 4.8 Sustainability and Circular Economy Developments
- 4.9 Government and Private Sector Investment Trends
- 4.10 Emerging Business Models and Commercialization
- 4.11 Industry Developments and Announcements
Chapter 5 Global Electrical Steel Market Production, Supply and Demand Analysis
- 5.1 Demand Trend and Consumption Analysis
- 5.2 Demand Forecast, 2024-2032
- 5.3 Production and Output Trend
- 5.4 Production and Output Forecast, 2024-2032
- 5.5 Installed Capacity and Capacity Utilization
- 5.6 Company-Wise Production Plants and Statistics
- 5.6.1 Installed Production Capacity
- 5.6.2 Actual Production
- 5.6.3 Planned Capacity and Expansion Targets
- 5.7 Supply Chain Structure and Procurement Trends
- 5.8 Supply-Demand Gap and Bottlenecks
- 5.9 Import Dependence and Sourcing Structure
- 5.10 Contract Manufacturing and Outsourcing
- 5.11 Regional Supply and Demand Concentration
Chapter 6 Global Electrical Steel Market Pricing Analysis
- 6.1 Pricing Structure and Measurement
- 6.2 Historical Pricing Trends
- 6.3 Pricing Outlook, 2024-2032
- 6.4 Average Selling Price and Unit Economics
- 6.5 Pricing by Product and Market Segment
- 6.6 Geographic Pricing Differences
- 6.7 Key Input, Energy, Labor and Logistics Costs
- 6.8 Contract Pricing and Purchasing Models
- 6.9 Pricing Sensitivity and Competitive Positioning
- 6.10 Price, Margin and Profitability Implications
Chapter 7 Global Electrical Steel Market Dynamics
- 7.1 Market Growth Drivers
- 7.1.1 Demand-Side Drivers
- 7.1.2 Technology and Innovation Drivers
- 7.1.3 Infrastructure and Investment Drivers
- 7.1.4 Regulatory and Policy Drivers
- 7.2 Market Restraints
- 7.2.1 Cost and Affordability Constraints
- 7.2.2 Technology and Adoption Barriers
- 7.2.3 Supply Chain and Operational Constraints
- 7.3 Market Challenges
- 7.3.1 Competitive Pressure and Margin Erosion
- 7.3.2 Skills, Infrastructure and Implementation Gaps
- 7.4 Emerging Market Opportunities
- 7.5 Market Dynamics Impact and Time-Horizon Assessment
Chapter 8 Global Electrical Steel Value Chain Analysis
- 8.1 Industry Value Chain Overview
- 8.2 Upstream Suppliers and Critical Inputs
- 8.3 Technology and Component Providers
- 8.4 Manufacturing or Service Delivery
- 8.5 Distribution, Channel Partners and Integrators
- 8.6 Downstream Applications and End Users
- 8.7 Value Addition and Profit Pools
- 8.8 Vertical Integration and Outsourcing
- 8.9 Supplier Concentration and Risk
- 8.10 Supply Chain Localization and Resilience
Chapter 9 Global Electrical Steel Market Regulations and Policies
- 9.1 Relevant Laws, Standards and Compliance Frameworks
- 9.2 Product, Service, Safety and Quality Requirements
- 9.3 Government Policies, Incentives and Subsidies
- 9.4 Imports, Exports and Trade Barriers
- 9.5 Public Procurement and Local Content Requirements
- 9.6 Environmental and Sustainability Compliance
- 9.7 Upcoming Policy Changes and Market Implications
Chapter 10 Global Electrical Steel Market Hotspots and Opportunities
- 10.1 Market Opportunity Mapping and Growth Hotspots
- 10.2 High-Growth Applications and Customer Groups
- 10.3 Underserved Markets and White-Space Opportunities
- 10.4 Emerging Technology and Product Opportunities
- 10.5 New Capacity and Investment Hotspots
- 10.6 Market Entry and Expansion Opportunities
- 10.7 Distribution and Partnership Opportunities
- 10.8 Near-Term and Long-Term Commercial Potential
- 10.9 Opportunity Attractiveness and Execution Risks
Chapter 11 Global Electrical Steel Market Outlook, 2024-2032
- 11.1 Market Size and Analysis
- 11.1.1 Revenue (Market Measurement: 2024: USD 42.84 billion → 2032: USD 59.08 billion)
- 11.1.2 Market Volume and Quantity Sold
- 11.1.3 Historical Market Size
- 11.1.4 Base-Year Market Size, 2024
- 11.2 Market Forecast, 2024-2032
- 11.2.1 Revenue Forecast to 2032
- 11.2.2 Volume Forecast to 2032
- 11.2.3 CAGR and Year-on-Year Growth
- 11.2.4 Incremental Revenue Opportunity
- 11.3 Forecast Assumptions and Scenario Analysis
- 11.3.1 Base-Case Forecast
- 11.3.2 Optimistic and Conservative Scenarios
- 11.3.3 Technology, Pricing and Policy Sensitivities
- 11.4 Market Attractiveness and Growth Outlook
Chapter 12 Global Electrical Steel Market Segmentation and Outlook
- 12.1 Segmentation Summary and Market Shares, 2024
- 12.2 Largest and Fastest-Growing Segments
- 12.3 Segment Growth Comparison
- 12.4 Segment Attractiveness and Priority Matrix
Chapter 13 Global Electrical Steel Geographic Market Outlook, 2024-2032
- 13.1 Regional Market Size and Share, 2024
- 13.2 Regional Market Forecast, 2024-2032
- 13.3 Regional Pricing, Production and Demand Differences
- 13.4 North America
- 13.4.1 United States
- 13.4.2 Canada
- 13.4.3 Mexico
- 13.5 Europe
- 13.5.1 Germany
- 13.5.2 France
- 13.5.3 Italy
- 13.5.4 United Kingdom
- 13.5.5 Spain
- 13.5.6 Poland
- 13.5.7 Russia
- 13.5.8 Netherlands
- 13.5.9 Belgium
- 13.5.10 Sweden
- 13.5.11 Denmark
- 13.5.12 Norway
- 13.5.13 Rest of Europe
- 13.6 Asia Pacific
- 13.6.1 China
- 13.6.2 India
- 13.6.3 Japan
- 13.6.4 South Korea
- 13.6.5 Thailand
- 13.6.6 Indonesia
- 13.6.7 Vietnam
- 13.6.8 Malaysia
- 13.6.9 Australia
- 13.6.10 Rest of Asia Pacific
- 13.7 Latin America
- 13.7.1 Brazil
- 13.7.2 Argentina
- 13.7.3 Colombia
- 13.7.4 Chile
- 13.7.5 Rest of Latin America
- 13.8 Middle East
- 13.8.1 Saudi Arabia
- 13.8.2 United Arab Emirates
- 13.8.3 Turkey
- 13.8.4 Israel
- 13.8.5 Iran
- 13.8.6 Rest of the Middle East
- 13.9 Africa
- 13.9.1 South Africa
- 13.9.2 Egypt
- 13.9.3 Nigeria
- 13.9.4 Morocco
- 13.9.5 Rest of Africa
- 13.10 Regional Investment, Policy and Supply Chain Differences
- 13.11 Regional Competitive Landscape
- 13.12 Geographic Growth Hotspots
Chapter 14 Global Electrical Steel Technology, Innovation and Sustainability Outlook
- 14.1 Technology Landscape and Maturity
- 14.2 Product, Process and Service Innovation
- 14.3 AI, Automation and Digital Tools in the Industry
- 14.4 Technology Adoption and Performance Benchmarking
- 14.5 Innovation Pipeline and R&D Investment
- 14.6 Patent and Intellectual Property Trends
- 14.7 Energy Efficiency and Resource Management
- 14.8 Sustainability, Recycling and Circularity
- 14.9 Technology Roadmap, 2024-2032
- 14.10 Risks of Obsolescence and Technology Substitution
Chapter 15 Global Electrical Steel Market Key Strategic Imperatives
- 15.1 Growth and Market Entry Priorities
- 15.2 High-Return Products and Segments
- 15.3 Pricing, Profitability and Cost Optimization
- 15.4 Technology Investment and Product Differentiation
- 15.5 Supply Chain Localization and Resilience
- 15.6 Distribution and Customer Acquisition
- 15.7 Partnership, Acquisition and Capacity Strategy
- 15.8 Regional Expansion Priorities
- 15.9 Short-, Medium- and Long-Term Actions
Chapter 16 Competition Outlook
- 16.1 Industry Competition Characteristics
- 16.2 Market Structure and Concentration
- 16.3 Market Share and Competitive Positioning, 2024
- 16.4 Company-Wise Revenue and Product Benchmarking
- 16.5 Production and Service Capacity Benchmarking
- 16.6 Technology, Pricing and Differentiation
- 16.7 Regional Footprint and Distribution Strength
- 16.8 Mergers, Acquisitions and Strategic Alliances
- 16.9 New Entrants and Competitive Threats
- 16.10 Porter's Five Forces and Industry Attractiveness
- 16.11 Competitive Outlook, 2024-2032
Chapter 17 Company Profiles
- 17.1 Company Coverage and Selection Criteria
- 17.2 Leading Market Participants – Standard Profile Structure
- 17.2.1 Business Description
- 17.2.2 Company Ownership and Geographic Presence
- 17.2.3 Product and Service Portfolio
- 17.2.4 Manufacturing and Operating Footprint
- 17.2.5 Production Capacity and Expansion Plans
- 17.2.6 Financial Performance and Investment
- 17.2.7 Market Share and Competitive Position
- 17.2.8 Technology and Innovation Capabilities
- 17.2.9 Strategic Alliances or Partnerships
- 17.2.10 Recent Developments
- 17.2.11 Growth Strategy and Outlook
- 17.3 Other Relevant Market Participants
Note: Every listed company is profiled on the structure shown under the first company. The company list is preliminary and may change based on research findings, market developments, data availability and client requirements.
Chapter 18 Disclaimer
- 18.1 Research and Forecast Disclaimer
- 18.2 Data Source and Estimation Limitations
Note: The depth of individual sections depends on data availability for this market. Volume, capacity, trade and other unit-based metrics are included where applicable.

