
Market Overview
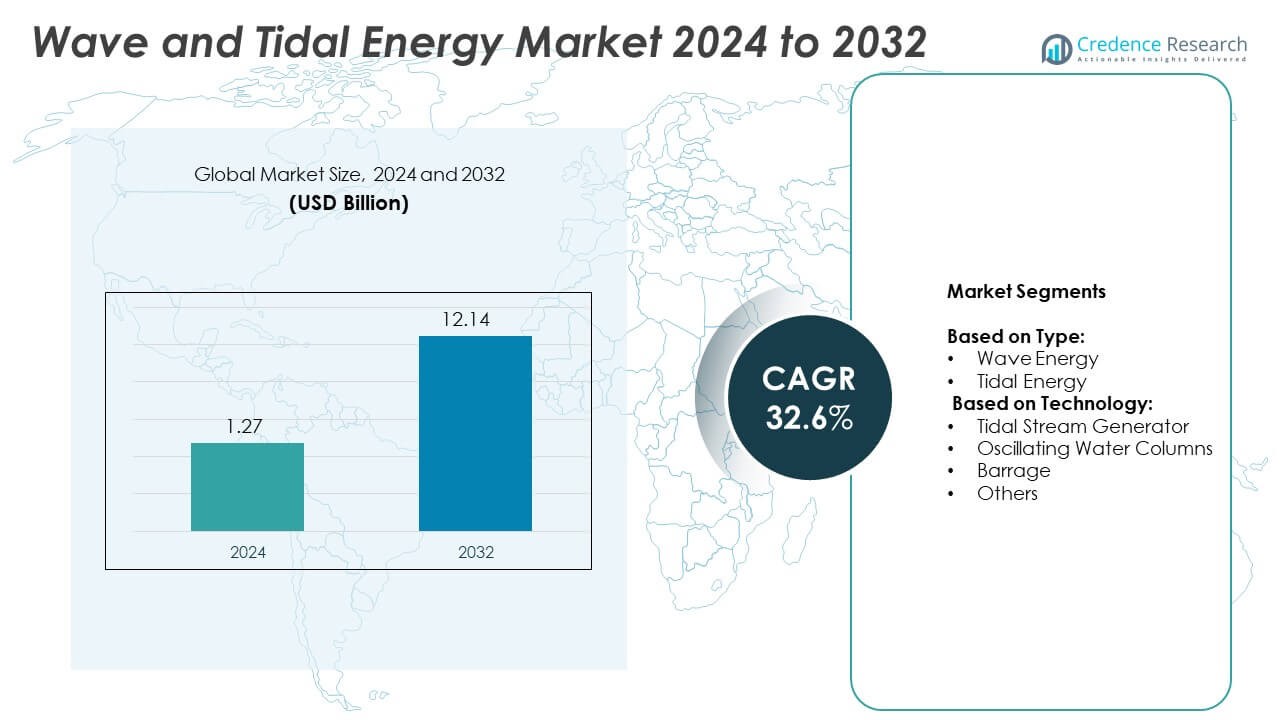
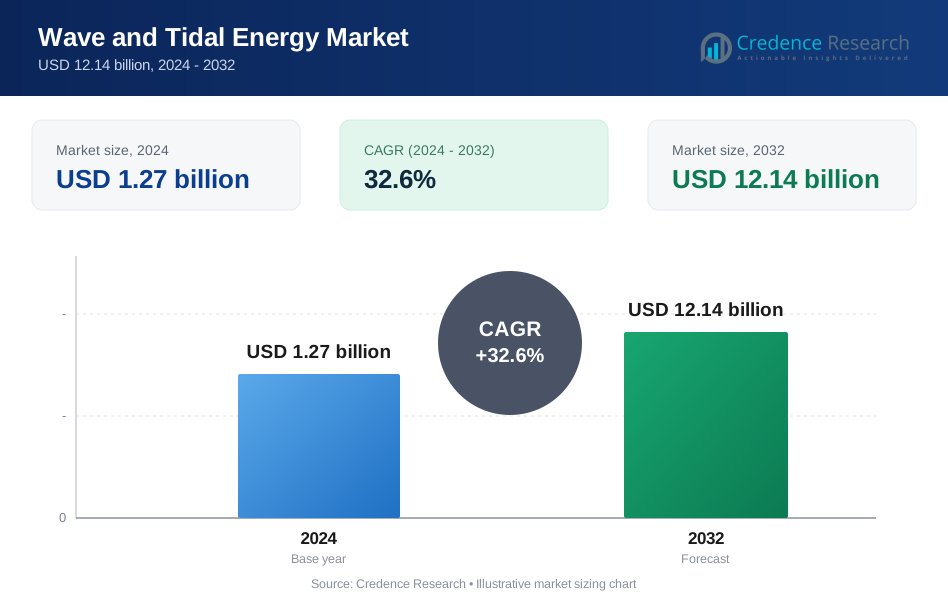
Wave and Tidal Energy Market size was valued at USD 1.27 billion in 2024 and is anticipated to reach USD 12.14 billion by 2032, at a CAGR of 32.6% during the forecast period.
| REPORT ATTRIBUTE | DETAILS |
|---|---|
| Historical Period | 2020-2023 |
| Base Year | 2024 |
| Forecast Period | 2025-2032 |
| Wave and Tidal Energy Market Size 2024 | USD 1.27 Billion |
| Wave and Tidal Energy Market, CAGR | 32.6% |
| Wave and Tidal Energy Market Size 2032 | USD 12.14 Billion |
The Wave and Tidal Energy market grows through strong government support, increasing energy demand, and rising focus on clean base-load power. Technological advancements in tidal stream generators, floating platforms, and smart monitoring systems improve efficiency and reduce lifecycle costs. Hybrid renewable systems and offshore grid integration create new deployment opportunities. Coastal and island regions seek stable, low-carbon power sources, driving adoption. Public-private partnerships and global climate targets further accelerate marine energy innovation and commercialization across key markets.
Europe leads the Wave and Tidal Energy market due to strong policy support, advanced testing infrastructure, and high deployment activity. North America follows with major projects in the U.S. and Canada, backed by federal funding and coastal potential. Asia-Pacific shows rising interest, driven by developments in South Korea, China, and Australia. Latin America and the Middle East & Africa remain in early stages but hold long-term promise. Key players include Ocean Power Technologies, ORPC, Inc., ANDRITZ, and Carnegie Clean Energy.
Market Insights
- The Wave and Tidal Energy market was valued at USD 1.27 billion in 2024 and is expected to reach USD 12.14 billion by 2032, growing at a CAGR of 32.6%.
- Government incentives, funding programs, and renewable energy mandates drive strong demand for marine-based power sources.
- Developers focus on modular, scalable designs and hybrid renewable integration to reduce costs and expand application areas.
- Key players such as Ocean Power Technologies, ORPC, ANDRITZ, and Carnegie Clean Energy lead the market with strong project pipelines and global presence.
- High capital costs, technical complexity, and marine environmental challenges limit commercial-scale adoption in new regions.
- Europe leads global adoption due to advanced test sites, favorable policy frameworks, and long coastlines, while North America and Asia-Pacific show strong growth potential.
- Emerging economies and island nations present long-term opportunities for off-grid deployment and energy diversification.
Market Drivers
Government Support and Regulatory Push for Renewable Energy Integration
Governments across developed and emerging economies strongly support ocean energy to meet climate goals. Policy incentives, feed-in tariffs, and renewable portfolio standards drive investment in marine technologies. The European Union’s Blue Energy Strategy and Canada’s Marine Renewable Energy Technology Roadmap highlight focused public sector involvement. The Wave and Tidal Energy market benefits from regulatory approvals that streamline pilot and commercial-scale project deployment. Clear frameworks lower investor risk and reduce permitting delays. It continues to gain from subsidies and grants aimed at decarbonizing coastal and island regions. Public funding accelerates technology adoption and infrastructure buildout.
- For instance, the Mutriku Breakwater Wave Plant in Spain operates 16 turbine generator units with a total capacity of 296 kW, and by the end of 2023 it achieved over 3 GWh of lifetime electricity generation
Technological Advances in Energy Conversion and Project Viability
Innovations in turbine design, mooring systems, and energy storage enhance system efficiency and reduce costs. Advancements in oscillating water columns, point absorbers, and tidal barrages increase energy output across variable sea states. The Wave and Tidal Energy market sees benefits from R&D in corrosion-resistant materials and remote monitoring tools. These developments improve device longevity and reduce maintenance expenses. It gains from digital twin modeling and AI-driven system optimization that support predictive maintenance. Standardization of components and modular designs enable scalability and ease of deployment.
- For instance, the European Marine Energy Centre (EMEC) has hosted over 35 marine energy devices from clients across more than 11 countries at its Orkney facilities since its establishment in 2003, underscoring its long-standing role in testing real-sea technologies.
Rising Demand for Predictable and Clean Base Load Power
Ocean energy offers a highly predictable, low-carbon power source, critical for grid stability. Tidal cycles and wave patterns are more consistent than solar or wind, enhancing reliability. The Wave and Tidal Energy market meets growing demand for clean base load power in coastal cities and islands. It helps reduce fossil fuel dependence in remote or off-grid areas with limited transmission capacity. Energy planners value its complementarity with solar and wind in diversified renewable portfolios. Utilities explore hybrid systems that integrate marine sources with battery storage for round-the-clock supply.
Environmental Sustainability and Public Pressure for Low-Impact Solutions
Marine energy projects emit no greenhouse gases or air pollutants during operation. Environmental groups and coastal communities increasingly favor low-impact energy systems. The Wave and Tidal Energy market benefits from its minimal land footprint and low visual disruption. It supports national commitments to marine biodiversity protection and sustainable ocean use. Developers adopt environmental impact mitigation tools such as fish-friendly turbines and adaptive monitoring. It aligns with global efforts to balance energy security with ecosystem preservation.
Market Trends
Shift Toward Hybrid Renewable Energy Systems in Coastal Grids
Utilities and governments increasingly invest in hybrid systems that combine wave, tidal, wind, and solar energy. These integrated setups enhance power reliability and stabilize supply in coastal and island regions. The Wave and Tidal Energy market aligns with this trend by enabling complementary generation patterns across marine and atmospheric sources. It supports round-the-clock renewable output, especially when wind or solar availability is low. Developers deploy hybrid microgrids to reduce diesel use in remote communities. These systems also offer resilience against extreme weather-related grid disruptions.
- For instance, NoviOcean unveiled a full‑scale raft prototype combining wave, wind, and solar power—equipped with six vertical wind turbines and solar panels—capable of generating 1 MW with a 40 %capacity factor, and an estimated ability to power 1,000 homes per day.
Growing Emphasis on Modular and Scalable Device Designs
Marine energy developers focus on compact, modular technologies to streamline installation and maintenance. Scalable designs allow operators to start small and expand capacity in phases. The Wave and Tidal Energy market benefits from these advancements by lowering upfront costs and improving deployment flexibility. It enables customization based on site-specific wave heights, tidal range, and seabed conditions. Manufacturers adopt prefabrication methods and standardized parts to speed up timelines. Floating platforms and plug-and-play systems gain traction for shallow and deep-sea applications.
- For instance, Orbital Marine Power deployed its O2 floating tidal turbine—a 74‑meter long device commissioned in 2021—which can supply enough clean, predictable power for approximately 2,000 UK homes and is part of a scalable rollout that includes six next‑generation O2‑X turbines planned for deployment.
Expansion of Public-Private Demonstration and Pilot Projects
Partnerships between governments, research institutes, and private firms increase the number of ocean energy pilot deployments. These demonstration projects validate system performance under real-world conditions. The Wave and Tidal Energy market sees stronger traction through initiatives backed by European Marine Energy Centre, ORPC, and SIMEC Atlantis. It gains visibility through publicly funded installations that showcase long-term viability. Lessons learned from pilots support commercial-scale designs and accelerate regulatory approvals. These projects often include community engagement to build public trust and local support.
Integration of Digital Monitoring and Predictive Maintenance Tools
Operators adopt smart sensors, IoT platforms, and AI algorithms to track device health and ocean conditions. These technologies improve uptime and reduce maintenance-related downtime. The Wave and Tidal Energy market uses digital systems to predict failures and optimize performance. It benefits from reduced operational costs and enhanced asset lifespan. Remote monitoring platforms enable real-time data access for performance validation and environmental compliance. Companies integrate machine learning to improve energy forecasting and site optimization.
Market Challenges Analysis
High Capital Costs and Limited Commercial Viability of Early Projects
Wave and tidal technologies often face high upfront costs related to engineering, deployment, and infrastructure. Many systems require custom-built platforms, subsea cabling, and grid interconnections that drive capital intensity. The Wave and Tidal Energy market faces delays in scaling due to financing constraints and uncertain payback periods. It struggles to match the cost-competitiveness of more mature renewables like wind and solar. Limited access to project finance and insurance coverage further reduces investor confidence. Developers must demonstrate sustained power output and low maintenance costs to unlock wider funding opportunities.
Technical Complexity and Harsh Marine Operating Conditions
Devices deployed in coastal or deep-sea environments must endure strong currents, corrosion, and biofouling. These factors create engineering challenges and raise long-term operational costs. The Wave and Tidal Energy market must overcome frequent breakdowns and maintenance delays that impact availability. It requires robust materials, reliable mooring, and adaptive control systems to maintain performance. Lack of standardized designs increases the time and cost for testing and certification. Companies need to balance innovation with durability to ensure long-term reliability and safety.
Market Opportunities
Untapped Coastal Resources and Rising Demand from Island Nations
Many countries with long coastlines and strong tidal currents possess significant untapped marine energy potential. Island nations and remote coastal regions seek stable, off-grid renewable sources to reduce fuel imports. The Wave and Tidal Energy market can meet these needs by offering predictable, site-specific power generation. It supports energy independence and climate goals in places with limited grid connectivity. Governments in Southeast Asia, the Caribbean, and the Pacific Islands explore feasibility studies and pilot installations. Expanding access to clean power in these locations creates long-term market growth opportunities.
Expansion into Industrial and Desalination Applications
Marine energy offers potential beyond electricity generation for residential grids. Industrial users, ports, and desalination plants require continuous, reliable energy in coastal areas. The Wave and Tidal Energy market can serve these sectors by supporting operations where grid stability is critical. It aligns with energy-intensive activities that demand localized and low-carbon solutions. Developers explore direct power-to-desalination and port electrification models to open new revenue streams. Targeting industrial use cases strengthens the case for commercial deployment and diversifies demand.
Market Segmentation Analysis:
By Type:
The market is segmented into Wave Energy and Tidal Energy, each offering unique benefits. Tidal Energy leads in commercial deployment due to its high predictability and mature technologies. It relies on gravitational forces, making energy generation consistent and easier to forecast. The Wave and Tidal Energy market sees strong interest in Wave Energy, driven by innovation in point absorbers and oscillating devices. Wave energy holds high potential due to its global availability and higher energy density. However, it remains in the demonstration phase in many regions due to higher technical and environmental risks. Investors continue to support tidal projects for near-term returns, while wave energy attracts long-term R&D funding.
- For instance, SeaGen, installed in Northern Ireland in 2008, achieved 1.2 MW capacity and exported 11.6 GWh of electricity before its decommissioning in 2019
By Technology:
The market is categorized into Tidal Stream Generator, Oscillating Water Columns, Barrage, and Others. Tidal Stream Generators dominate the segment due to their flexible design and lower environmental footprint. These systems operate like underwater wind turbines and harness kinetic energy from fast-moving tidal currents. The Wave and Tidal Energy market benefits from wider adoption of this technology in Europe and parts of North America. Oscillating Water Columns follow closely, especially in wave-focused projects. These systems convert air pressure changes caused by wave movement into mechanical energy. Barrage Systems, although efficient, face ecological concerns and high installation costs. They involve dam-like structures that restrict tidal flow, raising issues related to marine life disruption. The “Others” segment includes emerging technologies such as Archimedes screws, rotary engines, and hybrid converters that aim to improve energy capture in shallow or deep waters. Developers continue testing these newer models to identify site-specific performance advantages.
- For instance, the Mutriku Breakwater Wave Plant in Spain uses 16 Wells turbines, each rated at 18.5 kW, producing a collective capacity of 296 kW
Segments:
Based on Type:
- Wave Energy
- Tidal Energy
Based on Technology:
- Tidal Stream Generator
- Oscillating Water Columns
- Barrage
- Others
Based on the Geography:
- North America
- U.S.
- Canada
- Mexico
- Europe
- UK
- France
- Germany
- Italy
- Spain
- Russia
- Belgium
- Netherlands
- Austria
- Sweden
- Poland
- Denmark
- Switzerland
- Rest of Europe
- Asia Pacific
- China
- Japan
- South Korea
- India
- Australia
- Thailand
- Indonesia
- Vietnam
- Malaysia
- Philippines
- Taiwan
- Rest of Asia Pacific
- Latin America
- Brazil
- Argentina
- Peru
- Chile
- Colombia
- Rest of Latin America
- Middle East
- UAE
- KSA
- Israel
- Turkey
- Iran
- Rest of Middle East
- Africa
- Egypt
- Nigeria
- Algeria
- Morocco
- Rest of Africa
Regional Analysis
North America
North America accounted for over 34% of the global wave and tidal energy market in 2024. The region holds a strong position due to government-backed marine energy programs and active pilot installations across the United States and Canada. The U.S. Department of Energy funds several initiatives under its Water Power Technologies Office, promoting device testing and environmental research. Canada’s strategic support for tidal projects in Nova Scotia, especially through the Fundy Ocean Research Center for Energy (FORCE), boosts regional technology deployment. The Bay of Fundy offers one of the world’s strongest tidal currents, creating favorable conditions for high-capacity generation. North America’s extensive coastlines and robust grid infrastructure enable efficient integration of marine power. It maintains leadership in tidal stream generator deployments and supports ongoing research in wave energy devices through collaborations with academic and industry groups.
Europe
Europe held approximately 41% share of the wave and tidal energy market in 2024, making it the global leader. Countries including the United Kingdom, France, Portugal, and Norway actively pursue commercial and demonstration-scale projects. The UK’s commitment to marine renewables through the Contracts for Difference (CfD) scheme encourages tidal stream developers to scale operations. France and Ireland invest in wave energy technology through Horizon Europe and national energy programs. Europe hosts the European Marine Energy Centre (EMEC) in Scotland, the leading open-sea testing facility for wave and tidal prototypes. Strong coastal grid connectivity and a supportive policy framework give Europe a competitive edge. The region continues to dominate both tidal and wave segments by funding infrastructure development and offering feed-in tariffs for marine-based electricity.
Asia-Pacific
Asia-Pacific contributed around 16% to the wave and tidal energy market in 2024, with rapid growth expected in the coming years. South Korea, China, Japan, and Australia remain key contributors. South Korea leads regional efforts with the Sihwa Lake Tidal Power Station, one of the world’s largest tidal barrage facilities. China accelerates investments in tidal stream and wave technologies through state-backed energy firms and regional governments. Japan focuses on island-based projects to enhance energy self-reliance and disaster resilience. Australia promotes marine energy integration in remote communities and island territories through its Blue Economy Cooperative Research Centre. The region's long coastlines, island geography, and increasing electricity demand support long-term deployment opportunities. It advances technology through academic collaborations and domestic engineering capabilities.
Latin America
Latin America represented nearly 5% of the global market in 2024, with growth driven by coastal resource availability and energy diversification goals. Chile and Brazil show early interest in marine energy to meet growing electricity demand in coastal and remote regions. Chile’s long Pacific coastline offers high wave energy potential, while Brazil explores tidal options in estuary zones. Limited pilot activity and lack of clear regulatory pathways currently constrain market growth. However, increasing policy attention toward renewable diversification opens future avenues for funding and technical partnerships. Regional universities and research institutions evaluate cost-effective, small-scale solutions that could benefit off-grid coastal populations.
Middle East & Africa
Middle East & Africa accounted for 4% of the wave and tidal energy market in 2024. The region remains in early stages, but island nations and coastal states show rising interest in marine renewables. South Africa studies wave energy’s potential to support grid stability and industrial energy needs. In the Middle East, Oman and UAE explore pilot installations to support net-zero transition strategies. Limited investment and infrastructure slow progress, yet high solar and marine energy potential offers hybrid system opportunities. Small-scale coastal projects receive backing from global climate funds and multilateral agencies. It holds long-term promise through sustainable energy policy integration and environmental impact mitigation frameworks.
Key Player Analysis
- BIOPOWER SYSTEMS PTY LTD
- SAE Renewables
- Aquanet Power
- ORPC, Inc.
- Ocean Power Technologies, Inc.
- AW Energy
- Carnegie Clean Energy
- Yam Pro Energy
- Orbital Marine Power
- ANDRITZ
Competitive Analysis
Leading players in the Wave and Tidal Energy market include Ocean Power Technologies, Inc., SAE Renewables, Carnegie Clean Energy, ORPC, Inc., Yam Pro Energy, AW Energy, Aquanet Power, ANDRITZ, Orbital Marine Power, and BIOPOWER SYSTEMS PTY LTD. These companies actively develop and test marine energy technologies across wave, tidal stream, and hybrid systems. Several firms focus on tidal stream generators due to their higher readiness levels and grid stability benefits. Players invest in modular device architecture to lower maintenance costs and improve scalability. Competitive advantage often stems from successful pilot deployments, patent portfolios, and government partnerships. Most firms collaborate with academic institutions or national energy labs to enhance performance and environmental monitoring. Access to test sites and marine infrastructure influences technology validation and commercial expansion. Some developers prioritize island and coastal markets with off-grid needs, where reliability and predictability offer strong appeal. Others focus on industrial applications or hybrid grid systems to widen their customer base. Competitive pressure increases as regions seek low-carbon alternatives backed by robust policy support. Each company must balance innovation speed with regulatory compliance and environmental safeguards. Sustained investment, proven technology performance, and adaptable deployment models will define leadership in this evolving sector.
Recent Developments
- In 2025, Carnegie focused on deploying its CETO technology in regions with high wave activity. A key example is the EuropeWave project, where the company planned to deploy and operate a CETO prototype at the Biscay Marine Energy Platform (BiMEP) in Spain.
- In 2023, SAE Renewables announced that the MeyGen tidal stream array had become the first tidal stream array in the world to generate 50 GWh of electricity.
- In 2023, Orbital Marine Power’s O2 tidal turbine contributed significantly to the European tidal stream sector, supporting record cumulative electricity production from demonstration projects and pilot farms, as reported in sector statistics for 2023
Report Coverage
The research report offers an in-depth analysis based on Type, Technology and Geography. It details leading market players, providing an overview of their business, product offerings, investments, revenue streams, and key applications. Additionally, the report includes insights into the competitive environment, SWOT analysis, current market trends, as well as the primary drivers and constraints. Furthermore, it discusses various factors that have driven market expansion in recent years. The report also explores market dynamics, regulatory scenarios, and technological advancements that are shaping the industry. It assesses the impact of external factors and global economic changes on market growth. Lastly, it provides strategic recommendations for new entrants and established companies to navigate the complexities of the market.
Future Outlook
- The market will grow due to rising demand for clean and predictable energy sources.
- Governments will continue to fund marine energy pilot projects and grid integration efforts.
- Developers will adopt modular and scalable designs to reduce installation and maintenance costs.
- Hybrid renewable systems combining wave, tidal, solar, and wind will see broader deployment.
- Tidal stream generators will remain the most commercially viable technology segment.
- Island nations and coastal regions will emerge as high-potential target markets.
- Public-private partnerships will increase to support commercialization and reduce investment risks.
- Environmental monitoring and impact mitigation technologies will become essential for project approvals.
- Digital tools like AI and IoT will help optimize performance and reduce downtime.
- Regional energy policies will drive long-term adoption across Europe, Asia-Pacific, and North America.
Request a Free Sample
Fill in your details and we'll send you a free sample report.
- Sample data tables & charts
- Research methodology
Need a Custom Version of This Report?
Tailor the scope, geography, or segments to your exact requirements.
- Custom geography or segment scope
- Direct access to our analyst team
Frequently Asked Questions
What is the current market size for Wave and Tidal Energy market, and what is its projected size in 2032?
At what Compound Annual Growth Rate is the Wave and Tidal Energy Market projected to grow between 2025 and 2032?
Which Wave and Tidal Energy market segment held the largest share in 2024?
What are the primary factors fueling the growth of the Wave and Tidal Energy market?
Who are the leading companies in the Wave and Tidal Energy Market?
Which region commanded the largest share of the Wave and Tidal Energy market in 2024?
Table of Content
Chapter 1. Report Introduction
- 1.1 Report Description & Purpose
- 1.1.1 Report Title & Market Definition
- 1.1.2 Unique Selling Propositions (USP) & Key Differentiators
- 1.1.3 Value Proposition for Stakeholders
- 1.2 Research Objectives
- 1.2.1 Market Sizing Objectives (Volume & Revenue)
- 1.2.2 Segmentation Objectives
- 1.2.3 Competitive Intelligence Objectives
- 1.2.4 Forecast & Scenario Objectives
- 1.3 Report Scope
- 1.3.1 Wave and Tidal Energy Scope – Types & Subtypes Covered
- 1.3.2 Geographic Scope – Regions & Countries Covered
- 1.3.3 Historical Period, Base Year & Forecast Period (2024; forecast to 2032)
- 1.3.4 Inclusions & Exclusions
- 1.4 HS Code & Classification Framework
- 1.5 Currency, Units & Pricing Basis
- 1.6 Target Stakeholders
- 1.7 Limitations & Assumptions
Chapter 2. Executive Summary
- 2.1 Global Wave and Tidal Energy Market Snapshot
- 2.1.1 Market Size – Historical (2024) & Forecast (2024-2032) (2024: USD 1.27 billion → 2032: USD 12.14 billion)
- 2.1.2 Volume & Revenue – Global Totals
- 2.1.3 Key Market Highlights – Top Five Facts
- 2.2 Wave and Tidal Energy Market Segmentation Snapshot
- 2.2.1 Market Split by Region – 2024 vs. 2032
- 2.3 Competitive Snapshot
- 2.3.1 Top 10 Players by Revenue Share – 2024
- 2.3.2 Top 10 Players by Volume Share – 2024
- 2.3.3 Recent Strategic Developments (18-Month Summary)
- 2.4 Key Investment Highlights & Strategic Conclusions
Chapter 3. Wave and Tidal Energy Market Dynamics & Industry Analysis
- 3.1 Market Overview & Context
- 3.1.1 Wave and Tidal Energy Market Position in the Broader Automotive Value Chain
- 3.1.2 OEM vs. Replacement Market Dynamics
- 3.1.3 Market Maturity & Development Stage by Region
- 3.2 Wave and Tidal Energy Market Drivers
- 3.3 Wave and Tidal Energy Market Restraints & Challenges
- 3.4 Wave and Tidal Energy Market Opportunities
- 3.5 Porter's Five Forces Analysis
- 3.5.1 Threat of New Entrants
- 3.5.2 Bargaining Power of Suppliers
- 3.5.3 Bargaining Power of Buyers
- 3.5.4 Threat of Substitutes
- 3.5.5 Competitive Rivalry – Intensity Assessment
- 3.6 Wave and Tidal Energy Value Chain Analysis
- 3.6.1 Upstream – Raw Material/Input Suppliers
- 3.6.1.1 Raw Material/Input 1
- 3.6.1.2 Raw Material/Input 2
- 3.6.1.3 Raw Material/Input 3
- 3.6.2 Midstream – Production/Manufacturing/Service Delivery
- 3.6.2.1 Production/Process Overview
- 3.6.2.2 Key Facility Locations & Capacity by Manufacturer
- 3.6.3 Downstream – Distribution & End Consumer
- 3.6.3.1 Primary Channel – B2B/OEM
- 3.6.3.2 Secondary Channels – Dealer, Retail, Online, Direct
- 3.6.4 Value Chain Profitability Analysis
- 3.6.1 Upstream – Raw Material/Input Suppliers
- 3.7 PESTEL Analysis
- 3.7.1 Political Factors
- 3.7.2 Economic Factors
- 3.7.3 Social Factors
- 3.7.4 Technological Factors
- 3.7.5 Environmental Factors
- 3.7.6 Legal Factors
- 3.8 Wave and Tidal Energy Supply Chain Analysis
- 3.8.1 Raw Material/Input Supply Risk Assessment
- 3.8.2 Manufacturing Concentration Risk (Geographic Exposure)
- 3.8.3 Trade Disruption Impact Analysis
- 3.9 Regulatory & Policy Landscape
Note: The regulatory and policy landscape section covers regulations based on their applicability to the market, Wave and Tidal Energy category, geography, and scope of the study. Only regulatory frameworks with a material impact on operations, compliance, trade, sustainability, or market access are analyzed in detail.
Chapter 4. Key Investment Pockets & Opportunity Analysis
- 4.1 Wave and Tidal Energy Market Attractiveness Analysis
- 4.1.1 By Region – Investment Attractiveness Matrix (Volume × CAGR)
- 4.2 Absolute Revenue Growth Opportunity
- 4.2.1 By Region – Absolute USD Growth Through 2032
- 4.3 Incremental Volume Opportunity
- 4.3.1 By Region – Incremental Volume Through 2032
- 4.3.2 Segment – Incremental Volume
- 4.4 Emerging Submarket Opportunity Deep Dive (Subject to Applicability)
- 4.5 Emerging Market Opportunity Scorecards
- 4.5.1 United States
- 4.5.2 Europe
- 4.5.3 Asia
- 4.5.4 Middle East & Africa
Note: Emerging Market Opportunity Scorecards will be included based on relevance and strategic importance. Regions listed are indicative and may vary depending on data availability and market dynamics.
Chapter 5. Wave and Tidal Energy Import-Export Analysis & Trade Flows
- 5.1 Global Trade Overview
- 5.1.1 Global Export Value by Country (2024)
- 5.1.2 Global Export Volume by Country (2024)
- 5.1.3 Global Import Value by Country (2024)
- 5.1.4 Global Import Volume by Country (2024)
- 5.1.5 Net Trade Balance by Country (2024)
- 5.2 Export Analysis – Segment
- 5.2.1 Type 1 (HS Code)
- 5.2.2 Type 2 (HS Code)
- 5.2.3 Type 3 (HS Code)
- 5.2.4 Type 4 (HS Code)
- 5.2.5 Type 5 (HS Code)
- 5.3 Import Analysis – Segment
- 5.3.1 Type 1 (HS Code)
- 5.3.2 Type 2 (HS Code)
- 5.3.3 Type 3 (HS Code)
- 5.3.4 Type 4 (HS Code)
- 5.3.5 Type 5 (HS Code)
- 5.4 Average Unit Trade Prices
- 5.4.1 Average Export Price – Segment & Country
- 5.4.2 Average Import Price – Segment & Source Country
- 5.4.3 Price Trends (2024)
- 5.5 Key Trade Route Analysis
- 5.5.1 Trade Route 1
- 5.5.2 Trade Route 2
- 5.5.3 Trade Route 3
- 5.5.4 Trade Route 4
- 5.5.5 Trade Route 5
- 5.6 Trade Policy Impact Assessment
- 5.6.1 US Anti-Dumping & Section 301 Tariffs
- 5.6.2 EU Customs Union Impact
- 5.6.3 Major Free Trade Agreements
- 5.6.4 USMCA Rules of Origin
Note: Trade policy analysis will be included only where relevant to the Wave and Tidal Energy market.
Chapter 6. Competitive Landscape & Company Benchmarking
- 6.1 Wave and Tidal Energy Market Concentration & Structure
- 6.1.1 Herfindahl-Hirschman Index (HHI) – vs. 2024
- 6.1.2 Tier 1, Tier 2 & Tier 3 Market Structure
- 6.1.3 Global, Regional & Local Player Dynamics
- 6.2 Wave and Tidal Energy Market Share Analysis – 2024
- 6.2.1 Global Revenue Share by Company
- 6.2.2 Global Volume Share by Company
- 6.2.3 Regional Revenue Share
- 6.2.4 Market Share Evolution ( vs. 2024)
- 6.2.5 OEM Segment Share by Company
- 6.2.6 Replacement Segment Share by Company
- 6.3 Production/Delivery Capacity & Facility Analysis
- 6.3.1 Global Installed Capacity
- 6.3.2 Capacity Utilization Rates
- 6.3.3 Production/Output Volume
- 6.3.4 Facility Locations & Capacity Map
- 6.3.5 Planned Capacity Additions
- 6.4 Wave and Tidal Energy Competitive Benchmarking Matrix
- 6.4.1 Revenue, Volume, CAGR & Profitability Comparison
- 6.4.2 Channel Revenue Mix
- 6.4.3 Geographic Revenue Exposure
- 6.4.4 R&D Intensity
- 6.4.5 Sustainability Maturity
- 6.5 Strategic Developments in Wave and Tidal Energy (Last 24 Months)
- 6.5.1 Mergers, Acquisitions & Divestments
- 6.5.2 New Wave and Tidal Energy Launches
- 6.5.3 Facility Expansions
- 6.5.4 Strategic Alliances, Joint Ventures & Partnerships
- 6.5.5 Distribution Expansion & Market Entry
- 6.5.6 Sustainability & ESG Initiatives
- 6.6 Competitive Strategy Mapping
- 6.6.1 Leader, Challenger, Follower & Niche Classification
- 6.6.2 Pricing Strategy Comparison
- 6.6.3 Channel Strategy Matrix
Note: Strategic developments are included based on their materiality and the availability of reliable information.
Chapter 7. Global Wave and Tidal Energy Market – By Distribution Channel
- 7.1 Segment Overview
- 7.1.1 Volume & Revenue Split by Channel (2024 & 2032)
- 7.1.2 Channel Mix Evolution (2024-2032)
Chapter 8. Regional Market Analysis – Global Overview
- 8.1 Global Regional Overview
- 8.1.1 Regional Volume Share
- 8.1.2 Regional Revenue Share
- 8.1.3 Regional Volume by Region
- 8.1.4 Regional Revenue by Region
- 8.1.5 Regional Forecast Through 2032
- 8.2 Cross-Regional Segment Analysis
- 8.2.1 By Distribution Channel
- 8.2.2 By Brand/Price Tier
Chapter 9. North America Wave and Tidal Energy Market
- 9.1 United States
- 9.2 Canada
- 9.3 Mexico
Chapter 10. Europe Wave and Tidal Energy Market
- 10.1 Germany
- 10.2 France
- 10.3 Italy
- 10.4 United Kingdom
- 10.5 Spain
- 10.6 Poland
- 10.7 Russia
- 10.8 Netherlands
- 10.9 Belgium
- 10.10 Sweden
- 10.11 Denmark
- 10.12 Norway
- 10.13 Rest of Europe
Chapter 11. Asia Pacific Wave and Tidal Energy Market
- 11.1 China
- 11.2 India
- 11.3 Japan
- 11.4 South Korea
- 11.5 Thailand
- 11.6 Indonesia
- 11.7 Vietnam
- 11.8 Malaysia
- 11.9 Australia
- 11.10 Rest of Asia Pacific
Chapter 12. Latin America Wave and Tidal Energy Market
- 12.1 Brazil
- 12.2 Argentina
- 12.3 Colombia
- 12.4 Chile
- 12.5 Rest of Latin America
Chapter 13. Middle East Wave and Tidal Energy Market
- 13.1 Saudi Arabia
- 13.2 United Arab Emirates
- 13.3 Turkey
- 13.4 Israel
- 13.5 Iran
- 13.6 Rest of the Middle East
Chapter 14. Africa Wave and Tidal Energy Market
- 14.1 South Africa
- 14.2 Egypt
- 14.3 Nigeria
- 14.4 Morocco
- 14.5 Rest of Africa
Chapter 15. Wave and Tidal Energy Company Profiles
- 15.1 [Company 01]
- 15.1.1 Company Overview
- 15.1.2 Key Management Personnel
- 15.1.3 Products & Services Portfolio
- 15.1.4 Financial Performance
- 15.1.5 Key Market Focus & Geographic Presence
- 15.1.6 Recent Developments & Strategic Initiatives
Note: The company profile list is preliminary and may change based on research findings, market developments, data availability, and client requirements.
Chapter 16. Appendices
- Appendix A – List of Abbreviations & Acronyms
- Appendix B – Industry Classification Code Reference – Full Series
- Appendix C – Production & Capacity Data Tables
- Appendix D – End-Use & Demand Base Tables
- Appendix E – Consumption & Replacement Rate Assumptions
- Appendix F – ASP Reference Tables
- Appendix G – Manufacturing & Facility Database
- Appendix H – Import-Export Data Tables
- Appendix I – Regulatory Summary Tables
- Appendix J – Primary Research Participant List (Anonymized)
- Appendix K – Primary Research Questionnaire Framework
- Appendix L – Data Sources & Bibliography
- Appendix M – Market Size Divergence & Source Comparison
Chapter 17. Research Methodology
- 17.1 Research Framework & Philosophy
- 17.2 Secondary Research – Sources, Hierarchy & Data Extraction
- 17.3 Data Modeling – Bottom-Up & Top-Down Market Sizing
- 17.4 Primary Research – Stakeholder Framework, LOI & Sample Sizes
- 17.5 Forecast Methodology – Regression, Scenario & Sensitivity Analysis
- 17.6 Quality Control – Four-Layer Validation Framework
- 17.7 Limitations & Standard Assumptions
- 17.8 Disclaimer
