
Market Overview:
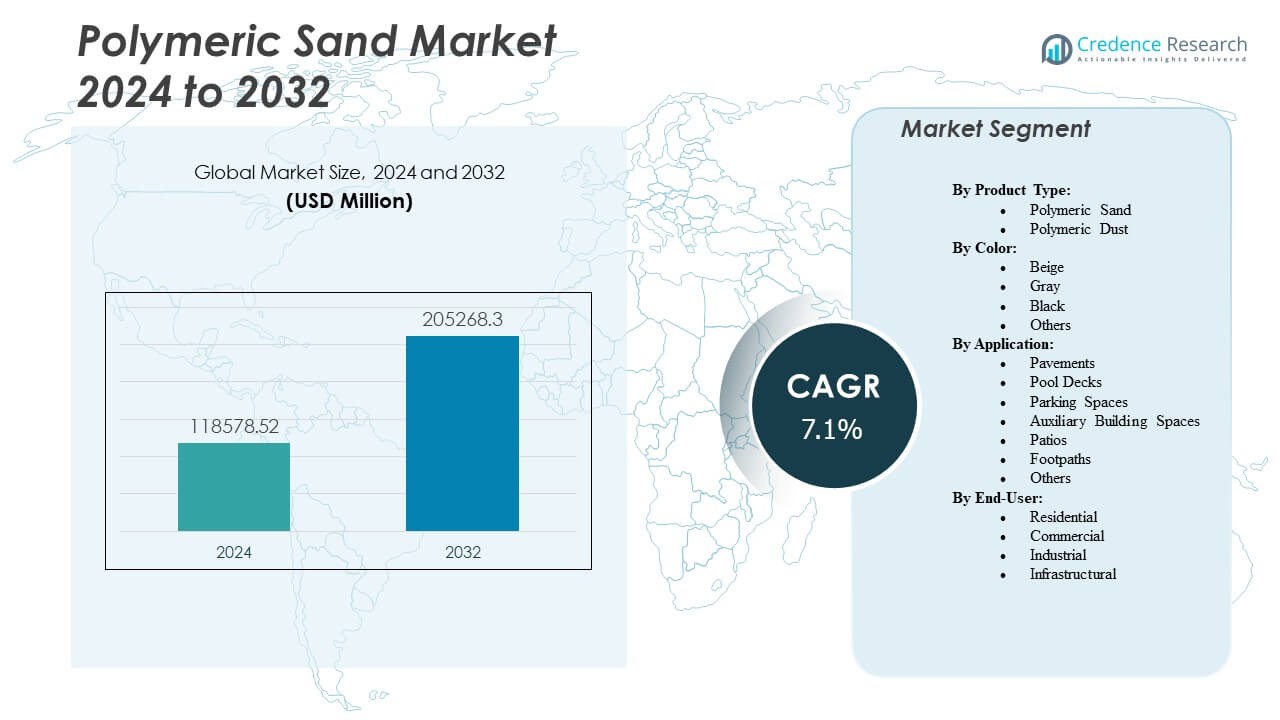
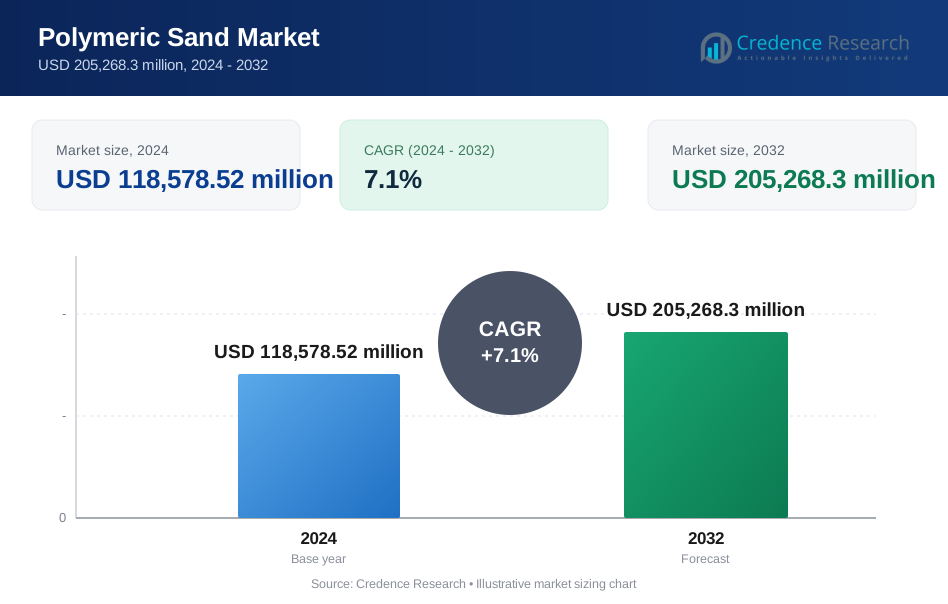
The Polymeric Sand Market is projected to grow from USD 118,578.52 million in 2024 to an estimated USD 205,268.3 million by 2032, with a compound annual growth rate (CAGR) of 7.1% from 2024 to 2032.
| REPORT ATTRIBUTE | DETAILS |
|---|---|
| Historical Period | 2020-2023 |
| Base Year | 2024 |
| Forecast Period | 2025-2032 |
| Polymeric Sand Market Size 2024 | USD 118,578.52 Million |
| Polymeric Sand Market, CAGR | 7.1% |
| Polymeric Sand Market Size 2032 | USD 205,268.3 Million |
Strong demand from the construction and landscaping sectors drives the market expansion. Urban development projects and residential renovations increase the use of polymeric sand for paving and joint sealing. It offers advantages such as durability, water resistance, and weed prevention, which boost adoption among contractors and homeowners. Growing preference for low-maintenance and long-lasting paving solutions enhances overall market potential across developed and emerging economies.
North America remains the leading region due to a strong construction base and high awareness of advanced pavement materials. Europe follows, supported by its focus on sustainable urban infrastructure and outdoor space improvement. Asia Pacific emerges as the fastest-growing region, driven by urbanization, infrastructure investments, and expanding residential projects. Latin America and the Middle East & Africa show gradual growth supported by tourism and modern construction trends. Regional variations in climate and building standards influence product formulation and distribution strategies across global markets.
Market Insights:
- The Polymeric Sand Market is valued at USD 118,578.52 million in 2024 and is expected to reach USD 205,268.3 million by 2032, growing at a CAGR of 7.1%.
- Rapid urbanization and rising residential construction activities drive strong product demand across global markets.
- Increasing focus on low-maintenance, weather-resistant, and durable paving materials supports industry growth.
- High product costs and improper installation practices act as restraints, limiting adoption in cost-sensitive regions.
- North America leads the market due to advanced construction standards and frequent infrastructure renovation.
- Asia Pacific shows the fastest growth with large-scale urban expansion and improving housing infrastructure.
- Manufacturers focus on sustainable, eco-friendly formulations and regional customization to strengthen competitiveness.
Market Drivers
Rising Infrastructure Development and Urban Revitalization Projects
The Polymeric Sand Market gains strong momentum from increasing urban construction and renovation activities. Expanding city infrastructure creates large-scale demand for paving materials that ensure stability and low maintenance. Contractors adopt polymeric sand for interlocking pavements in driveways, patios, and walkways. It enhances durability by reducing weed growth and joint erosion. Public landscaping projects also contribute to steady consumption. Municipal authorities prioritize advanced materials for sustainable pavements. The growing preference for weather-resistant compounds drives continual upgrades. Builders focus on extended lifespan and cost-effective installation methods, boosting the market’s adoption.
- For instance, Sakrete’s PermaSand Polymeric Jointing Sand covers about 30–45 sq. ft. per 40 lb pail for ¼-inch joints. It supports foot traffic within 24 hours and light vehicular loads after 72 hours, offering strong resistance to erosion, weed growth, and insect penetration in driveways and walkways.
Increasing Popularity of Outdoor Living and Landscaping Designs
Rising interest in outdoor living spaces drives greater use of polymeric sand across residential landscapes. Consumers choose high-quality jointing sand to improve the appearance and strength of stone pavements. Homeowners value low-maintenance surfaces that endure heavy traffic and weather variations. It supports landscape architects who demand cleaner seams and stronger joints. The trend toward aesthetic patios, pool decks, and gardens expands market coverage. Product innovation aligns with modern designs emphasizing uniform color and texture. This shift benefits manufacturers offering multi-purpose and quick-setting formulations. Seasonal renovation activities further strengthen market expansion in premium residential zones.
Technological Advancements Enhancing Product Performance
Continuous innovation in binder chemistry and sand blends improves overall performance of polymeric sand. Manufacturers integrate advanced polymers to enhance binding strength and water resistance. It ensures long-lasting pavement stability and minimizes washout risks. New formulations reduce haze effects while maintaining flexibility under thermal stress. Producers invest in R&D to meet environmental and performance standards. Smart packaging solutions improve usability and application efficiency. Enhanced dust control during installation boosts contractor preference. The growing emphasis on durable and eco-friendly compounds supports widespread product adoption.
Expansion in the Commercial and Industrial Construction Sector
The Polymeric Sand Market benefits from steady expansion of commercial complexes and industrial parks. Large projects require high-quality jointing materials to ensure safety and long-term performance. It provides better compaction and joint sealing than traditional sands. Heavy traffic areas such as parking zones and pedestrian walkways rely on advanced formulations. Builders choose polymeric sand for its quick curing and reduced maintenance. Rising construction investments in hotels, retail, and logistics facilities strengthen overall demand. The global shift toward sustainable urban design boosts adoption rates. Growing specification of performance-based materials further encourages its integration into commercial paving standards.
- For instance, Techniseal’s HP NextGel Polymeric Sand combines high-grade sand with advanced binders engineered for heavy-duty commercial and residential paving joints. A 50-lb bag typically covers 18–80 sq. ft., depending on joint width, and offers strong resistance to erosion, weeds, and insects for long-lasting pavement stability.
Market Trends
Growing Adoption of Eco-Friendly and Low-VOC Products
Sustainability trends reshape the Polymeric Sand Market with eco-conscious formulations gaining attention. Manufacturers develop low-VOC and biodegradable polymer blends to align with green construction goals. It supports governments promoting environmentally safe materials in building projects. Consumers seek solutions that reduce runoff pollution and waste generation. Eco-label certifications enhance product credibility in international markets. New technologies focus on bio-based binders offering comparable performance to synthetic ones. This shift improves environmental compliance and brand image. Strong demand from eco-aware urban projects continues to influence future product development.
- for instance, Envirobond's EnviroSAND uses a patented plant-based glue called Organic-Lock made from 100% naturally occurring materials that bonds sand particles for joints up to 3/8 inch wide.
Rise of DIY Installation and Home Improvement Activities
The growing DIY culture expands the market scope for small-scale users and homeowners. People increasingly perform patio and walkway installations themselves using pre-mixed polymeric sand products. It allows quick application without professional assistance, saving labor costs. Packaging innovations simplify handling and storage for casual users. Online tutorials and retail visibility increase consumer confidence. Manufacturers focus on easy-to-use formulations suited for residential projects. The retail expansion of home improvement stores drives product accessibility. This trend fosters consistent domestic sales growth in developed markets.
Integration of Smart Manufacturing and Quality Monitoring Systems
Automation and smart production systems optimize quality in polymeric sand manufacturing. Companies adopt AI and IoT technologies for real-time quality checks during blending and packaging. It reduces waste and ensures uniform polymer distribution. Advanced material sensors detect moisture levels and optimize curing behavior. Data analytics help forecast demand and manage inventory efficiently. Smart factories allow faster production scale-up for new product lines. This innovation ensures consistency across batches while lowering operational costs. The integration of intelligent processes enhances reliability and customer trust.
- For instance, Alliance Gator employs advanced manufacturing for superior joint stabilization and resistance to erosion in their polymeric sands.
Expansion of E-Commerce and Digital Distribution Channels
Online retail platforms strengthen the global reach of polymeric sand manufacturers. E-commerce provides visibility for niche brands and specialized formulations. It simplifies access for contractors and homeowners in remote regions. Digital distribution lowers logistics costs and improves supply chain transparency. Marketing through online content educates users about product applications. It supports comparison-based purchasing decisions through user reviews and technical data. Partnerships with large e-retailers enable wider audience coverage. Continuous digital growth supports competitive differentiation across global and regional players.
Market Challenges Analysis
High Cost of Advanced Formulations and Installation Complexity
The Polymeric Sand Market faces challenges from higher material and labor costs associated with advanced formulations. Premium polymeric blends require precise application, increasing installation time. It demands skilled workers to ensure uniform joint filling and compaction. Small contractors often prefer cheaper traditional sand, limiting market penetration. Unfavorable cost-to-benefit ratios slow adoption in low-budget projects. Curing issues under extreme humidity or cold conditions affect end performance. Maintenance errors such as improper wetting can lead to surface whitening. Manufacturers must educate users and installers to prevent misuse and performance complaints.
Regulatory Compliance and Supply Chain Disruptions
Strict environmental standards affect formulation flexibility and sourcing options. Regulations on chemical binders restrict certain polymer types. It forces manufacturers to redesign products, increasing R&D costs. Supply chain volatility in raw materials like quartz and polymer resins adds uncertainty. Rising freight costs and seasonal transport delays impact timely distribution. Regional variations in standards complicate global marketing. Market players struggle to maintain inventory balance during unpredictable demand cycles. Dependence on imported materials increases exposure to price fluctuations, reducing profitability margins.
Market Opportunities
Growing Focus on Sustainable Construction and Green Infrastructure
Rising investment in sustainable infrastructure creates strong opportunities for the Polymeric Sand Market. Governments and developers prioritize eco-friendly building materials that reduce water runoff and improve pavement longevity. It benefits suppliers introducing recyclable and water-permeable formulations. Urban green projects incorporate polymeric sand in pathways, terraces, and recreational zones. Public demand for resilient materials aligns with global climate goals. Manufacturers can expand through eco-certifications and carbon-neutral production strategies. Sustainable procurement programs strengthen partnerships with government contractors. Market potential increases as environmental awareness shapes future urban planning agendas.
Expansion in Emerging Economies and Rapid Urbanization
Developing countries offer major growth prospects with expanding urban populations and infrastructure needs. Rapid construction of residential complexes, smart cities, and commercial plazas boosts demand for durable paving materials. It enables cost-efficient and quick pavement installations in high-traffic zones. Foreign investments in housing and tourism create opportunities for local suppliers. Distributors focus on offering region-specific product formulations that withstand diverse climates. Growing acceptance of quality-certified materials increases competitive advantage. Strategic collaborations with construction firms enhance visibility and reach. The expanding infrastructure pipeline across Asia Pacific, Latin America, and Africa ensures sustained market growth.
Market Segmentation Analysis:
By Product Type
The Polymeric Sand Market includes two major categories: polymeric sand and polymeric dust. Polymeric sand dominates due to its superior joint stabilization and strong bonding characteristics. It is widely used in high-traffic paving projects where durability and weather resistance are essential. Polymeric dust finds use in lighter applications that require minimal load-bearing capacity. Contractors prefer polymeric sand for large-scale installations because it prevents weed growth and erosion effectively. It supports long-term pavement performance while reducing maintenance. Continuous advancements in polymer technology strengthen its overall adoption.
- For instance, Alliance Gator's Maxx G2 polymeric sand uses advanced intelligent polymers to neutralize haze and dust, requiring only one watering and becoming rain-safe after 15 minutes. It supports joints up to 4 inches wide in traditional applications and is suitable for a range of uses including pool decks, patios, footpaths, driveways, parking spaces, and pavements.
By Color
Color selection influences material choice in landscaping and aesthetic applications. Beige and gray hold major shares due to their natural tone compatibility with most paving stones. Black variants gain attention for contemporary urban and commercial spaces that emphasize modern finishes. It helps designers match the color palette of outdoor environments efficiently. The availability of multiple shades supports customization and visual appeal. Manufacturers continue to expand offerings with UV-resistant pigments for lasting color retention. Product color diversity enhances project design flexibility across residential and commercial installations.
By Application
The Polymeric Sand Market finds extensive usage in pavements, pool decks, patios, and parking spaces. Pavements lead the segment due to consistent demand from public infrastructure projects and private developments. Pool decks and patios follow closely, supported by growth in outdoor living trends. Parking spaces and footpaths use it for better joint sealing under high load exposure. Auxiliary building spaces adopt it for aesthetic enhancement and low maintenance. The product’s ability to endure temperature fluctuations and moisture variation reinforces its appeal. Each application benefits from tailored formulations that optimize curing and stability.
By End-User
Residential construction remains the leading end-user segment, driven by growing investment in home improvement and landscaping. Homeowners prefer polymeric sand for patios, walkways, and driveways due to easy installation and clean finish. Commercial use continues to expand across hotels, resorts, and retail areas emphasizing durable flooring. It supports heavy foot traffic and requires limited upkeep. Industrial applications grow steadily, favoring the material for internal and external facility pathways. Infrastructural projects adopt it for long-lasting pavements and pedestrian zones. Expanding urban redevelopment plans ensure continuous usage across all end-user categories.
- For instance, Sika FastFix®-110 is a high-performance polymeric sand specifically formulated for use in residential, commercial, and industrial landscaping projects. It seals joints between pavers, stones, bricks, and slabs, providing strong bond strength that withstands heavy foot and vehicle traffic, while requiring minimal maintenance.
Segmentation:
By Product Type:
- Polymeric Sand
- Polymeric Dust
By Color:
- Beige
- Gray
- Black
- Others
By Application:
- Pavements
- Pool Decks
- Parking Spaces
- Auxiliary Building Spaces
- Patios
- Footpaths
- Others
By End-User:
- Residential
- Commercial
- Industrial
- Infrastructural
By Region:
- North America
- U.S.
- Canada
- Mexico
- Europe
- Germany
- France
- U.K.
- Italy
- Spain
- Rest of Europe
- Asia Pacific
- China
- Japan
- India
- South Korea
- South-east Asia
- Rest of Asia Pacific
- Latin America
- Brazil
- Argentina
- Rest of Latin America
- Middle East & Africa
- GCC Countries
- South Africa
- Rest of the Middle East and Africa
Regional Analysis:
North America commands the largest portion of the Polymeric Sand Market, holding roughly 38 % of global revenue in 2024. Strong demand stems from high renovation rates, mature infrastructure networks, and consistent investments in residential and commercial paving. Europe follows with about 28 % market share. The market in Europe benefits from stringent building codes, frequent infrastructure upgrades, and preference for long-lasting paving materials. Leading economies such as Germany, United Kingdom, and France support sustained consumption through both public and private construction projects.
Asia Pacific accounts for close to 22 % share of the global market. Rapid urbanization in countries like India and China drives significant demand for polymeric sand in roadways, walkways, and urban landscaping. Large-scale residential and commercial developments in Southeast Asia further amplify usage. Lower cost of labor and rising per-capita income fuel adoption in emerging markets within the region. Product manufacturers target this region for expansion due to growing infrastructure pipelines and favorable demographic trends.
Regions comprising Latin America, Middle East, and Africa together represent the remaining approximate 12 % market share. Growth there remains moderate due to lower overall infrastructure spend and slower pace of urban redevelopment. Gulf countries and certain urban centers in Latin America show pockets of demand driven by tourism-linked construction and high-end residential projects. It faces challenges such as supply-chain delays and limited technical awareness among contractors. Market players view this region as a strategic opportunity for long-term growth if they offer cost-effective products and training support.
Key Player Analysis:
- Techniseal
- Alliance Designer Products Inc. / Alliance Gator
- SEK-Surebond
- Sakrete
- SRW Products
- Sable Marco Inc.
- Vimark S.r.l.
- Unilock
- Ash Grove Packaging (Ashgrove Polymeric Sand)
- Fairmount Santrol
Competitive Analysis:
The Polymeric Sand Market features a varied set of players ranging from global manufacturers to regional suppliers. Some of the key firms operating in the market include Techniseal, SEK‑Surebond, SRW Products, Fairmount Santrol Holdings Inc., Sakrete and Vimark S.r.l. among others. Leading firms hold competitive advantage through established brand recognition, broad distribution networks, and trusted product quality. They invest in formulation improvements to boost binding strength, water resistance and ease of installation. They also offer diverse product variants catering to residential, commercial and industrial customers. Mid-size and regional suppliers compete by focusing on lower-cost alternatives or customized solutions for local climates and paving needs. Smaller players attempt to carve niches by offering compact packaging or budget-oriented polymeric sand for DIY homeowners or small contractors. Competition intensifies on price sensitivity, product performance, supply-chain reliability and distribution reach. Firms with efficient logistics and global sourcing secure better margins and faster deliveries. Those unable to meet regulatory or performance expectations lose buyer trust quickly. Market consolidation appears uneven, leaving room for new entrants that bring technological innovation or cost-efficient production. Market participants that align product quality with local demand and compliance standards stand to gain competitive edge.
Report Coverage:
The research report offers an in-depth analysis based on Product Type, Color, Application and End-User. It details leading market players, providing an overview of their business, product offerings, investments, revenue streams, and key applications. Additionally, the report includes insights into the competitive environment, SWOT analysis, current market trends, as well as the primary drivers and constraints. Furthermore, it discusses various factors that have driven market expansion in recent years. The report also explores market dynamics, regulatory scenarios, and technological advancements that are shaping the industry. It assesses the impact of external factors and global economic changes on market growth. Lastly, it provides strategic recommendations for new entrants and established companies to navigate the complexities of the market.
Future Outlook:
- Growing infrastructure renovation and landscaping projects will sustain long-term product demand.
- Rising consumer focus on outdoor living spaces will increase usage across residential applications.
- Product innovation in low-VOC and eco-friendly formulations will shape future competitiveness.
- Automation in blending and packaging will improve consistency and cost efficiency.
- Increasing construction in emerging economies will create large untapped opportunities.
- Manufacturers will expand color and texture options to meet aesthetic design needs.
- Retail and e-commerce channels will drive faster product accessibility for DIY users.
- Commercial and industrial adoption will strengthen with emphasis on durable paving materials.
- Strategic partnerships with contractors and distributors will boost market reach and brand visibility.
- Focus on sustainable urban design and green infrastructure will continue guiding future investments.
Request a Free Sample
Fill in your details and we'll send you a free sample report.
- Sample data tables & charts
- Research methodology
Need a Custom Version of This Report?
Tailor the scope, geography, or segments to your exact requirements.
- Custom geography or segment scope
- Direct access to our analyst team
Frequently Asked Questions
What is the current market size for Polymeric Sand Market, and what is its projected size in 2032?
At what Compound Annual Growth Rate is the Polymeric Sand Market projected to grow between 2024 and 2032?
Which Polymeric Sand Market segment held the largest share in 2024?
What are the primary factors fueling the growth of the Polymeric Sand Market?
Who are the leading companies in the Polymeric Sand Market?
Which region commanded the largest share of the Polymeric Sand Market in 2024?
Table of Content
Chapter 1. Report Introduction
- 1.1 Report Description & Purpose
- 1.1.1 Report Title & Market Definition
- 1.1.2 Unique Selling Propositions (USP) & Key Differentiators
- 1.1.3 Value Proposition for Stakeholders
- 1.2 Research Objectives
- 1.2.1 Market Sizing Objectives (Volume & Revenue)
- 1.2.2 Segmentation Objectives
- 1.2.3 Competitive Intelligence Objectives
- 1.2.4 Forecast & Scenario Objectives
- 1.3 Report Scope
- 1.3.1 Polymeric Sand Scope – Types & Subtypes Covered
- 1.3.2 Geographic Scope – Regions & Countries Covered
- 1.3.3 Historical Period, Base Year & Forecast Period (2024; forecast to 2032)
- 1.3.4 Inclusions & Exclusions
- 1.4 HS Code & Classification Framework
- 1.5 Currency, Units & Pricing Basis
- 1.6 Target Stakeholders
- 1.7 Limitations & Assumptions
Chapter 2. Executive Summary
- 2.1 Global Polymeric Sand Market Snapshot
- 2.1.1 Market Size – Historical (2024) & Forecast (2024-2032) (2024: USD 118,578.52 million → 2032: USD 205,268.3 million)
- 2.1.2 Volume & Revenue – Global Totals
- 2.1.3 Key Market Highlights – Top Five Facts
- 2.2 Polymeric Sand Market Segmentation Snapshot
- 2.2.1 Market Split by Region – 2024 vs. 2032
- 2.3 Competitive Snapshot
- 2.3.1 Top 10 Players by Revenue Share – 2024
- 2.3.2 Top 10 Players by Volume Share – 2024
- 2.3.3 Recent Strategic Developments (18-Month Summary)
- 2.4 Key Investment Highlights & Strategic Conclusions
Chapter 3. Polymeric Sand Market Dynamics & Industry Analysis
- 3.1 Market Overview & Context
- 3.1.1 Polymeric Sand Market Position in the Broader Automotive Value Chain
- 3.1.2 OEM vs. Replacement Market Dynamics
- 3.1.3 Market Maturity & Development Stage by Region
- 3.2 Polymeric Sand Market Drivers
- 3.3 Polymeric Sand Market Restraints & Challenges
- 3.4 Polymeric Sand Market Opportunities
- 3.5 Porter's Five Forces Analysis
- 3.5.1 Threat of New Entrants
- 3.5.2 Bargaining Power of Suppliers
- 3.5.3 Bargaining Power of Buyers
- 3.5.4 Threat of Substitutes
- 3.5.5 Competitive Rivalry – Intensity Assessment
- 3.6 Polymeric Sand Value Chain Analysis
- 3.6.1 Upstream – Raw Material/Input Suppliers
- 3.6.1.1 Raw Material/Input 1
- 3.6.1.2 Raw Material/Input 2
- 3.6.1.3 Raw Material/Input 3
- 3.6.2 Midstream – Production/Manufacturing/Service Delivery
- 3.6.2.1 Production/Process Overview
- 3.6.2.2 Key Facility Locations & Capacity by Manufacturer
- 3.6.3 Downstream – Distribution & End Consumer
- 3.6.3.1 Primary Channel – B2B/OEM
- 3.6.3.2 Secondary Channels – Dealer, Retail, Online, Direct
- 3.6.4 Value Chain Profitability Analysis
- 3.6.1 Upstream – Raw Material/Input Suppliers
- 3.7 PESTEL Analysis
- 3.7.1 Political Factors
- 3.7.2 Economic Factors
- 3.7.3 Social Factors
- 3.7.4 Technological Factors
- 3.7.5 Environmental Factors
- 3.7.6 Legal Factors
- 3.8 Polymeric Sand Supply Chain Analysis
- 3.8.1 Raw Material/Input Supply Risk Assessment
- 3.8.2 Manufacturing Concentration Risk (Geographic Exposure)
- 3.8.3 Trade Disruption Impact Analysis
- 3.9 Regulatory & Policy Landscape
Note: The regulatory and policy landscape section covers regulations based on their applicability to the market, Polymeric Sand category, geography, and scope of the study. Only regulatory frameworks with a material impact on operations, compliance, trade, sustainability, or market access are analyzed in detail.
Chapter 4. Key Investment Pockets & Opportunity Analysis
- 4.1 Polymeric Sand Market Attractiveness Analysis
- 4.1.1 By Region – Investment Attractiveness Matrix (Volume × CAGR)
- 4.2 Absolute Revenue Growth Opportunity
- 4.2.1 By Region – Absolute USD Growth Through 2032
- 4.3 Incremental Volume Opportunity
- 4.3.1 By Region – Incremental Volume Through 2032
- 4.3.2 Segment – Incremental Volume
- 4.4 Emerging Submarket Opportunity Deep Dive (Subject to Applicability)
- 4.5 Emerging Market Opportunity Scorecards
- 4.5.1 United States
- 4.5.2 Europe
- 4.5.3 Asia
- 4.5.4 Middle East & Africa
Note: Emerging Market Opportunity Scorecards will be included based on relevance and strategic importance. Regions listed are indicative and may vary depending on data availability and market dynamics.
Chapter 5. Polymeric Sand Import-Export Analysis & Trade Flows
- 5.1 Global Trade Overview
- 5.1.1 Global Export Value by Country (2024)
- 5.1.2 Global Export Volume by Country (2024)
- 5.1.3 Global Import Value by Country (2024)
- 5.1.4 Global Import Volume by Country (2024)
- 5.1.5 Net Trade Balance by Country (2024)
- 5.2 Export Analysis – Segment
- 5.2.1 Type 1 (HS Code)
- 5.2.2 Type 2 (HS Code)
- 5.2.3 Type 3 (HS Code)
- 5.2.4 Type 4 (HS Code)
- 5.2.5 Type 5 (HS Code)
- 5.3 Import Analysis – Segment
- 5.3.1 Type 1 (HS Code)
- 5.3.2 Type 2 (HS Code)
- 5.3.3 Type 3 (HS Code)
- 5.3.4 Type 4 (HS Code)
- 5.3.5 Type 5 (HS Code)
- 5.4 Average Unit Trade Prices
- 5.4.1 Average Export Price – Segment & Country
- 5.4.2 Average Import Price – Segment & Source Country
- 5.4.3 Price Trends (2024)
- 5.5 Key Trade Route Analysis
- 5.5.1 Trade Route 1
- 5.5.2 Trade Route 2
- 5.5.3 Trade Route 3
- 5.5.4 Trade Route 4
- 5.5.5 Trade Route 5
- 5.6 Trade Policy Impact Assessment
- 5.6.1 US Anti-Dumping & Section 301 Tariffs
- 5.6.2 EU Customs Union Impact
- 5.6.3 Major Free Trade Agreements
- 5.6.4 USMCA Rules of Origin
Note: Trade policy analysis will be included only where relevant to the Polymeric Sand market.
Chapter 6. Competitive Landscape & Company Benchmarking
- 6.1 Polymeric Sand Market Concentration & Structure
- 6.1.1 Herfindahl-Hirschman Index (HHI) – vs. 2024
- 6.1.2 Tier 1, Tier 2 & Tier 3 Market Structure
- 6.1.3 Global, Regional & Local Player Dynamics
- 6.2 Polymeric Sand Market Share Analysis – 2024
- 6.2.1 Global Revenue Share by Company
- 6.2.2 Global Volume Share by Company
- 6.2.3 Regional Revenue Share
- 6.2.4 Market Share Evolution ( vs. 2024)
- 6.2.5 OEM Segment Share by Company
- 6.2.6 Replacement Segment Share by Company
- 6.3 Production/Delivery Capacity & Facility Analysis
- 6.3.1 Global Installed Capacity
- 6.3.2 Capacity Utilization Rates
- 6.3.3 Production/Output Volume
- 6.3.4 Facility Locations & Capacity Map
- 6.3.5 Planned Capacity Additions
- 6.4 Polymeric Sand Competitive Benchmarking Matrix
- 6.4.1 Revenue, Volume, CAGR & Profitability Comparison
- 6.4.2 Channel Revenue Mix
- 6.4.3 Geographic Revenue Exposure
- 6.4.4 R&D Intensity
- 6.4.5 Sustainability Maturity
- 6.5 Strategic Developments in Polymeric Sand (Last 24 Months)
- 6.5.1 Mergers, Acquisitions & Divestments
- 6.5.2 New Polymeric Sand Launches
- 6.5.3 Facility Expansions
- 6.5.4 Strategic Alliances, Joint Ventures & Partnerships
- 6.5.5 Distribution Expansion & Market Entry
- 6.5.6 Sustainability & ESG Initiatives
- 6.6 Competitive Strategy Mapping
- 6.6.1 Leader, Challenger, Follower & Niche Classification
- 6.6.2 Pricing Strategy Comparison
- 6.6.3 Channel Strategy Matrix
Note: Strategic developments are included based on their materiality and the availability of reliable information.
Chapter 7. Global Polymeric Sand Market – By Distribution Channel
- 7.1 Segment Overview
- 7.1.1 Volume & Revenue Split by Channel (2024 & 2032)
- 7.1.2 Channel Mix Evolution (2024-2032)
Chapter 8. Regional Market Analysis – Global Overview
- 8.1 Global Regional Overview
- 8.1.1 Regional Volume Share
- 8.1.2 Regional Revenue Share
- 8.1.3 Regional Volume by Region
- 8.1.4 Regional Revenue by Region
- 8.1.5 Regional Forecast Through 2032
- 8.2 Cross-Regional Segment Analysis
- 8.2.1 By Distribution Channel
- 8.2.2 By Brand/Price Tier
Chapter 9. North America Polymeric Sand Market
- 9.1 United States
- 9.2 Canada
- 9.3 Mexico
Chapter 10. Europe Polymeric Sand Market
- 10.1 Germany
- 10.2 France
- 10.3 Italy
- 10.4 United Kingdom
- 10.5 Spain
- 10.6 Poland
- 10.7 Russia
- 10.8 Netherlands
- 10.9 Belgium
- 10.10 Sweden
- 10.11 Denmark
- 10.12 Norway
- 10.13 Rest of Europe
Chapter 11. Asia Pacific Polymeric Sand Market
- 11.1 China
- 11.2 India
- 11.3 Japan
- 11.4 South Korea
- 11.5 Thailand
- 11.6 Indonesia
- 11.7 Vietnam
- 11.8 Malaysia
- 11.9 Australia
- 11.10 Rest of Asia Pacific
Chapter 12. Latin America Polymeric Sand Market
- 12.1 Brazil
- 12.2 Argentina
- 12.3 Colombia
- 12.4 Chile
- 12.5 Rest of Latin America
Chapter 13. Middle East Polymeric Sand Market
- 13.1 Saudi Arabia
- 13.2 United Arab Emirates
- 13.3 Turkey
- 13.4 Israel
- 13.5 Iran
- 13.6 Rest of the Middle East
Chapter 14. Africa Polymeric Sand Market
- 14.1 South Africa
- 14.2 Egypt
- 14.3 Nigeria
- 14.4 Morocco
- 14.5 Rest of Africa
Chapter 15. Polymeric Sand Company Profiles
- 15.1 [Company 01]
- 15.1.1 Company Overview
- 15.1.2 Key Management Personnel
- 15.1.3 Products & Services Portfolio
- 15.1.4 Financial Performance
- 15.1.5 Key Market Focus & Geographic Presence
- 15.1.6 Recent Developments & Strategic Initiatives
Note: The company profile list is preliminary and may change based on research findings, market developments, data availability, and client requirements.
Chapter 16. Appendices
- Appendix A – List of Abbreviations & Acronyms
- Appendix B – Industry Classification Code Reference – Full Series
- Appendix C – Production & Capacity Data Tables
- Appendix D – End-Use & Demand Base Tables
- Appendix E – Consumption & Replacement Rate Assumptions
- Appendix F – ASP Reference Tables
- Appendix G – Manufacturing & Facility Database
- Appendix H – Import-Export Data Tables
- Appendix I – Regulatory Summary Tables
- Appendix J – Primary Research Participant List (Anonymized)
- Appendix K – Primary Research Questionnaire Framework
- Appendix L – Data Sources & Bibliography
- Appendix M – Market Size Divergence & Source Comparison
Chapter 17. Research Methodology
- 17.1 Research Framework & Philosophy
- 17.2 Secondary Research – Sources, Hierarchy & Data Extraction
- 17.3 Data Modeling – Bottom-Up & Top-Down Market Sizing
- 17.4 Primary Research – Stakeholder Framework, LOI & Sample Sizes
- 17.5 Forecast Methodology – Regression, Scenario & Sensitivity Analysis
- 17.6 Quality Control – Four-Layer Validation Framework
- 17.7 Limitations & Standard Assumptions
- 17.8 Disclaimer
