Automated Microscopy Market Overview:
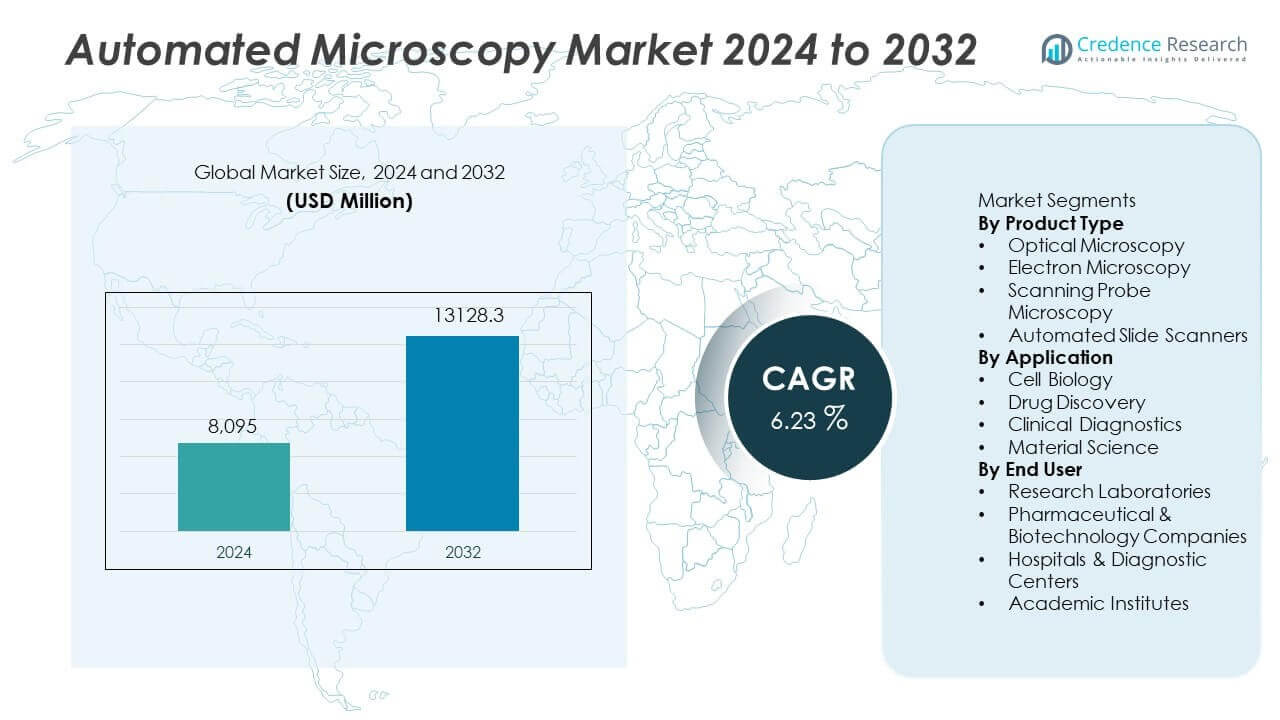
The Automated Microscopy market size reached USD 8,095 million in 2024 and is expected to reach USD 13,128.3 million by 2032, expanding at a CAGR of 6.23% during the forecast period.
| REPORT ATTRIBUTE | DETAILS |
|---|---|
| Historical Period | 2020-2023 |
| Base Year | 2024 |
| Forecast Period | 2025-2032 |
| Automated Microscopy Market Size 2024 | USD 8,095 million |
| Automated Microscopy Market, CAGR | 6.23% |
| Automated Microscopy Market Size 2032 | USD 13,128.3 million |
Automated Microscopy Market Insights
- Rising demand for high-throughput cell imaging and rapid data analysis drives strong adoption, with optical microscopy holding 52% share due to wide application in life sciences and diagnostics.
- AI-driven image processing, digital pathology, and remote imaging platforms shape key trends as laboratories shift toward automated workflows, while top players invest in faster, high-resolution systems.
- Competitive growth accelerates as manufacturers enhance data management, automation, and workflow integration, though high equipment cost and complex system operation remain major restraints.
- North America leads with 39% share driven by strong research funding, Europe holds 32% share supported by drug discovery and diagnostics, and Asia Pacific at 21% shows fastest expansion with growing biotechnology activity.
Automated Microscopy Market Segmentation Analysis:
By Product Type
Optical microscopy leads the product type segment with 52% share due to strong adoption in life sciences, clinical workflows, and imaging-based research. Automated platforms improve precision, throughput, and reproducibility, supporting advanced live-cell imaging and digital pathology needs. Electron microscopy and scanning probe systems provide high-resolution imaging for complex structural analysis, while automated slide scanners enhance workflow efficiency. Demand rises as research groups adopt automation to reduce manual errors and increase imaging speed. Continued growth in biological analysis strengthens optical dominance across laboratories, diagnostic facilities, and pharmaceutical research environments.
- For instance, Nikon’s AX R confocal system captures 720 frames per second, enabling fast live-cell imaging in high-resolution formats.
By Application
Cell biology holds 48% share in the application segment, driven by high usage in imaging-based cellular analysis, disease research, and live-cell monitoring. Automated microscopy improves accuracy in cell counting, morphology tracking, and intracellular visualization. Drug discovery benefits from automated imaging screens that support rapid compound evaluation and toxicity analysis. Clinical diagnostics sees rising adoption for pathology review and early disease detection. Material science applications continue to expand in nanostructure analysis and surface characterization. Growing investment in biological research and regenerative medicine reinforces cell biology’s leading position.
- For instance, Leica Microsystems’ THUNDER imager removes out-of-focus blur in thick tissues using computational clearing, improving cell imaging speed to 30 frames per second.
By End User
Research laboratories lead the end user segment with 44% share, supported by strong investment in advanced imaging systems for biological and material research. Pharmaceutical and biotechnology companies follow with rising use for drug development and high-throughput screening. Hospitals and diagnostic centers adopt automated microscopy for pathology evaluation and clinical decision support, improving diagnostic speed and accuracy. Academic institutes expand usage for education, training, and research integration. Demand increases as automation improves data output, standardization, and workflow efficiency across sectors. Research laboratories maintain leadership due to wider adoption of high-resolution and AI-enabled imaging platforms.
Key Growth Drivers
Rising Demand for High-Throughput Imaging The need for high-throughput imaging drives strong adoption of automated microscopy, especially in research and clinical workflows. Automated systems improve speed, accuracy, and repeatability, allowing users to process large sample volumes with minimal manual input. This capability supports complex biological studies, live-cell imaging, and drug screening. Growing interest in precision diagnostics and advanced pathology strengthens reliance on automated platforms to reduce errors and standardize results. As imaging workflows expand, users value systems that deliver consistent output, faster turnaround, and scalable analysis, reinforcing long-term market demand.
- For instance, PerkinElmer’s Opera Phenix screens 384-well plates in under 12 minutes, supporting rapid phenotypic imaging.
Increasing Investment in Life Sciences and Drug Discovery
Life sciences and pharmaceutical industries invest heavily in imaging automation to improve research efficiency and reduce development timelines. Automated microscopy supports compound screening, toxicity evaluation, and biomarker identification, driving better decision-making. AI-based image analysis enhances accuracy and speeds data interpretation. Drug discovery teams rely on automated platforms to streamline processes and optimize laboratory resources. Expanding research in oncology, immunology, and regenerative medicine further increases adoption. Strong funding pipeline and collaboration among research groups, biotech firms, and universities reinforce growth across global markets.
- For instance, ImageXpress Micro Confocal from Molecular Devices acquires 7,000 images per hour, supporting cancer and stem cell studies.
Advancements in Imaging Technology and AI Integration
Improved imaging systems, advanced optics, and AI-powered analytics enhance microscopy performance and expand application boundaries. These innovations deliver sharper resolution, improved contrast, and higher processing speed. Automated microscopy benefits from intelligent algorithms that classify images, detect anomalies, and support real-time decisions. Integration with cloud platforms enables remote access, data sharing, and scalable storage. Technology upgrades also support 3D imaging and live-cell observation, creating new opportunities across clinical and research fields. These advancements increase system value and encourage wider adoption among laboratories and diagnostic centers.
Key Trends & Opportunities
Growing Use of Digital Pathology and Remote Diagnostics
Digital pathology adoption accelerates demand for automated microscopy by improving image quality, workflow consistency, and remote accessibility. Clinicians use automated systems to analyze slide images with greater precision and faster reporting. Remote review and telepathology reduce geographical barriers and support decision-making across distributed care networks. This trend strengthens opportunities for healthcare digitization, cloud platforms, and integrated diagnostic solutions. Rising focus on early disease detection and patient outcome improvement continues to push automated imaging investment across hospitals and diagnostic centers.
- For instance, Hamamatsu NanoZoomer S60 delivers whole-slide images at 230 nanometers per pixel, improving diagnostic clarity for remote reporting.
Expansion in Material Science and Nanotechnology Research
Material science applications grow as automated microscopy supports advanced surface analysis, nanostructure evaluation, and defect detection. Users in semiconductors, electronics, and advanced manufacturing rely on automated imaging to ensure product accuracy and performance reliability. Nanotechnology research expands demand for precision visualization and automated measurements. As industrial innovation accelerates, companies adopt automated systems to enhance productivity and reduce inspection errors. This shift strengthens non-clinical market growth and creates opportunities for specialized imaging platforms.
- For instance, the Hitachi SU9000 delivers ultra-high resolution and lattice imaging, supporting high-precision material analysis.
Key Challenges
High Equipment Cost and Budget Constraints
Automated microscopy systems require significant upfront investment, limiting adoption among small laboratories, academic centers, and emerging economies. Advanced configurations with AI modules and precision optics increase purchase cost and maintenance spending. Budget constraints slow replacement cycles and restrict expansion into new applications. Limited reimbursement and funding gaps in certain regions also influence purchase decisions. Manufacturers work to lower pricing and offer modular systems, but affordability remains a key challenge.
Complexity in System Operation and Integration
Automated microscopy systems demand skilled operation, specialized training, and technical support. Users may face challenges in workflow setup, image processing, and analytical software integration. Compatibility issues with data platforms and laboratory information systems can slow adoption. Complex systems increase onboarding time and create dependency on technical specialists. Continuous training and user-friendly upgrades help reduce operational barriers, but system complexity continues to affect implementation speed and overall user experience.
Regional Analysis
North America
North America leads the automated microscopy market with 39% share, supported by strong research spending and high adoption rates across pharmaceutical, biotechnology, and clinical institutions. The region benefits from advanced imaging infrastructure, strong digital pathology penetration, and increasing demand for automated diagnostic workflows. Growth in oncology and personalized medicine strengthens market expansion as organizations invest in high-throughput imaging and AI-based analysis tools. Presence of key manufacturers and academic research hubs drives continuous product development and system upgrades. Government-backed research funding and strong commercial collaboration reinforce long-term regional leadership.
Europe
Europe holds 32% share in the automated microscopy market, driven by growing investment in research and advanced diagnostic capabilities across hospitals and laboratories. Strong regulatory frameworks and focus on clinical quality encourage adoption of automated imaging platforms. Expansion in digital pathology and molecular testing increases operational efficiency. Pharmaceutical and biotechnology organizations integrate automated systems to accelerate drug discovery and reduce human error. Collaborative research networks across Germany, the UK, and France support continued technological progress. Rising academic projects and demand for high-resolution imaging further strengthen Europe’s position in the market.
Asia Pacific
Asia Pacific accounts for 21% share and remains the fastest-growing region in the automated microscopy market. Rising research investment, expanding biotechnology infrastructure, and strong growth in clinical diagnostics drive demand. China, Japan, and South Korea increase spending on high-throughput imaging systems to support disease research, drug development, and nanotechnology. Hospitals adopt automated platforms to improve accuracy and reduce manual workload. Growing academic enrollment in life sciences and supportive government policies enhance technology exposure. Rapid industrial development in material science strengthens long-term applications.
Latin America, Middle East and Africa
Latin America, Middle East and Africa together hold 8% share in the automated microscopy market. Adoption grows as healthcare systems expand diagnostic capabilities and research networks. Cost sensitivity and limited infrastructure slow progress, yet demand rises with increasing cancer screening, infectious disease testing, and material analysis. Partnerships with global technology providers improve product access and training. Digital transformation efforts support gradual integration of automated imaging tools across clinical and academic settings. As economic conditions improve and research investments rise, these regions show strong market potential for future expansion.
Automated Microscopy Market Segmentations:
By Product Type
- Optical Microscopy
- Electron Microscopy
- Scanning Probe Microscopy
- Automated Slide Scanners
By Application
- Cell Biology
- Drug Discovery
- Clinical Diagnostics
- Material Science
By End User
- Research Laboratories
- Pharmaceutical & Biotechnology Companies
- Hospitals & Diagnostic Centers
- Academic Institutes
By Geography
- North America
- U.S.
- Canada
- Mexico
- Europe
- Germany
- France
- U.K.
- Italy
- Spain
- Rest of Europe
- Asia Pacific
- China
- Japan
- India
- South Korea
- South-east Asia
- Rest of Asia Pacific
- Latin America
- Brazil
- Argentina
- Rest of Latin America
- Middle East & Africa
- GCC Countries
- South Africa
- Rest of the Middle East and Africa
Competitive Landscape
Competitive landscape analysis shows leading companies including Nikon Corporation, Carl Zeiss AG, Leica Microsystems, Olympus Corporation, Thermo Fisher Scientific, Hitachi High-Tech Corporation, Bruker Corporation, JEOL Ltd., Keyence Corporation, and Oxford Instruments driving innovation and market expansion in automated microscopy. These players focus on advanced imaging technologies, AI-enabled analysis software, and automated workflow solutions to enhance accuracy and productivity in research, diagnostics, and industrial applications. Strategic investments in digital pathology, nanotechnology, and material science strengthen product portfolios and expand user reach.
Companies also enhance system integration, cloud connectivity, and data management to support high-throughput imaging and remote collaboration. Partnerships with academic institutions, pharmaceutical firms, and diagnostic centers accelerate product testing and market penetration. Continuous improvement in resolution, speed, and automation capabilities supports stronger competitive positioning. Leading manufacturers pursue mergers, acquisitions, and regional expansion to gain share in emerging markets while maintaining strong presence in established research and clinical hubs.
Key Player Analysis
- Nikon Corporation
- Carl Zeiss AG
- Leica Microsystems
- Olympus Corporation
- Thermo Fisher Scientific
- Hitachi High-Tech Corporation
- Bruker Corporation
- JEOL Ltd.
- Keyence Corporation
- Oxford Instruments
Recent Developments
- In July 2025, Nikon Corporation marked the 100th anniversary of its microscope business, highlighting ongoing innovation, including AI integration and automation in life-science imaging tools.
- In May 2025, Carl Zeiss AG unveiled the Smartzoom 100 digital microscope, designed for fast, automated optical inspections with enhanced real-time image quality.
- In May 2025, Leica Microsystems released the Aivia 15 AI-powered image analysis software, simplifying automated image workflows and batch analysis for scientists.
Report Coverage
The research report offers an in-depth analysis based on Product Type, Application, End User and Geography. It details leading market players, providing an overview of their business, product offerings, investments, revenue streams, and key applications. Additionally, the report includes insights into the competitive environment, SWOT analysis, current market trends, as well as the primary drivers and constraints. Furthermore, it discusses various factors that have driven market expansion in recent years. The report also explores market dynamics, regulatory scenarios, and technological advancements that are shaping the industry. It assesses the impact of external factors and global economic changes on market growth. Lastly, it provides strategic recommendations for new entrants and established companies to navigate the complexities of the market.
Future Outlook
- AI-driven imaging will expand automation and enhance data accuracy across research fields.
- High-throughput screening demand will rise as drug discovery activity accelerates.
- Digital pathology adoption will grow, supported by faster diagnostics and remote review.
- Cloud platforms will improve data storage, sharing, and collaborative research workflows.
- Automated microscopy systems will become more compact and user-friendly for wider access.
- Material science applications will increase with stronger nanotechnology and semiconductor research.
- Integration with robotic sample handling will enhance workflow speed and productivity.
- Academic and clinical partnerships will expand product testing and innovation pipelines.
- Automation demand will rise in emerging markets as research investment increases.
- Sustainability and energy-efficient system design will gain priority among manufacturers.

Request a Free Sample
Fill in your details and we'll send you a free sample report.
- Sample data tables & charts
- Research methodology
Market Dynamics
High-Throughput Imaging Demand
Automated microscopy enables rapid, large-scale imaging and analysis, which is essential for modern research and clinical workflows. This capability reduces manual errors, increases sample processing speed, and supports complex biological and drug discovery studies.
Investment in Life Sciences and Drug Discovery
Pharmaceutical and biotechnology sectors are investing heavily in automated microscopy to accelerate compound screening, toxicity testing, and biomarker identification. This investment streamlines research processes and shortens development timelines, driving market growth.
Advancements in Imaging Technology and AI Integration
Continuous improvements in optics, imaging resolution, and AI-powered analytics are expanding the capabilities of automated microscopy. These advancements enable sharper images, faster data processing, and intelligent image classification, making systems more valuable for both research and diagnostics.
Expansion of Digital Pathology and Remote Diagnostics
The adoption of digital pathology and remote imaging platforms is increasing, allowing clinicians and researchers to analyze and share high-quality images efficiently. This trend supports telemedicine, improves diagnostic accuracy, and expands access to advanced imaging in distributed healthcare networks.
Growth in Material Science and Nanotechnology Applications
Automated microscopy is increasingly used in material science and nanotechnology for surface analysis, defect detection, and nanostructure evaluation. Industrial and academic demand for precision imaging in these fields is driving broader adoption of automated systems beyond traditional life sciences.
Need a Custom Version of This Report?
Tailor the scope, geography, or segments to your exact requirements.
- Custom geography or segment scope
- Direct access to our analyst team
Frequently Asked Questions
What is the current market size for Automated Microscopy market, and what is its projected size in 2032?
At what Compound Annual Growth Rate is the Automated Microscopy market projected to grow between 2024 and 2032?
Which Automated Microscopy market segment held the largest share in 2024?
What are the primary factors fueling the growth of the Automated Microscopy market?
Who are the leading companies in the Automated Microscopy market?
Which region commanded the largest share of the Automated Microscopy market in 2024?
Table of Content
Chapter 1 Market Segmentation
- 1.1 Segmentation Framework
- 1.1.1 Product and Service Classification
- 1.1.2 Application and End-Use Classification
- 1.1.3 Technology and Solution Classification
- 1.1.4 Customer and Distribution Channel Classification
- 1.1.5 Geographic Segmentation
- 1.1.6 Market Segment Definitions and Boundaries
- 1.2 By End User
- 1.2.1 Research Laboratories
- 1.2.2 Pharmaceutical & Biotechnology Companies
- 1.2.3 Hospitals & Diagnostic Centers
- 1.2.4 Academic Institutes
- 1.3 By Application
- 1.3.1 Cell Biology
- 1.3.2 Drug Discovery
- 1.3.3 Clinical Diagnostics
- 1.3.4 Material Science
- 1.4 By Product Type
- 1.4.1 Optical Microscopy
- 1.4.2 Electron Microscopy
- 1.4.3 Scanning Probe Microscopy
- 1.4.4 Automated Slide Scanners
Chapter 2 Introduction
- 2.1 Report Objectives and Scope
- 2.2 Product Definition and Industry Terminology
- 2.3 Market Inclusions and Exclusions
- 2.4 Research Process
- 2.4.1 Primary Research and Expert Interviews
- 2.4.2 Secondary Research and Source Review
- 2.4.3 Top-Down and Bottom-Up Estimation
- 2.4.4 Data Triangulation and Verification
- 2.5 Market Size Measurement Basis
- 2.5.1 2024: USD 8,095 million → 2032: USD 13,128.3 million
- 2.6 Historical and Forecast Reference Periods
- 2.6.1 Base Year: 2024
- 2.6.2 Forecast Period: 2024-2032
- 2.7 Research Assumptions and Limitations
Chapter 3 Executive Summary
- 3.1 Market Snapshot and Key Findings
- 3.2 Base-Year Market Size, 2024
- 3.3 Forecast Market Size, 2032
- 3.4 Revenue and Volume Growth Outlook
- 3.5 Key Demand and Supply Indicators
- 3.6 Leading Market Segments
- 3.7 Fastest-Growing Market Opportunities
- 3.8 Regional Performance Highlights
- 3.9 Technology and Industry Transformation
- 3.10 Competitive Landscape Summary
- 3.11 Analyst View and Strategic Implications
Chapter 4 Global Automated Microscopy Market Trends and Developments
- 4.1 Historical Industry Development
- 4.2 Recent Market Trends and Developments
- 4.3 Demand and Customer Behavior Trends
- 4.4 Technology and Product Innovation
- 4.5 Artificial Intelligence, Automation and Digitalization
- 4.6 Local Manufacturing and Supply Chain Realignment
- 4.7 Industry Partnerships, Mergers and Acquisitions
- 4.8 Sustainability and Circular Economy Developments
- 4.9 Government and Private Sector Investment Trends
- 4.10 Emerging Business Models and Commercialization
- 4.11 Industry Developments and Announcements
Chapter 5 Global Automated Microscopy Market Production, Supply and Demand Analysis
- 5.1 Demand Trend and Consumption Analysis
- 5.2 Demand Forecast, 2024-2032
- 5.3 Production and Output Trend
- 5.4 Production and Output Forecast, 2024-2032
- 5.5 Installed Capacity and Capacity Utilization
- 5.6 Company-Wise Production Plants and Statistics
- 5.6.1 Installed Production Capacity
- 5.6.2 Actual Production
- 5.6.3 Planned Capacity and Expansion Targets
- 5.7 Supply Chain Structure and Procurement Trends
- 5.8 Supply-Demand Gap and Bottlenecks
- 5.9 Import Dependence and Sourcing Structure
- 5.10 Contract Manufacturing and Outsourcing
- 5.11 Regional Supply and Demand Concentration
Chapter 6 Global Automated Microscopy Market Pricing Analysis
- 6.1 Pricing Structure and Measurement
- 6.2 Historical Pricing Trends
- 6.3 Pricing Outlook, 2024-2032
- 6.4 Average Selling Price and Unit Economics
- 6.5 Pricing by Product and Market Segment
- 6.6 Geographic Pricing Differences
- 6.7 Key Input, Energy, Labor and Logistics Costs
- 6.8 Contract Pricing and Purchasing Models
- 6.9 Pricing Sensitivity and Competitive Positioning
- 6.10 Price, Margin and Profitability Implications
Chapter 7 Global Automated Microscopy Market Dynamics
- 7.1 Market Growth Drivers
- 7.1.1 Demand-Side Drivers
- 7.1.2 Technology and Innovation Drivers
- 7.1.3 Infrastructure and Investment Drivers
- 7.1.4 Regulatory and Policy Drivers
- 7.2 Market Restraints
- 7.2.1 Cost and Affordability Constraints
- 7.2.2 Technology and Adoption Barriers
- 7.2.3 Supply Chain and Operational Constraints
- 7.3 Market Challenges
- 7.3.1 Competitive Pressure and Margin Erosion
- 7.3.2 Skills, Infrastructure and Implementation Gaps
- 7.4 Emerging Market Opportunities
- 7.5 Market Dynamics Impact and Time-Horizon Assessment
Chapter 8 Global Automated Microscopy Value Chain Analysis
- 8.1 Industry Value Chain Overview
- 8.2 Upstream Suppliers and Critical Inputs
- 8.3 Technology and Component Providers
- 8.4 Manufacturing or Service Delivery
- 8.5 Distribution, Channel Partners and Integrators
- 8.6 Downstream Applications and End Users
- 8.7 Value Addition and Profit Pools
- 8.8 Vertical Integration and Outsourcing
- 8.9 Supplier Concentration and Risk
- 8.10 Supply Chain Localization and Resilience
Chapter 9 Global Automated Microscopy Market Regulations and Policies
- 9.1 Relevant Laws, Standards and Compliance Frameworks
- 9.2 Product, Service, Safety and Quality Requirements
- 9.3 Government Policies, Incentives and Subsidies
- 9.4 Imports, Exports and Trade Barriers
- 9.5 Public Procurement and Local Content Requirements
- 9.6 Environmental and Sustainability Compliance
- 9.7 Upcoming Policy Changes and Market Implications
Chapter 10 Global Automated Microscopy Market Hotspots and Opportunities
- 10.1 Market Opportunity Mapping and Growth Hotspots
- 10.2 High-Growth Applications and Customer Groups
- 10.3 Underserved Markets and White-Space Opportunities
- 10.4 Emerging Technology and Product Opportunities
- 10.5 New Capacity and Investment Hotspots
- 10.6 Market Entry and Expansion Opportunities
- 10.7 Distribution and Partnership Opportunities
- 10.8 Near-Term and Long-Term Commercial Potential
- 10.9 Opportunity Attractiveness and Execution Risks
Chapter 11 Global Automated Microscopy Market Outlook, 2024-2032
- 11.1 Market Size and Analysis
- 11.1.1 Revenue (Market Measurement: 2024: USD 8,095 million → 2032: USD 13,128.3 million)
- 11.1.2 Market Volume and Quantity Sold
- 11.1.3 Historical Market Size
- 11.1.4 Base-Year Market Size, 2024
- 11.2 Market Forecast, 2024-2032
- 11.2.1 Revenue Forecast to 2032
- 11.2.2 Volume Forecast to 2032
- 11.2.3 CAGR and Year-on-Year Growth
- 11.2.4 Incremental Revenue Opportunity
- 11.3 Forecast Assumptions and Scenario Analysis
- 11.3.1 Base-Case Forecast
- 11.3.2 Optimistic and Conservative Scenarios
- 11.3.3 Technology, Pricing and Policy Sensitivities
- 11.4 Market Attractiveness and Growth Outlook
Chapter 12 Global Automated Microscopy Market Segmentation and Outlook
- 12.1 Segmentation Summary and Market Shares, 2024
- 12.2 Largest and Fastest-Growing Segments
- 12.3 By End User - Market Size and Forecast, 2024-2032
- 12.3.1 Segment Definition and Scope
- 12.3.2 Historical Market Size
- 12.3.3 Revenue Forecast, 2024-2032
- 12.3.4 Volume Forecast, 2024-2032
- 12.3.5 Base-Year Market Share, 2024
- 12.3.6 Segment CAGR and Growth Drivers
- 12.3.7 Subsegment Market Size and Forecast
- 12.3.7.1 Research Laboratories
- 12.3.7.2 Pharmaceutical & Biotechnology Companies
- 12.3.7.3 Hospitals & Diagnostic Centers
- 12.3.7.4 Academic Institutes
- 12.3.8 Subsegment Pricing and Adoption Trends
- 12.3.9 Leading Suppliers and Competition
- 12.3.10 Regional Demand and Opportunities
- 12.4 By Application - Market Size and Forecast, 2024-2032
- 12.4.1 Segment Definition and Scope
- 12.4.2 Historical Market Size
- 12.4.3 Revenue Forecast, 2024-2032
- 12.4.4 Volume Forecast, 2024-2032
- 12.4.5 Base-Year Market Share, 2024
- 12.4.6 Segment CAGR and Growth Drivers
- 12.4.7 Subsegment Market Size and Forecast
- 12.4.7.1 Cell Biology
- 12.4.7.2 Drug Discovery
- 12.4.7.3 Clinical Diagnostics
- 12.4.7.4 Material Science
- 12.4.8 Subsegment Pricing and Adoption Trends
- 12.4.9 Leading Suppliers and Competition
- 12.4.10 Regional Demand and Opportunities
- 12.5 By Product Type - Market Size and Forecast, 2024-2032
- 12.5.1 Segment Definition and Scope
- 12.5.2 Historical Market Size
- 12.5.3 Revenue Forecast, 2024-2032
- 12.5.4 Volume Forecast, 2024-2032
- 12.5.5 Base-Year Market Share, 2024
- 12.5.6 Segment CAGR and Growth Drivers
- 12.5.7 Subsegment Market Size and Forecast
- 12.5.7.1 Optical Microscopy
- 12.5.7.2 Electron Microscopy
- 12.5.7.3 Scanning Probe Microscopy
- 12.5.7.4 Automated Slide Scanners
- 12.5.8 Subsegment Pricing and Adoption Trends
- 12.5.9 Leading Suppliers and Competition
- 12.5.10 Regional Demand and Opportunities
- 12.6 Segment Growth Comparison
- 12.7 Segment Attractiveness and Priority Matrix
Chapter 13 Global Automated Microscopy End-Use and Application Market Outlook
- 13.1 End-Use Industry and Customer Demand Structure
- 13.2 Leading Applications and Customer Groups
- 13.3 End-Use Market Size, Share and Forecast
- 13.4 Major End-Use Industry Deep Dives
- 13.4.1 Customer Requirements and Use Cases
- 13.4.2 Demand and Replacement Cycles
- 13.4.3 Technical and Regulatory Considerations
- 13.4.4 Purchasing and Procurement Models
- 13.4.5 Leading Vendors and Distribution Channels
- 13.4.6 Forecast and Commercial Opportunities
- 13.5 Emerging Applications and Cross-Segment Demand
- 13.6 End-Use Industry Investment Priorities
Chapter 14 Global Automated Microscopy Geographic Market Outlook, 2024-2032
- 14.1 Regional Market Size and Share, 2024
- 14.2 Regional Market Forecast, 2024-2032
- 14.3 Regional Pricing, Production and Demand Differences
- 14.4 North America
- 14.4.1 United States
- 14.4.2 Canada
- 14.4.3 Mexico
- 14.5 Europe
- 14.5.1 Germany
- 14.5.2 France
- 14.5.3 Italy
- 14.5.4 United Kingdom
- 14.5.5 Spain
- 14.5.6 Poland
- 14.5.7 Russia
- 14.5.8 Netherlands
- 14.5.9 Belgium
- 14.5.10 Sweden
- 14.5.11 Denmark
- 14.5.12 Norway
- 14.5.13 Rest of Europe
- 14.6 Asia Pacific
- 14.6.1 China
- 14.6.2 India
- 14.6.3 Japan
- 14.6.4 South Korea
- 14.6.5 Thailand
- 14.6.6 Indonesia
- 14.6.7 Vietnam
- 14.6.8 Malaysia
- 14.6.9 Australia
- 14.6.10 Rest of Asia Pacific
- 14.7 Latin America
- 14.7.1 Brazil
- 14.7.2 Argentina
- 14.7.3 Colombia
- 14.7.4 Chile
- 14.7.5 Rest of Latin America
- 14.8 Middle East
- 14.8.1 Saudi Arabia
- 14.8.2 United Arab Emirates
- 14.8.3 Turkey
- 14.8.4 Israel
- 14.8.5 Iran
- 14.8.6 Rest of the Middle East
- 14.9 Africa
- 14.9.1 South Africa
- 14.9.2 Egypt
- 14.9.3 Nigeria
- 14.9.4 Morocco
- 14.9.5 Rest of Africa
- 14.10 Regional Investment, Policy and Supply Chain Differences
- 14.11 Regional Competitive Landscape
- 14.12 Geographic Growth Hotspots
Chapter 15 Global Automated Microscopy Technology, Innovation and Sustainability Outlook
- 15.1 Technology Landscape and Maturity
- 15.2 Product, Process and Service Innovation
- 15.3 AI, Automation and Digital Tools in the Industry
- 15.4 Technology Adoption and Performance Benchmarking
- 15.5 Innovation Pipeline and R&D Investment
- 15.6 Patent and Intellectual Property Trends
- 15.7 Energy Efficiency and Resource Management
- 15.8 Sustainability, Recycling and Circularity
- 15.9 Technology Roadmap, 2024-2032
- 15.10 Risks of Obsolescence and Technology Substitution
Chapter 16 Global Automated Microscopy Market Key Strategic Imperatives
- 16.1 Growth and Market Entry Priorities
- 16.2 High-Return Products and Segments
- 16.3 Pricing, Profitability and Cost Optimization
- 16.4 Technology Investment and Product Differentiation
- 16.5 Supply Chain Localization and Resilience
- 16.6 Distribution and Customer Acquisition
- 16.7 Partnership, Acquisition and Capacity Strategy
- 16.8 Regional Expansion Priorities
- 16.9 Short-, Medium- and Long-Term Actions
Chapter 17 Competition Outlook
- 17.1 Industry Competition Characteristics
- 17.2 Market Structure and Concentration
- 17.3 Market Share and Competitive Positioning, 2024
- 17.4 Company-Wise Revenue and Product Benchmarking
- 17.5 Production and Service Capacity Benchmarking
- 17.6 Technology, Pricing and Differentiation
- 17.7 Regional Footprint and Distribution Strength
- 17.8 Mergers, Acquisitions and Strategic Alliances
- 17.9 New Entrants and Competitive Threats
- 17.10 Porter's Five Forces and Industry Attractiveness
- 17.11 Competitive Outlook, 2024-2032
Chapter 18 Company Profiles
- 18.1 Company Coverage and Selection Criteria
- 18.2 Nikon Corporation
- 18.2.1 Business Description
- 18.2.2 Company Ownership and Geographic Presence
- 18.2.3 Product and Service Portfolio
- 18.2.4 Manufacturing and Operating Footprint
- 18.2.5 Production Capacity and Expansion Plans
- 18.2.6 Financial Performance and Investment
- 18.2.7 Market Share and Competitive Position
- 18.2.8 Technology and Innovation Capabilities
- 18.2.9 Strategic Alliances or Partnerships
- 18.2.10 Recent Developments
- 18.2.11 Growth Strategy and Outlook
- 18.3 Carl Zeiss AG
- 18.4 Leica Microsystems
- 18.5 Olympus Corporation
- 18.6 Thermo Fisher Scientific
- 18.7 Hitachi High-Tech Corporation
- 18.8 Bruker Corporation
- 18.9 JEOL Ltd.
- 18.10 Keyence Corporation
- 18.11 Oxford Instruments
- 18.12 Other Relevant Market Participants
Note: Every listed company is profiled on the structure shown under the first company. The company list is preliminary and may change based on research findings, market developments, data availability and client requirements.
Chapter 19 Disclaimer
- 19.1 Research and Forecast Disclaimer
- 19.2 Data Source and Estimation Limitations
Note: The depth of individual sections depends on data availability for this market. Volume, capacity, trade and other unit-based metrics are included where applicable.