
Market Overview
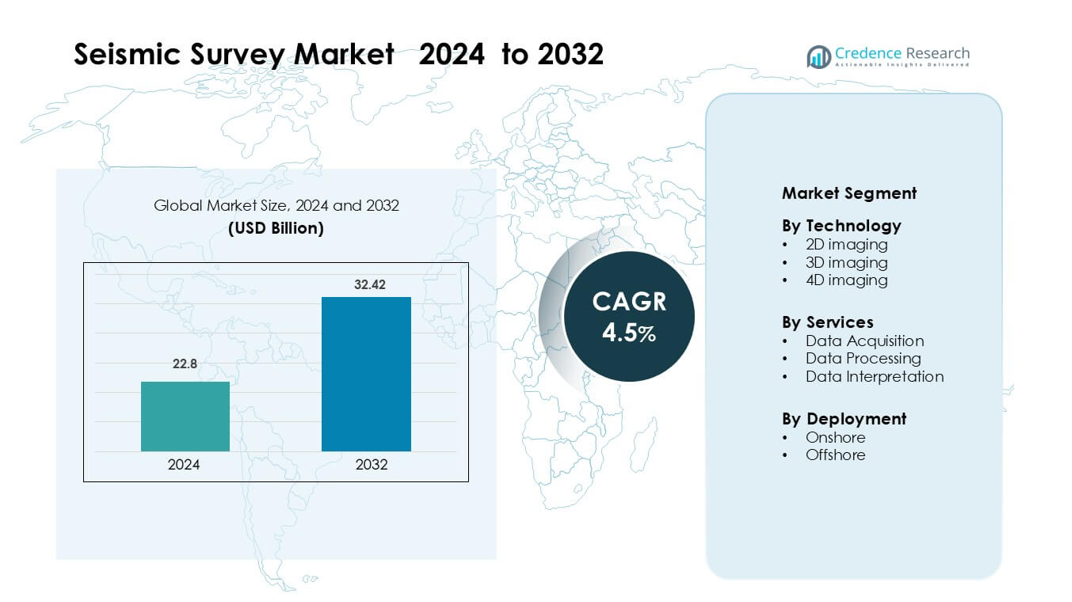
Seismic Survey Market was valued at USD 22.8 billion in 2024 and is anticipated to reach USD 32.42 billion by 2032, growing at a CAGR of 4.5 % during the forecast period.
| REPORT ATTRIBUTE | DETAILS |
|---|---|
| Historical Period | 2020-2023 |
| Base Year | 2024 |
| Forecast Period | 2025-2032 |
| Seismic Survey Market Size 2024 | USD 22.8 billion |
| Seismic Survey Market, CAGR | 4.5% |
| Seismic Survey Market Size 2032 | USD 32.42 billion |
The Seismic Survey Market is shaped by leading companies such as Fugro NV, Dawson Geophysical Co., Agile Seismic LLC, Fairfield Geotechnologies, Asian Energy Services Ltd., Amerapex Corp., Echo Seismic Ltd., Alphageo India Ltd., BGP Inc., and China Oilfield Services Ltd., all of which enhance their position through advanced 3D and 4D imaging, ocean-bottom node deployment, and AI-supported data processing. These players focus on improving subsurface clarity, reducing exploration risk, and supporting energy companies across both offshore and onshore environments. North America leads the global market with about 36% share in 2024, driven by strong offshore activity in the Gulf of Mexico and continued demand from shale-rich regions.
Market Insights
- Seismic Survey Market was valued at USD 22.8 billion in 2024 and is anticipated to reach USD 32.42 billion by 2032, growing at a CAGR of 4.5 % during the forecast period.
- Growing investments in deepwater, ultra-deepwater, and shale exploration drive demand for 3D imaging, which holds the dominant 58% share due to higher accuracy and reduced drilling risk.
- AI-enabled processing, ocean-bottom node deployment, and multi-client survey expansion shape major trends as operators seek clearer imaging and cost-efficient exploration models.
- Competition intensifies as key companies focus on advanced subsurface mapping, digital workflows, and low-noise acquisition systems to strengthen global reach across offshore and onshore fields.
- North America leads with 36% share, supported by strong Gulf of Mexico activity, while Asia-Pacific and Europe follow due to expanding offshore licensing rounds and rising adoption of advanced seismic technologies
Market Segmentation Analysis:
By Technology
3D imaging holds the dominant share at about 58% in 2024 due to its higher resolution, stronger subsurface clarity, and reliability for oil and gas exploration. Demand rises as energy companies depend on 3D mapping to cut drilling risk and improve reservoir accuracy. Adoption grows across mature and frontier basins as operators favor advanced seismic volumes to support capital-efficient field development. 2D surveys remain useful for regional scans, while 4D imaging expands through rising use in production monitoring and reservoir change detection.
- For instance, Shell used 3D seismic in its Gulf of Mexico Mars field by shooting up to 500 parallel profiles, spaced between 50 and 200 feet, which helped transition from reliance on 2D to 3D so much that by 1996 nearly 80% of its wells in the region were being sited using 3D data.
By Services
Data acquisition leads this segment with nearly 52% share in 2024 because exploration companies prioritize high-quality field recordings to support accurate geophysical decisions. Growth strengthens as operators expand survey footprints across deepwater, ultra-deepwater, and tight onshore fields. Data processing gains momentum through AI-based noise reduction and enhanced imaging algorithms, while data interpretation services rise as exploration teams rely on faster structural and stratigraphic insights to guide well placement and field appraisal.
- For instance, Fairfield Geotechnologies acquired a multi-client 3D survey in the Delaware Basin covering 440 km² with high-resolution data, thereby significantly expanding its data acquisition footprint.
By Deployment
Offshore deployment accounts for the dominant share at roughly 55% in 2024 driven by large-scale investments in deepwater and ultra-deepwater exploration. Energy companies prefer offshore surveys due to higher resource potential and improved economics linked to new basin discoveries. Onshore activity remains steady across shale, tight oil, and coal bed methane regions, supported by lower operational costs and rapid survey execution. Offshore momentum continues as governments approve new offshore blocks and operators shift toward high-impact seismic campaigns.
Key Growth Drivers
Rising Energy Exploration Across New Basins
Growing exploration in deepwater, ultra-deepwater, and frontier basins drives strong demand for advanced seismic surveys. Global energy companies focus on new hydrocarbon prospects as mature fields decline and national governments open fresh offshore blocks. This expansion increases the need for precise subsurface imaging that reduces drilling risk and improves reservoir success rates. Operators rely on 2D, 3D, and 4D seismic programs to evaluate large acreage blocks before committing to capital-heavy wells. Many agencies also promote investments in unexplored regions through favorable bidding rounds and flexible licensing plans. As exploration spreads across Africa, South America, and Asia-Pacific, seismic players gain steady project pipelines.
- For instance, TGS and Viridien are conducting a multi-client 3D seismic survey covering 5,300 km² in the Barreirinhas Basin offshore Brazil a frontier deepwater area using the Ramform Tethys streamer vessel with their proprietary GeoStreamer technology.
Adoption of Advanced Imaging Technologies
High-resolution 3D and 4D imaging methods strengthen the market as operators seek clearer reservoir views and more predictable development outcomes. Modern seismic systems deliver sharper depth accuracy, faster processing, and improved noise reduction across complex terrains. Companies use these tools to study reservoir structure, track fluid movement, and support long-term production planning. The use of advanced sensors, ocean-bottom nodes, and broadband sources further boosts data quality across offshore and onshore environments. Many energy firms also shift toward digital workflows, using automated interpretation tools to shorten survey timelines. These innovations make seismic work more reliable and essential for major exploration and production cycles.
- For instance, BP has conducted four separate 4D ocean-bottom node (OBN) monitor surveys at its Atlantis field since 2009. In its 2022 survey, the receiver patch was densified to a grid of 200 × 200 m, improving the signal-to-noise ratio in subsalt imaging.
Growing Role of Seismic in Renewable and Infrastructure Projects
Seismic surveys now support wind farm siting, geothermal exploration, and major infrastructure planning, expanding the market beyond traditional oil and gas. Offshore wind developers depend on high-accuracy seabed mapping to select safe turbine locations and avoid geological hazards. Geothermal firms use seismic studies to pinpoint heat reservoirs, improving project success and reducing drilling uncertainty. Governments also use seismic work for tunnel planning, dam development, and hazard assessment in earthquake-prone regions. These applications create fresh opportunities for survey companies as global energy and construction sectors adopt subsurface imaging as a standard requirement. This shift provides new revenue channels and reduces reliance on fossil-fuel cycles.
Key Trend & Opportunity
Expansion of Ocean-Bottom Node (OBN) Surveys
Ocean-bottom node surveys are gaining traction because they deliver cleaner signals, richer depth imaging, and better results in complex offshore settings. As deepwater and ultra-deepwater projects grow worldwide, operators choose OBN systems to overcome challenges linked to uneven seabeds, salt bodies, and faults. This trend leads to higher long-term contract value because OBN programs often require larger deployment teams and extended survey durations. Companies also invest in automated node handling and faster retrieval systems to cut costs. The rise of offshore wind farms adds new opportunities for seabed imaging, helping OBN technology expand into multi-sector roles.
- For instance, TGS, working for ExxonMobil Guyana, carried out an OBN campaign covering 2,400 km² over 410 days, recovering their ZXPLR nodes 20 days ahead of schedule a record-stting deepwater node survey.
Integration of AI and Cloud-Based Processing
AI and cloud platforms create major opportunities by improving processing speed, reducing human error, and enhancing image clarity. Many service providers use machine-learning models to classify structures, remove noise, and highlight reservoir patterns within large datasets. Cloud tools allow teams across countries to collaborate in real time, accelerating interpretation work and enabling faster decisions for drilling or field planning. These digital tools also reduce hardware investment for operators, making seismic workflows more scalable. As data volumes grow with 3D and 4D imaging, AI-assisted processing becomes a core differentiator for seismic companies.
- For instance, PSS-Geo uses a cloud-based inversion platform where users upload post-stack seismic data; their ML models predict rock and fluid properties (e.g., porosity, density, fluid type) in the cloud, based on well data and pre-trained models.
Multi-Client Survey Expansion
Multi-client seismic programs expand as operators prefer cost-sharing models that reduce upfront exploration spending. Survey companies acquire large regional datasets and sell licenses to multiple buyers, creating recurring revenue and improving survey economics. Governments promote multi-client projects to attract new explorers by offering complete subsurface packages during licensing rounds. This model increases data availability, speeds up decision-making, and reduces risk for smaller exploration firms. As offshore bidding rounds accelerate in Africa, South America, and Asia-Pacific, demand for multi-client seismic libraries continues to rise.
Key Challenge
Environmental Regulations and Survey Restrictions
Stricter environmental rules pose a major challenge, especially for offshore projects that must avoid harm to marine ecosystems. Many regions mandate seasonal restrictions to protect migration cycles of marine mammals, delaying survey schedules and increasing operational costs. Noise-control requirements also demand specialized equipment and monitoring teams, raising compliance expenses. Environmental groups continue to scrutinize seismic activity, leading to legal actions and permitting delays in several countries. These factors reduce scheduling flexibility and add uncertainty to project planning. Companies must invest in quieter sources, advanced monitoring, and better mitigation strategies to maintain regulatory compliance.
High Operational Costs and Volatile Energy Spending
Seismic surveys require large vessels, heavy equipment, trained crews, and long deployment hours, leading to high operating costs. Offshore surveys are particularly expensive due to vessel day rates, fuel use, and logistical demands. When oil and gas prices fluctuate, operators cut exploration budgets, reducing seismic demand and causing financial pressure on service providers. Cost-sensitive firms may postpone large 3D or 4D campaigns, affecting long-term project pipelines. Survey companies face pressure to adopt automation, digital workflows, and efficient field systems to reduce expenses and remain competitive.
Regional Analysis
North America
North America leads the Seismic Survey Market with about 36% share in 2024 due to strong offshore investment in the Gulf of Mexico and steady shale-focused onshore programs. Energy companies use advanced 3D and 4D imaging to improve exploration accuracy and reduce drilling risks. Government licensing rounds, deepwater redevelopment, and rising interest in carbon storage monitoring also support regional demand. Technology adoption stays high as operators rely on ocean-bottom nodes and AI-enhanced processing tools. The market grows further as new offshore blocks open and integrated digital workflows become standard across upstream operations.
Europe
Europe holds nearly 24% share in 2024 driven by activity in the North Sea, Barents Sea, and Eastern Mediterranean. Operators prioritize seismic surveys to optimize mature basin redevelopment and improve recovery factors in aging offshore fields. The region also uses seismic imaging for wind farm siting, seabed hazard mapping, and carbon capture projects. Environmental standards remain strict, pushing companies toward low-noise sources and advanced monitoring tools. Multi-client surveys expand across frontier basins as governments support transparent data access. These factors help maintain steady long-term demand for high-resolution seismic programs.
Asia-Pacific
Asia-Pacific accounts for roughly 27% share in 2024 supported by major exploration programs in Australia, China, India, Indonesia, and Malaysia. Governments accelerate licensing rounds and encourage offshore expansion to strengthen domestic energy security. Deepwater prospects in the South China Sea and Northwest Shelf drive large-scale 3D campaigns. The region also adopts seismic tools for geothermal resource mapping and offshore wind assessment. Growing investment in national oil companies boosts demand for modern imaging systems and cloud-based processing. Asia-Pacific continues to offer strong long-term growth due to wide unexplored acreage and rising energy consumption.
Middle East & Africa
The Middle East & Africa region holds about 21% share in 2024 influenced by major exploration in the UAE, Saudi Arabia, Namibia, Angola, and Mozambique. National oil companies increase seismic activity to map new reservoirs and support capacity expansion. Africa becomes a key hotspot with growing multi-client surveys across frontier offshore basins. Advanced 3D and 4D programs rise as operators target deeper and more complex geological structures. Governments support long-term energy investment, creating stable project pipelines. The region also uses seismic imaging for infrastructure development and geothermal assessment.
South America
South America represents close to 18% share in 2024, mainly driven by extensive offshore activity in Brazil, Guyana, and Suriname. Deepwater and ultra-deepwater projects in the pre-salt basins fuel demand for large-scale 3D and ocean-bottom node surveys. Exploration companies pursue high-impact blocks, increasing reliance on precise seismic imaging to evaluate reservoir potential. Multi-client libraries expand as licensing rounds open new offshore zones. Onshore programs in Argentina’s shale regions add further demand. Rising international participation in South American basins supports strong long-term seismic growth across the region.
Market Segmentations:
By Technology
- 2D imaging
- 3D imaging
- 4D imaging
By Services
- Data Acquisition
- Data Processing
- Data Interpretation
By Deployment
- Onshore
- Offshore
By Geography
- North America
- U.S.
- Canada
- Mexico
- Europe
- Germany
- France
- U.K.
- Italy
- Spain
- Rest of Europe
- Asia Pacific
- China
- Japan
- India
- South Korea
- South-east Asia
- Rest of Asia Pacific
- Latin America
- Brazil
- Argentina
- Rest of Latin America
- Middle East & Africa
- GCC Countries
- South Africa
- Rest of the Middle East and Africa
Competitive Landscape
The Seismic Survey Market features strong competition among leading players such as Fugro NV, Dawson Geophysical Co., Agile Seismic LLC, Fairfield Geotechnologies, Asian Energy Services Ltd, Amerapex Corp., Echo Seismic Ltd., Alphageo India Ltd., BGP Inc., and China Oilfield Services Ltd., all of which focus on advanced imaging capabilities and global project execution. Companies strengthen their portfolios with high-resolution 3D and 4D surveys, ocean-bottom node technology, and AI-driven processing platforms that improve data clarity and operational efficiency. Many providers expand multi-client libraries to attract operators seeking cost-effective exploration options across offshore and frontier basins. Strategic partnerships with national oil companies, investments in digital workflows, and adoption of low-noise sources help maintain competitive advantage. Firms also diversify into renewable energy, carbon storage, and infrastructure-related seismic applications to reduce dependence on oil and gas cycles and secure long-term growth opportunities.
Key Player Analysis
- Fugro NV
- Dawson Geophysical Co.
- Agile Seismic LLC
- Fairfield Geotechnologies
- Asian Energy Services Ltd
- Amerapex Corp.
- Echo Seismic Ltd.
- Alphageo India Ltd.
- BGP Inc.
- China Oilfield Services Ltd.
Recent Developments
- In November 2025, Fugro completed geophysical and archaeological surveys for Italy’s Rimini offshore project. These surveys aid design and cable routing for early fixed-bottom offshore wind in Italy.
- In August 2025, Dawson Geophysical agreed to buy 100,000 Geospace Pioneer ultralight seismic nodes. The investment expands channel capacity and supports projects, including growing CCUS monitoring work
Report Coverage
The research report offers an in-depth analysis based on Technology, Services, Deployment and Geography. It details leading market players, providing an overview of their business, product offerings, investments, revenue streams, and key applications. Additionally, the report includes insights into the competitive environment, SWOT analysis, current market trends, as well as the primary drivers and constraints. Furthermore, it discusses various factors that have driven market expansion in recent years. The report also explores market dynamics, regulatory scenarios, and technological advancements that are shaping the industry. It assesses the impact of external factors and global economic changes on market growth. Lastly, it provides strategic recommendations for new entrants and established companies to navigate the complexities of the market.
Future Outlook
- Global exploration activity will rise across deepwater, ultra-deepwater, and frontier basins.
- 3D and 4D imaging adoption will strengthen as operators seek higher subsurface clarity.
- Ocean-bottom node surveys will expand due to improved accuracy in complex offshore zones.
- AI-based processing and automated interpretation will become standard in seismic workflows.
- Multi-client seismic libraries will grow as companies prefer cost-sharing exploration models.
- Renewable energy projects will increase seismic demand for offshore wind and geothermal mapping.
- Carbon storage monitoring will create new long-term opportunities for seismic service providers.
- Low-noise sources and environmental compliance technologies will gain wider use.
- National oil companies will boost large-scale seismic campaigns to enhance domestic resource security.
- Digital integration between acquisition, processing, and interpretation will optimize project timelines.
Request a Free Sample
Fill in your details and we'll send you a free sample report.
- Sample data tables & charts
- Research methodology
Need a Custom Version of This Report?
Tailor the scope, geography, or segments to your exact requirements.
- Custom geography or segment scope
- Direct access to our analyst team
Frequently Asked Questions
What is the current market size for Seismic Survey Market, and what is its projected size in 2032?
At what Compound Annual Growth Rate is Seismic Survey Market projected to grow between 2025 and 2032?
Which is the leading region of the market for seismic survey?
What are the key drivers for the growth of the seismic survey market?
Which is the major segment in the seismic survey market by application?
Who are the leading companies in Seismic Survey Market?
Table of Content
Chapter 1. Report Introduction
- 1.1 Report Description & Purpose
- 1.1.1 Report Title & Market Definition
- 1.1.2 Unique Selling Propositions (USP) & Key Differentiators
- 1.1.3 Value Proposition for Stakeholders
- 1.2 Research Objectives
- 1.2.1 Market Sizing Objectives (Volume & Revenue)
- 1.2.2 Segmentation Objectives
- 1.2.3 Competitive Intelligence Objectives
- 1.2.4 Forecast & Scenario Objectives
- 1.3 Report Scope
- 1.3.1 Seismic Survey Scope – Types & Subtypes Covered
- 1.3.2 Geographic Scope – Regions & Countries Covered
- 1.3.3 Historical Period, Base Year & Forecast Period (2024; forecast to 2032)
- 1.3.4 Inclusions & Exclusions
- 1.4 HS Code & Classification Framework
- 1.5 Currency, Units & Pricing Basis
- 1.6 Target Stakeholders
- 1.7 Limitations & Assumptions
Chapter 2. Executive Summary
- 2.1 Global Seismic Survey Market Snapshot
- 2.1.1 Market Size – Historical (2024) & Forecast (2024-2032) (2024: USD 22.8 billion → 2032: USD 32.42 billion)
- 2.1.2 Volume & Revenue – Global Totals
- 2.1.3 Key Market Highlights – Top Five Facts
- 2.2 Seismic Survey Market Segmentation Snapshot
- 2.2.1 Market Split by Region – 2024 vs. 2032
- 2.3 Competitive Snapshot
- 2.3.1 Top 10 Players by Revenue Share – 2024
- 2.3.2 Top 10 Players by Volume Share – 2024
- 2.3.3 Recent Strategic Developments (18-Month Summary)
- 2.4 Key Investment Highlights & Strategic Conclusions
Chapter 3. Seismic Survey Market Dynamics & Industry Analysis
- 3.1 Market Overview & Context
- 3.1.1 Seismic Survey Market Position in the Broader Automotive Value Chain
- 3.1.2 OEM vs. Replacement Market Dynamics
- 3.1.3 Market Maturity & Development Stage by Region
- 3.2 Seismic Survey Market Drivers
- 3.3 Seismic Survey Market Restraints & Challenges
- 3.4 Seismic Survey Market Opportunities
- 3.5 Porter's Five Forces Analysis
- 3.5.1 Threat of New Entrants
- 3.5.2 Bargaining Power of Suppliers
- 3.5.3 Bargaining Power of Buyers
- 3.5.4 Threat of Substitutes
- 3.5.5 Competitive Rivalry – Intensity Assessment
- 3.6 Seismic Survey Value Chain Analysis
- 3.6.1 Upstream – Raw Material/Input Suppliers
- 3.6.1.1 Raw Material/Input 1
- 3.6.1.2 Raw Material/Input 2
- 3.6.1.3 Raw Material/Input 3
- 3.6.2 Midstream – Production/Manufacturing/Service Delivery
- 3.6.2.1 Production/Process Overview
- 3.6.2.2 Key Facility Locations & Capacity by Manufacturer
- 3.6.3 Downstream – Distribution & End Consumer
- 3.6.3.1 Primary Channel – B2B/OEM
- 3.6.3.2 Secondary Channels – Dealer, Retail, Online, Direct
- 3.6.4 Value Chain Profitability Analysis
- 3.6.1 Upstream – Raw Material/Input Suppliers
- 3.7 PESTEL Analysis
- 3.7.1 Political Factors
- 3.7.2 Economic Factors
- 3.7.3 Social Factors
- 3.7.4 Technological Factors
- 3.7.5 Environmental Factors
- 3.7.6 Legal Factors
- 3.8 Seismic Survey Supply Chain Analysis
- 3.8.1 Raw Material/Input Supply Risk Assessment
- 3.8.2 Manufacturing Concentration Risk (Geographic Exposure)
- 3.8.3 Trade Disruption Impact Analysis
- 3.9 Regulatory & Policy Landscape
Note: The regulatory and policy landscape section covers regulations based on their applicability to the market, Seismic Survey category, geography, and scope of the study. Only regulatory frameworks with a material impact on operations, compliance, trade, sustainability, or market access are analyzed in detail.
Chapter 4. Key Investment Pockets & Opportunity Analysis
- 4.1 Seismic Survey Market Attractiveness Analysis
- 4.1.1 By Region – Investment Attractiveness Matrix (Volume × CAGR)
- 4.2 Absolute Revenue Growth Opportunity
- 4.2.1 By Region – Absolute USD Growth Through 2032
- 4.3 Incremental Volume Opportunity
- 4.3.1 By Region – Incremental Volume Through 2032
- 4.3.2 Segment – Incremental Volume
- 4.4 Emerging Submarket Opportunity Deep Dive (Subject to Applicability)
- 4.5 Emerging Market Opportunity Scorecards
- 4.5.1 United States
- 4.5.2 Europe
- 4.5.3 Asia
- 4.5.4 Middle East & Africa
Note: Emerging Market Opportunity Scorecards will be included based on relevance and strategic importance. Regions listed are indicative and may vary depending on data availability and market dynamics.
Chapter 5. Seismic Survey Import-Export Analysis & Trade Flows
- 5.1 Global Trade Overview
- 5.1.1 Global Export Value by Country (2024)
- 5.1.2 Global Export Volume by Country (2024)
- 5.1.3 Global Import Value by Country (2024)
- 5.1.4 Global Import Volume by Country (2024)
- 5.1.5 Net Trade Balance by Country (2024)
- 5.2 Export Analysis – Segment
- 5.2.1 Type 1 (HS Code)
- 5.2.2 Type 2 (HS Code)
- 5.2.3 Type 3 (HS Code)
- 5.2.4 Type 4 (HS Code)
- 5.2.5 Type 5 (HS Code)
- 5.3 Import Analysis – Segment
- 5.3.1 Type 1 (HS Code)
- 5.3.2 Type 2 (HS Code)
- 5.3.3 Type 3 (HS Code)
- 5.3.4 Type 4 (HS Code)
- 5.3.5 Type 5 (HS Code)
- 5.4 Average Unit Trade Prices
- 5.4.1 Average Export Price – Segment & Country
- 5.4.2 Average Import Price – Segment & Source Country
- 5.4.3 Price Trends (2024)
- 5.5 Key Trade Route Analysis
- 5.5.1 Trade Route 1
- 5.5.2 Trade Route 2
- 5.5.3 Trade Route 3
- 5.5.4 Trade Route 4
- 5.5.5 Trade Route 5
- 5.6 Trade Policy Impact Assessment
- 5.6.1 US Anti-Dumping & Section 301 Tariffs
- 5.6.2 EU Customs Union Impact
- 5.6.3 Major Free Trade Agreements
- 5.6.4 USMCA Rules of Origin
Note: Trade policy analysis will be included only where relevant to the Seismic Survey market.
Chapter 6. Competitive Landscape & Company Benchmarking
- 6.1 Seismic Survey Market Concentration & Structure
- 6.1.1 Herfindahl-Hirschman Index (HHI) – vs. 2024
- 6.1.2 Tier 1, Tier 2 & Tier 3 Market Structure
- 6.1.3 Global, Regional & Local Player Dynamics
- 6.2 Seismic Survey Market Share Analysis – 2024
- 6.2.1 Global Revenue Share by Company
- 6.2.2 Global Volume Share by Company
- 6.2.3 Regional Revenue Share
- 6.2.4 Market Share Evolution ( vs. 2024)
- 6.2.5 OEM Segment Share by Company
- 6.2.6 Replacement Segment Share by Company
- 6.3 Production/Delivery Capacity & Facility Analysis
- 6.3.1 Global Installed Capacity
- 6.3.2 Capacity Utilization Rates
- 6.3.3 Production/Output Volume
- 6.3.4 Facility Locations & Capacity Map
- 6.3.5 Planned Capacity Additions
- 6.4 Seismic Survey Competitive Benchmarking Matrix
- 6.4.1 Revenue, Volume, CAGR & Profitability Comparison
- 6.4.2 Channel Revenue Mix
- 6.4.3 Geographic Revenue Exposure
- 6.4.4 R&D Intensity
- 6.4.5 Sustainability Maturity
- 6.5 Strategic Developments in Seismic Survey (Last 24 Months)
- 6.5.1 Mergers, Acquisitions & Divestments
- 6.5.2 New Seismic Survey Launches
- 6.5.3 Facility Expansions
- 6.5.4 Strategic Alliances, Joint Ventures & Partnerships
- 6.5.5 Distribution Expansion & Market Entry
- 6.5.6 Sustainability & ESG Initiatives
- 6.6 Competitive Strategy Mapping
- 6.6.1 Leader, Challenger, Follower & Niche Classification
- 6.6.2 Pricing Strategy Comparison
- 6.6.3 Channel Strategy Matrix
Note: Strategic developments are included based on their materiality and the availability of reliable information.
Chapter 7. Global Seismic Survey Market – By Distribution Channel
- 7.1 Segment Overview
- 7.1.1 Volume & Revenue Split by Channel (2024 & 2032)
- 7.1.2 Channel Mix Evolution (2024-2032)
Chapter 8. Regional Market Analysis – Global Overview
- 8.1 Global Regional Overview
- 8.1.1 Regional Volume Share
- 8.1.2 Regional Revenue Share
- 8.1.3 Regional Volume by Region
- 8.1.4 Regional Revenue by Region
- 8.1.5 Regional Forecast Through 2032
- 8.2 Cross-Regional Segment Analysis
- 8.2.1 By Distribution Channel
- 8.2.2 By Brand/Price Tier
Chapter 9. North America Seismic Survey Market
- 9.1 United States
- 9.2 Canada
- 9.3 Mexico
Chapter 10. Europe Seismic Survey Market
- 10.1 Germany
- 10.2 France
- 10.3 Italy
- 10.4 United Kingdom
- 10.5 Spain
- 10.6 Poland
- 10.7 Russia
- 10.8 Netherlands
- 10.9 Belgium
- 10.10 Sweden
- 10.11 Denmark
- 10.12 Norway
- 10.13 Rest of Europe
Chapter 11. Asia Pacific Seismic Survey Market
- 11.1 China
- 11.2 India
- 11.3 Japan
- 11.4 South Korea
- 11.5 Thailand
- 11.6 Indonesia
- 11.7 Vietnam
- 11.8 Malaysia
- 11.9 Australia
- 11.10 Rest of Asia Pacific
Chapter 12. Latin America Seismic Survey Market
- 12.1 Brazil
- 12.2 Argentina
- 12.3 Colombia
- 12.4 Chile
- 12.5 Rest of Latin America
Chapter 13. Middle East Seismic Survey Market
- 13.1 Saudi Arabia
- 13.2 United Arab Emirates
- 13.3 Turkey
- 13.4 Israel
- 13.5 Iran
- 13.6 Rest of the Middle East
Chapter 14. Africa Seismic Survey Market
- 14.1 South Africa
- 14.2 Egypt
- 14.3 Nigeria
- 14.4 Morocco
- 14.5 Rest of Africa
Chapter 15. Seismic Survey Company Profiles
- 15.1 [Company 01]
- 15.1.1 Company Overview
- 15.1.2 Key Management Personnel
- 15.1.3 Products & Services Portfolio
- 15.1.4 Financial Performance
- 15.1.5 Key Market Focus & Geographic Presence
- 15.1.6 Recent Developments & Strategic Initiatives
Note: The company profile list is preliminary and may change based on research findings, market developments, data availability, and client requirements.
Chapter 16. Appendices
- Appendix A – List of Abbreviations & Acronyms
- Appendix B – Industry Classification Code Reference – Full Series
- Appendix C – Production & Capacity Data Tables
- Appendix D – End-Use & Demand Base Tables
- Appendix E – Consumption & Replacement Rate Assumptions
- Appendix F – ASP Reference Tables
- Appendix G – Manufacturing & Facility Database
- Appendix H – Import-Export Data Tables
- Appendix I – Regulatory Summary Tables
- Appendix J – Primary Research Participant List (Anonymized)
- Appendix K – Primary Research Questionnaire Framework
- Appendix L – Data Sources & Bibliography
- Appendix M – Market Size Divergence & Source Comparison
Chapter 17. Research Methodology
- 17.1 Research Framework & Philosophy
- 17.2 Secondary Research – Sources, Hierarchy & Data Extraction
- 17.3 Data Modeling – Bottom-Up & Top-Down Market Sizing
- 17.4 Primary Research – Stakeholder Framework, LOI & Sample Sizes
- 17.5 Forecast Methodology – Regression, Scenario & Sensitivity Analysis
- 17.6 Quality Control – Four-Layer Validation Framework
- 17.7 Limitations & Standard Assumptions
- 17.8 Disclaimer
