
Coal Bed Methane (CBM) Market Overview:
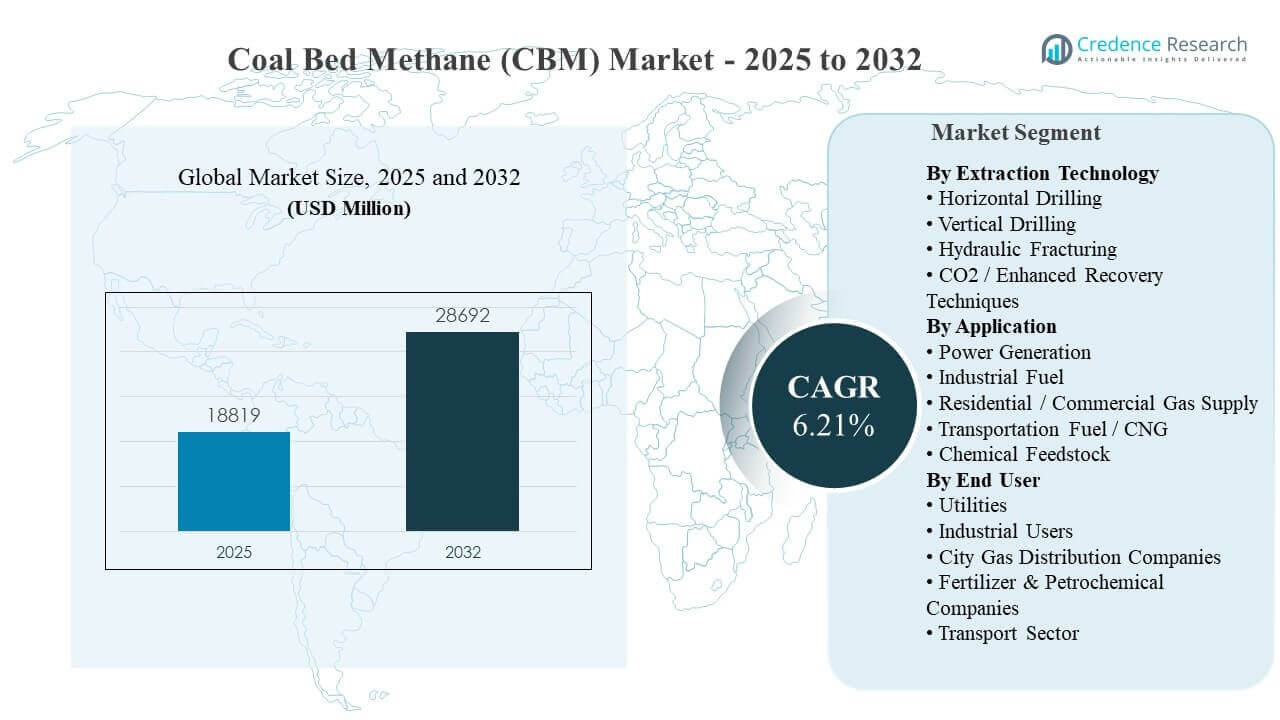
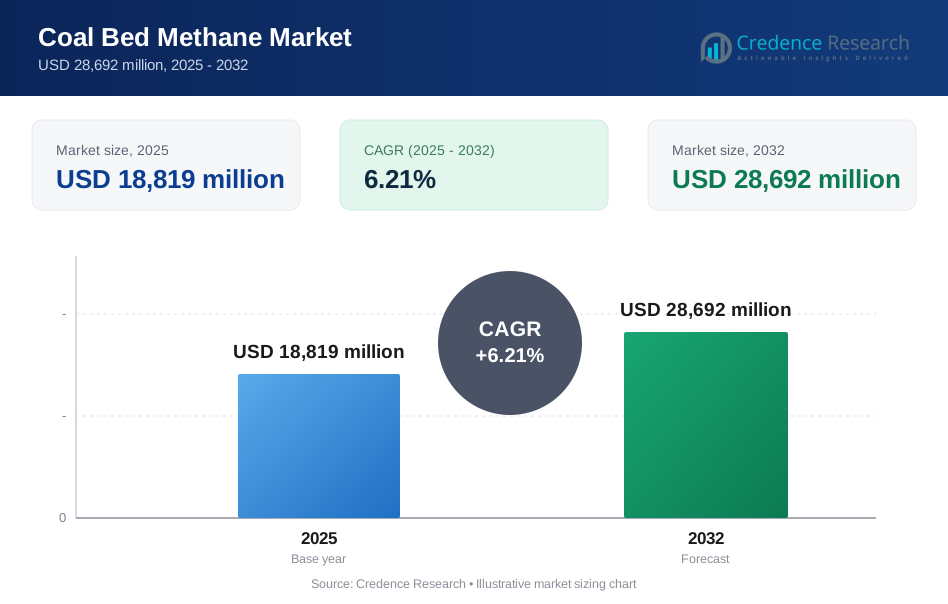
The global Coal Bed Methane (CBM) market size was estimated at USD 18,819 million in 2025 and is expected to reach USD 28,692 million by 2032, growing at a CAGR of 6.21% from 2025 to 2032. Growth is primarily driven by the need for dependable, lower-emission fuel alternatives for grid stability and industrial heat, supported by expanding gas infrastructure and basin-level monetization of methane resources. Coal Bed Methane (CBM) market development also benefits from improvements in drilling and completion practices that raise recovery from coal seams, along with stronger offtake linkages to power generation, city-gas distribution, and select transport fuel corridors.
| REPORT ATTRIBUTE | DETAILS |
|---|---|
| Historical Period | 2020-2024 |
| Base Year | 2025 |
| Forecast Period | 2026-2032 |
| Coal Bed Methane (CBM) Market Size 2025 | USD 18,819 million |
| Coal Bed Methane (CBM) Market, CAGR | 6.21% |
| Coal Bed Methane (CBM) Market Size 2032 | USD 28,692 million |
Key Market Trends & Insights
- The Coal Bed Methane (CBM) market is projected to expand from USD 18,819 million (2025) to USD 28,692 million (2032), reflecting sustained investment across producing basins.
- Coal Bed Methane (CBM) market growth is forecast at a 6.21% CAGR (2025–2032), supported by rising gas demand in power and industrial applications.
- Asia Pacific held 36.40% share in 2025, reflecting strong basin activity and scaling gas infrastructure in key coal regions.
- North America accounted for 35.10% share in 2025, underpinned by established unconventional production capabilities and downstream consumption depth.
- Horizontal Drilling represented 63.20% share in 2025, indicating operator preference for improved seam contact and deliverability in many coal basins.
Segment Analysis
Coal Bed Methane (CBM) market segmentation highlights strong alignment between extraction choices and downstream demand centers. Horizontal well designs and optimized completions remain preferred where coal seam thickness, permeability, and basin economics favor longer drainage reach. Project viability is influenced by water management, well spacing strategies, and access to gathering, processing, and pipeline takeaway, making integration with midstream systems a key determinant of commercial outcomes.
Demand-side dynamics in the Coal Bed Methane (CBM) market are shaped by power generation requirements, industrial fuel switching, and the expanding footprint of city gas distribution networks. Utilities and large industrial buyers tend to prioritize reliable offtake contracts and consistent quality specifications, which encourages upstream operators to invest in compression, dehydration, and processing. Transportation fuel and chemical feedstock uses expand selectively where policy support and infrastructure enable sustained consumption.
By Extraction Technology Insights
Horizontal Drilling accounted for the largest share of 63.20% in 2025. Horizontal drilling leads because horizontal laterals improve contact with coal seams, enabling larger drainage areas per well and stronger flow stability in suitable basins. Horizontal drilling also supports pad-based development that reduces surface disturbance and improves operational efficiency. Horizontal drilling adoption is reinforced by improved geosteering and completion design that increases productive intervals and reduces non-productive time.
By Application Insights
Power Generation accounted for the largest share of 38.60% in 2025. Power generation leads because gas-fired units require scalable and dispatchable fuel supply that supports grid reliability and peak balancing needs. Power generation offtake can also provide long-duration demand visibility, improving project bankability for upstream developers. Power generation growth is further supported by gas infrastructure buildouts and basin-adjacent generation projects that reduce transport constraints.
By End User Insights
Utilities accounted for the largest share of 37.10% in 2025. Utilities lead because utilities typically secure longer-term supply arrangements to support power generation portfolios and stable grid operations. Utilities also benefit from integrated procurement and risk management practices that improve fuel planning versus fragmented spot purchasing. Utilities-driven demand encourages upstream investment in gathering systems and processing capacity that improves deliverability and supply reliability.
Coal Bed Methane Market Drivers
Expansion of gas demand for grid stability and industrial heat
Coal Bed Methane (CBM) market growth is supported by rising requirements for dependable fuel in electricity generation and industrial thermal applications. Gas-based generation supports grid stability, peak balancing, and flexible dispatch relative to many legacy systems. Industrial users adopt gas to improve combustion control and support emissions compliance requirements. Coal Bed Methane (CBM) market projects benefit when coal basins are located near demand centers, lowering transport cost and improving delivered economics.
Improvements in drilling, completion, and reservoir management
Coal Bed Methane (CBM) market adoption increases as operators improve well placement, stimulation approaches, and drawdown management suited to coal seam behavior. Horizontal drilling and optimized completions enhance seam contact and stabilize production profiles in appropriate geology. Better reservoir characterization supports improved spacing design and reduces development risk. Coal Bed Methane (CBM) market economics strengthen when operational learning curves reduce drilling time, enhance uptime, and improve recovery efficiency at the field level.
Development of gathering, processing, and pipeline takeaway
Coal Bed Methane (CBM) market commercialization depends heavily on midstream connectivity, including gathering lines, compression, dehydration, and processing. Projects located near pipeline infrastructure can monetize volumes faster and reduce curtailment risk. Integrated systems also help manage variable wellhead pressures and quality specifications required by downstream buyers. Coal Bed Methane (CBM) market participants increasingly prioritize phased development linked to infrastructure milestones, improving cash flow visibility and investment confidence.
- For instance, Arrow Energy's Surat Gas Project in Queensland integrates approximately 7,500 production wells at depths of 300–750 m, with field compression designed to handle 30–150 TJ/d and deliver gas at 10,200 kPa via pipeline with around 400 wells drilled per year, enabling phased volume ramp-up while meeting downstream pressure and quality specifications.
Monetization of methane resources and environmental compliance incentives
Coal Bed Methane (CBM) market momentum is reinforced by the broader focus on methane management and the monetization of gas that might otherwise be vented or flared. Capturing and selling methane can improve basin-level environmental performance and align with emerging regulatory expectations. Methane control initiatives also push better measurement, leak detection, and operational discipline. Coal Bed Methane (CBM) market operators can translate these improvements into stronger stakeholder acceptance and more consistent project execution.
- For instance, Encana's CBM methane reduction program, certified by the American Carbon Registry in March 2011, was projected to cut more than 4,200 tonnes of methane annually, equal to about 90,000 tonnes of CO2e, showing measurable gains from methane capture and monitoring.
Coal Bed Methane Market Challenges
Coal Bed Methane (CBM) market expansion is constrained by reservoir variability, where coal seam permeability and saturation differences create uneven well performance across basins. Water handling requirements can be significant and can raise operating complexity, particularly where disposal, treatment, or reinjection options are limited. Infrastructure dependency remains a recurring barrier because project timelines can be delayed without gathering, compression, and pipeline access. Coal Bed Methane (CBM) market projects also face permitting and community acceptance risks in sensitive operating areas.
- For instance, QGC’s Northern Water Treatment Plant in Queensland was built to purify 100,000 cubic metres of produced water per day, and the project was named Industrial Water Project of the Year in 2016, highlighting how large-scale treatment infrastructure becomes central to coal seam methane project execution.
Coal Bed Methane (CBM) market economics can be pressured by commodity price volatility and competition from other gas sources, including shale and conventional supply. Development costs can rise due to drilling intensity, stimulation requirements, or complex water management needs. Contracting can also be challenging where buyers prefer short durations or uncertain volume commitments. Coal Bed Methane (CBM) market participants must manage these risks through phased development, offtake diversification, and careful basin selection.
Coal Bed Methane Market Trends and Opportunities
Coal Bed Methane (CBM) market opportunities increasingly emerge from tighter integration between upstream development and downstream offtake planning. Long-term utility demand, industrial clusters, and city-gas distribution expansions create anchors for sustained gas absorption. Improved digital monitoring and production optimization can reduce downtime and enhance recovery outcomes. Coal Bed Methane (CBM) market operators also benefit from modular processing and compression solutions that speed commissioning and reduce early-stage infrastructure barriers.
- For instance, Essar Oil and Gas Exploration and Production’s Raniganj East CBM block has drilled 454 wells, built more than 350 km of pipeline infrastructure, and created gas-handling capacity of around 3 MMSCMD, while also preparing pilot horizontal CBM wells to improve recovery from a mature block.
Coal Bed Methane (CBM) market development is trending toward operational standardization, including pad drilling, repeatable completion designs, and stronger water management systems. Regional policy actions on methane measurement and leak reduction encourage investments in monitoring and maintenance practices. Transport fuel and CNG applications expand selectively where dispensing infrastructure and fleet economics align. Coal Bed Methane (CBM) market participants can capture growth by aligning basin development with pipeline buildouts and prioritized demand corridors.
Regional Insights
North America
North America held 35.10% share in 2025, supported by established unconventional operations, mature services capability, and broad downstream gas consumption. Coal Bed Methane (CBM) market activity benefits from experienced drilling ecosystems and strong midstream connectivity in multiple producing basins. Utilities and industrial buyers support stable offtake in select corridors. Coal Bed Methane (CBM) market competitiveness in North America is shaped by efficiency improvements and cost discipline relative to alternative gas supplies.
Europe
Europe held 17.30% share in 2025, reflecting comparatively limited commercial coal seam development and greater regulatory and permitting complexity. Coal Bed Methane (CBM) market opportunity is influenced by local energy security priorities and the ability to integrate production with existing gas systems. Project advancement tends to be selective and basin-specific. Coal Bed Methane (CBM) market participants in Europe often focus on feasibility, compliance readiness, and stakeholder engagement to support development progress.
Asia Pacific
Asia Pacific led with 36.40% share in 2025, supported by large coal resources, growing gas demand, and expanding infrastructure in several countries. Coal Bed Methane (CBM) market development is encouraged by basin-scale programs and efforts to improve domestic gas availability. Industrial demand and city-gas networks support sustained consumption where connectivity improves. Coal Bed Methane (CBM) market growth in Asia Pacific is reinforced by scaling drilling activity and improving midstream integration.
Latin America
Latin America held 5.90% share in 2025, indicating niche development with selective basin activity and uneven infrastructure readiness. Coal Bed Methane (CBM) market progress depends on resource delineation, regulatory clarity, and the ability to secure stable offtake. Industrial clusters can serve as early anchors where pipelines are available. Coal Bed Methane (CBM) market expansion is likely to remain phased, prioritizing low-risk pilots and infrastructure-linked developments.
Middle East & Africa
Middle East & Africa held 5.30% share in 2025, reflecting early-stage coal seam monetization and limited large-scale commercial production. Coal Bed Methane (CBM) market opportunity is tied to energy diversification programs, infrastructure availability, and project financing conditions. Industrial fuel demand can support targeted developments near demand nodes. Coal Bed Methane (CBM) market participants typically focus on basin appraisal, water management readiness, and integration with existing gas networks.
Competitive Landscape
Coal Bed Methane (CBM) market competition is characterized by basin position strength, operating efficiency, and secure access to offtake and infrastructure. Leading participants differentiate through drilling and completion capability, reservoir management expertise, and scalable field development planning. Partnerships and joint ventures are common where capital intensity is high or where access to acreage and infrastructure is shared. Coal Bed Methane (CBM) market positioning also depends on compliance readiness, methane management practices, and consistent supply reliability for downstream buyers.
Santos Ltd. is positioned as an operator with experience in large-scale gas developments and basin integration strategies, enabling sustained delivery into established gas value chains. Santos Ltd. participation in gas supply ecosystems supports operational learning and standardized development approaches. Santos Ltd. competitiveness benefits from disciplined field planning, integration with processing and takeaway pathways, and an emphasis on reliable deliverability for contracted customers. Coal Bed Methane (CBM) market execution increasingly rewards such integrated operating models.
The industry research and growth report includes detailed analyses of the competitive landscape of the market and information about key companies, including:
- Santos Ltd.
- Origin Energy Ltd.
- Arrow Energy Pty Ltd.
- Shell plc / QGC
- BP plc
- Essar Oil & Gas Exploration & Production Ltd.
- Great Eastern Energy Corporation Ltd.
- Reliance Industries Ltd.
- Oil and Natural Gas Corporation (ONGC)
- GAIL (India) Ltd.
- Coal India Ltd.
- PetroChina
Qualitative and quantitative analysis of companies has been conducted to help clients understand the wider business environment as well as the strengths and weaknesses of key industry players. Data is qualitatively analyzed to categorize companies as pure play, category-focused, industry-focused, and diversified; it is quantitatively analyzed to categorize companies as dominant, leading, strong, tentative, and weak.
Recent Developments
- In February 2025, Diversified Energy Company PLC completed its acquisition of Summit Natural Resources for about $42 million. The acquired assets in Virginia, West Virginia, and Alabama include coal mine methane volumes and related midstream infrastructure, which Diversified said would expand environmental-credit cash flow and strengthen its position in Southern Appalachia.
- In April 2025, Oil and Natural Gas Corporation (ONGC), along with Oil India and TERI, introduced microbial enhanced coal bed methane (MECBM) technology, a new CBM recovery approach designed to improve methane output from coal seams. In the cited reports, the technology had already been tested across more than a dozen wells and was presented as a way to improve production efficiency while supporting sustainability goals.
- In June 2025, ONGC commenced CBM gas supply from its North Karanpura block in Jharkhand to city gas distribution sectors, marking a new commercial rollout from the field. In the same update, ONGC said the North Karanpura CBM field was set to be linked to the Urja Ganga pipeline to expand the reach of its gas network.
- In July 2024, ONGC and Coal India signed the first Petroleum Mining Lease deed for the Jharia coal bed methane block, marking an important partnership milestone in India’s CBM sector. In the report, this lease was described as a joint-venture step that strengthened collaboration between the two companies for CBM development.
Report Scope
| Report Attribute | Details |
| Market size value in 2025 | USD 18819 million |
| Revenue forecast in 2032 | USD 28692 million |
| Growth rate (CAGR) | 6.21% (2025–2032) |
| Base year | 2025 |
| Forecast period | 2026–2032 |
| Quantitative units | USD million |
| Segments covered | By Extraction Technology Outlook; By Application Outlook; By End User Outlook |
| Regional scope | North America, Europe, Asia Pacific, Latin America, Middle East & Africa |
| Key companies profiled | Santos Ltd.; Origin Energy Ltd.; Arrow Energy Pty Ltd.; Shell plc / QGC; BP plc; Essar Oil & Gas Exploration & Production Ltd.; Great Eastern Energy Corporation Ltd.; Reliance Industries Ltd.; Oil and Natural Gas Corporation (ONGC); GAIL (India) Ltd.; Coal India Ltd.; PetroChina |
| No. of Pages | 332 |
Segmentation
By Extraction Technology
- Horizontal Drilling
- Vertical Drilling
- Hydraulic Fracturing
- CO2 / Enhanced Recovery Techniques
By Application
- Power Generation
- Industrial Fuel
- Residential / Commercial Gas Supply
- Transportation Fuel / CNG
- Chemical Feedstock
By End User
- Utilities
- Industrial Users
- City Gas Distribution Companies
- Fertilizer & Petrochemical Companies
- Transport Sector
By Region
- North America
- U.S.
- Canada
- Mexico
- Europe
- Germany
- France
- U.K.
- Italy
- Spain
- Rest of Europe
- Asia Pacific
- China
- Japan
- India
- South Korea
- South-east Asia
- Rest of Asia Pacific
- Latin America
- Brazil
- Argentina
- Rest of Latin America
- Middle East & Africa
- GCC Countries
- South Africa
- Rest of the Middle East and Africa
Request a Free Sample
Fill in your details and we'll send you a free sample report.
- Sample data tables & charts
- Research methodology
Need a Custom Version of This Report?
Tailor the scope, geography, or segments to your exact requirements.
- Custom geography or segment scope
- Direct access to our analyst team
Frequently Asked Questions
What is the market size and forecast for the Coal Bed Methane (CBM) market?
What is the CAGR for the Coal Bed Methane (CBM) market?
What is the largest segment by extraction technology in 2025?
What factors are driving growth in the Coal Bed Methane (CBM) market?
Who are the leading companies in the Coal Bed Methane (CBM) market?
Which region leads the Coal Bed Methane (CBM) market in 2025?
Table of Content
Chapter 1. Report Introduction
- 1.1 Report Description & Purpose
- 1.1.1 Report Title & Market Definition
- 1.1.2 Unique Selling Propositions (USP) & Key Differentiators
- 1.1.3 Value Proposition for Stakeholders
- 1.2 Research Objectives
- 1.2.1 Market Sizing Objectives (Volume & Revenue)
- 1.2.2 Segmentation Objectives
- 1.2.3 Competitive Intelligence Objectives
- 1.2.4 Forecast & Scenario Objectives
- 1.3 Report Scope
- 1.3.1 Coal Bed Methane Scope – Types & Subtypes Covered
- 1.3.2 Geographic Scope – Regions & Countries Covered
- 1.3.3 Historical Period, Base Year & Forecast Period (2025; forecast to 2032)
- 1.3.4 Inclusions & Exclusions
- 1.4 HS Code & Classification Framework
- 1.5 Currency, Units & Pricing Basis
- 1.6 Target Stakeholders
- 1.7 Limitations & Assumptions
Chapter 2. Executive Summary
- 2.1 Global Coal Bed Methane Market Snapshot
- 2.1.1 Market Size – Historical (2025) & Forecast (2025-2032) (2025: USD 18,819 million → 2032: USD 28,692 million)
- 2.1.2 Volume & Revenue – Global Totals
- 2.1.3 Key Market Highlights – Top Five Facts
- 2.2 Coal Bed Methane Market Segmentation Snapshot
- 2.2.1 Market Split by Region – 2025 vs. 2032
- 2.3 Competitive Snapshot
- 2.3.1 Top 10 Players by Revenue Share – 2025
- 2.3.2 Top 10 Players by Volume Share – 2025
- 2.3.3 Recent Strategic Developments (18-Month Summary)
- 2.4 Key Investment Highlights & Strategic Conclusions
Chapter 3. Coal Bed Methane Market Dynamics & Industry Analysis
- 3.1 Market Overview & Context
- 3.1.1 Coal Bed Methane Market Position in the Broader Automotive Value Chain
- 3.1.2 OEM vs. Replacement Market Dynamics
- 3.1.3 Market Maturity & Development Stage by Region
- 3.2 Coal Bed Methane Market Drivers
- 3.3 Coal Bed Methane Market Restraints & Challenges
- 3.4 Coal Bed Methane Market Opportunities
- 3.5 Porter's Five Forces Analysis
- 3.5.1 Threat of New Entrants
- 3.5.2 Bargaining Power of Suppliers
- 3.5.3 Bargaining Power of Buyers
- 3.5.4 Threat of Substitutes
- 3.5.5 Competitive Rivalry – Intensity Assessment
- 3.6 Coal Bed Methane Value Chain Analysis
- 3.6.1 Upstream – Raw Material/Input Suppliers
- 3.6.1.1 Raw Material/Input 1
- 3.6.1.2 Raw Material/Input 2
- 3.6.1.3 Raw Material/Input 3
- 3.6.2 Midstream – Production/Manufacturing/Service Delivery
- 3.6.2.1 Production/Process Overview
- 3.6.2.2 Key Facility Locations & Capacity by Manufacturer
- 3.6.3 Downstream – Distribution & End Consumer
- 3.6.3.1 Primary Channel – B2B/OEM
- 3.6.3.2 Secondary Channels – Dealer, Retail, Online, Direct
- 3.6.4 Value Chain Profitability Analysis
- 3.6.1 Upstream – Raw Material/Input Suppliers
- 3.7 PESTEL Analysis
- 3.7.1 Political Factors
- 3.7.2 Economic Factors
- 3.7.3 Social Factors
- 3.7.4 Technological Factors
- 3.7.5 Environmental Factors
- 3.7.6 Legal Factors
- 3.8 Coal Bed Methane Supply Chain Analysis
- 3.8.1 Raw Material/Input Supply Risk Assessment
- 3.8.2 Manufacturing Concentration Risk (Geographic Exposure)
- 3.8.3 Trade Disruption Impact Analysis
- 3.9 Regulatory & Policy Landscape
Note: The regulatory and policy landscape section covers regulations based on their applicability to the market, Coal Bed Methane category, geography, and scope of the study. Only regulatory frameworks with a material impact on operations, compliance, trade, sustainability, or market access are analyzed in detail.
Chapter 4. Key Investment Pockets & Opportunity Analysis
- 4.1 Coal Bed Methane Market Attractiveness Analysis
- 4.1.1 By Region – Investment Attractiveness Matrix (Volume × CAGR)
- 4.2 Absolute Revenue Growth Opportunity
- 4.2.1 By Region – Absolute USD Growth Through 2032
- 4.3 Incremental Volume Opportunity
- 4.3.1 By Region – Incremental Volume Through 2032
- 4.3.2 Segment – Incremental Volume
- 4.4 Emerging Submarket Opportunity Deep Dive (Subject to Applicability)
- 4.5 Emerging Market Opportunity Scorecards
- 4.5.1 United States
- 4.5.2 Europe
- 4.5.3 Asia
- 4.5.4 Middle East & Africa
Note: Emerging Market Opportunity Scorecards will be included based on relevance and strategic importance. Regions listed are indicative and may vary depending on data availability and market dynamics.
Chapter 5. Coal Bed Methane Import-Export Analysis & Trade Flows
- 5.1 Global Trade Overview
- 5.1.1 Global Export Value by Country (2025)
- 5.1.2 Global Export Volume by Country (2025)
- 5.1.3 Global Import Value by Country (2025)
- 5.1.4 Global Import Volume by Country (2025)
- 5.1.5 Net Trade Balance by Country (2025)
- 5.2 Export Analysis – Segment
- 5.2.1 Type 1 (HS Code)
- 5.2.2 Type 2 (HS Code)
- 5.2.3 Type 3 (HS Code)
- 5.2.4 Type 4 (HS Code)
- 5.2.5 Type 5 (HS Code)
- 5.3 Import Analysis – Segment
- 5.3.1 Type 1 (HS Code)
- 5.3.2 Type 2 (HS Code)
- 5.3.3 Type 3 (HS Code)
- 5.3.4 Type 4 (HS Code)
- 5.3.5 Type 5 (HS Code)
- 5.4 Average Unit Trade Prices
- 5.4.1 Average Export Price – Segment & Country
- 5.4.2 Average Import Price – Segment & Source Country
- 5.4.3 Price Trends (2025)
- 5.5 Key Trade Route Analysis
- 5.5.1 Trade Route 1
- 5.5.2 Trade Route 2
- 5.5.3 Trade Route 3
- 5.5.4 Trade Route 4
- 5.5.5 Trade Route 5
- 5.6 Trade Policy Impact Assessment
- 5.6.1 US Anti-Dumping & Section 301 Tariffs
- 5.6.2 EU Customs Union Impact
- 5.6.3 Major Free Trade Agreements
- 5.6.4 USMCA Rules of Origin
Note: Trade policy analysis will be included only where relevant to the Coal Bed Methane market.
Chapter 6. Competitive Landscape & Company Benchmarking
- 6.1 Coal Bed Methane Market Concentration & Structure
- 6.1.1 Herfindahl-Hirschman Index (HHI) – vs. 2025
- 6.1.2 Tier 1, Tier 2 & Tier 3 Market Structure
- 6.1.3 Global, Regional & Local Player Dynamics
- 6.2 Coal Bed Methane Market Share Analysis – 2025
- 6.2.1 Global Revenue Share by Company
- 6.2.2 Global Volume Share by Company
- 6.2.3 Regional Revenue Share
- 6.2.4 Market Share Evolution ( vs. 2025)
- 6.2.5 OEM Segment Share by Company
- 6.2.6 Replacement Segment Share by Company
- 6.3 Production/Delivery Capacity & Facility Analysis
- 6.3.1 Global Installed Capacity
- 6.3.2 Capacity Utilization Rates
- 6.3.3 Production/Output Volume
- 6.3.4 Facility Locations & Capacity Map
- 6.3.5 Planned Capacity Additions
- 6.4 Coal Bed Methane Competitive Benchmarking Matrix
- 6.4.1 Revenue, Volume, CAGR & Profitability Comparison
- 6.4.2 Channel Revenue Mix
- 6.4.3 Geographic Revenue Exposure
- 6.4.4 R&D Intensity
- 6.4.5 Sustainability Maturity
- 6.5 Strategic Developments in Coal Bed Methane (Last 24 Months)
- 6.5.1 Mergers, Acquisitions & Divestments
- 6.5.2 New Coal Bed Methane Launches
- 6.5.3 Facility Expansions
- 6.5.4 Strategic Alliances, Joint Ventures & Partnerships
- 6.5.5 Distribution Expansion & Market Entry
- 6.5.6 Sustainability & ESG Initiatives
- 6.6 Competitive Strategy Mapping
- 6.6.1 Leader, Challenger, Follower & Niche Classification
- 6.6.2 Pricing Strategy Comparison
- 6.6.3 Channel Strategy Matrix
Note: Strategic developments are included based on their materiality and the availability of reliable information.
Chapter 7. Global Coal Bed Methane Market – By Distribution Channel
- 7.1 Segment Overview
- 7.1.1 Volume & Revenue Split by Channel (2025 & 2032)
- 7.1.2 Channel Mix Evolution (2025-2032)
Chapter 8. Regional Market Analysis – Global Overview
- 8.1 Global Regional Overview
- 8.1.1 Regional Volume Share
- 8.1.2 Regional Revenue Share
- 8.1.3 Regional Volume by Region
- 8.1.4 Regional Revenue by Region
- 8.1.5 Regional Forecast Through 2032
- 8.2 Cross-Regional Segment Analysis
- 8.2.1 By Distribution Channel
- 8.2.2 By Brand/Price Tier
Chapter 9. North America Coal Bed Methane Market
- 9.1 United States
- 9.2 Canada
- 9.3 Mexico
Chapter 10. Europe Coal Bed Methane Market
- 10.1 Germany
- 10.2 France
- 10.3 Italy
- 10.4 United Kingdom
- 10.5 Spain
- 10.6 Poland
- 10.7 Russia
- 10.8 Netherlands
- 10.9 Belgium
- 10.10 Sweden
- 10.11 Denmark
- 10.12 Norway
- 10.13 Rest of Europe
Chapter 11. Asia Pacific Coal Bed Methane Market
- 11.1 China
- 11.2 India
- 11.3 Japan
- 11.4 South Korea
- 11.5 Thailand
- 11.6 Indonesia
- 11.7 Vietnam
- 11.8 Malaysia
- 11.9 Australia
- 11.10 Rest of Asia Pacific
Chapter 12. Latin America Coal Bed Methane Market
- 12.1 Brazil
- 12.2 Argentina
- 12.3 Colombia
- 12.4 Chile
- 12.5 Rest of Latin America
Chapter 13. Middle East Coal Bed Methane Market
- 13.1 Saudi Arabia
- 13.2 United Arab Emirates
- 13.3 Turkey
- 13.4 Israel
- 13.5 Iran
- 13.6 Rest of the Middle East
Chapter 14. Africa Coal Bed Methane Market
- 14.1 South Africa
- 14.2 Egypt
- 14.3 Nigeria
- 14.4 Morocco
- 14.5 Rest of Africa
Chapter 15. Coal Bed Methane Company Profiles
- 15.1 [Company 01]
- 15.1.1 Company Overview
- 15.1.2 Key Management Personnel
- 15.1.3 Products & Services Portfolio
- 15.1.4 Financial Performance
- 15.1.5 Key Market Focus & Geographic Presence
- 15.1.6 Recent Developments & Strategic Initiatives
Note: The company profile list is preliminary and may change based on research findings, market developments, data availability, and client requirements.
Chapter 16. Appendices
- Appendix A – List of Abbreviations & Acronyms
- Appendix B – Industry Classification Code Reference – Full Series
- Appendix C – Production & Capacity Data Tables
- Appendix D – End-Use & Demand Base Tables
- Appendix E – Consumption & Replacement Rate Assumptions
- Appendix F – ASP Reference Tables
- Appendix G – Manufacturing & Facility Database
- Appendix H – Import-Export Data Tables
- Appendix I – Regulatory Summary Tables
- Appendix J – Primary Research Participant List (Anonymized)
- Appendix K – Primary Research Questionnaire Framework
- Appendix L – Data Sources & Bibliography
- Appendix M – Market Size Divergence & Source Comparison
Chapter 17. Research Methodology
- 17.1 Research Framework & Philosophy
- 17.2 Secondary Research – Sources, Hierarchy & Data Extraction
- 17.3 Data Modeling – Bottom-Up & Top-Down Market Sizing
- 17.4 Primary Research – Stakeholder Framework, LOI & Sample Sizes
- 17.5 Forecast Methodology – Regression, Scenario & Sensitivity Analysis
- 17.6 Quality Control – Four-Layer Validation Framework
- 17.7 Limitations & Standard Assumptions
- 17.8 Disclaimer
