Public budgets and medical schemes split the bill
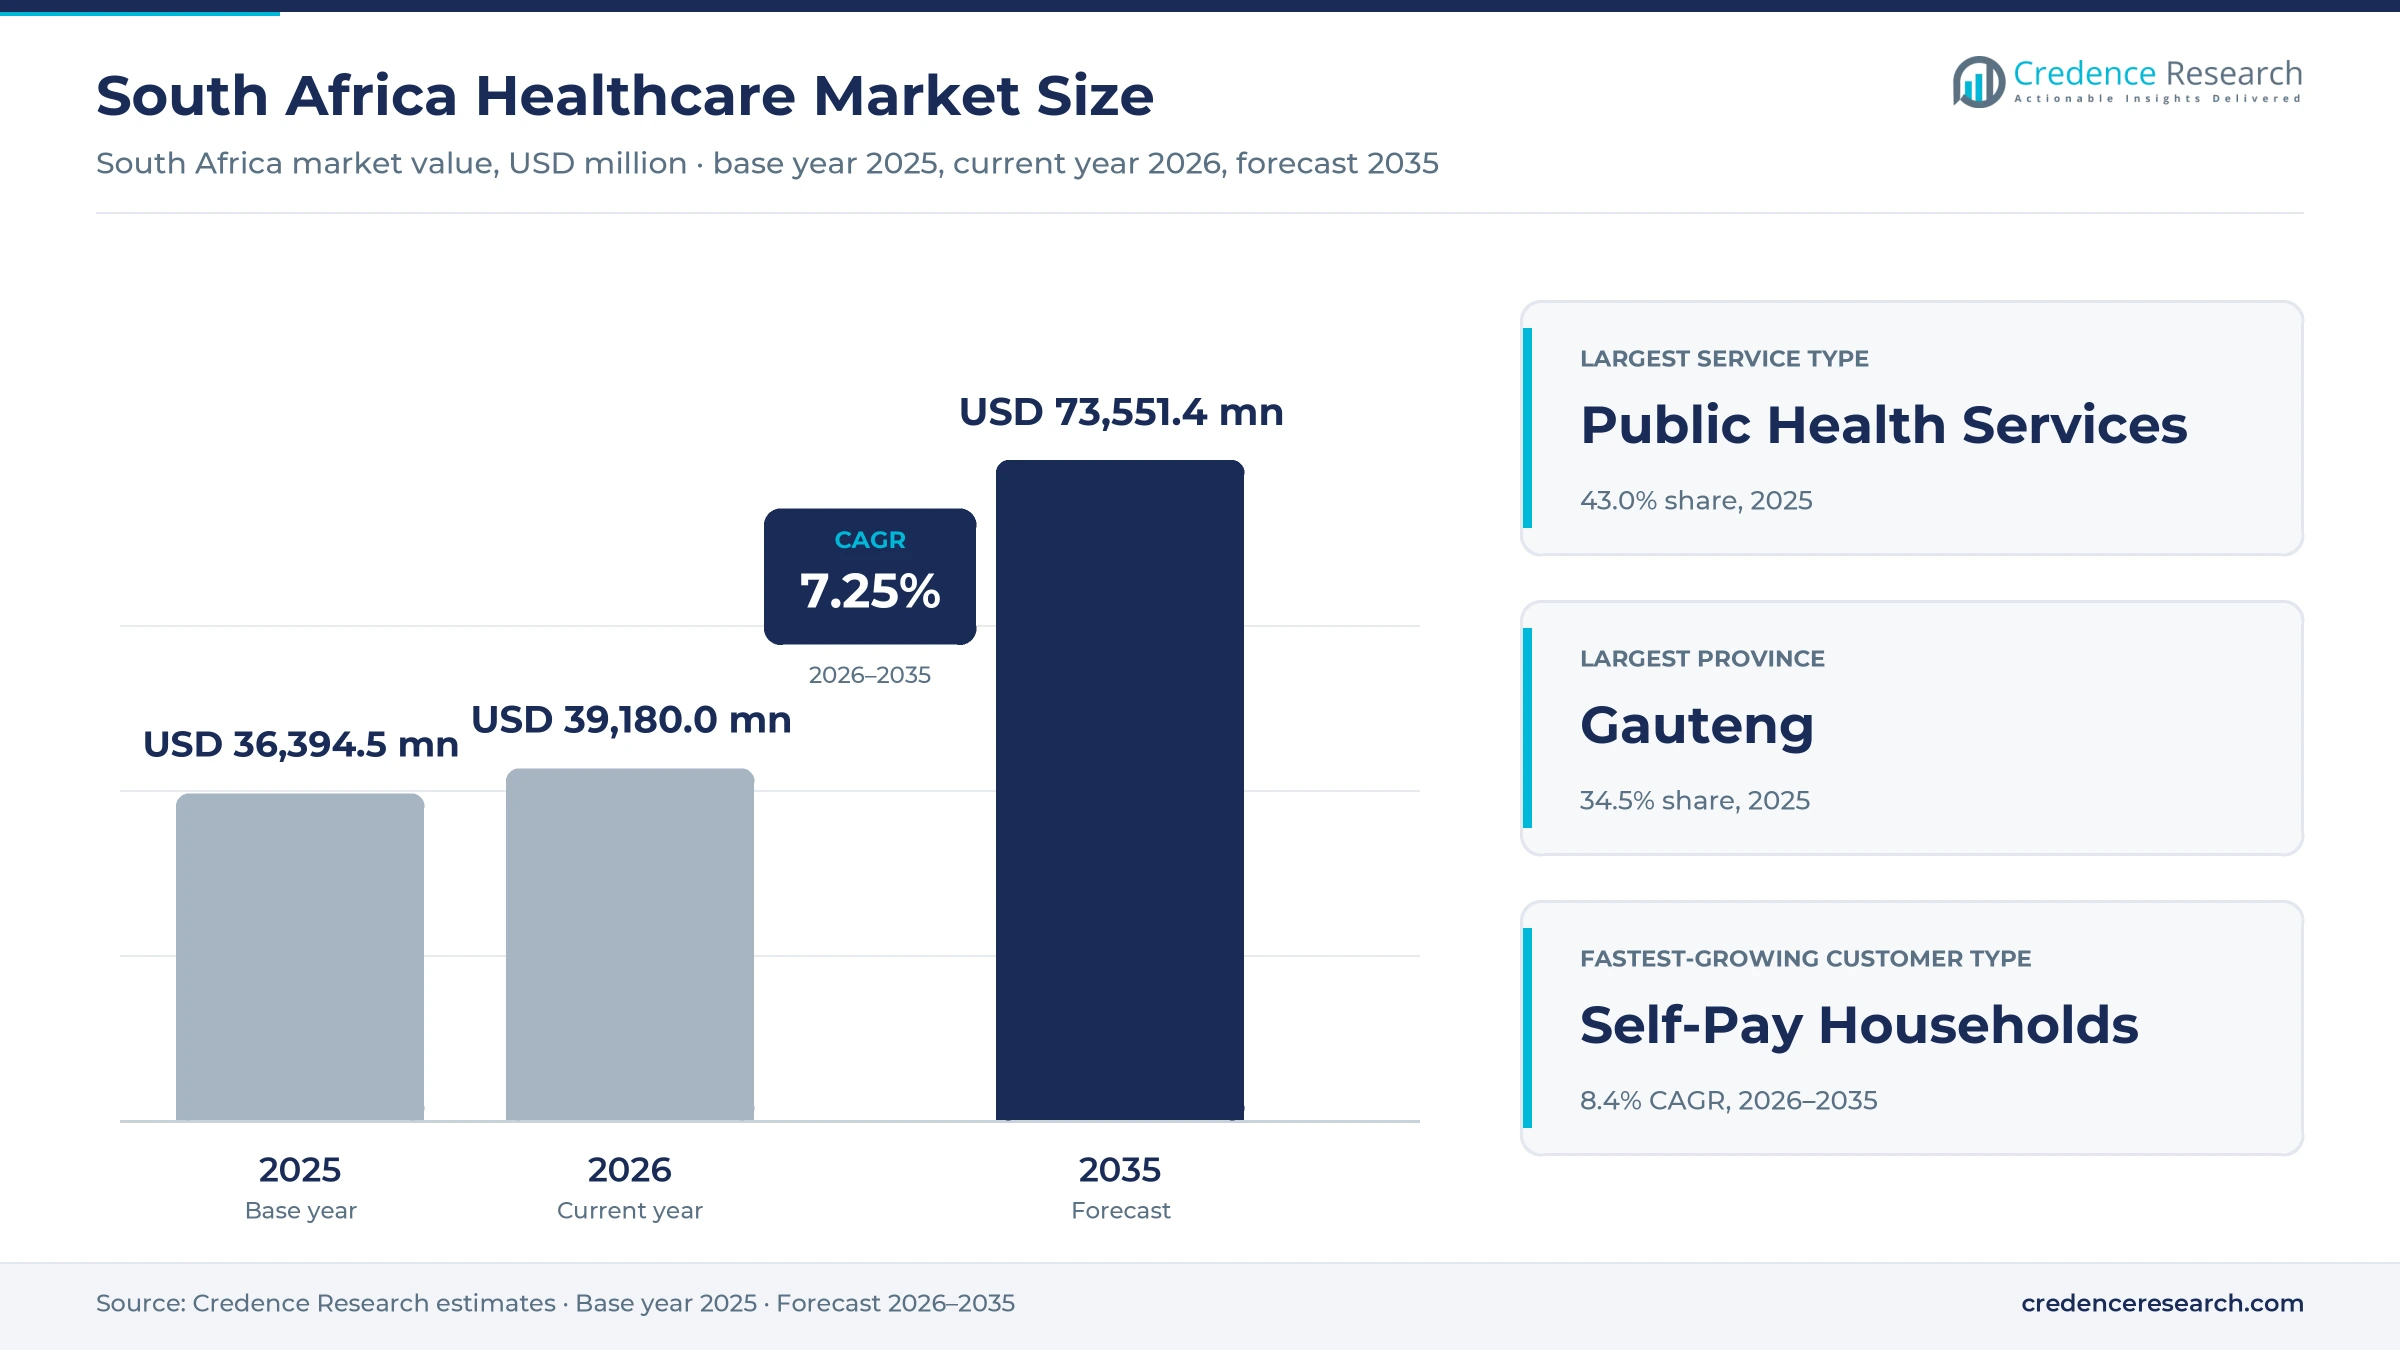
The South Africa healthcare market was valued at USD 36.39 billion in 2025 and is projected to increase from USD 39.18 billion in 2026 to USD 73.55 billion by 2035, registering a CAGR of 7.25% during 2026–2035. Spending is split between provincial and national health budgets that serve the uninsured majority and medical schemes that fund private hospitals, specialists and pharmacies for a smaller insured group. Gauteng held the largest provincial share, 34.5% in 2025, because it combines the biggest population with the largest insured base and the main referral hospitals. The Western Cape is the fastest-growing province at 7.8% a year, as migration and new private hospital capacity add patients. Growth in the private sector now comes more from tariffs, specialist care and a heavier clinical mix than from new members, while the public sector is rehiring doctors and rolling out twice-yearly HIV prevention injections in its clinics.
Which public and private spending makes up the market?
The estimate covers spending on public hospitals, clinics and community services, private hospital care, specialist, general practitioner and allied health services, medicines, devices and laboratory tests. It counts care funded by national and provincial budgets, medical schemes, households paying out of pocket and donor programs for HIV and tuberculosis. Each purchase is counted once, at the price paid to the provider or supplier.
The estimate excludes medical scheme administration fees, health research budgets, the construction cost of new facilities and the training of health workers. The value chain runs from drug makers, device suppliers and wholesalers through public tenders, scheme networks and retail pharmacies to hospitals, clinics, doctors and patients.
South Africa Healthcare Market Insights
- The market was valued at USD 36.39 billion in 2025 and is projected to reach USD 73.55 billion by 2035, registering a CAGR of 7.25% during 2026–2035.
- Gauteng held 34.5% of spending in 2025, because it has the largest population, the largest insured base and the main referral hospitals in the country.
- Government purchasers led with 47.0% of 2025 value, while medical schemes spent R259.3 billion on care for 9.17 million beneficiaries in 2024.
- Gauteng began rolling out twice-yearly lenacapavir HIV prevention injections at 133 clinics on June 8, 2026, shifting public procurement toward long-acting drugs.
- Life Healthcare is building the 140-bed Life Paarl Valley Hospital for opening in the second half of 2027, a sign of private capacity following Western Cape growth.
Public services lead as self-pay spending grows fastest
Why do public health services lead spending?
Based on service type, the market is categorized into public health services, private hospital services, medical products and nonhospital private services. Public Health Services led with a 43.0% share of 2025 value. This lead reflects a public system that serves about 85% of the population, according to the U.S. International Trade Administration's 2026 country guide. Nonhospital Private Services grow fastest at 8.1% a year, as specialist rooms, day clinics and pharmacies take work out of hospital wards. Specialists already took 28.02% of medical scheme benefits in 2024 against 35.95% for hospitals, the Council for Medical Schemes reported, and Mediclinic now runs 16 day case clinics beside its 50 hospitals.
How do government, schemes and households share the bill?
Based on customer type, the market is categorized into government purchasers, medical schemes, self-pay households and donor-funded purchasers. Government Purchasers led with a 47.0% share of 2025 value. National and provincial budgets fund care for the uninsured majority, while medical schemes spent R259.3 billion on care for 9.17 million beneficiaries in 2024. Self-Pay Households grow fastest at 8.4% a year, as scheme members alone paid R46.3 billion out of pocket in 2024 and World Bank data put out-of-pocket spending at 6.7% of current health expenditure in 2023. Families leaving schemes keep buying medicines and primary care, which moves spending into cash.
Why does home care grow faster than hospital care?
Based on care setting, the market is categorized into inpatient facilities, ambulatory facilities, community facilities and home care. Inpatient Facilities led with a 46.0% share of 2025 value. Acute admissions carry the largest bills, and Mediclinic alone runs more than 8,900 inpatient beds across its hospitals in South Africa and Namibia. Home Care grows fastest at 8.6% a year, as the National Health Council set aside R1.4 billion in 2025 to employ 27,000 community health workers permanently instead of through NGO contracts. A salaried outreach workforce supports follow-up for chronic and HIV patients at home, while private nursing firms serve insured patients after discharge.
| Segment Group | Leading Sub-segment | Share, 2025 | Fastest-growing Sub-segment | CAGR, 2026–2035 |
|---|---|---|---|---|
| By Service Type | Public Health Services | 43.0% | Nonhospital Private Services | 8.1% |
| By Customer Type | Government Purchasers | 47.0% | Self-Pay Households | 8.4% |
| By Care Setting | Inpatient Facilities | 46.0% | Home Care | 8.6% |
Contributions rise faster than hospital and drug prices
Prices in the market are set in three separate ways, and each moves on its own timetable. Medical schemes reset contributions every year from claims experience, so increases track hospital and specialist costs rather than general inflation. Medicine prices follow the regulated single exit price, which the Health Department adjusts by notice, as the October 2026 increase in the table shows. Hospital groups negotiate annual tariffs with each scheme, and Life Healthcare's reported average increase shows that tariff growth is modest next to contribution growth. The gap is absorbed by costlier admissions, and members who choose network plans gain the most price relief.
| Price item | Typical price or fee | Basis |
|---|---|---|
| Discovery Health Medical Scheme contributions | 7.2% weighted average increase, effective April 1, 2026 | Discovery Health Medical Scheme via Bizcommunity, Oct. 2025 |
| Other open scheme contributions | Bonitas 8.8%, Fedhealth 9.6% and Momentum Health 9.9% average increases for 2026 | Scheme announcements via Daily Maverick, Nov. 2025 |
| Regulator guidance on 2026 increases | Guideline of 3.3% for contribution and tariff increases, plus reasonable utilization estimates | Council for Medical Schemes via Daily Maverick, Nov. 2025 |
| Private hospital tariffs | Life Healthcare average tariff increase of 3.3% in the six months to March 2026 | Life Healthcare results via Daily Maverick, May 2026 |
| Registered medicines | 2.88% uniform single exit price increase from Oct. 1, 2026 | National Department of Health, Sept. 2026 |
| Lenacapavir HIV prevention in public clinics | USD 40 per person per year | Health Department via SAnews, Oct. 2025 |
Request a Free Sample
Fill in your details and we'll send you a free sample report.
- Sample data tables & charts
- Research methodology
Chronic treatment, metro demand and repricing drive value
Why does recurring treatment keep demand steady?
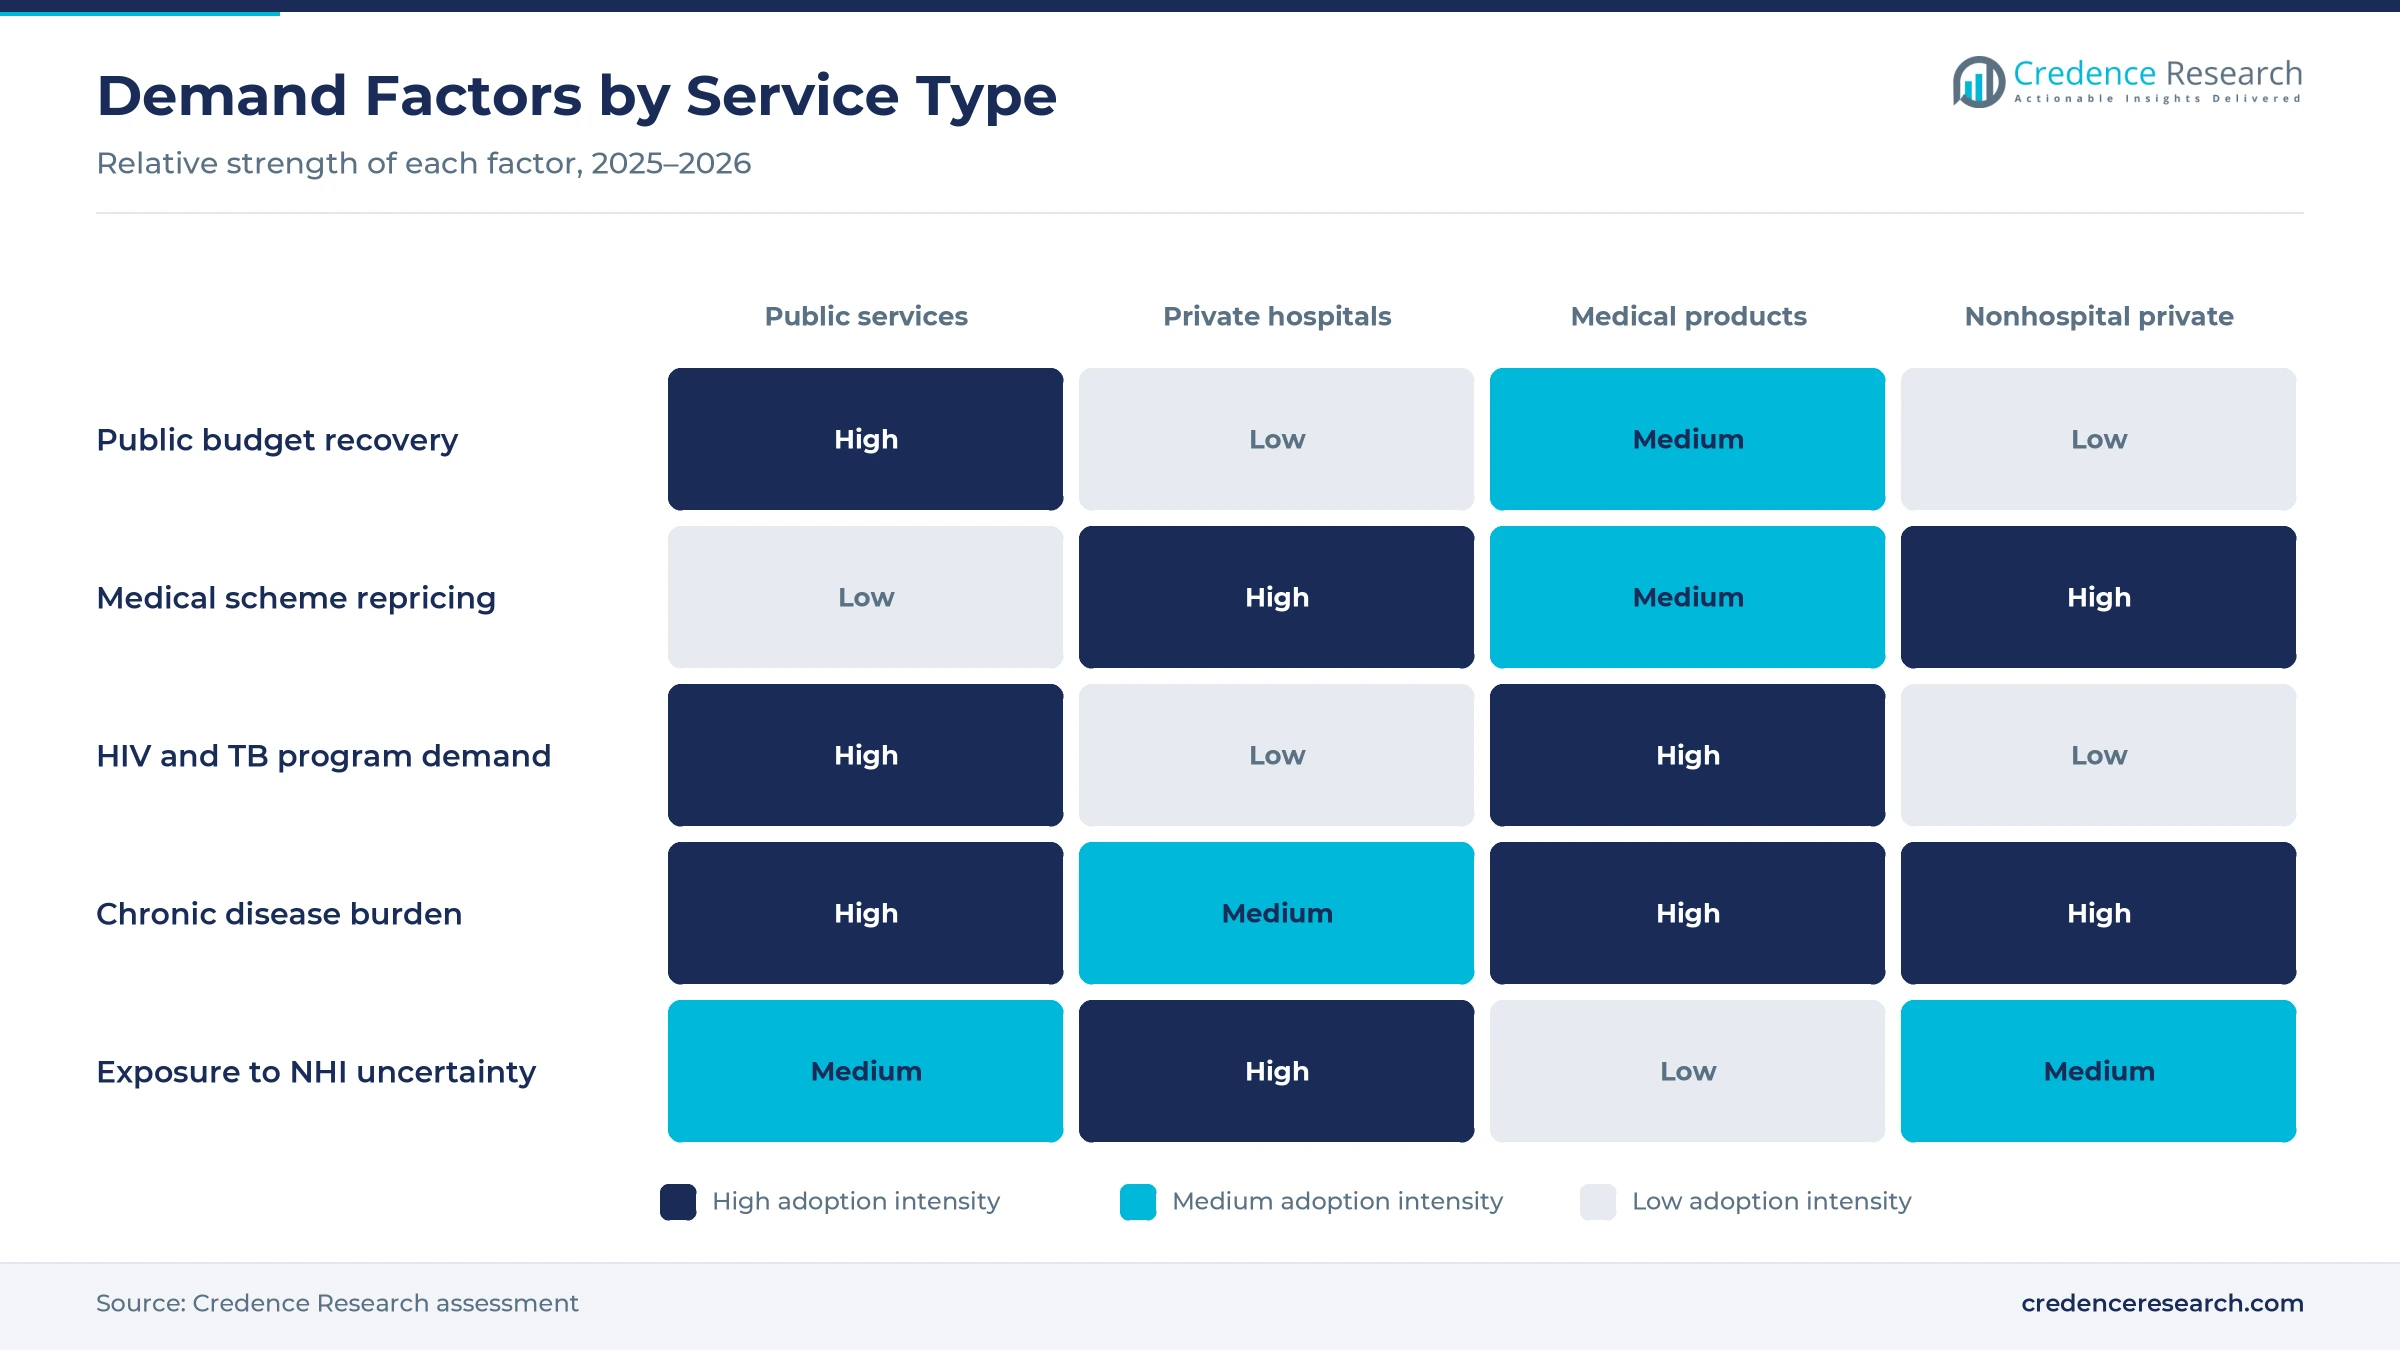
Recurring treatment for chronic and infectious disease gives the market a base of demand that changes little with the economic cycle. About 6.18 million people were on antiretroviral treatment in 2025, according to the Thembisa model results reported by Spotlight in May 2026. Diabetes was the leading underlying cause of death in 2024 at 6.1% of deaths, with hypertensive diseases second, according to Stats SA. On the funded side, the Council for Medical Schemes 2024 industry report shows managed care programs covering 99.11% of scheme beneficiaries, while prescribed minimum benefits took 57.43% of risk benefits paid. Chronic patients anchor pharmacy, laboratory and specialist volumes in both sectors, so suppliers can plan production and contracts around multiyear demand rather than seasonal swings.
How does metropolitan density concentrate care?
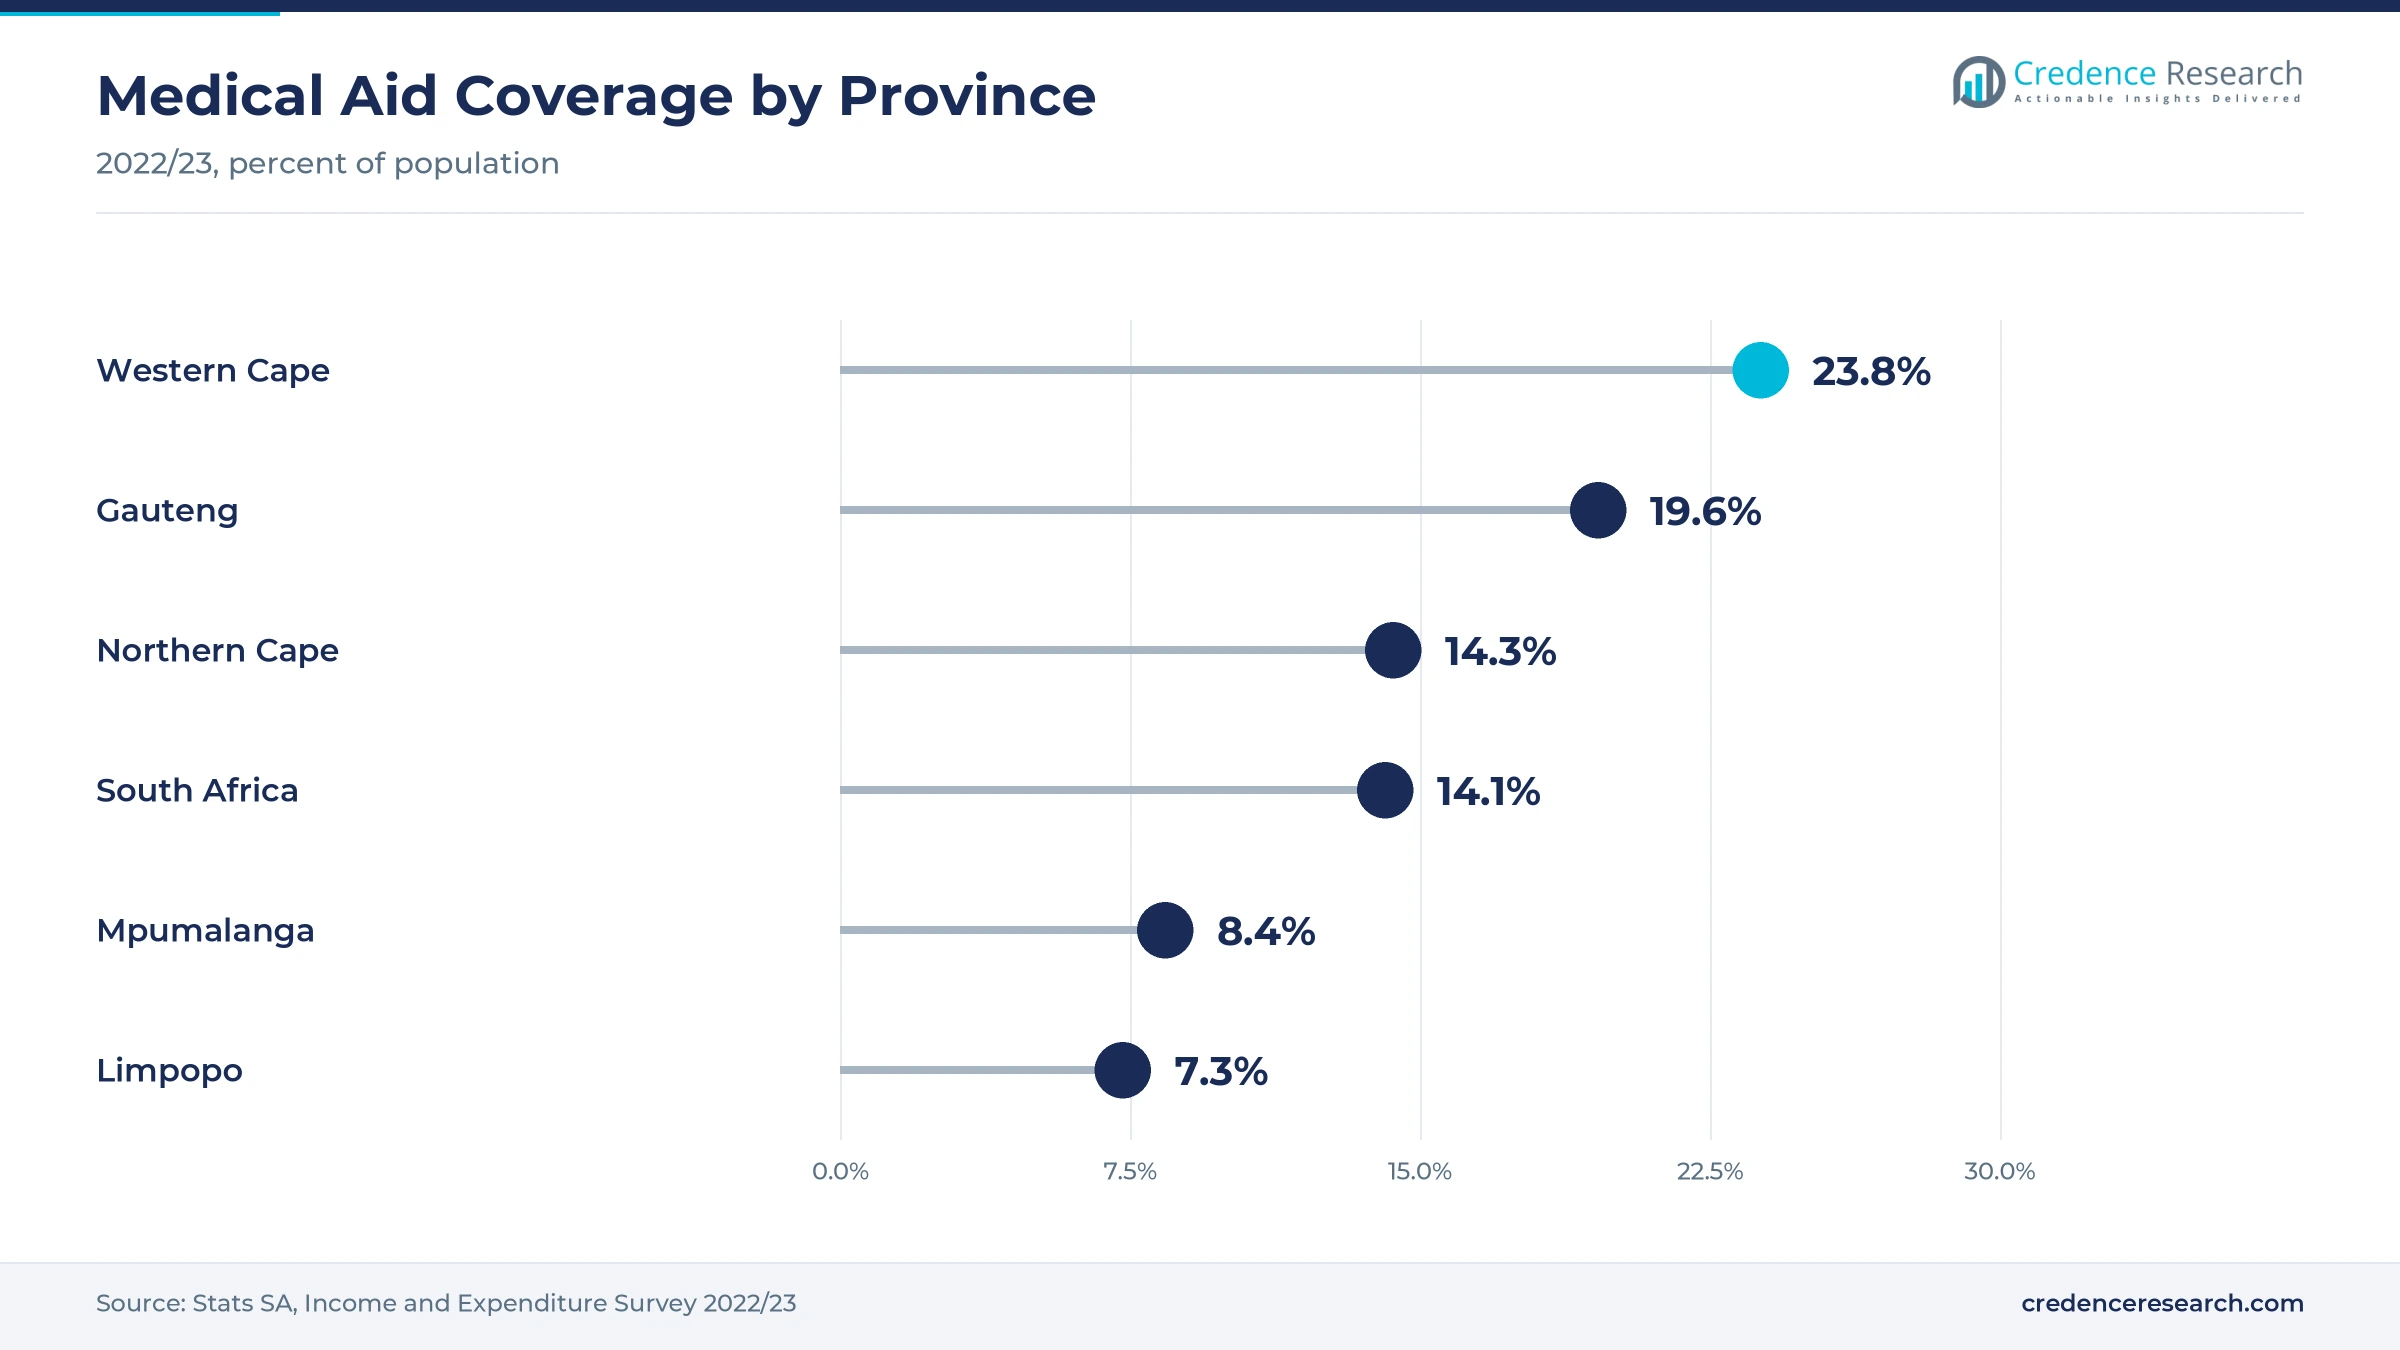
Specialist and hospital spending concentrates where population, insured households and referral hospitals overlap. Gauteng held about 16.1 million people in mid-2025, the most of any province, and Stats SA expects it to gain about 1.42 million migrants between 2021 and 2026. Its share of value is higher than its share of people, because 19.6% of Gauteng residents held medical aid in 2022/23 against 14.1% nationally, according to Stats SA's household health spending survey. The Western Cape shows the same pattern with the highest coverage of any province and steady migration gains from other provinces. Suppliers launching imaging, oncology or cardiac services usually start in these two provinces, where insured patient density is high enough to fill new capacity.
How do clinical mix and tariffs lift insured spending?
Insured spending grows faster than membership because each admission now costs more and patients arrive sicker. The cost per private hospital admission rose 9.88% in 2024, while scheme membership grew only 0.45%, according to the Council for Medical Schemes figures cited above. Average beneficiary age rose from 32 to 34.2 in the same year, and Netcare reported in November 2025 that its case mix remained more complex than before COVID-19, with acute length of stay flat at 4.5 days. Schemes pass these costs into contributions, and the 2026 increases shown in the pricing table run well above the regulator's guidance. Private value growth is therefore driven by price and acuity, which rewards hospitals with intensive care, cardiac and oncology capacity.
Is public budget repair restoring demand?
Public spending, the largest pool of funds, is being rebuilt after several years of real cuts. Consolidated government spending on health was set at R298.9 billion for 2025/26 in the 2025 Budget Review. National Treasury then added R6.7 billion to reverse austerity, according to the Health Department budget vote speech of July 9, 2025. The National Health Council used that money to hire 1,200 doctors along with nurses and other clinicians and to buy 1.4 million hospital items such as beds, mattresses and linen. Treasury also released R753.5 million to replace lost U.S. HIV funding. These allocations matter for suppliers because provincial tenders for consumables, maintenance and medicines restart once overdue accounts are paid, which favors established local distributors.
Digital wards and injectable HIV prevention reshape care
How is digital care spreading through private wards?
Digital clinical delivery is moving from pilots into the daily routine of private hospitals. Netcare completed the first phase of its digital program in 2024, putting an electronic medical record in place across the group, and SAHPRA has approved its algorithm for early detection of sepsis in intensive care patients. The group also runs 127 point-of-care devices in 19 emergency departments and said in November 2025 that continuous-monitoring wearables would soon reach all general ward patients. Rivals must match these tools to keep specialists and scheme contracts. Hospital capital spending is shifting from beds toward software, devices and data teams, a recurring service market that grows even though Netcare's total paid patient days rose only 0.7% in 2025.
Why is HIV prevention shifting to long-acting injections?
HIV prevention is moving from daily pills toward a twice-yearly injection, which changes what public clinics buy and how often patients return. The Global Fund-backed program announced in October 2025 provides about 912,000 lenacapavir doses for roughly 456,000 initiations over two years at about 360 public clinics in high-incidence districts. The first batch of 37,920 doses arrived in April 2026, and Gauteng began rollout at 133 clinics on June 8, 2026. Suppliers of antiretroviral drugs face a product mix that tilts toward long-acting forms, while clinics gain capacity because fewer refill visits are needed for each client kept on prevention.
Can mental health and rehabilitation beds fill a gap?
Mental health and rehabilitation care is the clearest capacity opening for private hospitals in the country. Mental health demand is rising fastest, as Netcare's mental health paid patient days rose 3.4% in the six months to March 2026, Daily Maverick reported. Netcare is adding a new Netcare Akeso hospital in Polokwane and two more mental health units in Tshwane by March 2027. Life Healthcare reported 72.7% occupancy in mental health and acute rehabilitation and plans more rehabilitation beds. In the public sector, Gauteng is adding 287 mental health beds at Sterkfontein Psychiatric Hospital. Operators that combine psychiatric, rehabilitation and step-down beds can win scheme contracts for longer episodes that acute wards serve poorly.
Can pharmacy chains become a primary care channel?
Retail pharmacy chains give self-paying and lightly insured patients a cheaper first stop than a doctor's rooms, which opens a channel for primary care. Clicks opened a net 60 pharmacies in its 2025 financial year to reach 780, and it says more than half of South Africans live within five kilometers of one. Dis-Chem ended February 2025 with 285 retail pharmacy stores and planned 39 more for its next financial year. Medicine prices in these outlets follow the regulated single exit price, so chains compete on nurse clinics, chronic dispensing and loyalty benefits rather than on drug prices. Retail pharmacy networks that add testing and consultations can capture spending from households that are dropping medical aid.
Scheme strain, provincial debts and NHI litigation weigh
Scheme strain is cutting private hospital volumes
Scheme affordability is now cutting directly into private hospital volumes. Life Healthcare's paid patient days fell 0.4% in the six months to March 2026, and the group said they would have risen 0.9% without the curatorship of Sizwe Hosmed, Daily Maverick reported in May 2026. Netcare said GEMS had moved its Tanzanite option to prescribed minimum benefits only. When members buy down to hospital plans or narrow networks, specialists and hospitals lose elective cases first. Operators respond with network deals and day surgery, which lowers cost per case but also revenue per admission.
Provincial debts delay payments to suppliers
Weak provincial finances remain the main risk to public demand for medicines, devices and services. Medico-legal contingent liabilities fell from a peak of about R110 billion in 2019/20 to R50.6 billion in 2025/26, while accruals owed by provincial health departments stood at R20.5 billion, according to the medium-term budget policy statement of October 2026. Provinces also owed the National Health Laboratory Service R10.7 billion. Suppliers to provinces face late payment as a result, so many price in working capital costs or limit credit to the better-run departments.
U.S. funding withdrawal leaves gaps in HIV services
The loss of U.S. funding has slowed the HIV program that drives much of public clinic demand. PEPFAR made up about 17% of the country's R44.4 billion HIV program, Daily Maverick reported in July 2025, after USAID issued notices in February 2025 terminating funding for many PEPFAR-funded organizations. The treatment program described above added only about 40,000 people in 2025, while about 146,000 new infections occurred in the year to mid-2025, according to the Thembisa model. Slower case-finding now means higher treatment costs later for provincial clinics.
NHI litigation clouds long-term investment plans
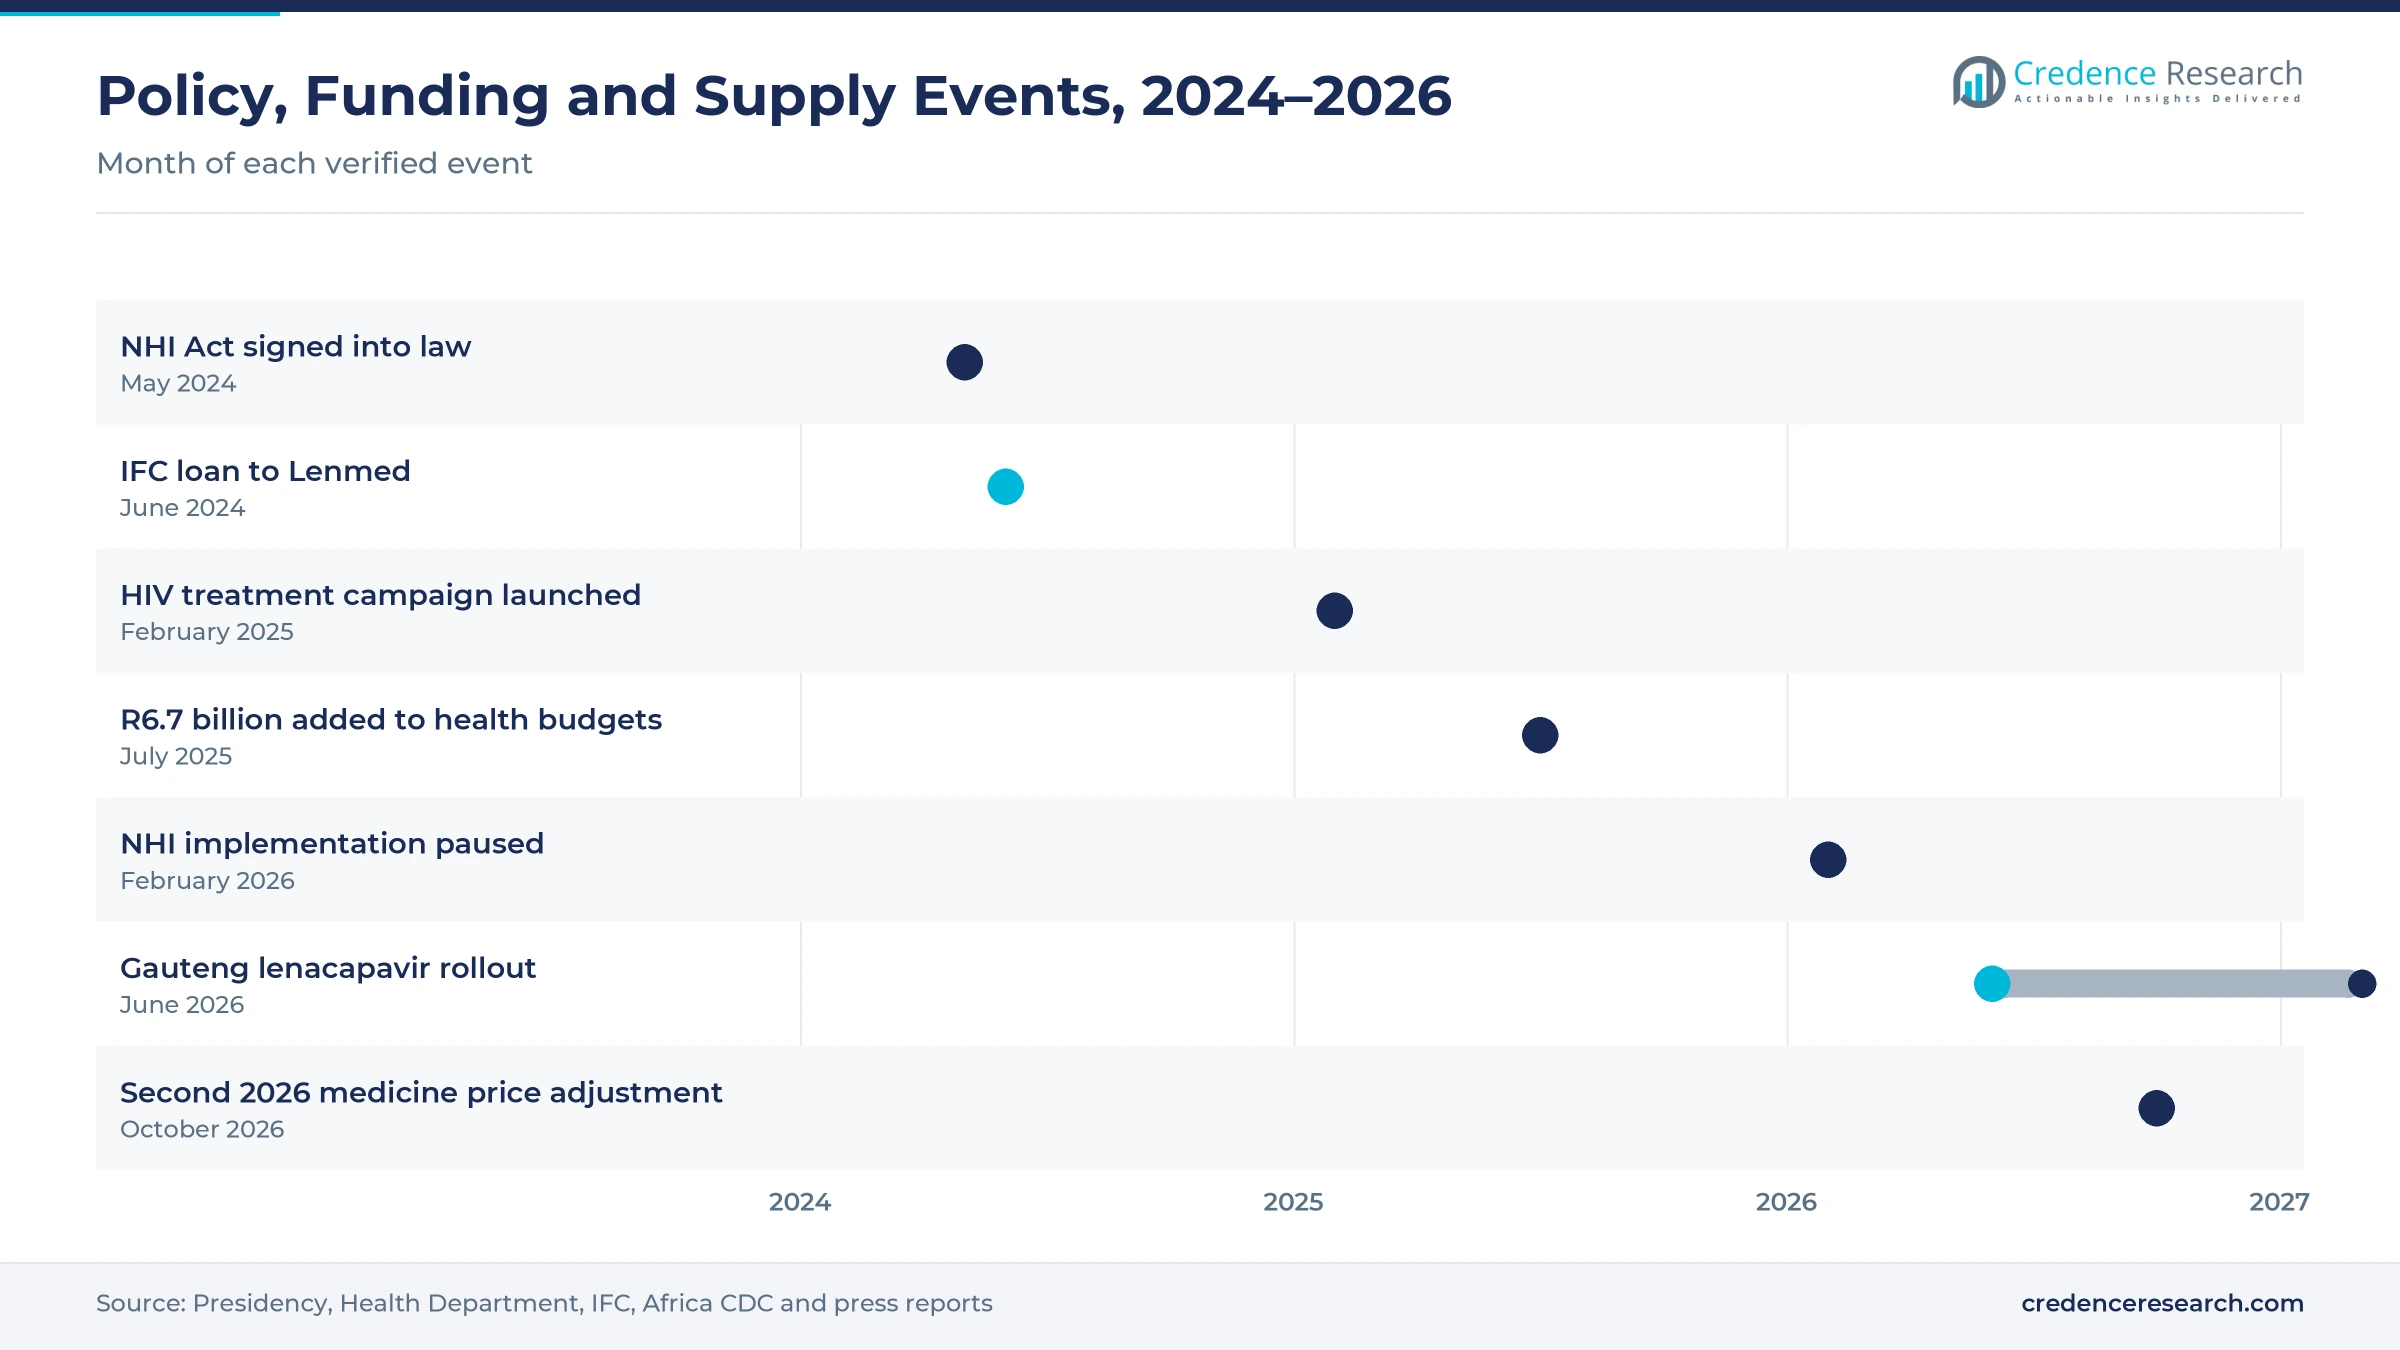
Legal uncertainty over National Health Insurance makes long-term investment harder for funders, hospital groups and suppliers. President Cyril Ramaphosa signed the NHI Act on May 15, 2024, but on Feb. 24, 2026, EWN reported that the Presidency would not implement the law until the Constitutional Court rules on challenges to it. The Board of Healthcare Funders and the Western Cape government argue that public participation in the law was flawed. Until the court decides, schemes cannot plan benefit design with confidence and hospital groups hold back some capacity spending.
Gauteng leads while the Western Cape grows fastest
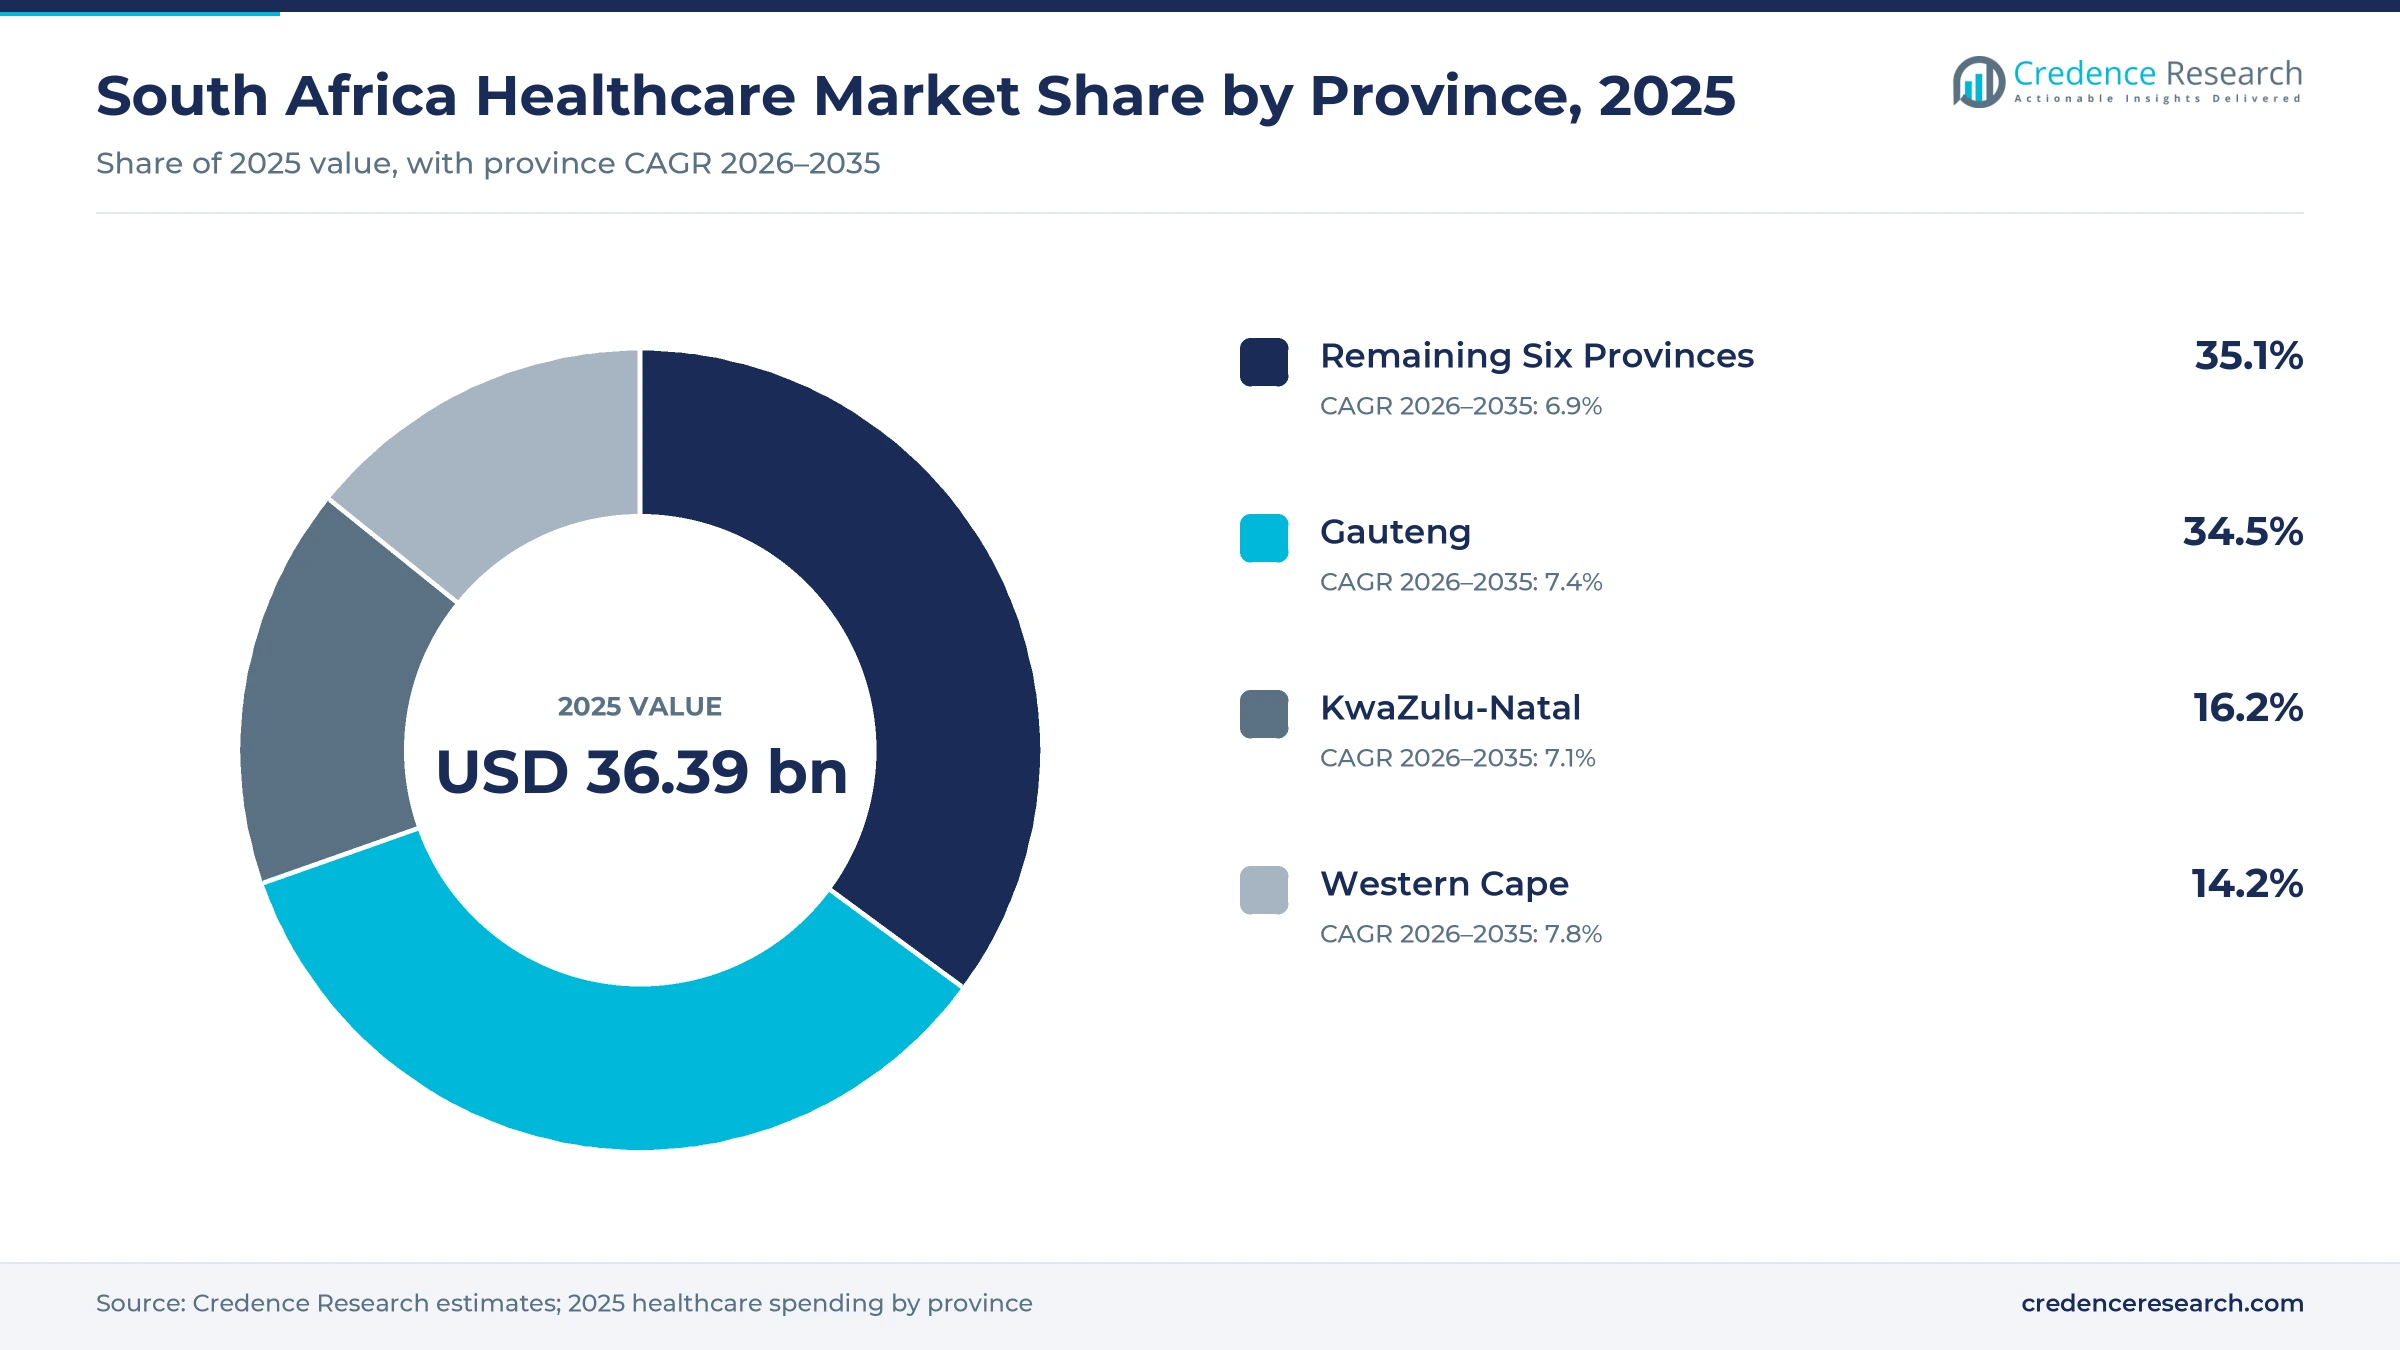
Provincial shares follow where people live, where medical aid is held and where referral hospitals sit, so Gauteng and the Western Cape carry more value than their population alone suggests. All provincial shares and growth rates are Credence Research estimates.
| Province | Value, 2025 (USD billion) | Share, 2025 | CAGR, 2026–2035 |
|---|---|---|---|
| Remaining Six Provinces | 12.77 | 35.1% | 6.9% |
| Gauteng | 12.56 | 34.5% | 7.4% |
| KwaZulu-Natal | 5.90 | 16.2% | 7.1% |
| Western Cape | 5.17 | 14.2% | 7.8% |
Gauteng combines the biggest public budget and insured base
Gauteng held a 34.5% share of 2025 value and grows at 7.4% a year, the largest provincial market in the country by a wide margin. Its health department received R67 billion for 2025/26, including R38.4 billion for primary health care and R5.4 billion for HIV and TB, The Citizen reported in July 2025. The province also has the largest insured population noted in the driver analysis. This mix of a large public budget and many insured residents makes Gauteng the first market for most new private services and equipment.
KwaZulu-Natal spending runs through public clinics
KwaZulu-Natal held a 16.2% share of 2025 value and grows at 7.1% a year. The province is home to about 12.2 million people, 19.4% of the national population, yet its share of value sits below its population share because public clinics, where spending per patient is lower, carry most of the demand. Its health department received R56 billion for 2025/26, up from R52 billion and 35% of the provincial budget, according to the budget tabled on March 25, 2025. Tender procurement and HIV programs therefore decide much of its growth.
The Western Cape grows fastest on people and private beds
The Western Cape held a 14.2% share of 2025 value and grows fastest at 7.8% a year. More than 75% of residents still rely on a public system of 561 service points that recorded over 25 million patient contacts in a year, and the provincial health budget reached R32 billion for 2025/26. It was also the only province with a clean health audit in 2025/26. Private investment is following its growing population, with Life Healthcare building the 140-bed Life Paarl Valley Hospital for opening in the second half of 2027.
The remaining six provinces depend on new public capacity
The remaining six provinces held a 35.1% share of 2025 value and grow at 6.9% a year. Medical aid coverage is lowest here, at 7.3% in Limpopo and 8.4% in Mpumalanga in 2022/23, so public facilities carry most care. The Health Department reported in July 2025 that Limpopo Central Hospital was 26% complete and Siloam District Hospital 90% complete. Private groups are also moving in, with Netcare planning an 87-bed Netcare Akeso mental health hospital in Polokwane.
Funding, policy and supply moves from 2024 to 2026
| Development | Status and market relevance |
|---|---|
| In June 2024, IFC agreed a R200 million loan to Lenmed as part of a R2.5 billion package to expand its hospitals. | Funded; bed growth toward almost 3,000 |
| In February 2025, the Health Department launched a campaign to put about 1.1 million more people living with HIV on treatment. | Under way; lifts testing and treatment demand |
| In July 2025, National Treasury added R6.7 billion to public health budgets, funding new doctors and hospital supplies. | Allocated; restarts provincial procurement |
| In February 2026, the Presidency said the NHI Act would not be implemented until the Constitutional Court rules on challenges. | Pending; court hearing set for May 2026 |
| In May 2026, Africa CDC and Aspen Pharmacare said they were in advanced talks on long-term vaccine supply from Aspen's Gqeberha plant. | In negotiation; local sterile manufacturing |
Records, analytics and long-acting drugs change delivery
- Electronic medical records now run across Netcare hospitals after the group finished the first phase of its digital program, giving clinicians one patient view from admission to discharge.
- Sepsis prediction software flags intensive care patients at risk early, and SAHPRA has approved the algorithm Netcare uses, a first step for regulated clinical software in private wards.
- Point-of-care testing returns blood results inside emergency departments and intensive care units, which shortens the time to a treatment decision and cuts laboratory transport.
- Long-acting injectables reduce clinic refill visits, as twice-yearly lenacapavir now shows in public HIV prevention, freeing nurse time for new clients.
Need a Custom Version of This Report?
Tailor the scope, geography, or segments to your exact requirements.
- Custom geography or segment scope
- Direct access to our analyst team
Hospital groups compete for scheme networks and specialists
Competition in the South Africa healthcare market is organized around funders and networks rather than individual patients. Hospital groups compete for inclusion in scheme networks, for specialists who admit patients and for complex cases that carry higher tariffs. Mediclinic Southern Africa, Netcare and Life Healthcare lead acute care, while Lenmed is expanding with IFC-backed funding. Clicks and Dis-Chem compete for chronic dispensing and front-shop health spending, with new stores as their main lever. Aspen Pharmacare supplies medicines and sterile manufacturing from Gqeberha, and global equipment makers such as GE HealthCare compete for CT and MRI contracts with private radiology practices as well as through public tenders. Public tenders reward the lowest compliant price, so many suppliers run separate public and private ranges and keep two sales teams.
How is the supply side organized?
The supply side is split between a concentrated private hospital sector and a public network run by nine provincial departments. The U.S. International Trade Administration names Netcare, Life Healthcare, Mediclinic Southern Africa and the National Hospital Network as the four groups that dominate private hospitals. Below them, Lenmed ran 19 hospitals with 2,318 beds in June 2024 and planned to reach almost 3,000 beds with a R2.5 billion loan package. Entry is costly because a new hospital needs admitting specialists and scheme network contracts, so margins sit with groups that own referral relationships and with ancillary services such as dialysis units and pathology.
Key hospital groups, pharmacies and suppliers
| Company | Type | Role in the market |
|---|---|---|
| Mediclinic Southern Africa | Private hospital group | 50 hospitals, 16 day case clinics and more than 8,900 beds in South Africa and Namibia |
| Netcare Limited | Private hospital group | Digitized hospitals, Netcare Akeso mental health facilities and Medicross pathology at 24 sites |
| Life Healthcare Group Holdings | Private hospital group | More than 60 facilities; building the 140-bed Life Paarl Valley Hospital |
| Lenmed Health | Private hospital group | 19 hospitals in 2024, expanding with an IFC-backed loan package |
| Clicks Group Limited | Retail pharmacy chain | 780 pharmacies within five kilometers of more than half the population |
| Dis-Chem Pharmacies Limited | Retail pharmacy chain | 285 retail pharmacy stores with 39 openings planned |
| Aspen Pharmacare Holdings Limited | Pharmaceutical manufacturer | Sterile manufacturing in Gqeberha; vaccine supply talks with Africa CDC |
| GE HealthCare | Medical equipment supplier | CT, MRI and C-arm systems for private radiology practices |
Credence Research view on price-led private growth
Credence Research's view is that the South Africa healthcare market will grow mainly through price, acuity and public rebuilding rather than through more insured people. Scheme membership is close to flat, so private growth depends on tariffs, specialist care and new service lines such as mental health, rehabilitation and day surgery. Public spending keeps its lead, but late payments and legal claims make provinces a harder customer than their budgets suggest. Suppliers that serve both sectors, price for tenders and carry working capital are best placed, while NHI remains a planning risk rather than a near-term source of demand.
Public budgets and scheme data anchor the estimate
The report uses 2025 as the base year and 2026 to 2035 as the forecast period. Market values come from the Credence Research model, checked against World Bank current health expenditure data, National Treasury budget figures and Council for Medical Schemes industry statistics. Service type, customer type, care setting and provincial splits are Credence Research estimates. Inputs include Stats SA population, mortality and household survey data, provincial budget statements, company results and announcements, regulator notices and press reports that name their sources. No interviews or surveys were used in preparing these estimates.
Self-pay, home care and the Western Cape gain to 2035
The South Africa healthcare market is expected to reach USD 73.55 billion by 2035, growing at 7.25% a year during 2026–2035. Gauteng stays the largest provincial market, while the Western Cape grows fastest on population gains and private investment. Government purchasers keep the largest share, but self-pay households grow fastest as contributions outpace incomes. Home and community care gain from the permanent outreach workforce, and private hospitals shift investment toward mental health, rehabilitation and digital monitoring. A settled NHI framework and healthier provincial finances would lift this outlook, while further donor cuts or scheme failures would slow it.
What separates the downside and upside cases?
The range of outcomes depends mainly on public budgets, scheme affordability and the NHI court process. A downside case follows if provincial accruals and legal claims absorb new allocations, donor HIV funds keep falling and scheme membership shrinks. An upside case needs real growth in provincial health budgets, steady employer-funded membership and a settled path for NHI that lets private groups contract for public patients. The base case assumes slow insured growth, price-led private spending and gradual public hiring.
| Scenario | CAGR, 2026–2035 | Value, 2035 | What has to hold |
|---|---|---|---|
| Downside | 5.8% | USD 64.80 billion | Provincial debts absorb new funds, donor HIV money keeps falling and schemes lose members |
| Base | 7.25% | USD 73.55 billion | Flat scheme membership, tariff-led private growth and gradual public hiring continue |
| Upside | 8.4% | USD 81.31 billion | Provincial budgets grow in real terms and a settled NHI path opens public contracts to private providers |
Frequently Asked Questions
How big is the South Africa healthcare market?
Who pays for healthcare in South Africa?
Which province accounts for the most healthcare spending?
How much did medical aid contributions rise in 2026?
How does the HIV program affect healthcare demand?
What is the status of National Health Insurance?
Which care setting grows fastest?
Who are the main companies in the market?
Table of Content
Chapter 1 Market Segmentation
- 1.1 Segmentation Framework
- 1.1.1 Product and Service Classification
- 1.1.2 Application and End-Use Classification
- 1.1.3 Technology and Solution Classification
- 1.1.4 Customer and Distribution Channel Classification
- 1.1.5 Geographic Segmentation
- 1.1.6 Market Segment Definitions and Boundaries
- 1.2 By Service Type
- 1.2.1 Public Health Services
- 1.2.2 Private Hospital Services
- 1.2.3 Medical Products
- 1.2.4 Nonhospital Private Services
- 1.3 By Customer Type
- 1.3.1 Government Purchasers
- 1.3.2 Medical Schemes
- 1.3.3 Self-Pay Households
- 1.3.4 Donor-Funded Purchasers
- 1.4 By Care Setting
- 1.4.1 Inpatient Facilities
- 1.4.2 Ambulatory Facilities
- 1.4.3 Community Facilities
- 1.4.4 Home Care
- 1.5 By Province
- 1.5.1 Gauteng
- 1.5.2 Western Cape
- 1.5.3 KwaZulu-Natal
- 1.5.4 Remaining Six Provinces
Chapter 2 Introduction
- 2.1 Report Objectives and Scope
- 2.2 Product Definition and Industry Terminology
- 2.3 Market Inclusions and Exclusions
- 2.4 Research Process
- 2.4.1 Primary Research and Expert Interviews
- 2.4.2 Secondary Research and Source Review
- 2.4.3 Top-Down and Bottom-Up Estimation
- 2.4.4 Data Triangulation and Verification
- 2.5 Market Size Measurement Basis
- 2.5.1 2025: USD 36.39 billion → 2035: USD 73.55 billion
- 2.6 Historical and Forecast Reference Periods
- 2.6.1 Historical Period: 2018-2025
- 2.6.2 Base Year: 2025
- 2.6.3 Forecast Period: 2025-2035
- 2.7 Research Assumptions and Limitations
Chapter 3 Executive Summary
- 3.1 Market Snapshot and Key Findings
- 3.2 Base-Year Market Size, 2025
- 3.3 Forecast Market Size, 2035
- 3.4 Revenue and Volume Growth Outlook
- 3.5 Key Demand and Supply Indicators
- 3.6 Leading Market Segments
- 3.7 Fastest-Growing Market Opportunities
- 3.8 Regional Performance Highlights
- 3.9 Technology and Industry Transformation
- 3.10 Competitive Landscape Summary
- 3.11 Analyst View and Strategic Implications
Chapter 4 South Africa Healthcare Market Trends and Developments
- 4.1 Historical Industry Development, 2018-2025
- 4.2 Recent Market Trends and Developments
- 4.3 Demand and Customer Behavior Trends
- 4.4 Technology and Product Innovation
- 4.5 Artificial Intelligence, Automation and Digitalization
- 4.6 Local Manufacturing and Supply Chain Realignment
- 4.7 Industry Partnerships, Mergers and Acquisitions
- 4.8 Sustainability and Circular Economy Developments
- 4.9 Government and Private Sector Investment Trends
- 4.10 Emerging Business Models and Commercialization
- 4.11 Industry Developments and Announcements
Chapter 5 South Africa Healthcare Market Production, Supply and Demand Analysis
- 5.1 Demand Trend and Consumption Analysis, 2018-2025
- 5.2 Demand Forecast, 2025-2035
- 5.3 Production and Output Trend, 2018-2025
- 5.4 Production and Output Forecast, 2025-2035
- 5.5 Installed Capacity and Capacity Utilization
- 5.6 Company-Wise Production Plants and Statistics
- 5.6.1 Installed Production Capacity
- 5.6.2 Actual Production
- 5.6.3 Planned Capacity and Expansion Targets
- 5.7 Supply Chain Structure and Procurement Trends
- 5.8 Supply-Demand Gap and Bottlenecks
- 5.9 Import Dependence and Sourcing Structure
- 5.10 Contract Manufacturing and Outsourcing
- 5.11 Regional Supply and Demand Concentration
Chapter 6 South Africa Healthcare Market Pricing Analysis
- 6.1 Pricing Structure and Measurement
- 6.2 Historical Pricing Trends, 2018-2025
- 6.3 Pricing Outlook, 2025-2035
- 6.4 Average Selling Price and Unit Economics
- 6.5 Pricing by Product and Market Segment
- 6.6 Geographic Pricing Differences
- 6.7 Key Input, Energy, Labor and Logistics Costs
- 6.8 Contract Pricing and Purchasing Models
- 6.9 Pricing Sensitivity and Competitive Positioning
- 6.10 Price, Margin and Profitability Implications
Chapter 7 South Africa Healthcare Market Dynamics
- 7.1 Market Growth Drivers
- 7.1.1 Demand-Side Drivers
- 7.1.2 Technology and Innovation Drivers
- 7.1.3 Infrastructure and Investment Drivers
- 7.1.4 Regulatory and Policy Drivers
- 7.2 Market Restraints
- 7.2.1 Cost and Affordability Constraints
- 7.2.2 Technology and Adoption Barriers
- 7.2.3 Supply Chain and Operational Constraints
- 7.3 Market Challenges
- 7.3.1 Competitive Pressure and Margin Erosion
- 7.3.2 Skills, Infrastructure and Implementation Gaps
- 7.4 Emerging Market Opportunities
- 7.5 Market Dynamics Impact and Time-Horizon Assessment
Chapter 8 South Africa Healthcare Value Chain Analysis
- 8.1 Industry Value Chain Overview
- 8.2 Upstream Suppliers and Critical Inputs
- 8.3 Technology and Component Providers
- 8.4 Manufacturing or Service Delivery
- 8.5 Distribution, Channel Partners and Integrators
- 8.6 Downstream Applications and End Users
- 8.7 Value Addition and Profit Pools
- 8.8 Vertical Integration and Outsourcing
- 8.9 Supplier Concentration and Risk
- 8.10 Supply Chain Localization and Resilience
Chapter 9 South Africa Healthcare Market Regulations and Policies
- 9.1 Relevant Laws, Standards and Compliance Frameworks
- 9.2 Product, Service, Safety and Quality Requirements
- 9.3 Government Policies, Incentives and Subsidies
- 9.4 Imports, Exports and Trade Barriers
- 9.5 Public Procurement and Local Content Requirements
- 9.6 Environmental and Sustainability Compliance
- 9.7 Upcoming Policy Changes and Market Implications
Chapter 10 South Africa Healthcare Market Hotspots and Opportunities
- 10.1 Market Opportunity Mapping and Growth Hotspots
- 10.2 High-Growth Applications and Customer Groups
- 10.3 Underserved Markets and White-Space Opportunities
- 10.4 Emerging Technology and Product Opportunities
- 10.5 New Capacity and Investment Hotspots
- 10.6 Market Entry and Expansion Opportunities
- 10.7 Distribution and Partnership Opportunities
- 10.8 Near-Term and Long-Term Commercial Potential
- 10.9 Opportunity Attractiveness and Execution Risks
Chapter 11 South Africa Healthcare Market Outlook, 2025-2035
- 11.1 Market Size and Analysis
- 11.1.1 Revenue (Market Measurement: 2025: USD 36.39 billion → 2035: USD 73.55 billion)
- 11.1.2 Market Volume and Quantity Sold
- 11.1.3 Historical Market Size, 2018-2025
- 11.1.4 Base-Year Market Size, 2025
- 11.2 Market Forecast, 2025-2035
- 11.2.1 Revenue Forecast to 2035
- 11.2.2 Volume Forecast to 2035
- 11.2.3 CAGR and Year-on-Year Growth
- 11.2.4 Incremental Revenue Opportunity
- 11.3 Forecast Assumptions and Scenario Analysis
- 11.3.1 Base-Case Forecast
- 11.3.2 Optimistic and Conservative Scenarios
- 11.3.3 Technology, Pricing and Policy Sensitivities
- 11.4 Market Attractiveness and Growth Outlook
Chapter 12 South Africa Healthcare Market Segmentation and Outlook
- 12.1 Segmentation Summary and Market Shares, 2025
- 12.2 Largest and Fastest-Growing Segments
- 12.3 By Service Type - Market Size and Forecast, 2025-2035
- 12.3.1 Segment Definition and Scope
- 12.3.2 Historical Market Size, 2018-2025
- 12.3.3 Revenue Forecast, 2025-2035
- 12.3.4 Volume Forecast, 2025-2035
- 12.3.5 Base-Year Market Share, 2025
- 12.3.6 Segment CAGR and Growth Drivers
- 12.3.7 Subsegment Market Size and Forecast
- 12.3.7.1 Public Health Services
- 12.3.7.2 Private Hospital Services
- 12.3.7.3 Medical Products
- 12.3.7.4 Nonhospital Private Services
- 12.3.8 Subsegment Pricing and Adoption Trends
- 12.3.9 Leading Suppliers and Competition
- 12.3.10 Regional Demand and Opportunities
- 12.4 By Customer Type - Market Size and Forecast, 2025-2035
- 12.4.1 Segment Definition and Scope
- 12.4.2 Historical Market Size, 2018-2025
- 12.4.3 Revenue Forecast, 2025-2035
- 12.4.4 Volume Forecast, 2025-2035
- 12.4.5 Base-Year Market Share, 2025
- 12.4.6 Segment CAGR and Growth Drivers
- 12.4.7 Subsegment Market Size and Forecast
- 12.4.7.1 Government Purchasers
- 12.4.7.2 Medical Schemes
- 12.4.7.3 Self-Pay Households
- 12.4.7.4 Donor-Funded Purchasers
- 12.4.8 Subsegment Pricing and Adoption Trends
- 12.4.9 Leading Suppliers and Competition
- 12.4.10 Regional Demand and Opportunities
- 12.5 By Care Setting - Market Size and Forecast, 2025-2035
- 12.5.1 Segment Definition and Scope
- 12.5.2 Historical Market Size, 2018-2025
- 12.5.3 Revenue Forecast, 2025-2035
- 12.5.4 Volume Forecast, 2025-2035
- 12.5.5 Base-Year Market Share, 2025
- 12.5.6 Segment CAGR and Growth Drivers
- 12.5.7 Subsegment Market Size and Forecast
- 12.5.7.1 Inpatient Facilities
- 12.5.7.2 Ambulatory Facilities
- 12.5.7.3 Community Facilities
- 12.5.7.4 Home Care
- 12.5.8 Subsegment Pricing and Adoption Trends
- 12.5.9 Leading Suppliers and Competition
- 12.5.10 Regional Demand and Opportunities
- 12.6 By Province - Market Size and Forecast, 2025-2035
- 12.6.1 Segment Definition and Scope
- 12.6.2 Historical Market Size, 2018-2025
- 12.6.3 Revenue Forecast, 2025-2035
- 12.6.4 Volume Forecast, 2025-2035
- 12.6.5 Base-Year Market Share, 2025
- 12.6.6 Segment CAGR and Growth Drivers
- 12.6.7 Subsegment Market Size and Forecast
- 12.6.7.1 Gauteng
- 12.6.7.2 Western Cape
- 12.6.7.3 KwaZulu-Natal
- 12.6.7.4 Remaining Six Provinces
- 12.6.8 Subsegment Pricing and Adoption Trends
- 12.6.9 Leading Suppliers and Competition
- 12.6.10 Regional Demand and Opportunities
- 12.7 Segment Growth Comparison
- 12.8 Segment Attractiveness and Priority Matrix
Chapter 13 South Africa Healthcare End-Use and Application Market Outlook
- 13.1 End-Use Industry and Customer Demand Structure
- 13.2 Leading Applications and Customer Groups
- 13.3 End-Use Market Size, Share and Forecast
- 13.4 Major End-Use Industry Deep Dives
- 13.4.1 Customer Requirements and Use Cases
- 13.4.2 Demand and Replacement Cycles
- 13.4.3 Technical and Regulatory Considerations
- 13.4.4 Purchasing and Procurement Models
- 13.4.5 Leading Vendors and Distribution Channels
- 13.4.6 Forecast and Commercial Opportunities
- 13.5 Emerging Applications and Cross-Segment Demand
- 13.6 End-Use Industry Investment Priorities
Chapter 14 South Africa Healthcare Geographic Market Outlook, 2025-2035
- 14.1 Domestic Market Distribution and Demand Clusters
- 14.2 State- or Province-Wise Market Size and Forecast, 2025-2035
- 14.3 City and Metropolitan Market Outlook
- 14.4 Industrial, Manufacturing and Commercial Clusters
- 14.5 Geographic Concentration of Key End Users
- 14.6 Local Pricing and Purchasing Differences
- 14.7 Domestic Production Facilities and Capacity Map
- 14.8 Local Infrastructure and Project Pipeline
- 14.9 State-Level Policy and Incentive Differences
- 14.10 Subnational Investment Hotspots and Opportunities
- 14.11 Distribution and Logistics Networks
- 14.12 Domestic Competitive Footprint
Chapter 15 South Africa Healthcare Technology, Innovation and Sustainability Outlook
- 15.1 Technology Landscape and Maturity
- 15.2 Product, Process and Service Innovation
- 15.3 AI, Automation and Digital Tools in the Industry
- 15.4 Technology Adoption and Performance Benchmarking
- 15.5 Innovation Pipeline and R&D Investment
- 15.6 Patent and Intellectual Property Trends
- 15.7 Energy Efficiency and Resource Management
- 15.8 Sustainability, Recycling and Circularity
- 15.9 Technology Roadmap, 2025-2035
- 15.10 Risks of Obsolescence and Technology Substitution
Chapter 16 South Africa Healthcare Market Key Strategic Imperatives
- 16.1 Growth and Market Entry Priorities
- 16.2 High-Return Products and Segments
- 16.3 Pricing, Profitability and Cost Optimization
- 16.4 Technology Investment and Product Differentiation
- 16.5 Supply Chain Localization and Resilience
- 16.6 Distribution and Customer Acquisition
- 16.7 Partnership, Acquisition and Capacity Strategy
- 16.8 Regional Expansion Priorities
- 16.9 Short-, Medium- and Long-Term Actions
Chapter 17 Competition Outlook
- 17.1 Industry Competition Characteristics
- 17.2 Market Structure and Concentration
- 17.3 Market Share and Competitive Positioning, 2025
- 17.4 Company-Wise Revenue and Product Benchmarking
- 17.5 Production and Service Capacity Benchmarking
- 17.6 Technology, Pricing and Differentiation
- 17.7 Regional Footprint and Distribution Strength
- 17.8 Mergers, Acquisitions and Strategic Alliances
- 17.9 New Entrants and Competitive Threats
- 17.10 Porter's Five Forces and Industry Attractiveness
- 17.11 Competitive Outlook, 2025-2035
Chapter 18 Company Profiles
- 18.1 Company Coverage and Selection Criteria
- 18.2 Mediclinic Southern Africa
- 18.2.1 Business Description
- 18.2.2 Company Ownership and Geographic Presence
- 18.2.3 Product and Service Portfolio
- 18.2.4 Manufacturing and Operating Footprint
- 18.2.5 Production Capacity and Expansion Plans
- 18.2.6 Financial Performance and Investment
- 18.2.7 Market Share and Competitive Position
- 18.2.8 Technology and Innovation Capabilities
- 18.2.9 Strategic Alliances or Partnerships
- 18.2.10 Recent Developments
- 18.2.11 Growth Strategy and Outlook
- 18.3 Netcare Limited
- 18.4 Life Healthcare Group Holdings
- 18.5 Dis-Chem Pharmacies Limited
- 18.6 Clicks Group Limited
- 18.7 Aspen Pharmacare Holdings Limited
- 18.8 Siemens Healthineers
- 18.9 Philips Healthcare
- 18.10 GE HealthCare
- 18.11 Lenmed Health
- 18.12 Other Relevant Market Participants
Note: Every listed company is profiled on the structure shown under the first company. The company list is preliminary and may change based on research findings, market developments, data availability and client requirements.
Chapter 19 Disclaimer
- 19.1 Research and Forecast Disclaimer
- 19.2 Data Source and Estimation Limitations
Note: The depth of individual sections depends on data availability for this market. Volume, capacity, trade and other unit-based metrics are included where applicable.