
Market Overview
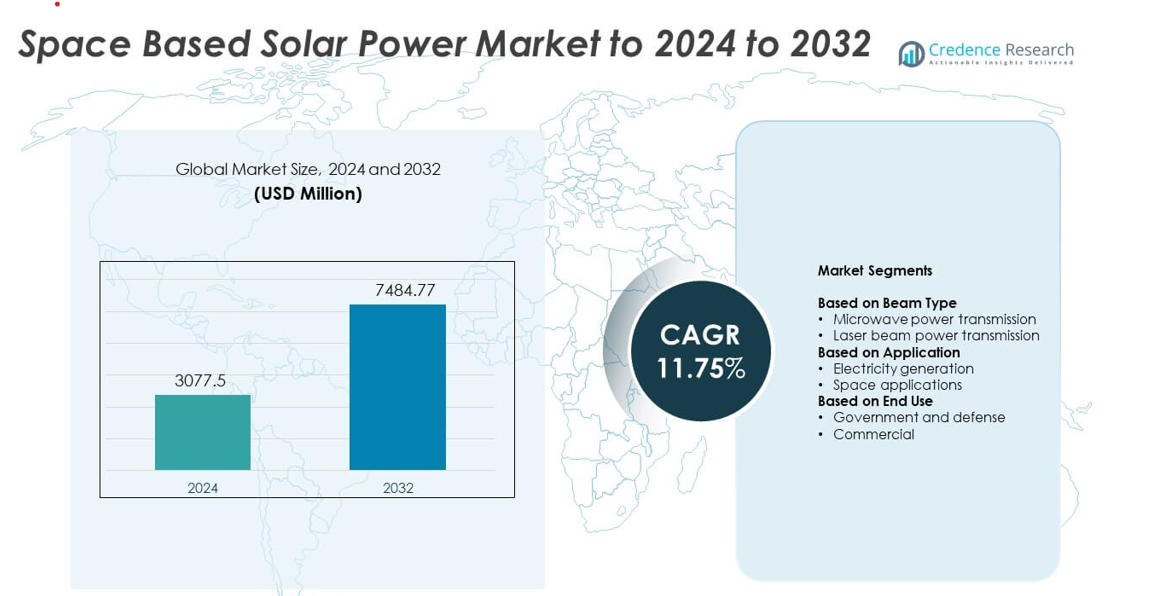
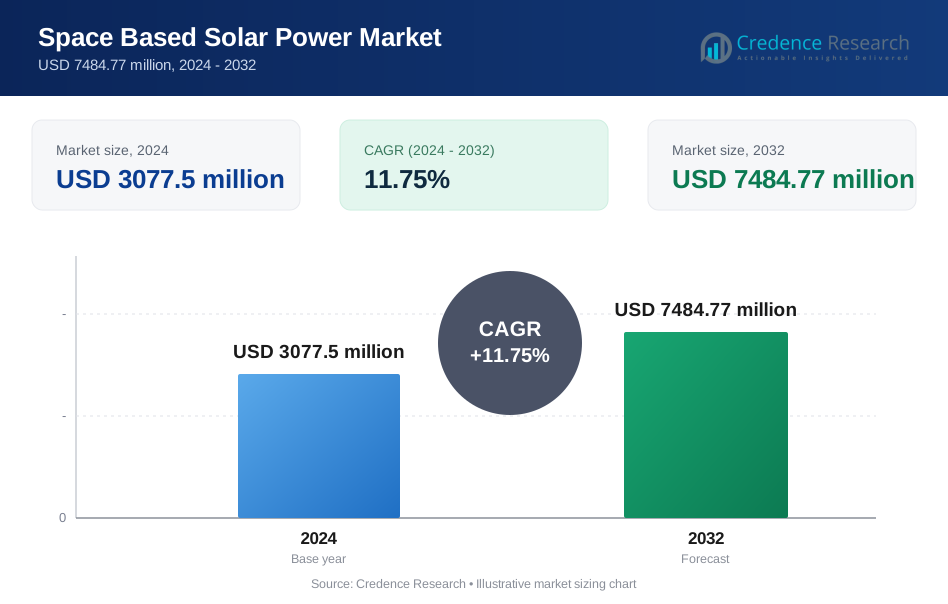
Space Based Solar Power Market size was valued at USD 3077.5 million in 2024 and is anticipated to reach USD 7484.77 million by 2032, at a CAGR of 11.75% during the forecast period.
| REPORT ATTRIBUTE | DETAILS |
|---|---|
| Historical Period | 2020-2023 |
| Base Year | 2024 |
| Forecast Period | 2025-2032 |
| Space Based Solar Power Market Size 2024 | USD 3077.5 million |
| Space Based Solar Power Market, CAGR | 11.75% |
| Space Based Solar Power Market Size 2032 | USD 7484.77 million |
The Space Based Solar Power Market features leading participants such as Thales Alenia Space, Emrod, Northrop Grumman, Celestia Energy, Japan Aerospace Exploration Agency, Sirin Orbital Systems, Airbus, China Academy of Space Technology, SpaceTech, and Metasat. These organizations advance wireless power transmission, orbital solar array development, and modular satellite platforms to support large-scale space energy systems. North America remained the leading region in 2024 with a 38% share, supported by strong government programs, high investment levels, and advanced aerospace capabilities. Asia Pacific followed with rising momentum driven by national demonstration projects and expanding launch infrastructure.
Market Insights
- The Space Based Solar Power Market reached USD 3077.5 million in 2024 and is projected to hit USD 7484.77 million by 2032, growing at a CAGR of 11.75%.
- Rising demand for uninterrupted clean energy and advances in microwave transmission systems drive adoption across government and commercial sectors.
- Key trends include large-scale demonstration missions, lightweight solar array innovations, and modular satellite architectures gaining wider implementation.
- Competitive activity intensifies as major aerospace and energy technology developers accelerate testing of power-beaming systems and expand global partnerships.
- North America led with 38% share, followed by Asia Pacific at 30% and Europe at 27%, while microwave transmission held 68% share among beam types and electricity generation led applications with 72% share.
Market Segmentation Analysis:
By Beam Type
Microwave power transmission led the Space Based Solar Power Market in 2024 with about 68% share. Strong adoption came from its higher energy transfer efficiency, lower atmospheric loss, and proven use in long-distance wireless power trials. Developers favored microwave systems because they operate reliably in varied weather and support large-scale power beaming. Laser beam power transmission grew at a steady pace due to rising interest in high-precision applications and compact transmission hardware, but microwave systems remained dominant due to safety maturity and broader technology readiness.
- For instance, JAXA transmitted 1.8 kilowatts by microwaves to a receiver 55 meters away.
By Application
Electricity generation dominated this segment in 2024 with nearly 72% share. Growth came from rising demand for continuous, space-based renewable energy supply that avoids night-time and weather variability seen on Earth. National space agencies and private developers invested in orbital power satellites to support grid-scale energy needs. Space applications advanced as well, supported by interest in powering spacecraft, lunar bases, and deep-space missions, but electricity generation held the largest share due to stronger commercial viability and government-backed pilot programs.
- For instance, Emrod beamed 550 watts over 36 meters with 95% transmission efficiency inside an Airbus facility.
By End Use
Government and defense held the leading position in 2024 with about 64% share. Defense agencies drove investment in resilient, uninterrupted power supply from orbit to support strategic energy independence and remote operations. Governments supported large demonstration projects, policy frameworks, and long-term research partnerships that strengthened early adoption. Commercial use grew as private firms explored orbital solar platforms for future clean-energy supply, but remained smaller due to high initial costs and long development cycles.
Key Growth Drivers
Rising demand for uninterrupted clean energy
Global focus on stable renewable energy supply drives strong interest in orbital solar platforms. Nations aim to reduce reliance on fossil fuels and expand high-availability clean power sources that bypass limits such as weather shifts and night-time loss. This shift pushes investment into high-efficiency photovoltaic systems that operate continuously in space. Governments support feasibility studies, while private firms explore large-scale demonstrations. The ability to deliver steady power to remote regions strengthens adoption and positions space-based solar power as a long-term strategic energy asset.
- For instance, Enel Green Power operates 67.2 gigawatts of renewables, generating 74.5 terawatt-hours in one year.
Advancements in wireless power transmission technologies
Progress in microwave and laser-based power beaming enhances efficiency, safety, and reliability across long distances. Engineering improvements allow higher accuracy in beam steering, reduced atmospheric loss, and stronger ground-receiver performance. These gains help developers scale orbital power stations and reduce energy waste. Defense agencies and space research groups continue to test advanced rectennas and phased-array systems, expanding commercialization potential. Higher technology readiness levels attract new partnerships and funding, supporting rapid market expansion across both government and commercial sectors.
- For instance, Xidian University built a 75-meter-high steel structure ground verification facility named the "Chasing the Sun" project to simulate power generation and transmission technologies for a space solar power station.
Growing national and private-sector space investments
Governments increase spending on orbital energy research, satellite manufacturing, and launch capabilities. National space agencies fund multi-year programs to explore large solar arrays and modular power satellites. Private companies enter the sector through new innovations in lightweight structures, deployable panels, and low-cost launch services. This rising investment strengthens the supply chain and accelerates prototype deployment. Growing global interest in space sustainability further boosts development, making high-capacity space solar systems a priority for long-term energy strategy.
Key Trends & Opportunities
Large-scale demonstration projects and international partnerships
Countries expand collaborative missions to test multi-megawatt space solar designs and validate power-beaming performance. Joint programs between space agencies and defense groups accelerate testing timelines and reduce development risk. Cross-border research focuses on orbital assembly, high-efficiency photovoltaic materials, and precision beam control. These partnerships create strong opportunities for technology suppliers and new service providers. Expansion of testbeds and in-orbit demonstrations positions the market for large-scale deployment through the next decade.
- For instance, Airbus beamed energy 36 meters in Munich to power lights and green hydrogen equipment.
Shift toward lightweight materials and modular satellite architectures
Manufacturers adopt ultra-light solar arrays, foldable structures, and modular platform designs to reduce launch mass and lower project costs. New materials improve radiation resistance and enhance power density. Modular satellites offer scalable build-out and simplified maintenance, which supports both early pilots and future large constellations. This trend opens strong opportunities for aerospace suppliers, material innovators, and propulsion system developers. Lower launch costs and improved design flexibility help accelerate commercial interest.
- For instance, Northrop Grumman’s (formerly Orbital ATK) MegaFlex arrays are a high-performance, tensioned-blanket solar array technology with a current high-TRL (Technology Readiness Level) design typically around a 10-meter diameter, which has demonstrated specific powers up to 200 W/kg.
Expansion of commercial use cases in remote and energy-poor regions
Private firms explore selling orbital clean power to regions with limited grid stability or poor infrastructure. Advances in wireless energy receivers, ground rectenna stations, and secure beam-management systems support commercial models. This trend creates openings for energy developers seeking long-term contracts and governments aiming to improve energy access. Growing interest in off-grid industrial operations, military bases, and island nations further widens opportunity for early deployments.
Key Challenges
High cost of development, launch, and orbital deployment
Large initial investment remains a major barrier for widespread adoption. Space-based solar systems need heavy funding across satellite manufacturing, launch services, in-orbit assembly, and long-term maintenance. Even with declining launch costs, total program expenses remain high for most commercial players. Governments lead early funding efforts, but private firms face difficulty securing financing for multi-year projects. These economic hurdles slow large-scale deployment and extend commercialization timelines.
Technical complexity and safety concerns in power beaming
Wireless transmission requires precise beam alignment, stable atmospheric conditions, and advanced receiver technology. Ensuring safe operation without unintended energy dispersion poses engineering challenges. Regulatory agencies also monitor beam safety, orbital placement, and frequency allocation, which can delay approvals. The complexity of assembling and maintaining large solar arrays in orbit increases technical risk. These challenges demand rigorous testing, specialized infrastructure, and long-term coordination between governments and industry partners.
Regional Analysis
North America
North America led the Space Based Solar Power Market in 2024 with about 38% share. The region benefited from strong government-backed research programs, expanding defense investments, and rising interest in orbital clean-energy initiatives. Agencies advanced large demonstration projects focused on microwave power transmission and high-efficiency solar arrays. The presence of major aerospace companies and launch service providers supported faster technology development. Growing emphasis on resilient energy systems for remote bases and disaster-prone areas further increased adoption. Public–private partnerships strengthened the region’s leadership through continuous funding and early deployment efforts.
Europe
Europe accounted for nearly 27% share in 2024, supported by rising collaboration among national space agencies and strong commitments toward renewable energy independence. The region advanced feasibility studies on orbital solar platforms and invested in lightweight photovoltaic materials to reduce launch mass. The European Union promoted long-term research programs that aimed to diversify clean-energy sources. Aerospace manufacturers contributed through innovations in solar array design and in-orbit assembly concepts. Growing interest in sustainable power for defense and civilian applications positioned Europe as a key contributor to global technology development and future deployments.
Asia Pacific
Asia Pacific held about 30% share in 2024, driven by significant investments from China, Japan, and South Korea in large-scale orbital energy systems. Regional governments accelerated prototype testing, beam-control research, and modular satellite design. China advanced multi-megawatt demonstration plans, while Japan pursued precision laser transmission studies under its national space initiatives. Rapid growth in manufacturing capabilities and falling launch costs strengthened Asia Pacific’s competitive position. Expanding energy needs across densely populated regions increased interest in uninterrupted space-based power, supporting rapid technology development and long-term deployment potential.
Latin America
Latin America captured around 3% share in 2024, reflecting early-stage adoption supported by growing interest in renewable power diversification. Several countries explored partnerships with global space agencies to evaluate feasibility for remote energy supply. Rising demand for stable, off-grid electricity in isolated regions encouraged long-term studies. Limited aerospace infrastructure slowed near-term deployment, yet academic and research groups initiated small-scale wireless power projects. As regional energy policies shift toward sustainability, opportunities for collaboration and technology transfer are expected to expand.
Middle East and Africa
Middle East and Africa held about 2% share in 2024, driven mainly by interest in long-term clean-energy strategies and future orbital power imports. High solar demand, remote industrial sites, and energy-intensive operations encouraged exploration of advanced renewable options. Several governments evaluated partnerships for beam-receiver infrastructure and long-distance transmission concepts. Limited domestic space capabilities slowed early progress, yet investment momentum continued due to strong energy security goals. Growing interest in next-generation power technologies positions the region for gradual adoption as global deployment costs decline.
Market Segmentations:
By Beam Type
- Microwave power transmission
- Laser beam power transmission
By Application
- Electricity generation
- Space applications
By End Use
- Government and defense
- Commercial
By Geography
- North America
- U.S.
- Canada
- Mexico
- Europe
- Germany
- France
- U.K.
- Italy
- Spain
- Rest of Europe
- Asia Pacific
- China
- Japan
- India
- South Korea
- South-east Asia
- Rest of Asia Pacific
- Latin America
- Brazil
- Argentina
- Rest of Latin America
- Middle East & Africa
- GCC Countries
- South Africa
- Rest of the Middle East and Africa
Competitive Landscape
The competitive landscape features Thales Alenia Space, Emrod, Northrop Grumman, Celestia Energy, Japan Aerospace Exploration Agency, Sirin Orbital Systems, Airbus, China Academy of Space Technology, SpaceTech, and Metasat as the primary participants shaping the Space Based Solar Power Market. Developers focus on advancing wireless power transmission, lightweight solar array engineering, and modular satellite designs to strengthen technology readiness. Companies invest in high-efficiency photovoltaic structures, precision beam-control systems, and scalable orbital platforms to support future multi-megawatt deployments. Strategic partnerships between aerospace firms, research institutes, and government programs enhance technical capabilities and reduce project risks. Industry players also emphasize cost reduction through improved manufacturing processes and next-generation launch solutions. Growing interest in clean orbital power encourages continuous innovation across engineering, testing, and system integration, leading to broader adoption opportunities over the forecast period.
Key Player Analysis
- Thales Alenia Space
- Emrod
- Northrop Grumman
- Celestia Energy
- Japan Aerospace Exploration Agency
- Sirin Orbital Systems
- Airbus
- China Academy of Space Technology
- SpaceTech
- Metasat
Recent Developments
- In 2024, Japan Space Systems with JAXA and university partners achieved the world’s first long-range wireless power transmission from an aircraft at about 7 km altitude to a ground rectenna roughly 5.5 km below, using microwaves.
- In September 2022, Airbus, ESA and Emrod carried out a microwave power-beaming demonstration at Airbus’ X-Works facility in Munich. The setup converted solar electricity to RF and beamed it across a hangar to a rectenna, illustrating a key link needed for future space-based solar power architectures.
- In 2022, Emrod announced a joint demo with Airbus and ESA where its wireless power technology beamed RF energy indoors as part of an ESA SOLARIS-related test
Report Coverage
The research report offers an in-depth analysis based on Beam Type, Application, End-Use and Geography. It details leading market players, providing an overview of their business, product offerings, investments, revenue streams, and key applications. Additionally, the report includes insights into the competitive environment, SWOT analysis, current market trends, as well as the primary drivers and constraints. Furthermore, it discusses various factors that have driven market expansion in recent years. The report also explores market dynamics, regulatory scenarios, and technological advancements that are shaping the industry. It assesses the impact of external factors and global economic changes on market growth. Lastly, it provides strategic recommendations for new entrants and established companies to navigate the complexities of the market.
Future Outlook
- Space-based solar systems will shift from small pilots to larger multi-megawatt demonstrations.
- Microwave transmission will gain wider adoption due to higher efficiency and safety maturity.
- Falling launch costs will accelerate deployment of modular power satellites.
- Governments will increase funding for orbital clean-energy programs and feasibility studies.
- Private space companies will enter commercial power-beaming projects at a faster pace.
- Advances in lightweight materials will improve power density and reduce system mass.
- International collaborations will expand to share testing facilities and technical standards.
- Ground receiver stations will evolve to support higher accuracy and safer beam alignment.
- Remote regions will emerge as early adopters of space-derived clean energy.
- Regulatory frameworks will strengthen to manage beam safety, orbital use, and energy delivery.
Request a Free Sample
Fill in your details and we'll send you a free sample report.
- Sample data tables & charts
- Research methodology
Need a Custom Version of This Report?
Tailor the scope, geography, or segments to your exact requirements.
- Custom geography or segment scope
- Direct access to our analyst team
Frequently Asked Questions
What is the current market size for Space Based Solar Power Market, and what is its projected size in 2032?
At what Compound Annual Growth Rate is the Space Based Solar Power Market projected to grow between 2024 and 2032?
Which Space Based Solar Power Market segment held the largest share in 2024?
What are the primary factors fueling the growth of the Space Based Solar Power Market?
Who are the leading companies in the Space Based Solar Power Market?
Table of Content
Chapter 1 Market Segmentation
- 1.1 Segmentation Framework
- 1.1.1 Product and Service Classification
- 1.1.2 Application and End-Use Classification
- 1.1.3 Technology and Solution Classification
- 1.1.4 Customer and Distribution Channel Classification
- 1.1.5 Geographic Segmentation
- 1.1.6 Market Segment Definitions and Boundaries
Chapter 2 Introduction
- 2.1 Report Objectives and Scope
- 2.2 Product Definition and Industry Terminology
- 2.3 Market Inclusions and Exclusions
- 2.4 Research Process
- 2.4.1 Primary Research and Expert Interviews
- 2.4.2 Secondary Research and Source Review
- 2.4.3 Top-Down and Bottom-Up Estimation
- 2.4.4 Data Triangulation and Verification
- 2.5 Market Size Measurement Basis
- 2.5.1 2024: USD 3077.5 million → 2032: USD 7484.77 million
- 2.6 Historical and Forecast Reference Periods
- 2.6.1 Base Year: 2024
- 2.6.2 Forecast Period: 2024-2032
- 2.7 Research Assumptions and Limitations
Chapter 3 Executive Summary
- 3.1 Market Snapshot and Key Findings
- 3.2 Base-Year Market Size, 2024
- 3.3 Forecast Market Size, 2032
- 3.4 Revenue and Volume Growth Outlook
- 3.5 Key Demand and Supply Indicators
- 3.6 Leading Market Segments
- 3.7 Fastest-Growing Market Opportunities
- 3.8 Regional Performance Highlights
- 3.9 Technology and Industry Transformation
- 3.10 Competitive Landscape Summary
- 3.11 Analyst View and Strategic Implications
Chapter 4 Global Space Based Solar Power Market Trends and Developments
- 4.1 Historical Industry Development
- 4.2 Recent Market Trends and Developments
- 4.3 Demand and Customer Behavior Trends
- 4.4 Technology and Product Innovation
- 4.5 Artificial Intelligence, Automation and Digitalization
- 4.6 Local Manufacturing and Supply Chain Realignment
- 4.7 Industry Partnerships, Mergers and Acquisitions
- 4.8 Sustainability and Circular Economy Developments
- 4.9 Government and Private Sector Investment Trends
- 4.10 Emerging Business Models and Commercialization
- 4.11 Industry Developments and Announcements
Chapter 5 Global Space Based Solar Power Market Production, Supply and Demand Analysis
- 5.1 Demand Trend and Consumption Analysis
- 5.2 Demand Forecast, 2024-2032
- 5.3 Production and Output Trend
- 5.4 Production and Output Forecast, 2024-2032
- 5.5 Installed Capacity and Capacity Utilization
- 5.6 Company-Wise Production Plants and Statistics
- 5.6.1 Installed Production Capacity
- 5.6.2 Actual Production
- 5.6.3 Planned Capacity and Expansion Targets
- 5.7 Supply Chain Structure and Procurement Trends
- 5.8 Supply-Demand Gap and Bottlenecks
- 5.9 Import Dependence and Sourcing Structure
- 5.10 Contract Manufacturing and Outsourcing
- 5.11 Regional Supply and Demand Concentration
Chapter 6 Global Space Based Solar Power Market Pricing Analysis
- 6.1 Pricing Structure and Measurement
- 6.2 Historical Pricing Trends
- 6.3 Pricing Outlook, 2024-2032
- 6.4 Average Selling Price and Unit Economics
- 6.5 Pricing by Product and Market Segment
- 6.6 Geographic Pricing Differences
- 6.7 Key Input, Energy, Labor and Logistics Costs
- 6.8 Contract Pricing and Purchasing Models
- 6.9 Pricing Sensitivity and Competitive Positioning
- 6.10 Price, Margin and Profitability Implications
Chapter 7 Global Space Based Solar Power Market Dynamics
- 7.1 Market Growth Drivers
- 7.1.1 Demand-Side Drivers
- 7.1.2 Technology and Innovation Drivers
- 7.1.3 Infrastructure and Investment Drivers
- 7.1.4 Regulatory and Policy Drivers
- 7.2 Market Restraints
- 7.2.1 Cost and Affordability Constraints
- 7.2.2 Technology and Adoption Barriers
- 7.2.3 Supply Chain and Operational Constraints
- 7.3 Market Challenges
- 7.3.1 Competitive Pressure and Margin Erosion
- 7.3.2 Skills, Infrastructure and Implementation Gaps
- 7.4 Emerging Market Opportunities
- 7.5 Market Dynamics Impact and Time-Horizon Assessment
Chapter 8 Global Space Based Solar Power Value Chain Analysis
- 8.1 Industry Value Chain Overview
- 8.2 Upstream Suppliers and Critical Inputs
- 8.3 Technology and Component Providers
- 8.4 Manufacturing or Service Delivery
- 8.5 Distribution, Channel Partners and Integrators
- 8.6 Downstream Applications and End Users
- 8.7 Value Addition and Profit Pools
- 8.8 Vertical Integration and Outsourcing
- 8.9 Supplier Concentration and Risk
- 8.10 Supply Chain Localization and Resilience
Chapter 9 Global Space Based Solar Power Market Regulations and Policies
- 9.1 Relevant Laws, Standards and Compliance Frameworks
- 9.2 Product, Service, Safety and Quality Requirements
- 9.3 Government Policies, Incentives and Subsidies
- 9.4 Imports, Exports and Trade Barriers
- 9.5 Public Procurement and Local Content Requirements
- 9.6 Environmental and Sustainability Compliance
- 9.7 Upcoming Policy Changes and Market Implications
Chapter 10 Global Space Based Solar Power Market Hotspots and Opportunities
- 10.1 Market Opportunity Mapping and Growth Hotspots
- 10.2 High-Growth Applications and Customer Groups
- 10.3 Underserved Markets and White-Space Opportunities
- 10.4 Emerging Technology and Product Opportunities
- 10.5 New Capacity and Investment Hotspots
- 10.6 Market Entry and Expansion Opportunities
- 10.7 Distribution and Partnership Opportunities
- 10.8 Near-Term and Long-Term Commercial Potential
- 10.9 Opportunity Attractiveness and Execution Risks
Chapter 11 Global Space Based Solar Power Market Outlook, 2024-2032
- 11.1 Market Size and Analysis
- 11.1.1 Revenue (Market Measurement: 2024: USD 3077.5 million → 2032: USD 7484.77 million)
- 11.1.2 Market Volume and Quantity Sold
- 11.1.3 Historical Market Size
- 11.1.4 Base-Year Market Size, 2024
- 11.2 Market Forecast, 2024-2032
- 11.2.1 Revenue Forecast to 2032
- 11.2.2 Volume Forecast to 2032
- 11.2.3 CAGR and Year-on-Year Growth
- 11.2.4 Incremental Revenue Opportunity
- 11.3 Forecast Assumptions and Scenario Analysis
- 11.3.1 Base-Case Forecast
- 11.3.2 Optimistic and Conservative Scenarios
- 11.3.3 Technology, Pricing and Policy Sensitivities
- 11.4 Market Attractiveness and Growth Outlook
Chapter 12 Global Space Based Solar Power Market Segmentation and Outlook
- 12.1 Segmentation Summary and Market Shares, 2024
- 12.2 Largest and Fastest-Growing Segments
- 12.3 Segment Growth Comparison
- 12.4 Segment Attractiveness and Priority Matrix
Chapter 13 Global Space Based Solar Power Geographic Market Outlook, 2024-2032
- 13.1 Regional Market Size and Share, 2024
- 13.2 Regional Market Forecast, 2024-2032
- 13.3 Regional Pricing, Production and Demand Differences
- 13.4 North America
- 13.4.1 United States
- 13.4.2 Canada
- 13.4.3 Mexico
- 13.5 Europe
- 13.5.1 Germany
- 13.5.2 France
- 13.5.3 Italy
- 13.5.4 United Kingdom
- 13.5.5 Spain
- 13.5.6 Poland
- 13.5.7 Russia
- 13.5.8 Netherlands
- 13.5.9 Belgium
- 13.5.10 Sweden
- 13.5.11 Denmark
- 13.5.12 Norway
- 13.5.13 Rest of Europe
- 13.6 Asia Pacific
- 13.6.1 China
- 13.6.2 India
- 13.6.3 Japan
- 13.6.4 South Korea
- 13.6.5 Thailand
- 13.6.6 Indonesia
- 13.6.7 Vietnam
- 13.6.8 Malaysia
- 13.6.9 Australia
- 13.6.10 Rest of Asia Pacific
- 13.7 Latin America
- 13.7.1 Brazil
- 13.7.2 Argentina
- 13.7.3 Colombia
- 13.7.4 Chile
- 13.7.5 Rest of Latin America
- 13.8 Middle East
- 13.8.1 Saudi Arabia
- 13.8.2 United Arab Emirates
- 13.8.3 Turkey
- 13.8.4 Israel
- 13.8.5 Iran
- 13.8.6 Rest of the Middle East
- 13.9 Africa
- 13.9.1 South Africa
- 13.9.2 Egypt
- 13.9.3 Nigeria
- 13.9.4 Morocco
- 13.9.5 Rest of Africa
- 13.10 Regional Investment, Policy and Supply Chain Differences
- 13.11 Regional Competitive Landscape
- 13.12 Geographic Growth Hotspots
Chapter 14 Global Space Based Solar Power Technology, Innovation and Sustainability Outlook
- 14.1 Technology Landscape and Maturity
- 14.2 Product, Process and Service Innovation
- 14.3 AI, Automation and Digital Tools in the Industry
- 14.4 Technology Adoption and Performance Benchmarking
- 14.5 Innovation Pipeline and R&D Investment
- 14.6 Patent and Intellectual Property Trends
- 14.7 Energy Efficiency and Resource Management
- 14.8 Sustainability, Recycling and Circularity
- 14.9 Technology Roadmap, 2024-2032
- 14.10 Risks of Obsolescence and Technology Substitution
Chapter 15 Global Space Based Solar Power Market Key Strategic Imperatives
- 15.1 Growth and Market Entry Priorities
- 15.2 High-Return Products and Segments
- 15.3 Pricing, Profitability and Cost Optimization
- 15.4 Technology Investment and Product Differentiation
- 15.5 Supply Chain Localization and Resilience
- 15.6 Distribution and Customer Acquisition
- 15.7 Partnership, Acquisition and Capacity Strategy
- 15.8 Regional Expansion Priorities
- 15.9 Short-, Medium- and Long-Term Actions
Chapter 16 Competition Outlook
- 16.1 Industry Competition Characteristics
- 16.2 Market Structure and Concentration
- 16.3 Market Share and Competitive Positioning, 2024
- 16.4 Company-Wise Revenue and Product Benchmarking
- 16.5 Production and Service Capacity Benchmarking
- 16.6 Technology, Pricing and Differentiation
- 16.7 Regional Footprint and Distribution Strength
- 16.8 Mergers, Acquisitions and Strategic Alliances
- 16.9 New Entrants and Competitive Threats
- 16.10 Porter's Five Forces and Industry Attractiveness
- 16.11 Competitive Outlook, 2024-2032
Chapter 17 Company Profiles
- 17.1 Company Coverage and Selection Criteria
- 17.2 Leading Market Participants – Standard Profile Structure
- 17.2.1 Business Description
- 17.2.2 Company Ownership and Geographic Presence
- 17.2.3 Product and Service Portfolio
- 17.2.4 Manufacturing and Operating Footprint
- 17.2.5 Production Capacity and Expansion Plans
- 17.2.6 Financial Performance and Investment
- 17.2.7 Market Share and Competitive Position
- 17.2.8 Technology and Innovation Capabilities
- 17.2.9 Strategic Alliances or Partnerships
- 17.2.10 Recent Developments
- 17.2.11 Growth Strategy and Outlook
- 17.3 Other Relevant Market Participants
Note: Every listed company is profiled on the structure shown under the first company. The company list is preliminary and may change based on research findings, market developments, data availability and client requirements.
Chapter 18 Disclaimer
- 18.1 Research and Forecast Disclaimer
- 18.2 Data Source and Estimation Limitations
Note: The depth of individual sections depends on data availability for this market. Volume, capacity, trade and other unit-based metrics are included where applicable.

