
Watches, earbuds, glasses and rings move into health care
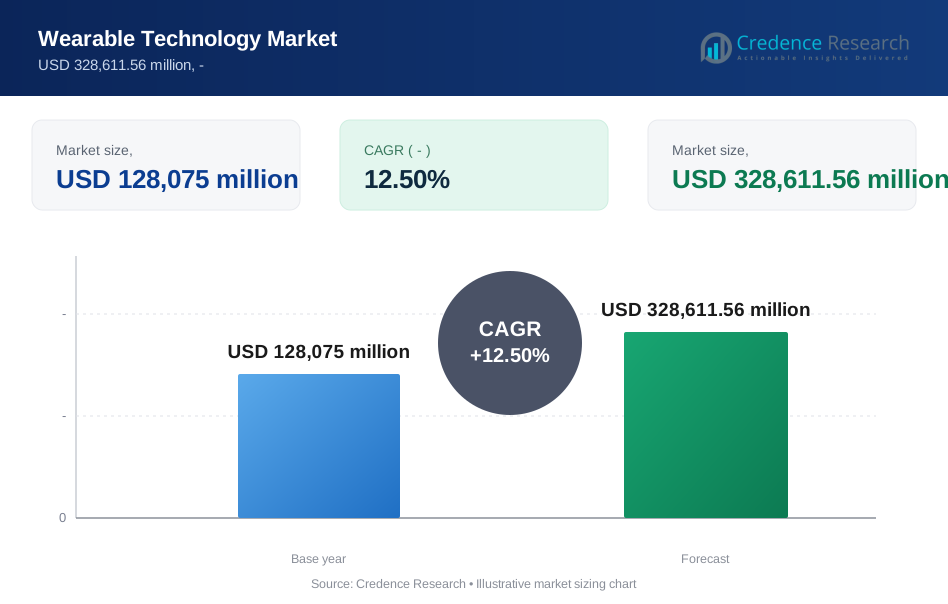
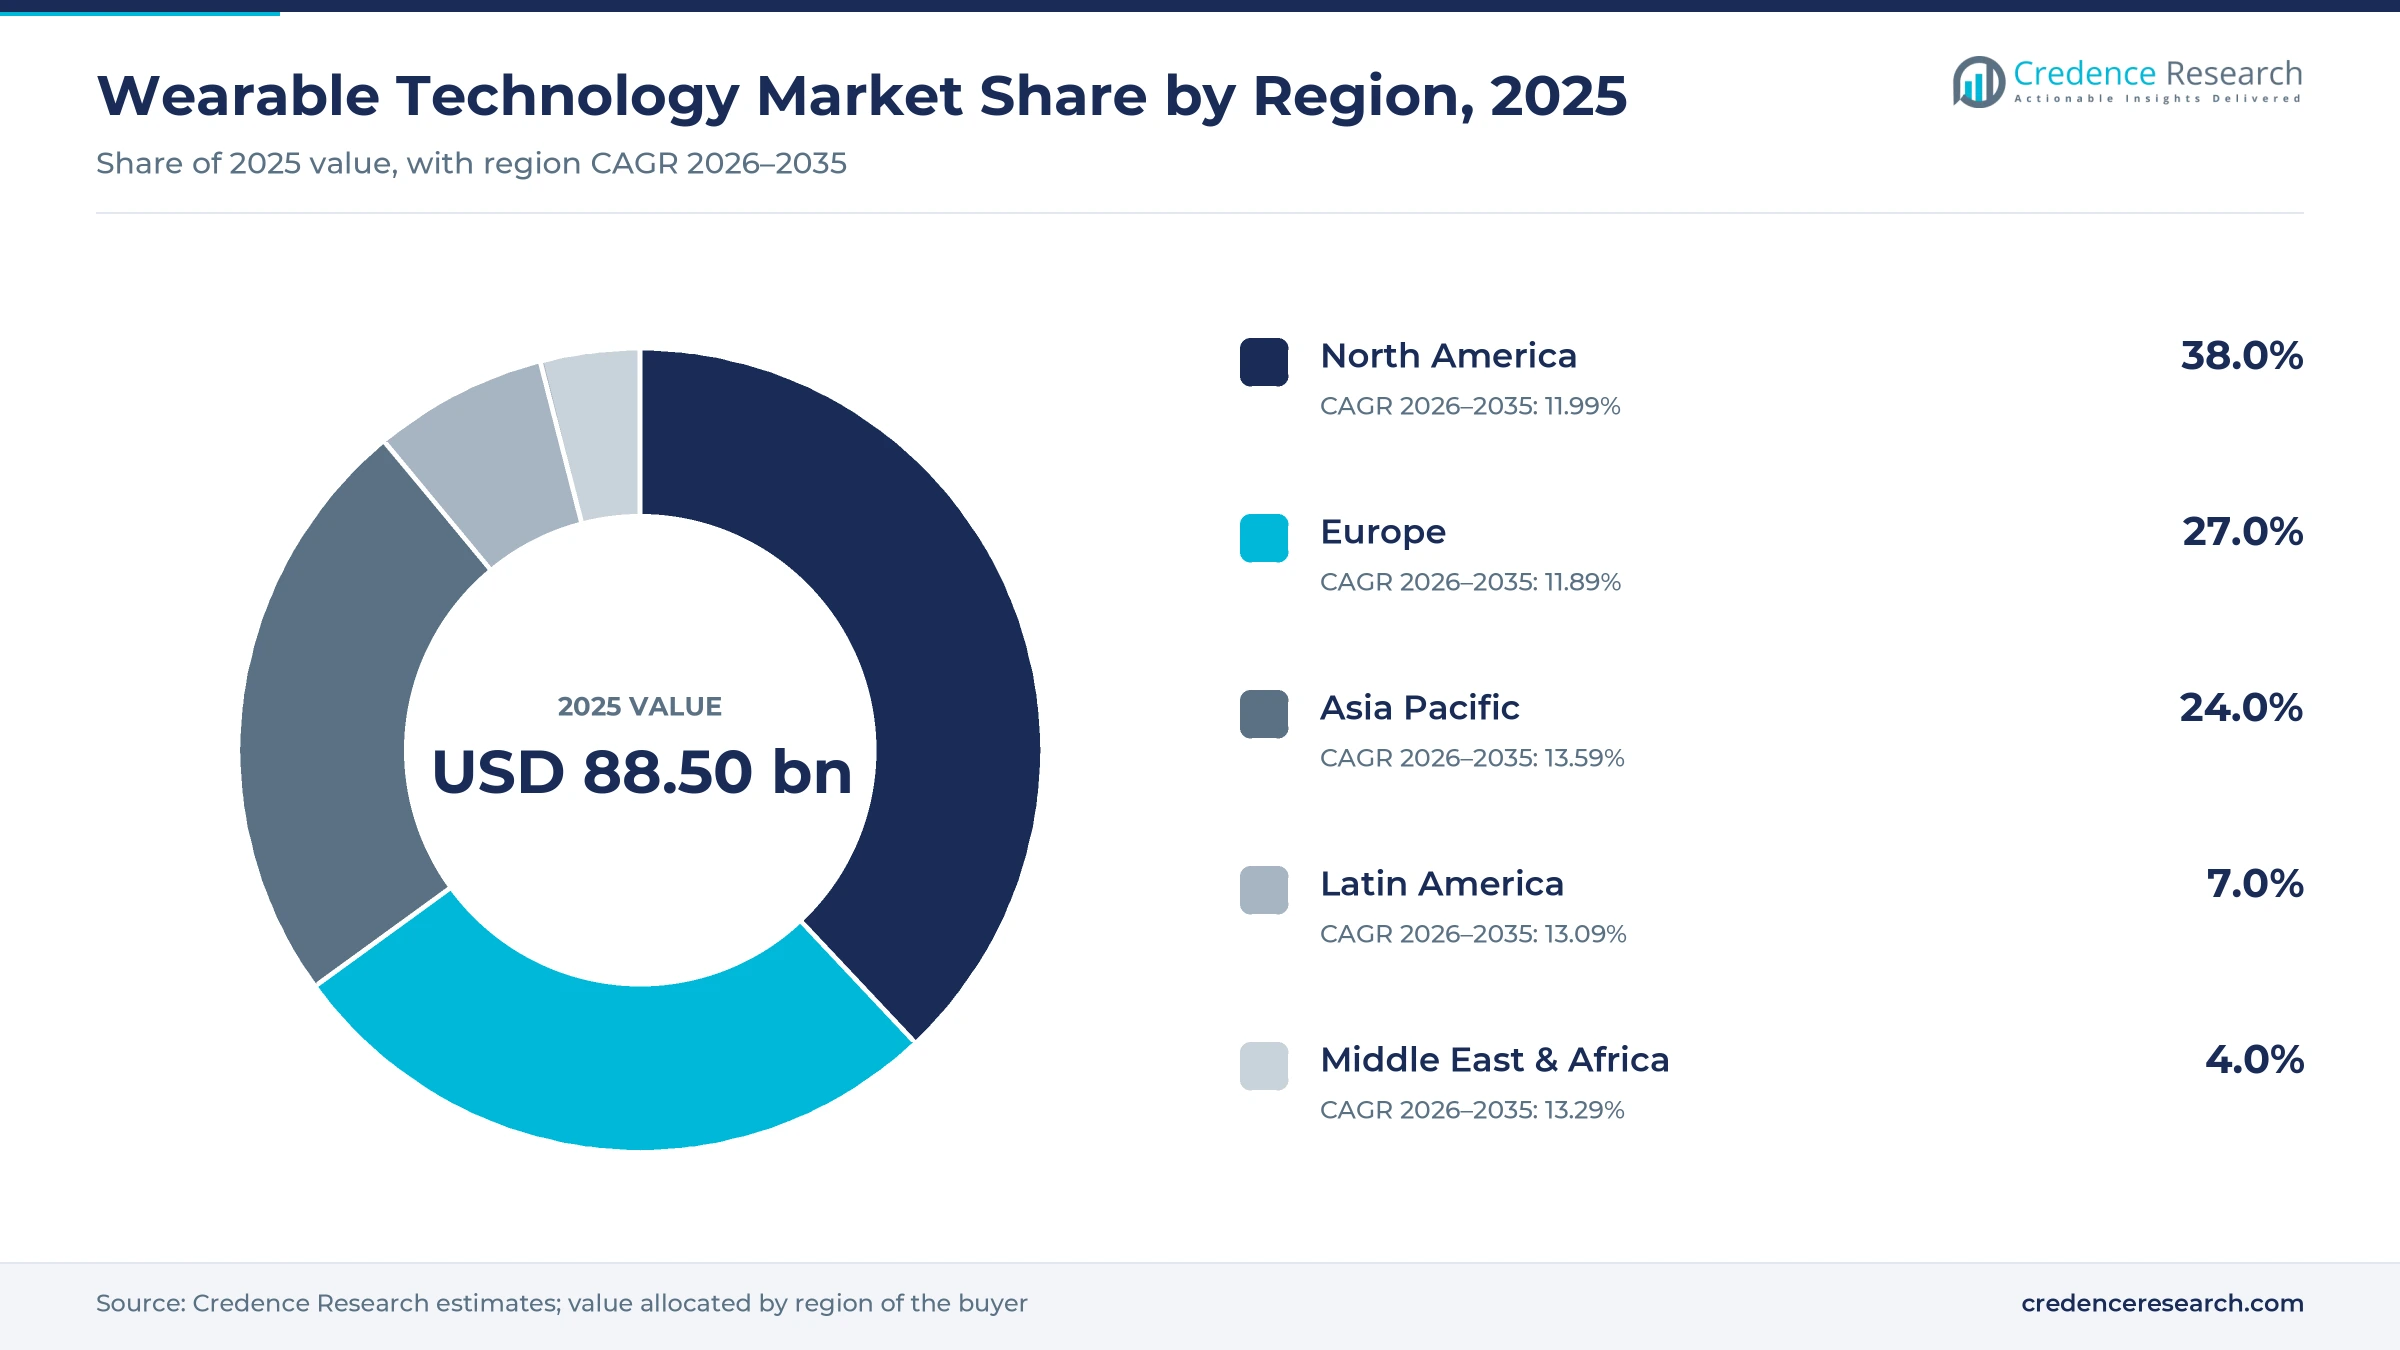
The global wearable technology market was valued at USD 88.50 billion in 2025 and is projected to increase from USD 99.56 billion in 2026 to USD 287.39 billion by 2035, registering a CAGR of 12.50% during 2026–2035. Demand comes from consumers who buy smartwatches, earbuds, smart glasses and rings for fitness, health alerts and hands-free media, and from health systems and employers that issue devices for monitoring and field work. North America held the largest regional share, 38.0% in 2025, because U.S. buyers pay premium prices and the FDA has cleared several watch health features. Asia Pacific is the fastest-growing region at 13.59% a year, as Chinese subsidies and local brands lift shipments. On the regulatory side, the FDA cleared hypertension notifications for Apple Watch in September 2025, and its January 2026 wellness guidance gives non-invasive sensors more room. In the product mix, AI glasses are the newest growth line after EssilorLuxottica sold more than 7 million Meta glasses in 2025.
Which devices and buyers does the wearable technology market count?
The market counts body-worn electronic devices with sensors, processors and wireless links, sold to consumers, health systems, employers and defense agencies. It covers smartwatches and bands, earbuds and neck-worn audio, smart and mixed reality glasses, rings, smart clothing and connected footwear. Buyers purchase these devices through carriers, electronics retailers, optical stores, online stores and enterprise contracts that bundle software and support.
The scope excludes smartphones, implanted medical devices and stand-alone hospital monitors that patients do not wear. The value chain runs from sensor, chip and display suppliers through device brands and contract manufacturers to app platforms, retailers, payers and enterprise buyers.
Wearable Technology Market Insights
- The wearable technology market grows from USD 88.50 billion in 2025 to USD 287.39 billion by 2035 at a 12.50% CAGR, as health features, glasses and rings widen the buyer base.
- North America held 38.0% of 2025 value, supported by FDA-cleared watch and earbud features for hypertension, sleep apnea and hearing support in 2024 and 2025.
- Wrist Wear led with 46.0% of 2025 value, as watches sell at higher prices than earbuds and shipped 34.8 million units in the first quarter of 2025.
- EssilorLuxottica sold more than 7 million Meta smart glasses in 2025, against about 2 million from the October 2023 launch to February 2025.
- Oura raised more than USD 900 million at a USD 11 billion valuation, and an ITC exclusion order against rival Ultrahuman and RingConn rings took effect in October 2025.
Wrist wear leads while smart glasses grow fastest
Why does wrist wear lead value while glasses grow fastest?
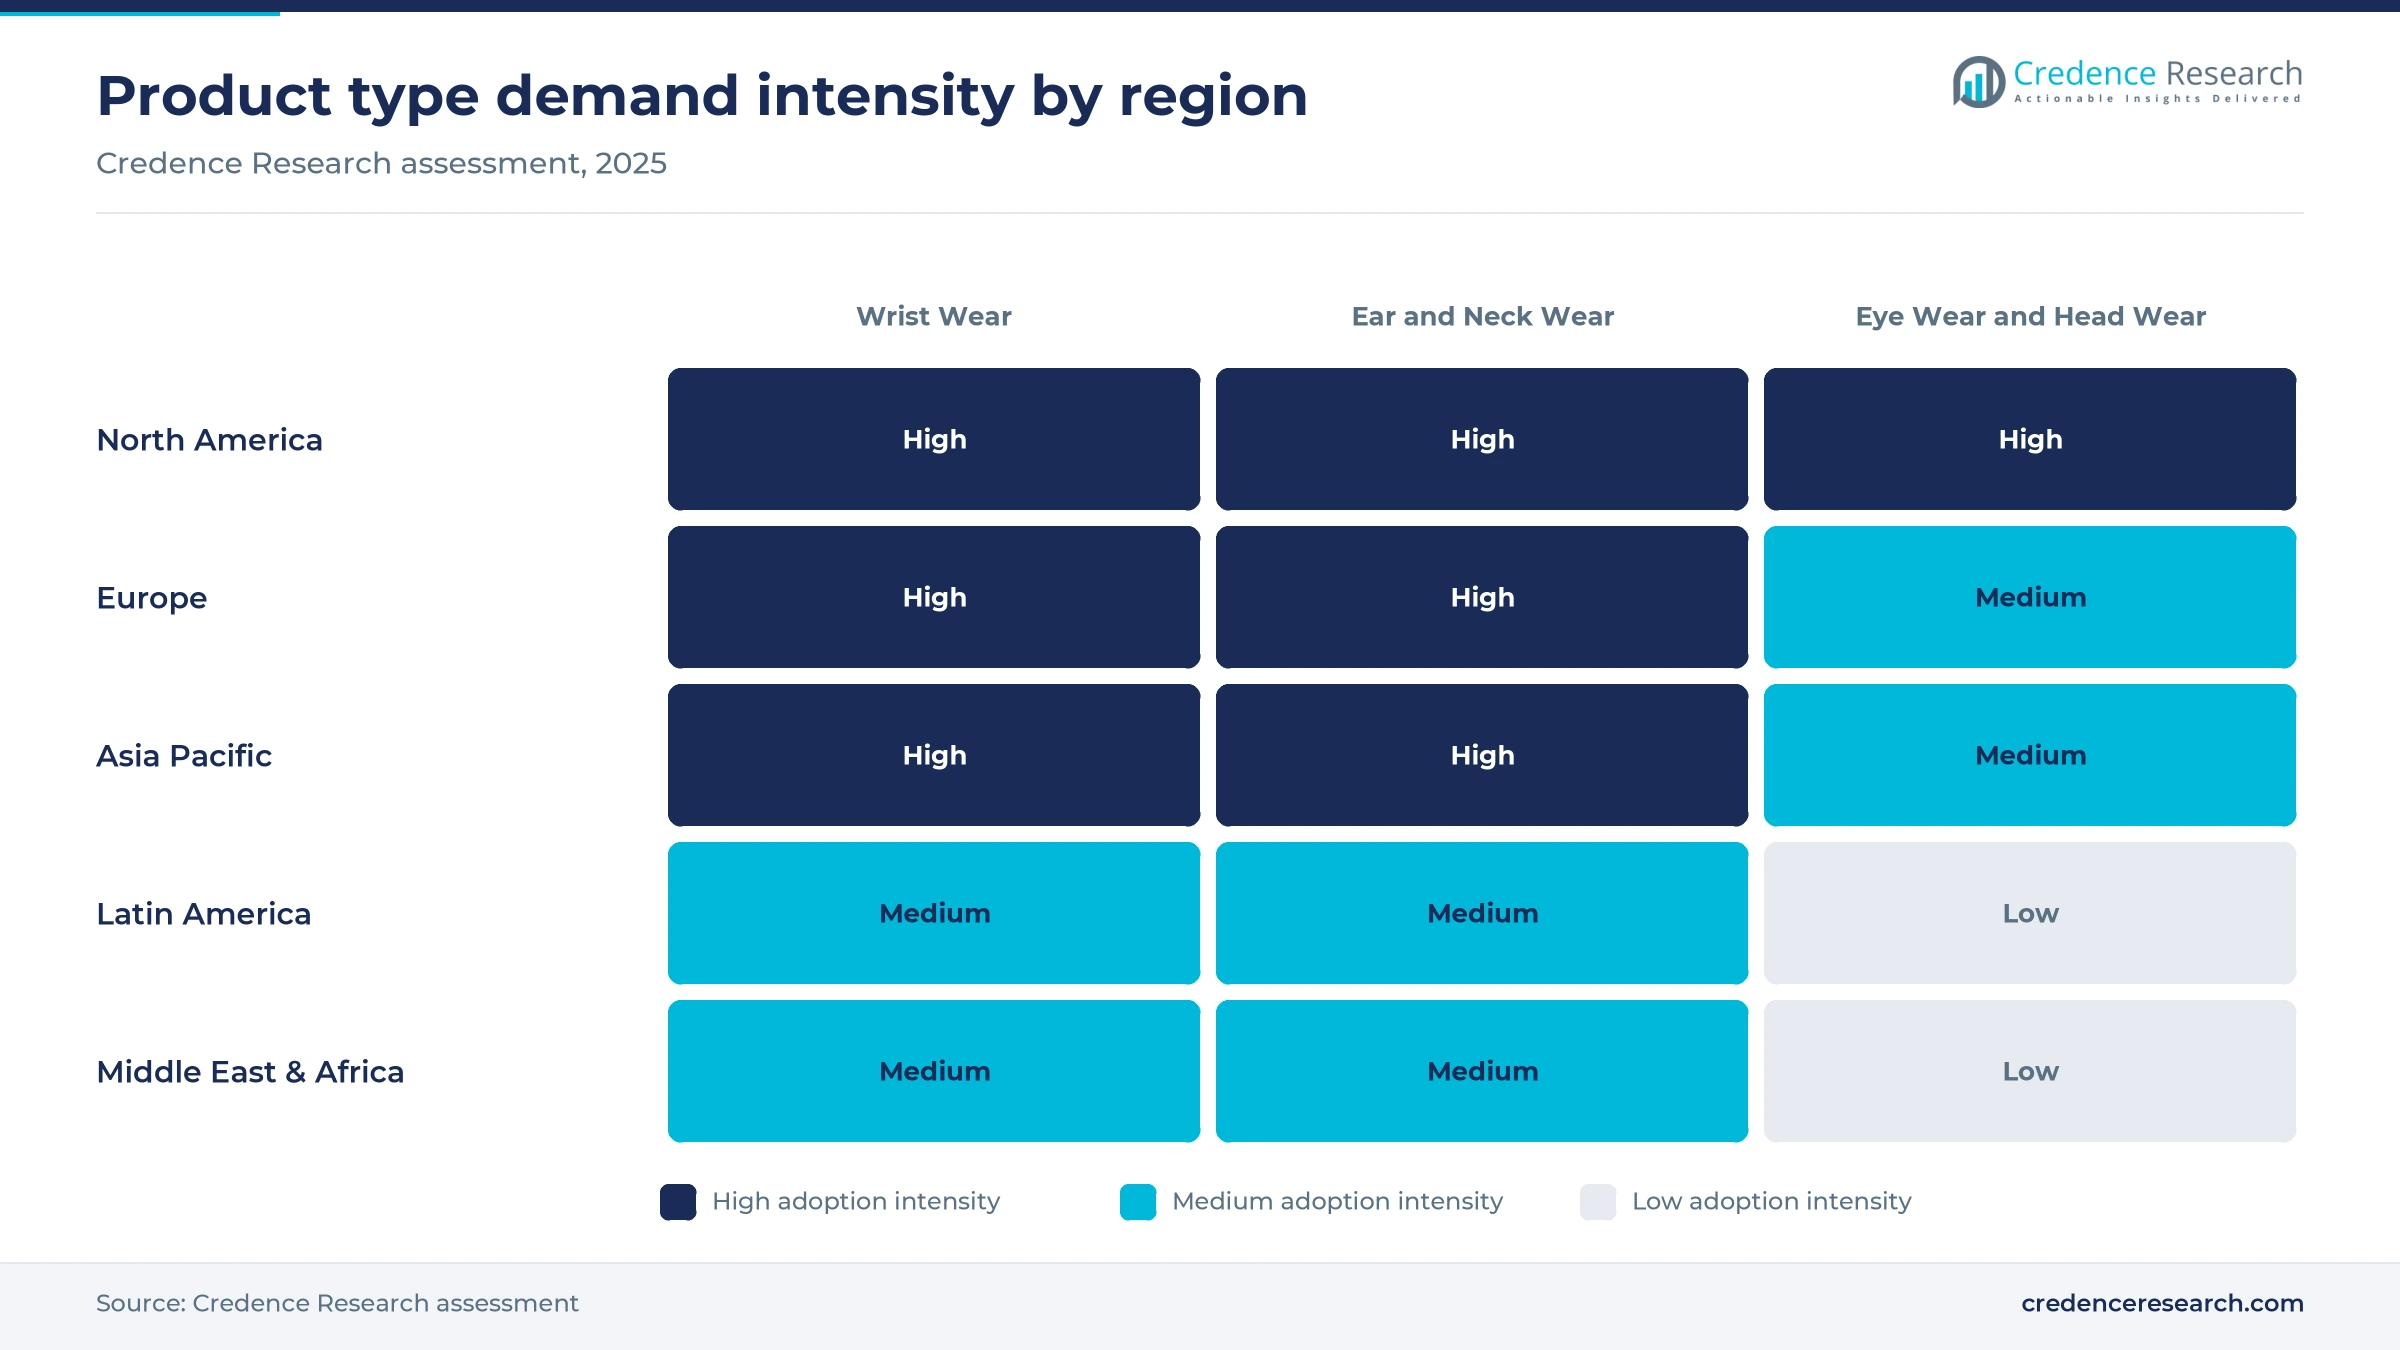
Based on product type, the market is categorized into wrist wear, ear and neck wear, eye wear and head wear, and body wear and foot wear. Wrist Wear led with 46.0% of 2025 value because watches sell at higher prices than earbuds, and IDC found that smartwatches made 60.6% of wearable value in the Middle East and Africa in 2022 while earwear made 50.6% of units. Smartwatches alone shipped 34.8 million units worldwide in the first quarter of 2025, according to IDC. Eye Wear and Head Wear grows fastest at 15.34% a year, as EssilorLuxottica more than tripled its Meta glasses sales in 2025.
Why do sensors account for the largest technology share?
Based on technology, the market is categorized into sensor technology, computing technology, display technology and networking and positioning technology. Sensor Technology led with 36.0% of 2025 value because regulators now clear health functions built on optical and electrical sensors, such as the Samsung sleep apnea feature that the FDA authorized in February 2024. Apple also restored blood oxygen readings in the U.S. in August 2025 by moving the calculation to the paired iPhone. Display Technology grows fastest at 13.87% a year, as Meta launched Ray-Ban Display in September 2025 with a 600 by 600 pixel lens display and brightness up to 5,000 nits.
Why does fitness lead while healthcare use grows fastest?
Based on application, the market is categorized into fitness and wellness, healthcare, infotainment and enterprise, industrial and defense. Fitness and Wellness led with 44.0% of 2025 value because most buyers track activity and sleep, and Eurostat found that 29.9% of people in the EU used smartwatches or fitness trackers in 2024, according to Euronews. Oura alone has sold 5.5 million rings for sleep and recovery tracking since 2015. Healthcare grows fastest at 13.77% a year, as the 2026 Medicare fee schedule added a remote monitoring code that pays for 2 to 15 days of device data in a 30-day period.
| Segment Group | Leading Sub-segment | Share, 2025 | Fastest-growing Sub-segment | CAGR, 2026–2035 |
|---|---|---|---|---|
| By Product Type | Wrist Wear | 46.0% | Eye Wear and Head Wear | 15.34% |
| By Technology | Sensor Technology | 36.0% | Display Technology | 13.87% |
| By Application | Fitness and Wellness | 44.0% | Healthcare | 13.77% |
Request a Free Sample
Fill in your details and we'll send you a free sample report.
- Sample data tables & charts
- Research methodology
Cleared health features and subsidies lift device sales
Cleared health features turn watches into screening tools
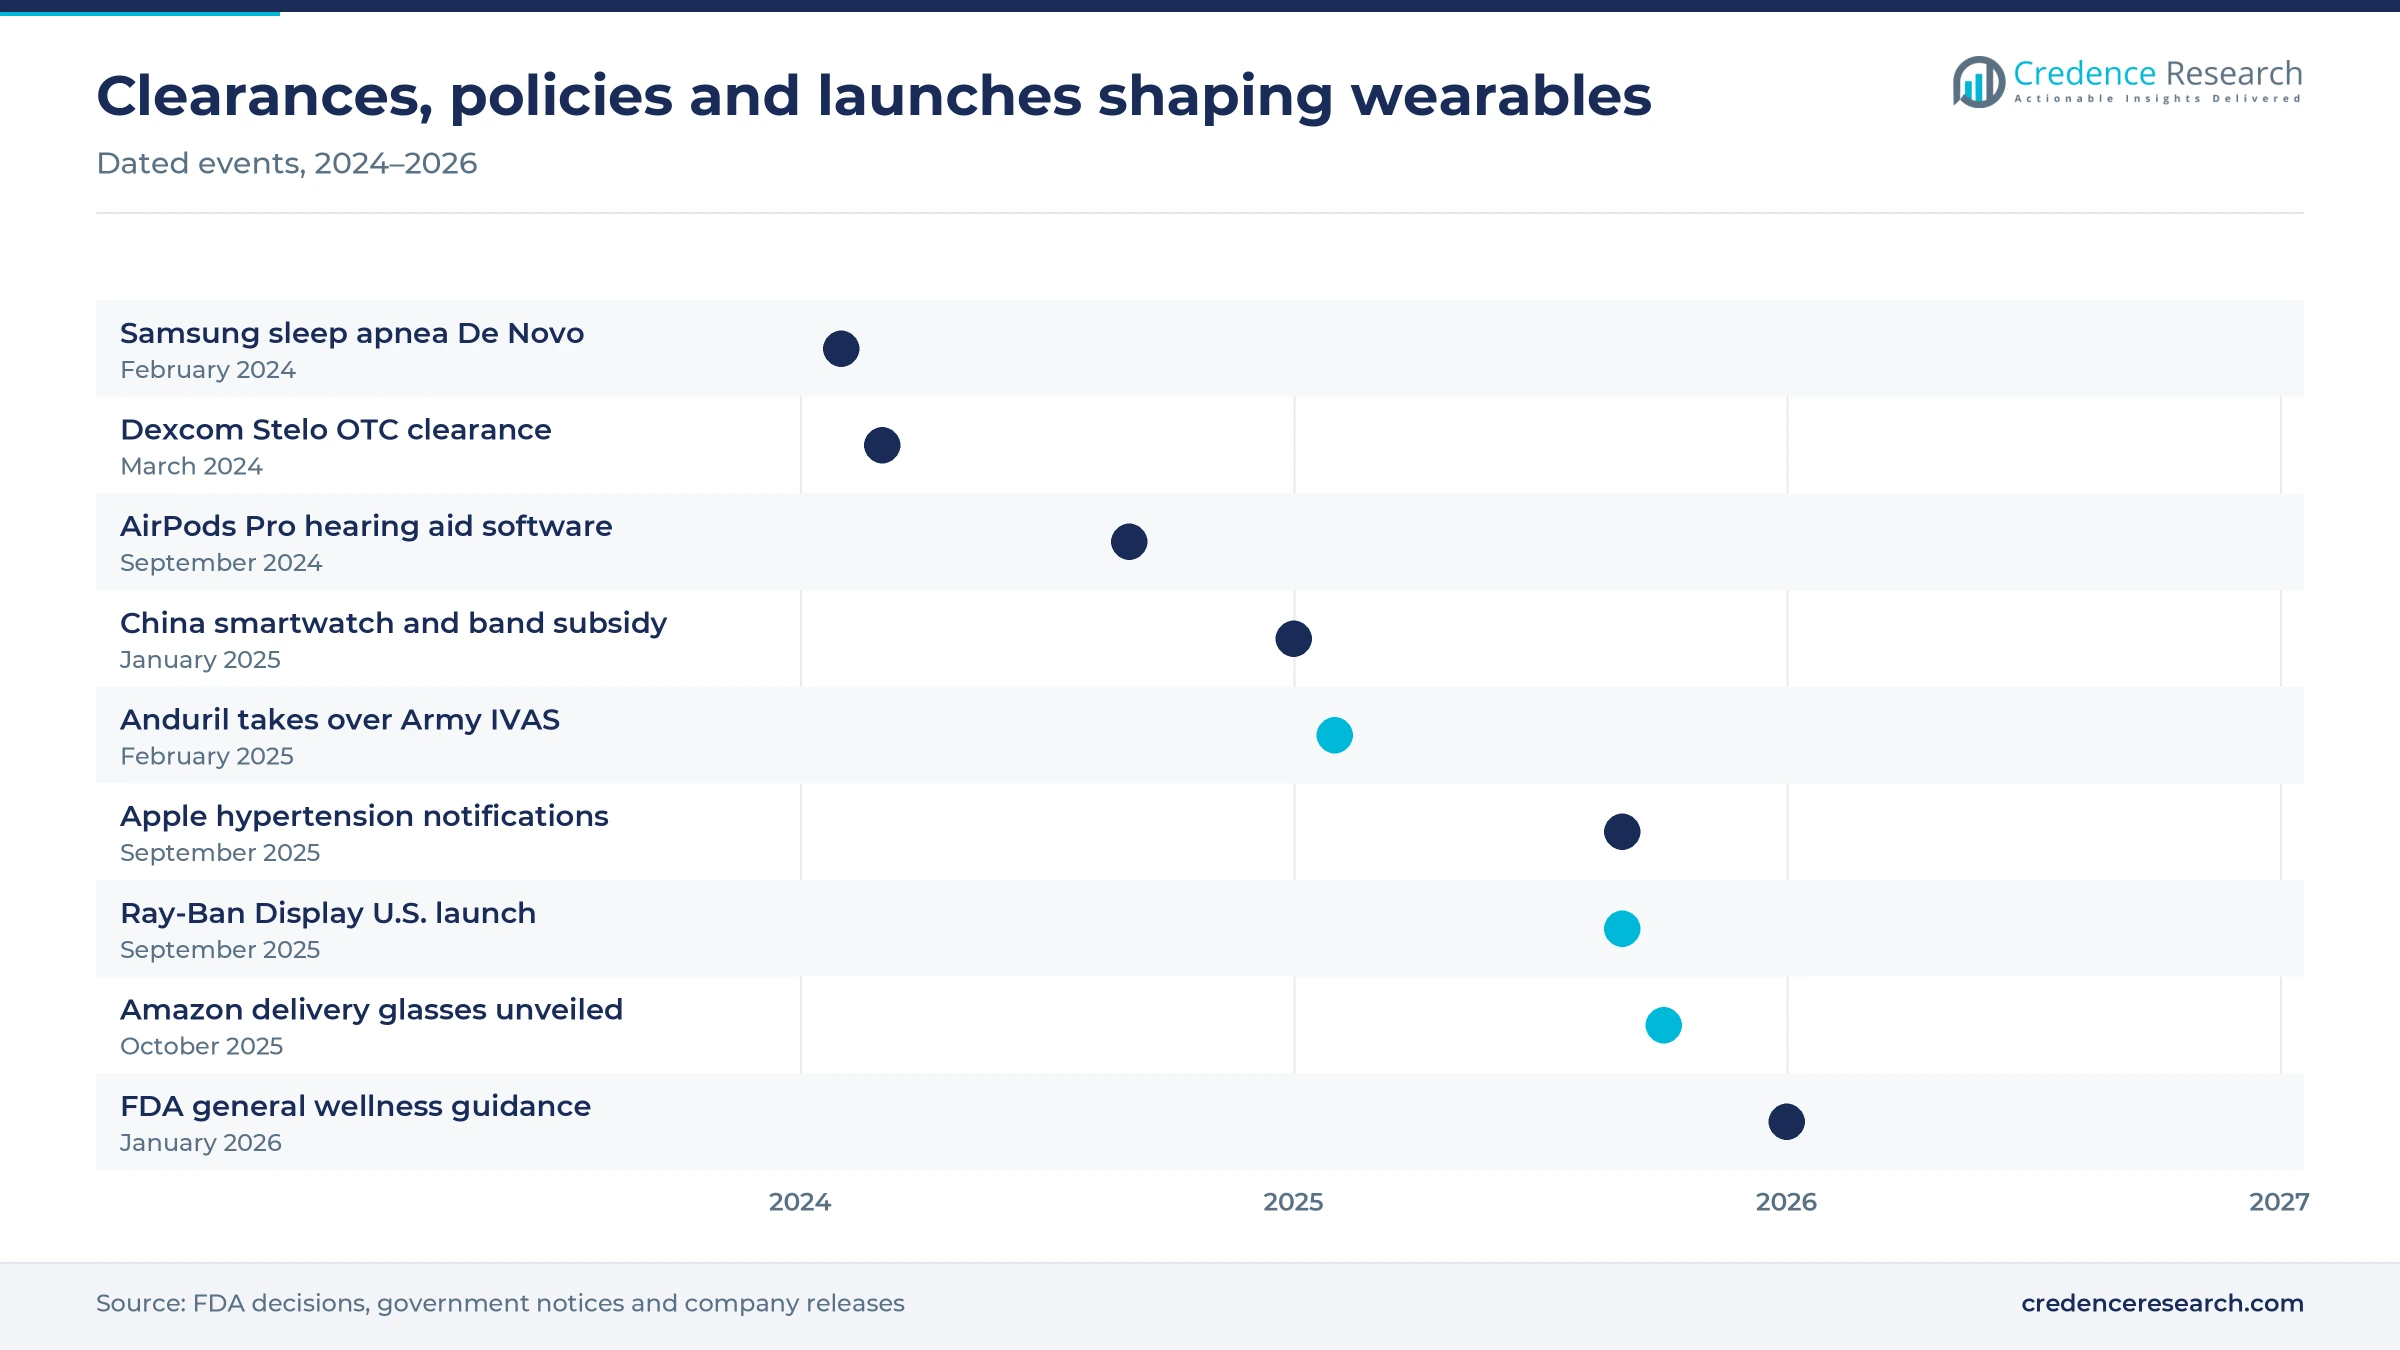
Regulator-cleared health features are lifting replacement demand, because buyers now upgrade for screening functions rather than for notifications alone. Apple said in September 2025 that its FDA-cleared hypertension notifications could reach over 1 million people with undiagnosed high blood pressure in the first year, and the feature was validated in a study of more than 2,000 participants. Samsung received De Novo authorization from the FDA on Feb. 10, 2024, for a sleep apnea feature on Galaxy Watch, citing National Sleep Foundation estimates that about 25% of men and 10% of women in the U.S. have the condition. The hypertension feature launched in more than 150 countries and regions, so one software release reached a global installed base. As a result, Sensor Technology holds 36.0% of 2025 value.
Federal policy and Medicare codes widen clinical use
U.S. health policy is pulling consumer devices into remote patient monitoring programs, which widens the paying base beyond fitness buyers. On June 24, 2025, in testimony before a House committee, HHS Secretary Robert F. Kennedy Jr. said his vision is for every American to wear a health tracker within four years, according to Akin Gump, and he backed a national HHS advertising campaign. The 2026 Medicare Physician Fee Schedule added CPT 99445 for 2 to 15 monitoring days in a 30-day period and CPT 99470 for 10 to 19 minutes of monthly management, according to Physicians Practice in November 2025. The FDA also published revised general wellness guidance on Jan. 6, 2026, which lets non-invasive devices estimate blood pressure or oxygen saturation as wellness products, according to Ropes & Gray.
Chinese subsidies and local brands lift Asian volumes
Consumer subsidies in China have turned the largest manufacturing base into a fast-growing demand market for watches and bands. China began paying a 15% subsidy on smartwatches and wristbands priced below 6,000 yuan on Jan. 20, 2025, capped at 500 yuan per item, under its consumer goods replacement program. IDC reported in June 2025 that wrist-worn shipments in China rose 37.6% to 17.6 million units in the first quarter, while wristbands there grew 67.9%. The same IDC release said Huawei took first place in global wrist-worn shipments, helped by its HarmonyOS ecosystem and the Band 10 launch. China also started a three-year Healthy Weight Management Action in April 2025, which supports health-focused features. As a result, Asia Pacific is the fastest-growing region in the Credence Research model.
Earbuds keep the largest unit base growing
Earbuds and other hearables keep the unit base expanding, even in years when smartwatch shipments slip. IDC estimated in December 2024 that global shipments of body-worn devices reached 538 million units in 2024, up 6.1%, with hearables the largest category and growing 10.3%. In India, earwear made up 19.9 million of the 26.7 million devices shipped in the second quarter of 2025, according to IDC. The FDA authorized the first over-the-counter hearing aid software for AirPods Pro on Sept. 12, 2024, and Axios noted that more than 30 million American adults report some degree of hearing loss. This change moves earbuds from audio accessories into health products, so ear and neck wear keeps a large share of unit demand.
AI glasses and smart rings reshape the product mix
Shift toward AI smart glasses speeds up
A shift toward camera and AI glasses is changing the product mix, as eyewear brands now sell connected frames through optical stores. EssilorLuxottica sold more than 7 million Ray-Ban and Oakley smart glasses in 2025, against about 2 million from the October 2023 launch to February 2025. The company had set a target of 10 million units of annual capacity by the end of 2026. Meta began selling Ray-Ban Display with the Neural Band in the U.S. on Sept. 30, 2025, at USD 799, with a 600 by 600 pixel display in the right lens. Sales run through Best Buy, LensCrafters, Sunglass Hut and Ray-Ban stores, so smart glasses reach buyers who never shopped for watches.
Rise of smart rings and screenless trackers
The rise of screenless trackers is widening the market among users who want sleep and recovery data without a watch on the wrist. Oura has sold 5.5 million rings since 2015, including nearly 3 million in 2025, according to Fierce Healthcare. The company raised more than USD 900 million in a Series E round that valued it at USD 11 billion, up from USD 5.2 billion at its December 2024 round. The U.S. International Trade Commission ruled for Oura in its patent case against Ultrahuman and RingConn, with an exclusion order effective Oct. 21, 2025. As a result, smart rings are growing into a separate category with its own patent walls and subscription models.
Over-the-counter biosensors open metabolic health demand
Over-the-counter biosensors are an opening for brands that can pair a sensor with coaching apps, because buyers no longer need a prescription. The FDA cleared Dexcom Stelo on March 5, 2024, as the first over-the-counter continuous glucose monitor, for adults who do not use insulin, with each sensor worn for up to 15 days. The revised FDA general wellness guidance of Jan. 6, 2026, also lets non-invasive products estimate blood glucose for wellness use if they avoid disease claims, according to Ropes & Gray. China's Healthy Weight Management Action for 2025 to 2027 adds a public program that rewards weight and activity tracking, according to IDC. These openings tie glucose monitors to the same apps that read heart and sleep data.
Enterprise and defense fleets open new buyer demand
Enterprise and defense buyers are an opening for head-worn and body-worn devices, because large fleets buy hardware, software and support together. Amazon unveiled AI smart glasses for its delivery drivers on Oct. 22, 2025, letting them scan packages, follow walking directions and capture proof of delivery without a phone, according to TechCrunch. The glasses pair with a controller on the delivery vest that carries a swappable battery and an emergency button. Anduril took over the U.S. Army's Integrated Visual Augmentation System from Microsoft in February 2025, a program with a starting value of USD 21.9 billion, pending Defense Department approval. Enterprise, industrial and defense use starts from a smaller base than Fitness and Wellness, which holds 44.0% of 2025 value.
Patents, rules and saturated watch demand weigh on growth
Patent disputes keep features and products off U.S. shelves
Patent disputes can remove features or whole products from the U.S. market for long periods. An ITC import ban that took effect in early 2024 forced Apple to disable blood oxygen readings on watches sold in the U.S., and the redesigned feature returned only on Aug. 14, 2025, after a Customs ruling, according to TechCrunch. The ITC also issued an exclusion order against infringing Ultrahuman and RingConn rings effective Oct. 21, 2025. As a result, smaller brands face licensing costs and legal reviews before they enter the U.S.
Moving wellness and medical lines raise compliance costs
The line between wellness and medical claims keeps moving, which raises compliance costs for device makers. The FDA's revised general wellness guidance of Jan. 6, 2026, reversed the position the agency took in July 2025 on the WHOOP blood pressure feature, according to Ropes & Gray. Under the new guidance, wellness products still cannot name a condition, call readings abnormal or give disease-management alerts. As a result, brands must run separate validation and marketing reviews in each market before they launch new sensing features.
Smartwatch saturation slows replacement cycles
Smartwatch demand is saturating in several markets, which lengthens replacement cycles and pushes prices down. IDC expected global smartwatch shipments to fall 4.5% in 2024 before a 1.7% recovery in 2025. In India, smartwatch shipments dropped 28.4% to 6.6 million units in the second quarter of 2025, the sixth straight quarterly decline, according to IDC. As a result, watch brands lean on health features and lower price points, as Garmin did to return to the global top five in early 2025.
European battery rules raise service costs
Battery rules in Europe add design and service costs for sealed devices. EU Battery Regulation 2023/1542 requires user-replaceable portable batteries from Feb. 18, 2027, under Article 11, according to GadgetReview. The European Commission adopted exemptions for smartwatches, fitness trackers and Meta smart glasses only on July 14, 2026, which left brands little time to plan. Battery replacement for the exempted devices shifts to independent professionals, according to GadgetReview, so brands still need repair networks and spare-part stocks in each country.
North America leads as Asia Pacific grows fastest
| Region | Value, 2025 (USD billion) | Share, 2025 | CAGR, 2026–2035 |
|---|---|---|---|
| North America | 33.63 | 38.0% | 11.99% |
| Europe | 23.89 | 27.0% | 11.89% |
| Asia Pacific | 21.24 | 24.0% | 13.59% |
| Latin America | 6.20 | 7.0% | 13.09% |
| Middle East & Africa | 3.54 | 4.0% | 13.29% |
North America leads on cleared health features
North America held 38.0% of 2025 value and grows at 11.99% a year, the largest regional base in the market. The U.S. leads on cleared health features, since Apple's hypertension notifications, Samsung's sleep apnea feature and the AirPods Pro hearing aid software all passed FDA review in 2024 and 2025. In Canada, Meta planned to start selling Ray-Ban Display in early 2026, after the U.S. launch on Sept. 30, 2025. Canada accounts for about 9% of North American value in the Credence Research model, or about USD 3.03 billion in 2025.
Europe grows on upgrades as product rules tighten
Europe held 27.0% of 2025 value and grows at 11.89% a year, the slowest pace among the five regions. Eurostat found that 29.9% of people in the EU used smartwatches or fitness trackers in 2024, according to Euronews, so growth depends on upgrades rather than first-time buyers. Apple's hypertension notifications launched in the European Union in September 2025. Meta also planned Ray-Ban Display sales in France, Italy and the U.K. for early 2026, while EU battery rules shape how sealed devices are serviced.
Asia Pacific grows fastest on Chinese subsidies
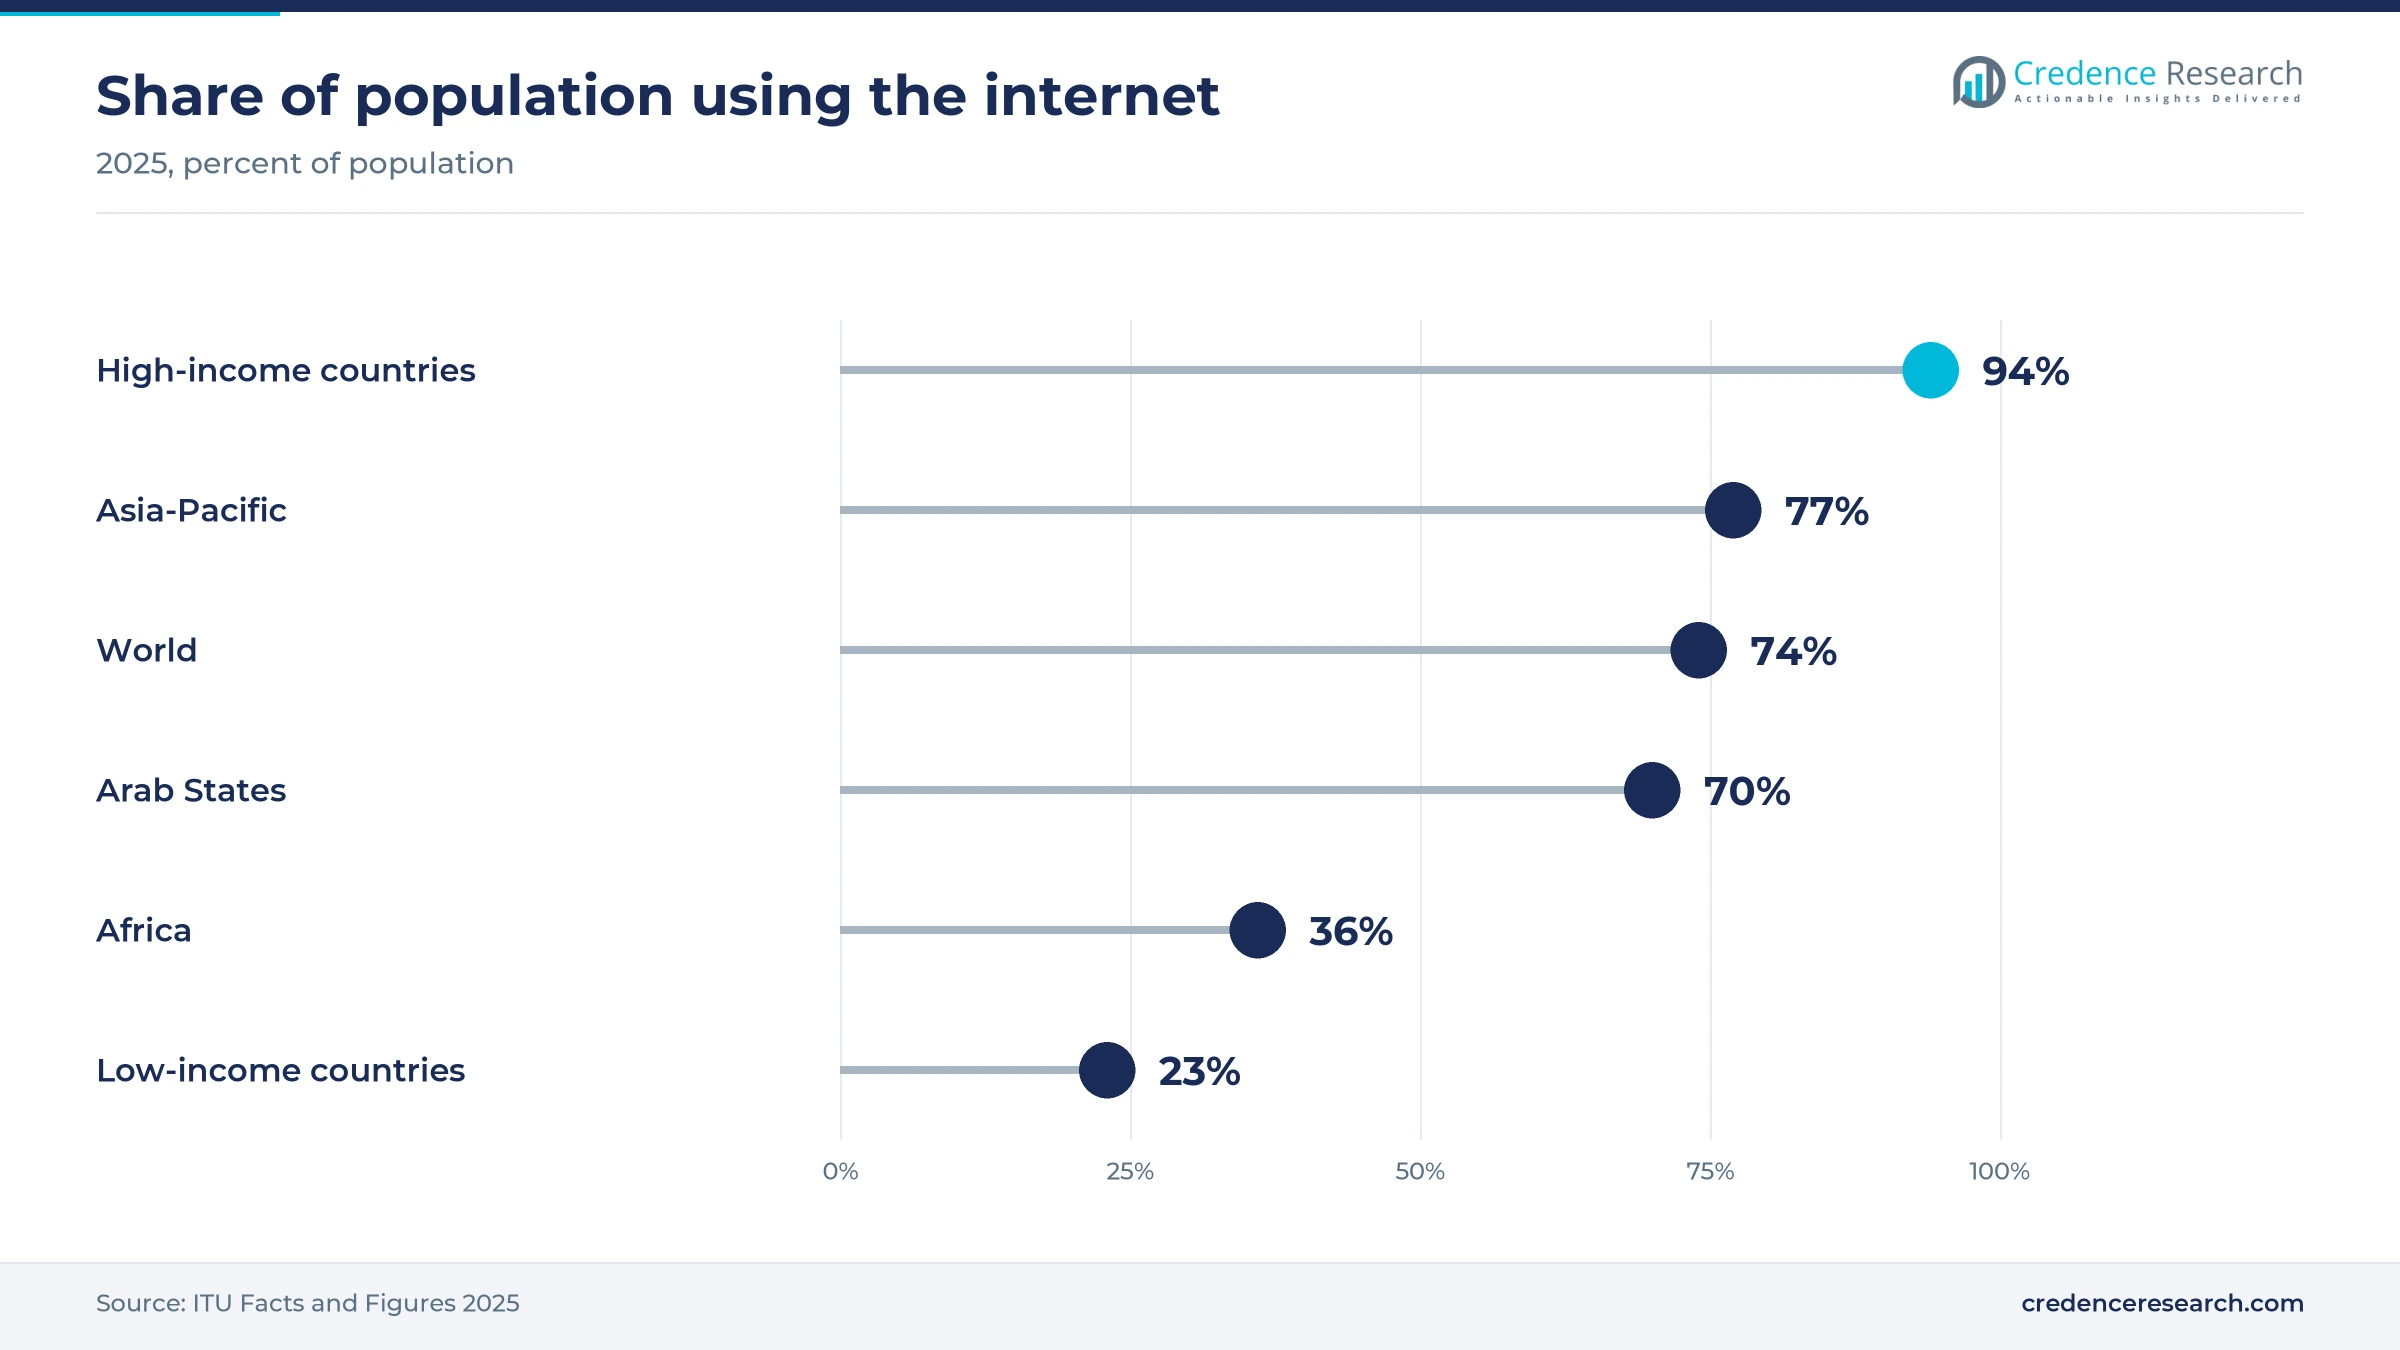
Asia Pacific held 24.0% of 2025 value and grows at 13.59% a year, the fastest pace among the five regions. China drove the gain, as wrist-worn shipments there rose 37.6% in the first quarter of 2025 after the national subsidy began in January, according to IDC. India moved the other way, with shipments down 9.4% in the second quarter of 2025, although smart glasses rose to about 50,000 units from about 4,000 a year earlier. Internet use in Asia-Pacific reached 77% of the population in 2025, according to the ITU.
Latin America grows as global brands widen retail
Latin America held 7.0% of 2025 value and grows at 13.09% a year, faster than North America and Europe. Meta said in April 2025 that Ray-Ban Meta glasses would launch in Mexico, together with India and the United Arab Emirates. IDC also reported a recovery in Latin American wrist-worn shipments in the first quarter of 2025. In the Americas, Europe and the CIS, between 88% and 93% of the population use the internet, according to the ITU, so connected devices reach a broad urban base.
Middle East & Africa grows from a Türkiye and Gulf base
Middle East & Africa held 4.0% of 2025 value and grows at 13.29% a year from a small base. IDC named Türkiye the largest wearables market in the region in 2022 and Saudi Arabia the second largest. The United Arab Emirates joined the Ray-Ban Meta launch list that Meta announced in April 2025. Internet use is still only 36% in Africa against 70% in the Arab States, according to the ITU, which limits demand outside the Gulf.
Clearances, launches and defense deals in 2024–2026
| Development | Status and market relevance |
|---|---|
| In February 2024, Samsung received FDA De Novo authorization for a sleep apnea feature on Galaxy Watch. | Authorized, first feature of its kind on a smartwatch |
| In March 2024, the FDA cleared Dexcom Stelo as the first over-the-counter continuous glucose monitor. | Cleared, for adults who do not use insulin |
| In September 2024, the FDA authorized the first over-the-counter hearing aid software for AirPods Pro. | Authorized, turns earbuds into hearing support devices |
| In September 2025, Apple received FDA clearance for hypertension notifications on Apple Watch. | Launched in more than 150 countries and regions |
| In September 2025, Meta began selling Ray-Ban Display glasses with the Neural Band in the U.S. at USD 799. | Live, with Canada, France, Italy and the U.K. planned for early 2026 |
Cuffless signals, lens displays and gesture bands
- Cuffless blood pressure signals use watch sensor data to flag possible hypertension, as Apple Watch began doing in September 2025.
- Monocular lens displays put a 600 by 600 pixel screen in one lens, as in Ray-Ban Display, with brightness up to 5,000 nits.
- Gesture control bands turn finger movements into commands for glasses, and the Meta Neural Band runs up to 18 hours on one charge.
- Phone-side processing moves some health calculations to the paired phone, which let Apple restore blood oxygen readings in August 2025.
Need a Custom Version of This Report?
Tailor the scope, geography, or segments to your exact requirements.
- Custom geography or segment scope
- Direct access to our analyst team
Platform owners and specialists compete on health data
Competition splits between platform owners that tie devices to phones and app stores, and specialists that win on battery life, sport data or form factor. Apple pairs Apple Watch and AirPods with the iPhone and leads on FDA-cleared health features, while Samsung builds Galaxy Watch health features through its own Samsung Health Monitor app. Huawei and Xiaomi compete on price and ecosystem links, and Huawei led global wrist-worn shipments in the first quarter of 2025, according to IDC. Garmin targets athletes and outdoor users with its Fenix series and returned to the global top five that quarter. Meta and EssilorLuxottica lead AI glasses through Ray-Ban and Oakley frames, and Oura leads rings, backed by an ITC patent ruling. Dexcom brings over-the-counter glucose sensors, while Anduril and Amazon push head-worn devices into defense and logistics. Rivalry now turns on clinical clearances, subscriptions and control of the health data each device collects.
Who are the leading wearable technology companies?
| Company | Type | Role in the market |
|---|---|---|
| Apple Inc. | Device brand | Apple Watch and AirPods with FDA-cleared health features |
| Samsung Electronics Co. Ltd. | Device brand | Galaxy Watch with an FDA-authorized sleep apnea feature |
| Huawei Technologies Co. Ltd. | Device brand | Watches and bands on HarmonyOS, global wrist-worn leader in early 2025 |
| Xiaomi Corporation | Device brand | Entry-level wristbands and Redmi smartwatches |
| Garmin Ltd. | Device brand | Sport and outdoor watches including the Fenix series |
| Meta Platforms | Platform owner | Ray-Ban Meta and Ray-Ban Display glasses with the Neural Band |
| EssilorLuxottica | Eyewear maker | Ray-Ban and Oakley smart glasses made and sold with Meta |
| Oura Health | Device brand | Smart rings for sleep and recovery tracking |
| Dexcom | Medical device maker | Stelo, the first over-the-counter continuous glucose monitor |
| Anduril Industries | Defense contractor | Runs the U.S. Army IVAS headset program since 2025 |
Clinical clearances will matter more than new screens
Credence Research's view is that clinical clearances will matter more than new screens to 2035. Hypertension, sleep apnea and hearing features cleared in 2024 and 2025 give buyers a health reason to upgrade, and new Medicare codes pay clinics to read the data. Glasses add a second growth line, but they still depend on one large partnership between Meta and EssilorLuxottica. Brands that pair sensors with validated software and hold their own patents gain the most, while smartwatch saturation and patent bans hurt smaller makers.
Model built from filings, regulators and public data
The report uses 2025 as the base year and forecasts to 2035. Market values come from the Credence Research model, which updates the earlier 2024 estimate with published shipment data, company releases and regulator decisions. Regional and segment splits are Credence Research estimates based on shipment mix, average prices and device use by region. Sources include FDA and ITC decisions, Medicare fee schedule notices, ITU and Eurostat statistics, government subsidy notices and company announcements.
Glasses, healthcare use and Asia carry growth to 2035
The market is set to grow from USD 99.56 billion in 2026 to USD 287.39 billion by 2035 at a 12.50% CAGR. Asia Pacific will add the most volume, while North America keeps the largest share as FDA-cleared features and Medicare codes pull devices into care. Eye Wear and Head Wear will take a growing share as glasses add displays and AI assistants. Risks to the outlook include patent bans, shifting wellness rules, slower smartwatch replacement and service costs from European battery rules.
Frequently Asked Questions
How big is the wearable technology market?
Which product type leads the market?
Which region holds the largest share?
How large is the wearable technology market in Canada?
How common are smartwatches and fitness trackers in Europe?
Why are wearables growing fast in China?
How are enterprise and industrial wearables used?
Who are the leading wearable technology companies?
Table of Content
Chapter 1 Market Segmentation
- 1.1 Segmentation Framework
- 1.1.1 Product and Service Classification
- 1.1.2 Application and End-Use Classification
- 1.1.3 Technology and Solution Classification
- 1.1.4 Customer and Distribution Channel Classification
- 1.1.5 Geographic Segmentation
- 1.1.6 Market Segment Definitions and Boundaries
- 1.2 By Product Type
- 1.2.1 Wrist Wear
- 1.2.2 Ear and Neck Wear
- 1.2.3 Eye Wear and Head Wear
- 1.2.4 Body Wear and Foot Wear
- 1.3 By Technology
- 1.3.1 Sensor Technology
- 1.3.2 Computing Technology
- 1.3.3 Display Technology
- 1.3.4 Networking and Positioning Technology
- 1.4 By Application
- 1.4.1 Fitness and Wellness
- 1.4.2 Healthcare
- 1.4.3 Infotainment
- 1.4.4 Enterprise, Industrial and Defense
Chapter 2 Introduction
- 2.1 Report Objectives and Scope
- 2.2 Product Definition and Industry Terminology
- 2.3 Market Inclusions and Exclusions
- 2.4 Research Process
- 2.4.1 Primary Research and Expert Interviews
- 2.4.2 Secondary Research and Source Review
- 2.4.3 Top-Down and Bottom-Up Estimation
- 2.4.4 Data Triangulation and Verification
- 2.5 Market Size Measurement Basis
- 2.5.1 2025: USD 88.50 billion → 2035: USD 287.39 billion
- 2.6 Historical and Forecast Reference Periods
- 2.6.1 Historical Period: 2018-2025
- 2.6.2 Base Year: 2025
- 2.6.3 Forecast Period: 2025-2035
- 2.7 Research Assumptions and Limitations
Chapter 3 Executive Summary
- 3.1 Market Snapshot and Key Findings
- 3.2 Base-Year Market Size, 2025
- 3.3 Forecast Market Size, 2035
- 3.4 Revenue and Volume Growth Outlook
- 3.5 Key Demand and Supply Indicators
- 3.6 Leading Market Segments
- 3.7 Fastest-Growing Market Opportunities
- 3.8 Regional Performance Highlights
- 3.9 Technology and Industry Transformation
- 3.10 Competitive Landscape Summary
- 3.11 Analyst View and Strategic Implications
Chapter 4 Global Wearable Technology Market Trends and Developments
- 4.1 Historical Industry Development, 2018-2025
- 4.2 Recent Market Trends and Developments
- 4.3 Demand and Customer Behavior Trends
- 4.4 Technology and Product Innovation
- 4.5 Artificial Intelligence, Automation and Digitalization
- 4.6 Local Manufacturing and Supply Chain Realignment
- 4.7 Industry Partnerships, Mergers and Acquisitions
- 4.8 Sustainability and Circular Economy Developments
- 4.9 Government and Private Sector Investment Trends
- 4.10 Emerging Business Models and Commercialization
- 4.11 Industry Developments and Announcements
Chapter 5 Global Wearable Technology Market Production, Supply and Demand Analysis
- 5.1 Demand Trend and Consumption Analysis, 2018-2025
- 5.2 Demand Forecast, 2025-2035
- 5.3 Production and Output Trend, 2018-2025
- 5.4 Production and Output Forecast, 2025-2035
- 5.5 Installed Capacity and Capacity Utilization
- 5.6 Company-Wise Production Plants and Statistics
- 5.6.1 Installed Production Capacity
- 5.6.2 Actual Production
- 5.6.3 Planned Capacity and Expansion Targets
- 5.7 Supply Chain Structure and Procurement Trends
- 5.8 Supply-Demand Gap and Bottlenecks
- 5.9 Import Dependence and Sourcing Structure
- 5.10 Contract Manufacturing and Outsourcing
- 5.11 Regional Supply and Demand Concentration
Chapter 6 Global Wearable Technology Market Pricing Analysis
- 6.1 Pricing Structure and Measurement
- 6.2 Historical Pricing Trends, 2018-2025
- 6.3 Pricing Outlook, 2025-2035
- 6.4 Average Selling Price and Unit Economics
- 6.5 Pricing by Product and Market Segment
- 6.6 Geographic Pricing Differences
- 6.7 Key Input, Energy, Labor and Logistics Costs
- 6.8 Contract Pricing and Purchasing Models
- 6.9 Pricing Sensitivity and Competitive Positioning
- 6.10 Price, Margin and Profitability Implications
Chapter 7 Global Wearable Technology Market Dynamics
- 7.1 Market Growth Drivers
- 7.1.1 Demand-Side Drivers
- 7.1.2 Technology and Innovation Drivers
- 7.1.3 Infrastructure and Investment Drivers
- 7.1.4 Regulatory and Policy Drivers
- 7.2 Market Restraints
- 7.2.1 Cost and Affordability Constraints
- 7.2.2 Technology and Adoption Barriers
- 7.2.3 Supply Chain and Operational Constraints
- 7.3 Market Challenges
- 7.3.1 Competitive Pressure and Margin Erosion
- 7.3.2 Skills, Infrastructure and Implementation Gaps
- 7.4 Emerging Market Opportunities
- 7.5 Market Dynamics Impact and Time-Horizon Assessment
Chapter 8 Global Wearable Technology Value Chain Analysis
- 8.1 Industry Value Chain Overview
- 8.2 Upstream Suppliers and Critical Inputs
- 8.3 Technology and Component Providers
- 8.4 Manufacturing or Service Delivery
- 8.5 Distribution, Channel Partners and Integrators
- 8.6 Downstream Applications and End Users
- 8.7 Value Addition and Profit Pools
- 8.8 Vertical Integration and Outsourcing
- 8.9 Supplier Concentration and Risk
- 8.10 Supply Chain Localization and Resilience
Chapter 9 Global Wearable Technology Market Regulations and Policies
- 9.1 Relevant Laws, Standards and Compliance Frameworks
- 9.2 Product, Service, Safety and Quality Requirements
- 9.3 Government Policies, Incentives and Subsidies
- 9.4 Imports, Exports and Trade Barriers
- 9.5 Public Procurement and Local Content Requirements
- 9.6 Environmental and Sustainability Compliance
- 9.7 Upcoming Policy Changes and Market Implications
Chapter 10 Global Wearable Technology Market Hotspots and Opportunities
- 10.1 Market Opportunity Mapping and Growth Hotspots
- 10.2 High-Growth Applications and Customer Groups
- 10.3 Underserved Markets and White-Space Opportunities
- 10.4 Emerging Technology and Product Opportunities
- 10.5 New Capacity and Investment Hotspots
- 10.6 Market Entry and Expansion Opportunities
- 10.7 Distribution and Partnership Opportunities
- 10.8 Near-Term and Long-Term Commercial Potential
- 10.9 Opportunity Attractiveness and Execution Risks
Chapter 11 Global Wearable Technology Market Outlook, 2025-2035
- 11.1 Market Size and Analysis
- 11.1.1 Revenue (Market Measurement: 2025: USD 88.50 billion → 2035: USD 287.39 billion)
- 11.1.2 Market Volume and Quantity Sold
- 11.1.3 Historical Market Size, 2018-2025
- 11.1.4 Base-Year Market Size, 2025
- 11.2 Market Forecast, 2025-2035
- 11.2.1 Revenue Forecast to 2035
- 11.2.2 Volume Forecast to 2035
- 11.2.3 CAGR and Year-on-Year Growth
- 11.2.4 Incremental Revenue Opportunity
- 11.3 Forecast Assumptions and Scenario Analysis
- 11.3.1 Base-Case Forecast
- 11.3.2 Optimistic and Conservative Scenarios
- 11.3.3 Technology, Pricing and Policy Sensitivities
- 11.4 Market Attractiveness and Growth Outlook
Chapter 12 Global Wearable Technology Market Segmentation and Outlook
- 12.1 Segmentation Summary and Market Shares, 2025
- 12.2 Largest and Fastest-Growing Segments
- 12.3 By Product Type - Market Size and Forecast, 2025-2035
- 12.3.1 Segment Definition and Scope
- 12.3.2 Historical Market Size, 2018-2025
- 12.3.3 Revenue Forecast, 2025-2035
- 12.3.4 Volume Forecast, 2025-2035
- 12.3.5 Base-Year Market Share, 2025
- 12.3.6 Segment CAGR and Growth Drivers
- 12.3.7 Subsegment Market Size and Forecast
- 12.3.7.1 Wrist Wear
- 12.3.7.2 Ear and Neck Wear
- 12.3.7.3 Eye Wear and Head Wear
- 12.3.7.4 Body Wear and Foot Wear
- 12.3.8 Subsegment Pricing and Adoption Trends
- 12.3.9 Leading Suppliers and Competition
- 12.3.10 Regional Demand and Opportunities
- 12.4 By Technology - Market Size and Forecast, 2025-2035
- 12.4.1 Segment Definition and Scope
- 12.4.2 Historical Market Size, 2018-2025
- 12.4.3 Revenue Forecast, 2025-2035
- 12.4.4 Volume Forecast, 2025-2035
- 12.4.5 Base-Year Market Share, 2025
- 12.4.6 Segment CAGR and Growth Drivers
- 12.4.7 Subsegment Market Size and Forecast
- 12.4.7.1 Sensor Technology
- 12.4.7.2 Computing Technology
- 12.4.7.3 Display Technology
- 12.4.7.4 Networking and Positioning Technology
- 12.4.8 Subsegment Pricing and Adoption Trends
- 12.4.9 Leading Suppliers and Competition
- 12.4.10 Regional Demand and Opportunities
- 12.5 By Application - Market Size and Forecast, 2025-2035
- 12.5.1 Segment Definition and Scope
- 12.5.2 Historical Market Size, 2018-2025
- 12.5.3 Revenue Forecast, 2025-2035
- 12.5.4 Volume Forecast, 2025-2035
- 12.5.5 Base-Year Market Share, 2025
- 12.5.6 Segment CAGR and Growth Drivers
- 12.5.7 Subsegment Market Size and Forecast
- 12.5.7.1 Fitness and Wellness
- 12.5.7.2 Healthcare
- 12.5.7.3 Infotainment
- 12.5.7.4 Enterprise, Industrial and Defense
- 12.5.8 Subsegment Pricing and Adoption Trends
- 12.5.9 Leading Suppliers and Competition
- 12.5.10 Regional Demand and Opportunities
- 12.6 Segment Growth Comparison
- 12.7 Segment Attractiveness and Priority Matrix
Chapter 13 Global Wearable Technology End-Use and Application Market Outlook
- 13.1 End-Use Industry and Customer Demand Structure
- 13.2 Leading Applications and Customer Groups
- 13.3 End-Use Market Size, Share and Forecast
- 13.4 Major End-Use Industry Deep Dives
- 13.4.1 Customer Requirements and Use Cases
- 13.4.2 Demand and Replacement Cycles
- 13.4.3 Technical and Regulatory Considerations
- 13.4.4 Purchasing and Procurement Models
- 13.4.5 Leading Vendors and Distribution Channels
- 13.4.6 Forecast and Commercial Opportunities
- 13.5 Emerging Applications and Cross-Segment Demand
- 13.6 End-Use Industry Investment Priorities
Chapter 14 Global Wearable Technology Geographic Market Outlook, 2025-2035
- 14.1 Regional Market Size and Share, 2025
- 14.2 Regional Market Forecast, 2025-2035
- 14.3 Regional Pricing, Production and Demand Differences
- 14.4 North America
- 14.4.1 United States
- 14.4.2 Canada
- 14.4.3 Mexico
- 14.5 Europe
- 14.5.1 Germany
- 14.5.2 France
- 14.5.3 Italy
- 14.5.4 United Kingdom
- 14.5.5 Spain
- 14.5.6 Poland
- 14.5.7 Russia
- 14.5.8 Netherlands
- 14.5.9 Belgium
- 14.5.10 Sweden
- 14.5.11 Denmark
- 14.5.12 Norway
- 14.5.13 Rest of Europe
- 14.6 Asia Pacific
- 14.6.1 China
- 14.6.2 India
- 14.6.3 Japan
- 14.6.4 South Korea
- 14.6.5 Thailand
- 14.6.6 Indonesia
- 14.6.7 Vietnam
- 14.6.8 Malaysia
- 14.6.9 Australia
- 14.6.10 Rest of Asia Pacific
- 14.7 Latin America
- 14.7.1 Brazil
- 14.7.2 Argentina
- 14.7.3 Colombia
- 14.7.4 Chile
- 14.7.5 Rest of Latin America
- 14.8 Middle East
- 14.8.1 Saudi Arabia
- 14.8.2 United Arab Emirates
- 14.8.3 Turkey
- 14.8.4 Israel
- 14.8.5 Iran
- 14.8.6 Rest of the Middle East
- 14.9 Africa
- 14.9.1 South Africa
- 14.9.2 Egypt
- 14.9.3 Nigeria
- 14.9.4 Morocco
- 14.9.5 Rest of Africa
- 14.10 Regional Investment, Policy and Supply Chain Differences
- 14.11 Regional Competitive Landscape
- 14.12 Geographic Growth Hotspots
Chapter 15 Global Wearable Technology Technology, Innovation and Sustainability Outlook
- 15.1 Technology Landscape and Maturity
- 15.2 Product, Process and Service Innovation
- 15.3 AI, Automation and Digital Tools in the Industry
- 15.4 Technology Adoption and Performance Benchmarking
- 15.5 Innovation Pipeline and R&D Investment
- 15.6 Patent and Intellectual Property Trends
- 15.7 Energy Efficiency and Resource Management
- 15.8 Sustainability, Recycling and Circularity
- 15.9 Technology Roadmap, 2025-2035
- 15.10 Risks of Obsolescence and Technology Substitution
Chapter 16 Global Wearable Technology Market Key Strategic Imperatives
- 16.1 Growth and Market Entry Priorities
- 16.2 High-Return Products and Segments
- 16.3 Pricing, Profitability and Cost Optimization
- 16.4 Technology Investment and Product Differentiation
- 16.5 Supply Chain Localization and Resilience
- 16.6 Distribution and Customer Acquisition
- 16.7 Partnership, Acquisition and Capacity Strategy
- 16.8 Regional Expansion Priorities
- 16.9 Short-, Medium- and Long-Term Actions
Chapter 17 Competition Outlook
- 17.1 Industry Competition Characteristics
- 17.2 Market Structure and Concentration
- 17.3 Market Share and Competitive Positioning, 2025
- 17.4 Company-Wise Revenue and Product Benchmarking
- 17.5 Production and Service Capacity Benchmarking
- 17.6 Technology, Pricing and Differentiation
- 17.7 Regional Footprint and Distribution Strength
- 17.8 Mergers, Acquisitions and Strategic Alliances
- 17.9 New Entrants and Competitive Threats
- 17.10 Porter's Five Forces and Industry Attractiveness
- 17.11 Competitive Outlook, 2025-2035
Chapter 18 Company Profiles
- 18.1 Company Coverage and Selection Criteria
- 18.2 Apple Inc.
- 18.2.1 Business Description
- 18.2.2 Company Ownership and Geographic Presence
- 18.2.3 Product and Service Portfolio
- 18.2.4 Manufacturing and Operating Footprint
- 18.2.5 Production Capacity and Expansion Plans
- 18.2.6 Financial Performance and Investment
- 18.2.7 Market Share and Competitive Position
- 18.2.8 Technology and Innovation Capabilities
- 18.2.9 Strategic Alliances or Partnerships
- 18.2.10 Recent Developments
- 18.2.11 Growth Strategy and Outlook
- 18.3 Samsung Electronics Co. Ltd.
- 18.4 Huawei Technologies Co. Ltd.
- 18.5 Xiaomi Corporation
- 18.6 Garmin Ltd.
- 18.7 Meta Platforms
- 18.8 EssilorLuxottica
- 18.9 Oura Health
- 18.10 Dexcom
- 18.11 Anduril Industries
- 18.12 Other Relevant Market Participants
Note: Every listed company is profiled on the structure shown under the first company. The company list is preliminary and may change based on research findings, market developments, data availability and client requirements.
Chapter 19 Disclaimer
- 19.1 Research and Forecast Disclaimer
- 19.2 Data Source and Estimation Limitations
Note: The depth of individual sections depends on data availability for this market. Volume, capacity, trade and other unit-based metrics are included where applicable.

