Market Overview
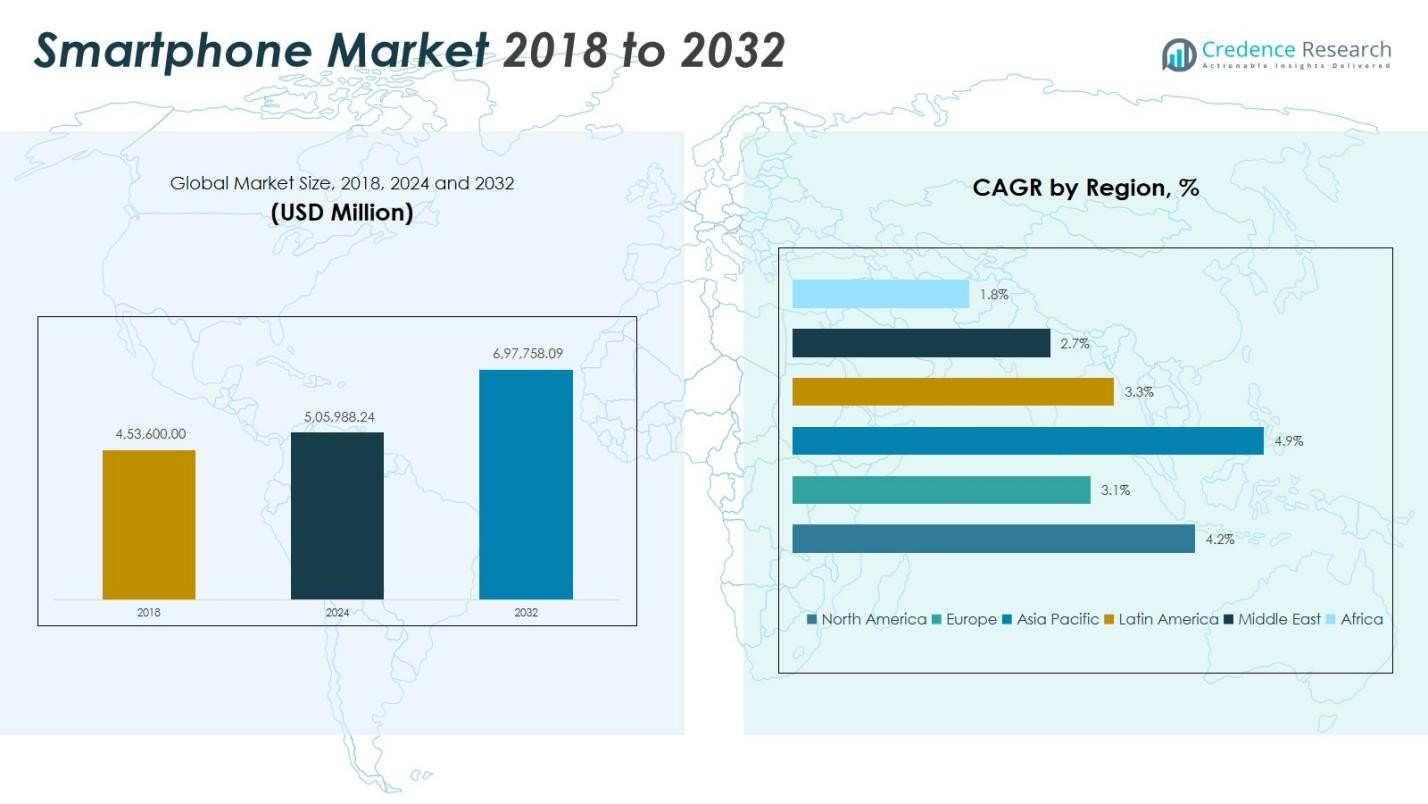
The Smartphone Market size was valued at USD 453,600.00 million in 2018, increasing to USD 505,988.24 million in 2024, and is anticipated to reach USD 697,758.09 million by 2032, at a CAGR of 4.16% during the forecast period.
| REPORT ATTRIBUTE |
DETAILS |
| Historical Period |
2020-2023 |
| Base Year |
2024 |
| Forecast Period |
2025-2032 |
| Smartphone Market Size 2024 |
USD 505,988.24 Million |
| Smartphone Market, CAGR |
4.16% |
| Smartphone Market Size 2032 |
USD 697,758.09 Million |
The global smartphone market is dominated by leading players such as Apple Inc., Samsung Electronics Co. Ltd., Xiaomi Corporation, Huawei Technologies Co. Ltd., Oppo, and Vivo, which collectively account for a significant portion of global sales. Apple and Samsung lead the premium segment through strong brand loyalty and continuous innovation, while Xiaomi, Oppo, and Vivo strengthen their positions in the mid-range and entry-level categories with affordable, feature-rich devices. Asia Pacific remains the leading region, commanding approximately 49% of the global market share in 2024, driven by massive consumer bases, rapid 5G expansion, and robust local manufacturing ecosystems in China, India, and South Korea.
Access crucial information at unmatched prices!
Request your sample report today & start making informed decisions powered by Credence Research Inc.!
Download Sample
Market Insights
- The global smartphone market was valued at USD 505,988.24 million in 2024 and is projected to reach USD 697,758.09 million by 2032, growing at a CAGR of 4.16% during the forecast period.
- Rising demand for advanced connectivity, 5G integration, and AI-powered features is driving market growth, supported by increasing consumer adoption of mid-range and premium smartphones globally.
- Emerging trends include the rise of foldable displays, sustainable materials, and enhanced camera technology, as well as growing use of IoT integration and cloud-based services in smartphones.
- The market is highly competitive, with key players such as Apple, Samsung, Xiaomi, Oppo, and Huawei dominating across various price segments, emphasizing innovation and strategic partnerships.
- Asia Pacific holds around 49% of the market share, followed by North America with 23% and Europe with 18%, while Android accounts for the largest share among operating systems globally.
Market Segmentation Analysis:
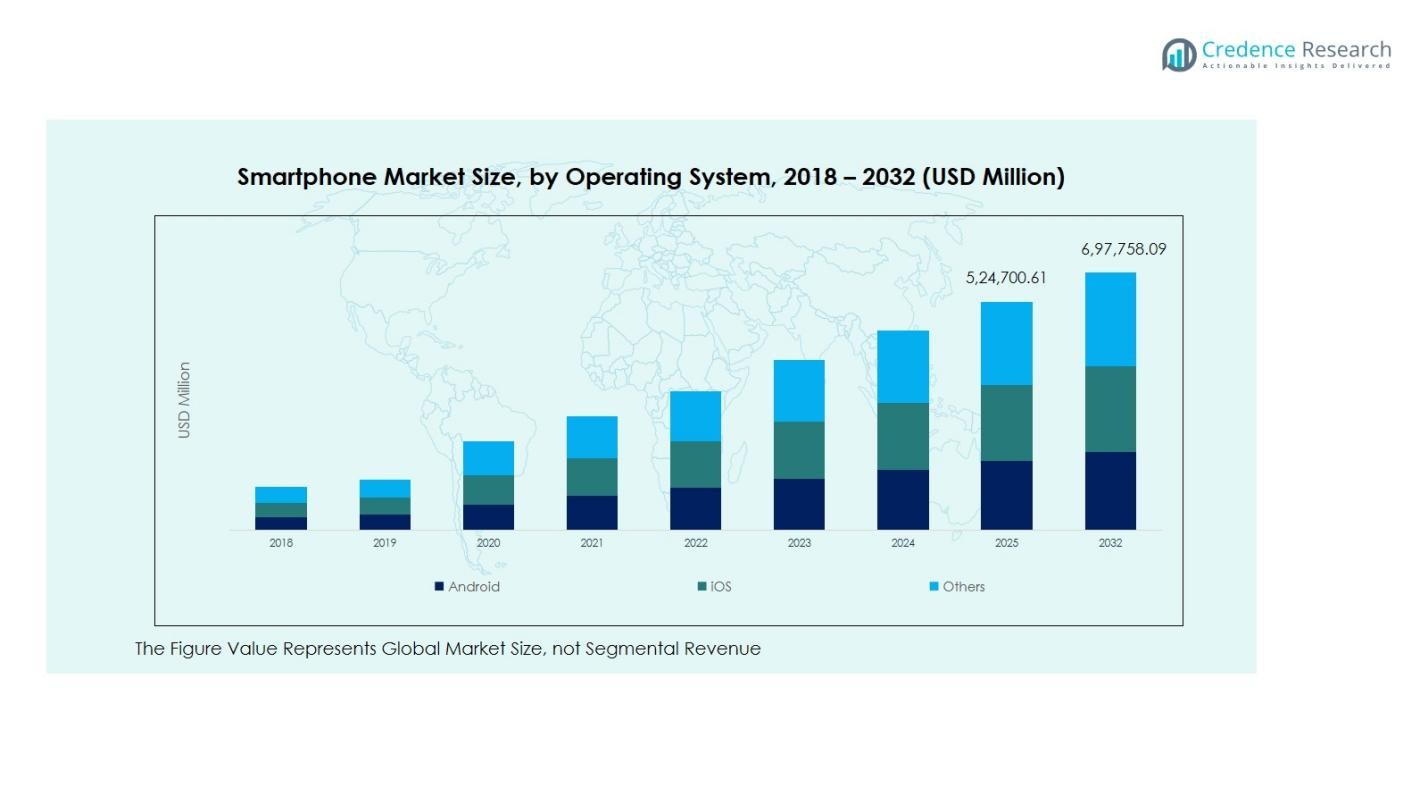
By Operating System:
The operating-system segment of the global smartphone market is led by the Android sub-segment, which holds 72 % of worldwide market share. This dominance is underpinned by Android’s broad availability across device makers and price tiers, as well as the open-source model that enables rapid innovation and adaptation. The iOS sub-segment follows at 27 %, driven by premium pricing, strong brand loyalty and ecosystem integration. The “Others” category captures only a marginal share (below ~1-2 %) but remains relevant in niche or regional markets. Key drivers include the expanding ecosystem of services and applications, rising 5G deployment, and growing smartphone penetration in emerging markets.
For instance, Samsung’s Galaxy S25 Ultra showcases Android’s strength by integrating advanced AI-powered camera technology, such as its 200MP sensor and AI processing, which appeals to a broad range of consumers across price markets.
By Price Range:
In the price-range segmentation of the smartphone market, the mid-range tier (typically devices priced in the $200-$500 range) emerges as the dominant sub-segment, accounting for 40% of shipments globally. This tier’s strong position is fueled by consumers seeking a balance between features and affordability, rising disposable incomes in emerging markets and the proliferation of 5G and AI-enabled capabilities in more affordable models. Entry-level devices remain significant often over 50 % of volume in developing regions owing to affordability and first-time buyers, but their average selling price remains low. The premium segment (above ~$500) attracts strong margins but represents a smaller share of unit volume due to higher price points and longer replacement cycles.
For instance, Xiaomi and Realme have successfully targeted price-sensitive consumers in Asia-Pacific with budget devices that support essential digital connectivity.
By Distribution Channel:
Within the smartphone distribution channel segmentation, the offline retail channel remains the dominant sub-segment, capturing over 50 % of revenue share globally in 2024. This endurance is attributed to consumers’ preference for in-store experience, hands-on device trials, and immediate purchase gratification especially in tier-2/3 markets. However, the online channel is the fastest-growing segment, propelled by expanding e-commerce penetration, digital payment adoption and promotional campaigns. The shift is particularly pronounced in urban and younger consumer segments where convenience and price transparency matter most. Together, these channels form the full distribution ecosystem with offline anchoring high-volume penetration and online driving future growth.
Key Growth Drivers
Rising 5G Adoption and Technological Advancements
The rapid expansion of 5G networks is significantly accelerating smartphone demand, enabling faster connectivity, low latency, and enhanced user experiences. Manufacturers are increasingly integrating 5G compatibility, AI-powered processors, and advanced camera systems even in mid-range devices. These technological improvements drive consumer upgrades and stimulate replacement cycles. Additionally, the proliferation of IoT and cloud-based applications encourages users to adopt feature-rich smartphones, boosting overall market growth across both developed and emerging economies.
For instance, Apple introduced the A19 Bionic chip in its iPhone 17 series, featuring a powerful Neural Engine that enhances AI capabilities such as computational photography and on-device AI processing for a more personalized experience.
Increasing Disposable Income and Urbanization
Growing disposable income levels, particularly in developing countries such as India, China, and Indonesia, are expanding the consumer base for smartphones. Urbanization and digitalization have driven mobile-centric lifestyles, promoting device adoption for communication, payments, entertainment, and education. Affordable financing options, EMI plans, and trade-in programs have further supported consumer access to premium models. This socio-economic shift continues to strengthen smartphone penetration rates and enhance unit sales globally.
For instance, Vivo led India’s smartphone shipments in Q3 2025 with 9.7 million units, supported by aggressive product launches and retail partnerships, while Samsung followed with 6.8 million units.
Expanding E-Commerce and Omnichannel Retail Networks
The expansion of online retail platforms and omnichannel distribution networks has made smartphones more accessible to a broader audience. E-commerce giants and direct-to-consumer strategies allow brands to reach price-sensitive and remote consumers efficiently. Online-exclusive launches, flash sales, and bundled offers enhance affordability and convenience. Meanwhile, offline retail retains its importance for experiential buying, creating a balanced ecosystem that drives steady sales growth across all major markets.
Key Trends and Opportunities
Integration of AI, AR, and Foldable Technologies
The integration of artificial intelligence (AI), augmented reality (AR), and foldable display technologies is transforming the smartphone landscape. AI enhances user personalization, photography, and device security, while AR applications improve gaming and shopping experiences. Foldable smartphones, though premium-priced, are gaining traction as innovation-driven consumers seek multi-functional and compact devices. This technological convergence presents major opportunities for manufacturers to differentiate products and capture evolving consumer preferences.
For instance, Samsung Galaxy smartphones incorporate Object Eraser, allowing users to remove objects from photos seamlessly, illustrating the shift toward more intelligent image processing.
Sustainability and Circular Economy Initiatives
Growing environmental awareness is driving demand for eco-friendly smartphones and sustainable manufacturing practices. Brands are focusing on recyclable materials, longer product lifecycles, and software longevity to minimize electronic waste. The rise of refurbished and certified pre-owned smartphone markets also supports affordability and reduces carbon footprints. Companies investing in green supply chains and repairable designs are likely to gain competitive advantage as sustainability becomes a key consumer consideration.
For instance, Apple incorporates 100% recycled gold in the wiring of its iPhone 14 series cameras and circuit boards while eliminating plastic from its packaging to reduce environmental impact.
Key Challenges
Market Saturation and Lengthening Replacement Cycles
In mature markets like North America, Europe, and parts of Asia, smartphone penetration has reached near saturation, resulting in slower sales growth. Consumers are retaining devices longer due to durable designs, incremental innovation, and rising costs. This extended replacement cycle constrains shipment volumes and pressures manufacturers to focus on value-added features and service-based revenues, such as cloud storage and device insurance, to sustain profitability.
Supply Chain Disruptions and Component Shortages
Global supply chain disruptions and semiconductor shortages continue to challenge smartphone production and pricing stability. Geopolitical tensions, rising logistics costs, and fluctuations in raw material availability impact manufacturing timelines and profit margins. Smaller vendors face greater risks due to dependency on third-party suppliers. To mitigate these challenges, manufacturers are diversifying sourcing strategies, investing in localized production, and adopting flexible logistics networks to ensure consistent market supply.
Regional Analysis
North America
The North America smartphone market was valued at USD 106,596.00 million in 2018 and reached USD 116,677.85 million in 2024, projected to attain USD 160,555.39 million by 2032, growing at a CAGR of 4.2%. The region accounts for 23% of the global market share, driven by high smartphone penetration, premium device demand, and rapid 5G deployment. The United States leads the market with strong sales of Apple and Samsung devices, while Canada and Mexico contribute steadily through expanding mid-range adoption and e-commerce-driven sales channels.
Europe
Europe’s smartphone market, valued at USD 83,462.40 million in 2018, expanded to USD 87,926.92 million in 2024, and is forecast to reach USD 111,468.71 million by 2032 at a CAGR of 3.1%, representing 19% of global market share. Growth is supported by increasing replacement demand, adoption of 5G technology, and the expansion of sustainability-focused smartphone brands. Western European nations, including the UK, Germany, and France, lead adoption, while Eastern Europe shows rising demand for affordable Android smartphones, driven by improving internet infrastructure and competitive pricing.
Asia Pacific
Asia Pacific dominates the global smartphone market with a 49% share, valued at USD 205,571.52 million in 2018, reaching USD 234,801.72 million in 2024, and projected to hit USD 342,250.90 million by 2032 at a CAGR of 4.9%. The region’s growth is propelled by massive consumer bases in China and India, strong local manufacturing ecosystems, and surging 5G-enabled smartphone demand. Affordable mid-range offerings from brands like Xiaomi, Oppo, and Vivo continue to fuel volume sales, while markets such as Japan and South Korea drive innovation through high-end technology adoption.
Latin America
The Latin America smartphone market stood at USD 32,659.20 million in 2018, rose to USD 36,122.50 million in 2024, and is expected to reach USD 46,659.08 million by 2032, expanding at a CAGR of 3.3% and holding 7% of the global share. Growth is driven by rising digital connectivity, economic recovery, and increasing demand for affordable smartphones. Brazil remains the largest market, followed by Mexico and Argentina, where growing online retail penetration and attractive financing schemes have boosted mid-range smartphone adoption among cost-conscious consumers.
Middle East
The Middle East smartphone market, valued at USD 15,422.40 million in 2018, reached USD 15,985.94 million in 2024, and is projected to grow to USD 19,610.84 million by 2032 at a CAGR of 2.7%, representing 3% of global market share. Demand is fueled by expanding 4G and 5G networks, particularly in GCC countries, and rising youth-driven digital consumption. Premium devices remain popular in urban centers like Dubai and Riyadh, while emerging segments in Turkey and Israel show steady growth supported by increased affordability and e-commerce accessibility.
Africa
Africa’s smartphone market was valued at USD 9,888.48 million in 2018, increased to USD 14,473.31 million in 2024, and is expected to reach USD 17,213.17 million by 2032, growing at a CAGR of 1.8% and accounting for 2% of global share. The region’s growth is driven by improving mobile internet penetration, availability of low-cost Android smartphones, and expanding 4G coverage. Countries like South Africa, Nigeria, and Egypt are key contributors, with rising affordability and local assembly initiatives boosting accessibility, although overall market expansion remains constrained by economic disparities.
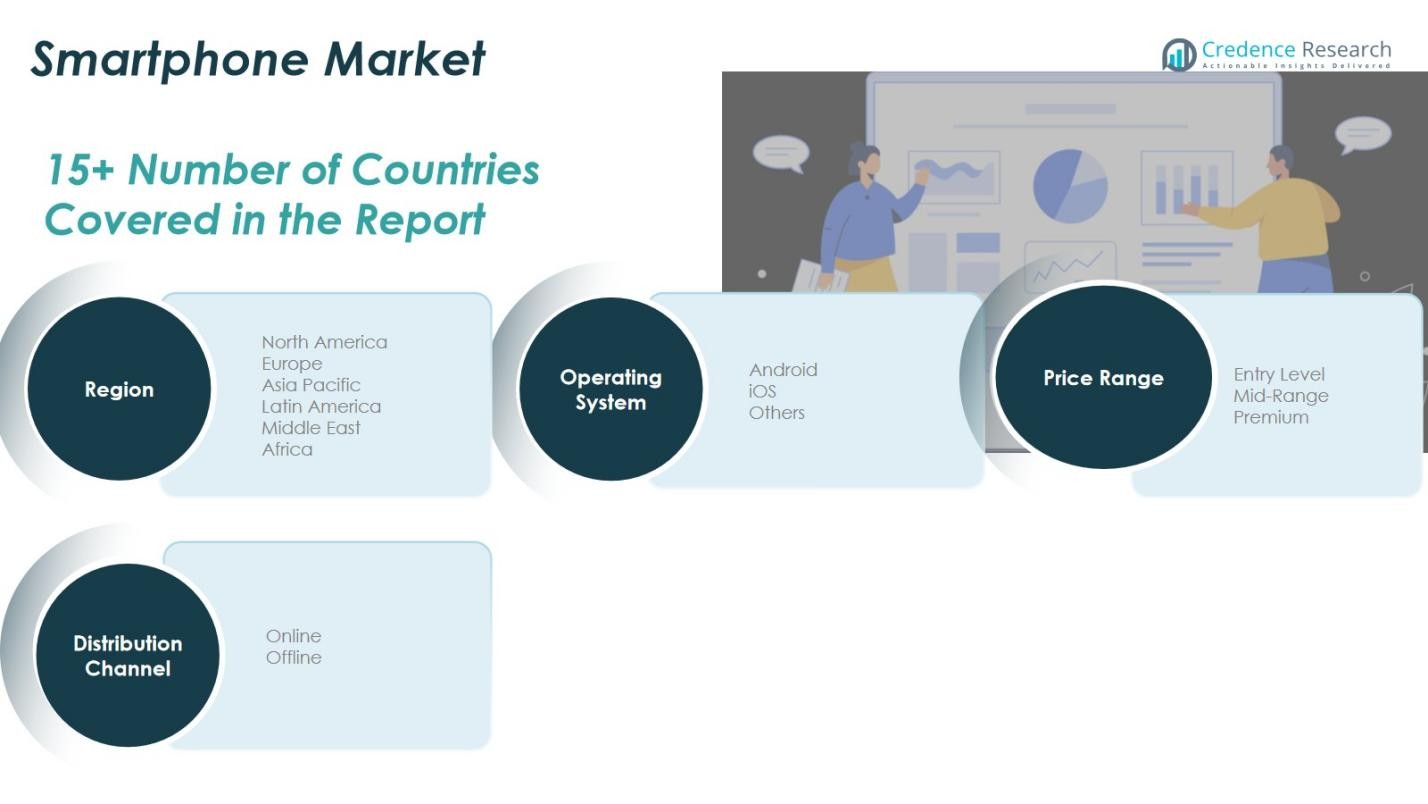
Market Segmentations:
By Operating System:
By Price Range:
- Entry Level
- Mid-Range
- Premium
By Distribution Channel:
By Region
- North America
- Europe
- Germany
- France
- U.K.
- Italy
- Spain
- Rest of Europe
- Asia Pacific
- China
- Japan
- India
- South Korea
- South-east Asia
- Rest of Asia Pacific
- Latin America
- Brazil
- Argentina
- Rest of Latin America
- Middle East & Africa
- GCC Countries
- South Africa
- Rest of the Middle East and Africa
Competitive Landscape
The competitive landscape of the global smartphone market is characterized by the strong presence of leading players such as Apple Inc., Samsung Electronics Co. Ltd., Xiaomi Corporation, Huawei Technologies Co. Ltd., Oppo, Vivo, OnePlus, and Google LLC. These companies dominate through innovation, brand strength, and extensive global distribution networks. Apple and Samsung maintain leadership in the premium segment, driven by technological advancements and ecosystem integration, while Xiaomi, Oppo, and Vivo capture substantial mid-range and entry-level shares with feature-rich, affordable devices. Competitive strategies include product diversification, 5G integration, AI-driven enhancements, and sustainable manufacturing practices. Emerging players are leveraging e-commerce platforms, regional manufacturing, and partnerships to expand market penetration. Continuous R&D investments, along with mergers and collaborations, are intensifying competition. The market’s dynamics are further shaped by pricing pressures, evolving consumer preferences, and rapid technological evolution, compelling manufacturers to focus on differentiation and customer retention for sustained growth.
Key Player Analysis
- Apple Inc.
- Asus
- Google LLC
- Huawei Technologies Co. Ltd.
- HMD Global
- Lenovo Group Limited
- Motorola Mobility LLC
- OnePlus Technology Co., Ltd.
- Oppo Electronics Corp.
- Realme
- Samsung Electronics Co., Ltd.
- Sony Corporation
- Xiaomi Corporation
- ZTE Corporation
Recent Developments
- In June 2025, Huawei launched its Pura 80 smartphone series, featuring four models Pura 80, Pura 80 Pro, Pura 80 Pro+, and Pura 80 Ultra integrated with advanced AI-powered camera technology, marking a significant step in its comeback within the global smartphone market.
- In June 2025, OnePlus announced the India launch of its OnePlus 13s, equipped with a Snapdragon 8 Elite processor, 120 Hz adaptive display, and a new “Plus Key” functionality designed to enhance user experience and device performance.
- In July 2025, Alibaba and HONOR deepened their partnership to expand artificial-intelligence capabilities in smartphones, focusing on joint innovation in imaging and user-experience features.
- In October 2025, realme announced a strategic collaboration with Ricoh Imaging Company to co-create mobile camera systems, launching their first co-developed device with the realme GT 8 Pro.
Shape Your Report to Specific Countries or Regions & Enjoy 30% Off!
Report Coverage
The research report offers an in-depth analysis based on Operating System, Price Range, Distribution Channel and Region. It details leading market players, providing an overview of their business, product offerings, investments, revenue streams, and key applications. Additionally, the report includes insights into the competitive environment, SWOT analysis, current market trends, as well as the primary drivers and constraints. Furthermore, it discusses various factors that have driven market expansion in recent years. The report also explores market dynamics, regulatory scenarios, and technological advancements that are shaping the industry. It assesses the impact of external factors and global economic changes on market growth. Lastly, it provides strategic recommendations for new entrants and established companies to navigate the complexities of the market.
Future Outlook
- The smartphone market will continue to expand steadily, driven by rising global connectivity and digital transformation.
- 5G-enabled smartphones will dominate future shipments as network coverage broadens worldwide.
- AI, AR, and machine learning integration will enhance device performance, personalization, and user experience.
- Foldable and flexible display smartphones will gain momentum in the premium category.
- Sustainability and recyclable materials will become key priorities in smartphone manufacturing.
- Emerging markets in Asia, Africa, and Latin America will drive major volume growth.
- Online sales channels will further strengthen due to digital payment adoption and wider internet access.
- Cloud-based services and ecosystem integration will boost brand loyalty and long-term engagement.
- Software updates, data security, and repairability will influence consumer purchasing decisions.
- Continuous innovation, affordability, and diversified product portfolios will remain crucial for competitive advantage.


