
Market Overview
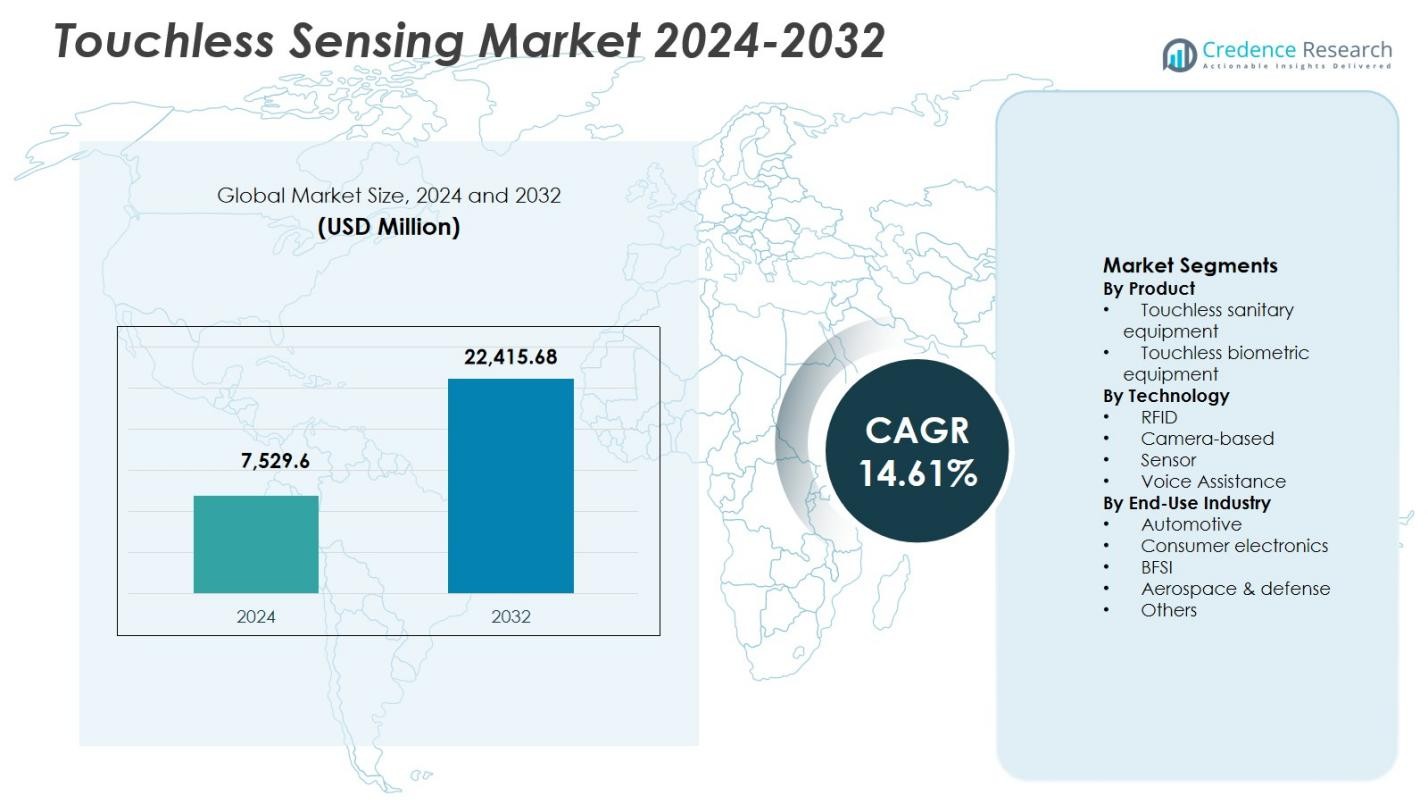
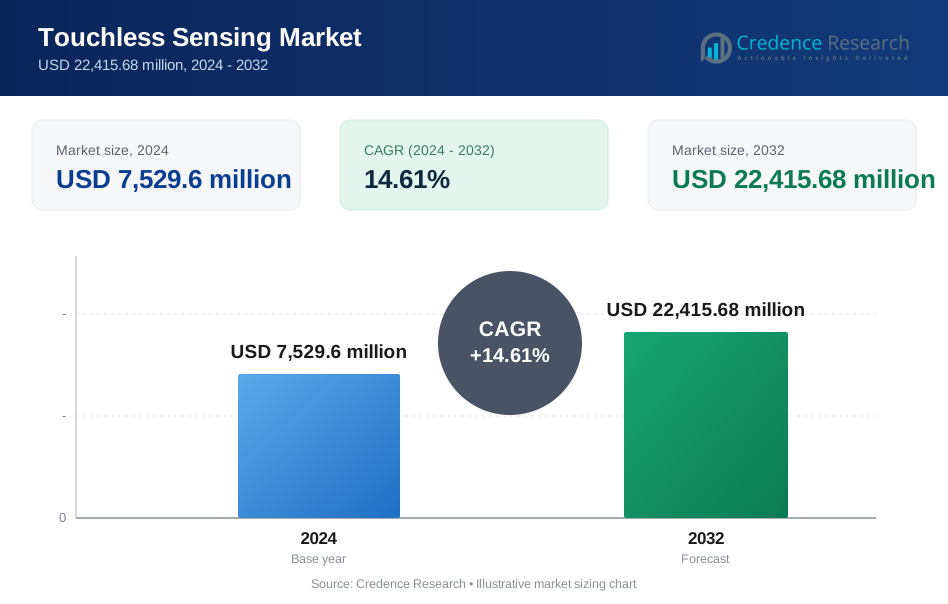
The Touchless Sensing Market size was valued at USD 7,529.6 million in 2024 and is anticipated to reach USD 22,415.68 million by 2032, growing at a CAGR of 14.61% during the forecast period.
| REPORT ATTRIBUTE | DETAILS |
|---|---|
| Historical Period | 2020-2023 |
| Base Year | 2024 |
| Forecast Period | 2025-2032 |
| Touchless Sensing Market Size 2024 | USD 7,529.6 Million |
| Touchless Sensing Market, CAGR | 14.61% |
| Touchless Sensing Market Size 2032 | USD 22,415.68 Million |
Touchless Sensing Market is supported by the strong presence of leading technology companies including Apple Inc., Google Inc., Infineon Technologies AG, Microchip Technology Inc., OmniVision Technologies, Elliptic Labs, iPROOV Limited, GestureTek, Cognitech Systems GmbH, and XYZ Interactive, which focus on advancing camera-based sensing, biometric authentication, and voice-enabled interaction technologies. These players emphasize AI integration, sensor miniaturization, and edge processing to enhance accuracy and real-time performance across consumer electronics, automotive, BFSI, and public security applications. Regionally, North America leads the Touchless Sensing Market with a 36.4% market share, driven by early adoption of contactless technologies, strong R&D ecosystems, and large-scale deployment across smart infrastructure and digital identity systems. Europe and Asia-Pacific follow, supported by automotive innovation, consumer electronics manufacturing, and expanding smart city initiatives.
Market Insights
- Touchless Sensing Market was valued at USD 7,529.6 million in 2024 and is projected to expand at a CAGR of 14.61% through 2032, driven by rapid adoption of contactless interaction technologies across multiple industries.
- Market growth is driven by rising demand for contactless human–machine interaction, with touchless biometric equipment leading the product segment at a 46.8% market share due to strong use in access control, BFSI authentication, and digital identity systems.
- A key market trend is the dominance of camera-based technology, which accounted for a 38.6% share, supported by advancements in AI-enabled computer vision, 3D sensing, and gesture recognition across consumer electronics and automotive applications.
- Market analysis shows active participation by global technology providers focusing on AI integration, sensor miniaturization, and scalable platforms to address consumer electronics, automotive, BFSI, and public security use cases.
- Regionally, North America led with a 36.4% market share, followed by Europe at 27.1% and Asia-Pacific at 24.6%, while Latin America held 7.1% and Middle East & Africa accounted for 4.8%, reflecting varied adoption maturity levels.
Market Segmentation Analysis:
By Product:
In the Touchless Sensing Market, the product segment is led by touchless biometric equipment, which accounted for 46.8% market share in 2024. Strong adoption across access control, border security, and digital identity verification drives this dominance. Fingerprint-free facial recognition, iris scanning, and liveness detection technologies are increasingly preferred due to higher hygiene standards and enhanced security accuracy. Growth is further supported by rising deployment in airports, corporate campuses, and government facilities, where touchless authentication improves user throughput, minimizes physical contact, and ensures compliance with stringent safety and identity verification regulations.
- For instance, NEC's touchless multimodal biometric terminal combines face and iris recognition for high-precision authentication with a false accept rate below one in 10 billion.
By Technology:
The technology segment is dominated by camera-based touchless sensing, holding a 38.6% share of the Touchless Sensing Market in 2024. This leadership is driven by widespread integration of computer vision, AI-enabled image processing, and 3D depth-sensing capabilities. Camera-based systems enable accurate gesture recognition, facial analysis, and behavioral monitoring across diverse environments. Their scalability, declining hardware costs, and compatibility with advanced analytics platforms accelerate adoption in smart devices, automotive cabins, surveillance systems, and interactive public installations, making them the preferred technology for multi-functional touchless applications.
- For instance, AVer’s CAM550 and VB342 Pro cameras employ AI-driven gesture control for touch-free meeting management in video conferencing setups.
By End-Use Industry:
Among end-use industries, consumer electronics emerged as the dominant segment, capturing 34.2% market share in 2024. Strong demand for touchless interfaces in smartphones, smart TVs, laptops, and wearables supports this position. Manufacturers increasingly integrate gesture control, face recognition, and voice-based sensing to enhance user experience, device security, and convenience. The segment benefits from rapid product innovation cycles, high consumer acceptance of contactless interaction, and the growing ecosystem of smart home and personal devices that rely on intuitive, hygienic, and seamless human–machine interaction.
Key Growth Drivers
Rising Demand for Contactless Human–Machine Interaction
The Touchless Sensing Market is driven by increasing demand for contactless human–machine interaction across consumer electronics, automotive, healthcare, and public infrastructure. Users prefer gesture, facial, and voice-based interfaces that enhance convenience while reducing physical contact. This demand is reinforced by higher hygiene awareness and the need for seamless user experiences in shared environments such as airports, retail stores, and offices. Touchless interaction improves usability, reduces mechanical wear, and supports intuitive system design, accelerating adoption across smart devices and intelligent platforms.
- For instance, Google's Pixel 4 integrates Soli radar technology, enabling users to dismiss alarms, snooze timers, skip tracks, or answer calls with simple hand waves or taps detected within 20 cm via 60GHz signals.
Expansion of Biometric Authentication and Digital Identity Systems
The expansion of biometric authentication and digital identity initiatives significantly drives growth in the Touchless Sensing Market. Governments, BFSI institutions, and enterprises increasingly deploy touchless facial recognition, iris scanning, and liveness detection technologies to improve security and reduce fraud. These solutions enable fast, accurate, and user-friendly identity verification. Rising adoption in border control, mobile banking, corporate access management, and e-governance programs strengthens long-term demand for reliable and scalable touchless sensing technologies.
- For instance, iDenfy employs liveness detection in its no-code age verification app for Shopify merchants, combining facial biometrics with ID checks to confirm age for restricted products like alcohol and vapes in high-risk online sales
Integration in Automotive Systems and Smart Infrastructure
Integration of touchless sensing technologies in automotive systems and smart infrastructure is a key growth driver. Automakers adopt gesture control, driver monitoring, and voice-based interfaces to enhance safety, minimize driver distraction, and support advanced driver-assistance systems. In parallel, smart infrastructure projects incorporate touchless kiosks, access systems, and public interfaces to improve efficiency and accessibility. This broad integration across mobility and urban development platforms expands the application footprint of touchless sensing solutions.
Key Trends & Opportunities
Advancements in AI-Driven Computer Vision and Sensor Fusion
Advancements in AI-driven computer vision and sensor fusion represent a major trend in the Touchless Sensing Market. The integration of cameras, depth sensors, radar, and AI algorithms improves recognition accuracy and environmental adaptability. These developments enable precise gesture tracking, facial analysis, and contextual awareness under diverse conditions. As processing capabilities advance and costs decline, manufacturers gain opportunities to deploy high-performance touchless solutions across consumer, automotive, and industrial applications.
- For instance, Bosch Sensortec's BHI360 smart IMU sensor fuses gyroscope and accelerometer data with AI algorithms for real-time gesture recognition in wearables like smartwatches.
Emerging Opportunities in Healthcare and Smart Retail
Healthcare and smart retail sectors offer strong growth opportunities for the Touchless Sensing Market. Hospitals adopt touchless controls for medical equipment, patient monitoring, and access management to enhance hygiene and operational efficiency. In retail, touchless kiosks, interactive displays, and virtual try-on systems improve customer engagement while reducing physical contact. Growing investments in digital transformation and smart environments further accelerate adoption across these service-driven industries.
- For instance, Studio1Labs developed smart bedsheets with fabric sensors that track respiration patterns and pressure ulcers in bed-ridden patients, enabling hospitals to monitor vitals without physical attachments.
Key Challenges
High System Costs and Deployment Complexity
High system costs and deployment complexity remain significant challenges in the Touchless Sensing Market. Advanced touchless solutions require sophisticated sensors, AI software, and system calibration, increasing implementation expenses. Integrating these technologies with existing infrastructure and legacy systems can be complex and time-intensive. The need for skilled technical expertise and ongoing system maintenance further raises total ownership costs, limiting adoption in price-sensitive markets.
Data Privacy, Security, and Regulatory Compliance Issues
Data privacy, security, and regulatory compliance present critical challenges for the Touchless Sensing Market. Touchless systems process sensitive biometric and behavioral data, increasing concerns over data misuse and surveillance. Strict data protection regulations require robust security frameworks and transparent data management practices. Ensuring compliance while maintaining system performance and user trust remains a key hurdle, particularly in regions with stringent privacy and cybersecurity standards.
Regional Analysis
North America
North America dominated the Touchless Sensing Market with a 36.4% market share in 2024, driven by early technology adoption and strong investments in AI, biometrics, and smart infrastructure. The United States leads regional demand due to widespread deployment of touchless sensing in consumer electronics, BFSI authentication systems, automotive safety features, and public security applications. High adoption of facial recognition and gesture-based controls across enterprises and government facilities supports growth. The presence of major technology providers, robust R&D ecosystems, and favorable digital transformation initiatives further strengthen North America’s leadership position.
Europe
Europe accounted for a 27.1% share of the Touchless Sensing Market in 2024, supported by strong adoption across automotive manufacturing, aerospace & defense, and industrial automation. Countries such as Germany, the UK, and France drive demand through integration of touchless sensing in smart vehicles, access control systems, and public infrastructure. Stringent safety and hygiene regulations accelerate deployment in transportation hubs and healthcare facilities. Additionally, Europe’s focus on smart city development, advanced driver monitoring systems, and secure digital identity frameworks continues to sustain consistent regional market growth.
Asia-Pacific
Asia-Pacific held a 24.6% market share in 2024, making it the fastest-growing region in the Touchless Sensing Market. Growth is driven by rapid expansion of consumer electronics manufacturing, rising smartphone penetration, and increasing adoption of biometric systems across China, Japan, South Korea, and India. Large-scale investments in smart cities, public surveillance, and digital payment infrastructure further boost demand. The region benefits from cost-effective sensor manufacturing, expanding automotive production, and strong government initiatives supporting digitalization, positioning Asia-Pacific as a key long-term growth engine.
Latin America
Latin America represented a 7.1% share of the Touchless Sensing Market in 2024, supported by gradual adoption across BFSI, retail, and public security sectors. Countries such as Brazil and Mexico are increasingly deploying touchless biometric systems for banking authentication, border security, and smart retail applications. Growing urbanization and digital payment adoption contribute to demand for contactless technologies. While infrastructure limitations remain, rising investments in smart transportation, public safety modernization, and consumer electronics distribution continue to create steady growth opportunities across the region.
Middle East & Africa
The Middle East & Africa accounted for a 4.8% market share in 2024, driven by smart infrastructure investments and security-focused deployments. Gulf countries lead adoption through large-scale smart city projects, airport modernization, and advanced surveillance systems. Touchless sensing technologies are increasingly used in access control, border management, and public services to enhance safety and efficiency. In Africa, growing mobile connectivity and gradual digitization support emerging demand. Government-backed infrastructure programs and increasing focus on automation continue to strengthen regional market potential.
Market Segmentations:
By Product
- Touchless sanitary equipment
- Touchless biometric equipment
By Technology
- RFID
- Camera-based
- Sensor
- Voice Assistance
By End-Use Industry
- Automotive
- Consumer electronics
- BFSI
- Aerospace & defense
- Others
By Geography
- North America
- U.S.
- Canada
- Mexico
- Europe
- Germany
- France
- U.K.
- Italy
- Spain
- Rest of Europe
- Asia Pacific
- China
- Japan
- India
- South Korea
- South-east Asia
- Rest of Asia Pacific
- Latin America
- Brazil
- Argentina
- Rest of Latin America
- Middle East & Africa
- GCC Countries
- South Africa
- Rest of the Middle East and Africa
Competitive Landscape
Competitive landscape of the Touchless Sensing Market includes key players such as Apple Inc., Google Inc., Infineon Technologies AG, Microchip Technology Inc., OmniVision Technologies, Elliptic Labs, iPROOV Limited, GestureTek, Cognitech Systems GmbH, and XYZ Interactive. The market is characterized by strong emphasis on innovation, AI integration, and sensor miniaturization to enhance accuracy and real-time responsiveness. Leading companies focus on advancing camera-based sensing, biometric authentication, and voice-assisted interfaces to strengthen their solution portfolios. Strategic partnerships with automotive OEMs, consumer electronics manufacturers, and smart infrastructure developers are widely adopted to expand application reach. Continuous investment in R&D enables players to improve low-latency processing, edge AI capabilities, and data security compliance. Competition intensifies as companies differentiate through software intelligence, system integration expertise, and scalable platforms tailored for diverse end-use industries including consumer electronics, BFSI, automotive, and public security.
Key Player Analysis
- iPROOV Limited
- Infineon Technologies AG
- GestureTek
- Microchip Technology Inc.
- Elliptic Labs
- Apple Inc.
- Cognitech Systems GmbH
- OmniVision Technologies, Inc.
- XYZ Interactive
- Google Inc.
Recent Developments
- In July 2025, STMicroelectronics entered into a definitive agreement to acquire NXP Semiconductors’ MEMS sensors business for up to US$950 million, enhancing its touchless sensing capabilities in automotive safety and industrial applications, with closure expected in H1 2026.
- In November 2025, Wearable Devices Ltd. secured an exclusive distribution agreement with Sky Commerce Co., Ltd. to distribute its Mudra Band and Mudra Link neural input wristbands in South Korea, expanding its presence in Asia.
- In October 2025, Wearable Devices Ltd. announced a new patent for an advanced gesture and voice-controlled interface device that enhances touchless interaction capabilities.
Report Coverage
The research report offers an in-depth analysis based on Product, Technology, End Use Industry and Geography. It details leading market players, providing an overview of their business, product offerings, investments, revenue streams, and key applications. Additionally, the report includes insights into the competitive environment, SWOT analysis, current market trends, as well as the primary drivers and constraints. Furthermore, it discusses various factors that have driven market expansion in recent years. The report also explores market dynamics, regulatory scenarios, and technological advancements that are shaping the industry. It assesses the impact of external factors and global economic changes on market growth. Lastly, it provides strategic recommendations for new entrants and established companies to navigate the complexities of the market.
Future Outlook
- The Touchless Sensing Market will witness wider adoption across consumer electronics as manufacturers prioritize intuitive and hygienic user interfaces.
- Advancements in artificial intelligence and machine learning will enhance accuracy, responsiveness, and contextual awareness of touchless sensing systems.
- Automotive integration will expand with increased deployment of gesture control, driver monitoring, and voice-based interaction for safety and comfort.
- Demand from biometric authentication and digital identity applications will continue to strengthen across BFSI, government, and enterprise sectors.
- Smart city and public infrastructure projects will accelerate the use of touchless interfaces in transportation, security, and public services.
- Healthcare adoption will rise as touchless systems support infection control, patient monitoring, and equipment operation.
- Sensor miniaturization and edge computing will improve system efficiency while enabling compact and cost-effective designs.
- Data security and privacy-focused innovations will become central to maintaining regulatory compliance and user trust.
- Emerging markets will see faster penetration driven by digitalization, urbanization, and expanding smart device ecosystems.
- Strategic partnerships and platform-based solutions will shape long-term competition and ecosystem development.
Request a Free Sample
Fill in your details and we'll send you a free sample report.
- Sample data tables & charts
- Research methodology
Need a Custom Version of This Report?
Tailor the scope, geography, or segments to your exact requirements.
- Custom geography or segment scope
- Direct access to our analyst team
Frequently Asked Questions
What is the current market size for the Touchless Sensing Market, and what is its projected size in 2032?
At what Compound Annual Growth Rate is the Touchless Sensing Market projected to grow between 2024 and 2032?
Which Touchless Sensing Market segment held the largest share in 2024?
What are the primary factors fueling the growth of the Touchless Sensing Market?
Who are the leading companies in the Touchless Sensing Market?
Which region commanded the largest share of the Touchless Sensing Market in 2024?
Table of Content
Chapter 1. Report Introduction
- 1.1 Report Description & Purpose
- 1.1.1 Report Title & Market Definition
- 1.1.2 Unique Selling Propositions (USP) & Key Differentiators
- 1.1.3 Value Proposition for Stakeholders
- 1.2 Research Objectives
- 1.2.1 Market Sizing Objectives (Volume & Revenue)
- 1.2.2 Segmentation Objectives
- 1.2.3 Competitive Intelligence Objectives
- 1.2.4 Forecast & Scenario Objectives
- 1.3 Report Scope
- 1.3.1 Touchless Sensing Scope – Types & Subtypes Covered
- 1.3.2 Geographic Scope – Regions & Countries Covered
- 1.3.3 Historical Period, Base Year & Forecast Period (2024; forecast to 2032)
- 1.3.4 Inclusions & Exclusions
- 1.4 HS Code & Classification Framework
- 1.5 Currency, Units & Pricing Basis
- 1.6 Target Stakeholders
- 1.7 Limitations & Assumptions
Chapter 2. Executive Summary
- 2.1 Global Touchless Sensing Market Snapshot
- 2.1.1 Market Size – Historical (2024) & Forecast (2024-2032) (2024: USD 7,529.6 million → 2032: USD 22,415.68 million)
- 2.1.2 Volume & Revenue – Global Totals
- 2.1.3 Key Market Highlights – Top Five Facts
- 2.2 Touchless Sensing Market Segmentation Snapshot
- 2.2.1 Market Split by Region – 2024 vs. 2032
- 2.3 Competitive Snapshot
- 2.3.1 Top 10 Players by Revenue Share – 2024
- 2.3.2 Top 10 Players by Volume Share – 2024
- 2.3.3 Recent Strategic Developments (18-Month Summary)
- 2.4 Key Investment Highlights & Strategic Conclusions
Chapter 3. Touchless Sensing Market Dynamics & Industry Analysis
- 3.1 Market Overview & Context
- 3.1.1 Touchless Sensing Market Position in the Broader Automotive Value Chain
- 3.1.2 OEM vs. Replacement Market Dynamics
- 3.1.3 Market Maturity & Development Stage by Region
- 3.2 Touchless Sensing Market Drivers
- 3.3 Touchless Sensing Market Restraints & Challenges
- 3.4 Touchless Sensing Market Opportunities
- 3.5 Porter's Five Forces Analysis
- 3.5.1 Threat of New Entrants
- 3.5.2 Bargaining Power of Suppliers
- 3.5.3 Bargaining Power of Buyers
- 3.5.4 Threat of Substitutes
- 3.5.5 Competitive Rivalry – Intensity Assessment
- 3.6 Touchless Sensing Value Chain Analysis
- 3.6.1 Upstream – Raw Material/Input Suppliers
- 3.6.1.1 Raw Material/Input 1
- 3.6.1.2 Raw Material/Input 2
- 3.6.1.3 Raw Material/Input 3
- 3.6.2 Midstream – Production/Manufacturing/Service Delivery
- 3.6.2.1 Production/Process Overview
- 3.6.2.2 Key Facility Locations & Capacity by Manufacturer
- 3.6.3 Downstream – Distribution & End Consumer
- 3.6.3.1 Primary Channel – B2B/OEM
- 3.6.3.2 Secondary Channels – Dealer, Retail, Online, Direct
- 3.6.4 Value Chain Profitability Analysis
- 3.6.1 Upstream – Raw Material/Input Suppliers
- 3.7 PESTEL Analysis
- 3.7.1 Political Factors
- 3.7.2 Economic Factors
- 3.7.3 Social Factors
- 3.7.4 Technological Factors
- 3.7.5 Environmental Factors
- 3.7.6 Legal Factors
- 3.8 Touchless Sensing Supply Chain Analysis
- 3.8.1 Raw Material/Input Supply Risk Assessment
- 3.8.2 Manufacturing Concentration Risk (Geographic Exposure)
- 3.8.3 Trade Disruption Impact Analysis
- 3.9 Regulatory & Policy Landscape
Note: The regulatory and policy landscape section covers regulations based on their applicability to the market, Touchless Sensing category, geography, and scope of the study. Only regulatory frameworks with a material impact on operations, compliance, trade, sustainability, or market access are analyzed in detail.
Chapter 4. Key Investment Pockets & Opportunity Analysis
- 4.1 Touchless Sensing Market Attractiveness Analysis
- 4.1.1 By Region – Investment Attractiveness Matrix (Volume × CAGR)
- 4.2 Absolute Revenue Growth Opportunity
- 4.2.1 By Region – Absolute USD Growth Through 2032
- 4.3 Incremental Volume Opportunity
- 4.3.1 By Region – Incremental Volume Through 2032
- 4.3.2 Segment – Incremental Volume
- 4.4 Emerging Submarket Opportunity Deep Dive (Subject to Applicability)
- 4.5 Emerging Market Opportunity Scorecards
- 4.5.1 United States
- 4.5.2 Europe
- 4.5.3 Asia
- 4.5.4 Middle East & Africa
Note: Emerging Market Opportunity Scorecards will be included based on relevance and strategic importance. Regions listed are indicative and may vary depending on data availability and market dynamics.
Chapter 5. Touchless Sensing Import-Export Analysis & Trade Flows
- 5.1 Global Trade Overview
- 5.1.1 Global Export Value by Country (2024)
- 5.1.2 Global Export Volume by Country (2024)
- 5.1.3 Global Import Value by Country (2024)
- 5.1.4 Global Import Volume by Country (2024)
- 5.1.5 Net Trade Balance by Country (2024)
- 5.2 Export Analysis – Segment
- 5.2.1 Type 1 (HS Code)
- 5.2.2 Type 2 (HS Code)
- 5.2.3 Type 3 (HS Code)
- 5.2.4 Type 4 (HS Code)
- 5.2.5 Type 5 (HS Code)
- 5.3 Import Analysis – Segment
- 5.3.1 Type 1 (HS Code)
- 5.3.2 Type 2 (HS Code)
- 5.3.3 Type 3 (HS Code)
- 5.3.4 Type 4 (HS Code)
- 5.3.5 Type 5 (HS Code)
- 5.4 Average Unit Trade Prices
- 5.4.1 Average Export Price – Segment & Country
- 5.4.2 Average Import Price – Segment & Source Country
- 5.4.3 Price Trends (2024)
- 5.5 Key Trade Route Analysis
- 5.5.1 Trade Route 1
- 5.5.2 Trade Route 2
- 5.5.3 Trade Route 3
- 5.5.4 Trade Route 4
- 5.5.5 Trade Route 5
- 5.6 Trade Policy Impact Assessment
- 5.6.1 US Anti-Dumping & Section 301 Tariffs
- 5.6.2 EU Customs Union Impact
- 5.6.3 Major Free Trade Agreements
- 5.6.4 USMCA Rules of Origin
Note: Trade policy analysis will be included only where relevant to the Touchless Sensing market.
Chapter 6. Competitive Landscape & Company Benchmarking
- 6.1 Touchless Sensing Market Concentration & Structure
- 6.1.1 Herfindahl-Hirschman Index (HHI) – vs. 2024
- 6.1.2 Tier 1, Tier 2 & Tier 3 Market Structure
- 6.1.3 Global, Regional & Local Player Dynamics
- 6.2 Touchless Sensing Market Share Analysis – 2024
- 6.2.1 Global Revenue Share by Company
- 6.2.2 Global Volume Share by Company
- 6.2.3 Regional Revenue Share
- 6.2.4 Market Share Evolution ( vs. 2024)
- 6.2.5 OEM Segment Share by Company
- 6.2.6 Replacement Segment Share by Company
- 6.3 Production/Delivery Capacity & Facility Analysis
- 6.3.1 Global Installed Capacity
- 6.3.2 Capacity Utilization Rates
- 6.3.3 Production/Output Volume
- 6.3.4 Facility Locations & Capacity Map
- 6.3.5 Planned Capacity Additions
- 6.4 Touchless Sensing Competitive Benchmarking Matrix
- 6.4.1 Revenue, Volume, CAGR & Profitability Comparison
- 6.4.2 Channel Revenue Mix
- 6.4.3 Geographic Revenue Exposure
- 6.4.4 R&D Intensity
- 6.4.5 Sustainability Maturity
- 6.5 Strategic Developments in Touchless Sensing (Last 24 Months)
- 6.5.1 Mergers, Acquisitions & Divestments
- 6.5.2 New Touchless Sensing Launches
- 6.5.3 Facility Expansions
- 6.5.4 Strategic Alliances, Joint Ventures & Partnerships
- 6.5.5 Distribution Expansion & Market Entry
- 6.5.6 Sustainability & ESG Initiatives
- 6.6 Competitive Strategy Mapping
- 6.6.1 Leader, Challenger, Follower & Niche Classification
- 6.6.2 Pricing Strategy Comparison
- 6.6.3 Channel Strategy Matrix
Note: Strategic developments are included based on their materiality and the availability of reliable information.
Chapter 7. Global Touchless Sensing Market – By Distribution Channel
- 7.1 Segment Overview
- 7.1.1 Volume & Revenue Split by Channel (2024 & 2032)
- 7.1.2 Channel Mix Evolution (2024-2032)
Chapter 8. Regional Market Analysis – Global Overview
- 8.1 Global Regional Overview
- 8.1.1 Regional Volume Share
- 8.1.2 Regional Revenue Share
- 8.1.3 Regional Volume by Region
- 8.1.4 Regional Revenue by Region
- 8.1.5 Regional Forecast Through 2032
- 8.2 Cross-Regional Segment Analysis
- 8.2.1 By Distribution Channel
- 8.2.2 By Brand/Price Tier
Chapter 9. North America Touchless Sensing Market
- 9.1 United States
- 9.2 Canada
- 9.3 Mexico
Chapter 10. Europe Touchless Sensing Market
- 10.1 Germany
- 10.2 France
- 10.3 Italy
- 10.4 United Kingdom
- 10.5 Spain
- 10.6 Poland
- 10.7 Russia
- 10.8 Netherlands
- 10.9 Belgium
- 10.10 Sweden
- 10.11 Denmark
- 10.12 Norway
- 10.13 Rest of Europe
Chapter 11. Asia Pacific Touchless Sensing Market
- 11.1 China
- 11.2 India
- 11.3 Japan
- 11.4 South Korea
- 11.5 Thailand
- 11.6 Indonesia
- 11.7 Vietnam
- 11.8 Malaysia
- 11.9 Australia
- 11.10 Rest of Asia Pacific
Chapter 12. Latin America Touchless Sensing Market
- 12.1 Brazil
- 12.2 Argentina
- 12.3 Colombia
- 12.4 Chile
- 12.5 Rest of Latin America
Chapter 13. Middle East Touchless Sensing Market
- 13.1 Saudi Arabia
- 13.2 United Arab Emirates
- 13.3 Turkey
- 13.4 Israel
- 13.5 Iran
- 13.6 Rest of the Middle East
Chapter 14. Africa Touchless Sensing Market
- 14.1 South Africa
- 14.2 Egypt
- 14.3 Nigeria
- 14.4 Morocco
- 14.5 Rest of Africa
Chapter 15. Touchless Sensing Company Profiles
- 15.1 [Company 01]
- 15.1.1 Company Overview
- 15.1.2 Key Management Personnel
- 15.1.3 Products & Services Portfolio
- 15.1.4 Financial Performance
- 15.1.5 Key Market Focus & Geographic Presence
- 15.1.6 Recent Developments & Strategic Initiatives
Note: The company profile list is preliminary and may change based on research findings, market developments, data availability, and client requirements.
Chapter 16. Appendices
- Appendix A – List of Abbreviations & Acronyms
- Appendix B – Industry Classification Code Reference – Full Series
- Appendix C – Production & Capacity Data Tables
- Appendix D – End-Use & Demand Base Tables
- Appendix E – Consumption & Replacement Rate Assumptions
- Appendix F – ASP Reference Tables
- Appendix G – Manufacturing & Facility Database
- Appendix H – Import-Export Data Tables
- Appendix I – Regulatory Summary Tables
- Appendix J – Primary Research Participant List (Anonymized)
- Appendix K – Primary Research Questionnaire Framework
- Appendix L – Data Sources & Bibliography
- Appendix M – Market Size Divergence & Source Comparison
Chapter 17. Research Methodology
- 17.1 Research Framework & Philosophy
- 17.2 Secondary Research – Sources, Hierarchy & Data Extraction
- 17.3 Data Modeling – Bottom-Up & Top-Down Market Sizing
- 17.4 Primary Research – Stakeholder Framework, LOI & Sample Sizes
- 17.5 Forecast Methodology – Regression, Scenario & Sensitivity Analysis
- 17.6 Quality Control – Four-Layer Validation Framework
- 17.7 Limitations & Standard Assumptions
- 17.8 Disclaimer
