Interactive Display Market By Display Type (Interactive Kiosk, Interactive Video Wall, Interactive Table, Interactive Monitor, Interactive Whiteboard); By Application (Retail, Hospitality, Healthcare, Transportation, BFSI, Corporate, Entertainment, Education, Others) – Growth, Share, Opportunities & Competitive Analysis, 2024 – 2032

Price: $4699

Published: | Report ID: 6962 | Report Format : PDF
REPORT ATTRIBUTE DETAILS
Historical Period  2019-2022
Base Year  2023
Forecast Period  2024-2032
Interactive Display Market Size 2023  USD 45,305 Million
Interactive Display Market, CAGR  7.55%
Interactive Display Market Size 2032  USD 81,101.6 Million

Market Overview

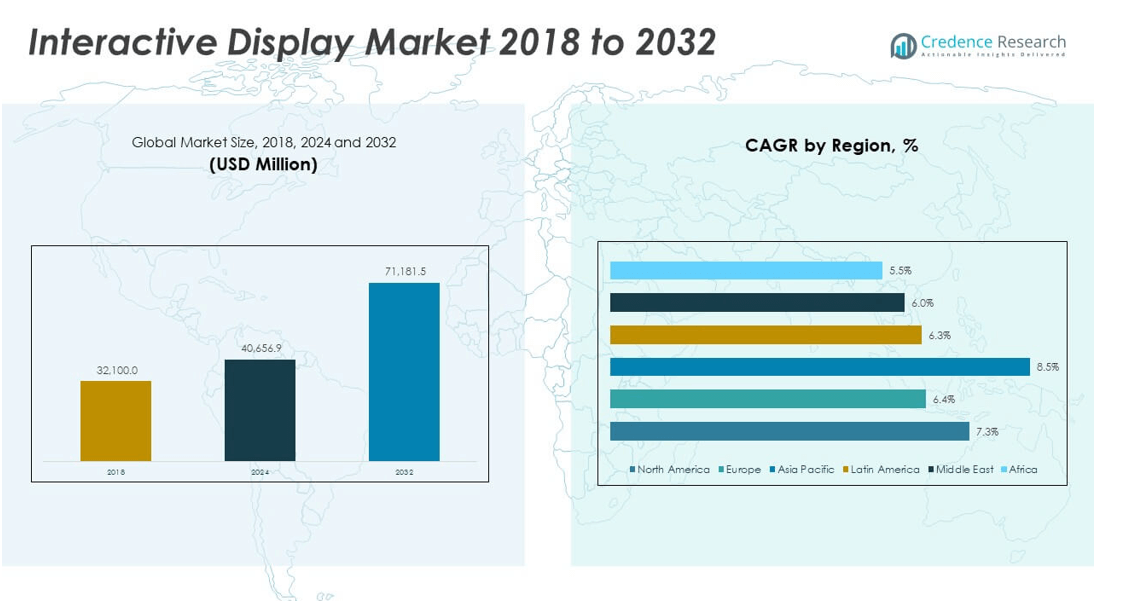
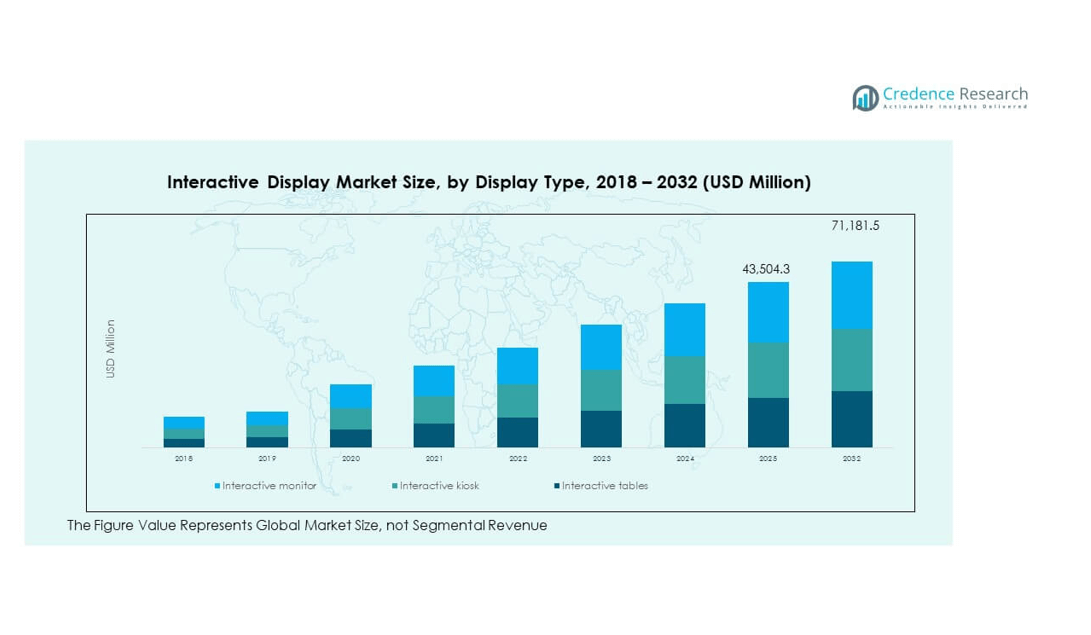
The Interactive Display Market is projected to grow from USD 45,305 million in 2023 to an estimated USD 81,101.6 million by 2032, with a compound annual growth rate (CAGR) of 7.55% from 2024 to 2032. This growth is attributed to the increasing adoption of interactive displays across educational institutions, corporate offices, and commercial spaces.

Key drivers in the market include the rapid digital transformation across industries and increasing investments in smart education systems and business collaborations. Trends such as the integration of artificial intelligence (AI) and Internet of Things (IoT) with interactive displays and the rising preference for immersive and touch-responsive display solutions are significantly shaping the market. The demand for high-performance displays with seamless connectivity, low latency, and high-resolution capabilities is on the rise, boosting market penetration.

Geographically, North America holds a major share due to the high adoption rate of advanced technology in education and corporate sectors. Asia-Pacific is expected to witness robust growth driven by increasing investments in smart infrastructure and the proliferation of smart classrooms. Key players in the market include Samsung Electronics Co., Ltd., LG Display Co., Ltd., NEC Corporation, Panasonic Corporation, and Sharp Corporation, who are focusing on product innovation, partnerships, and expansion to meet evolving consumer demands and to maintain their competitive edge.

Design Element 2

Access crucial information at unmatched prices!

Request your free sample report today & start making informed decisions powered by Credence Research!

Download Free Sample

CTA Design Element 3

Market Drivers

Rising Adoption in Education and Training Environments

The integration of interactive displays in educational and training institutions is significantly driving the growth of this market. Educational technology solutions, including interactive whiteboards, flat panels, and interactive projectors, are increasingly being used to enhance student engagement and improve learning outcomes. For instance, in 2021, the Indian government launched the National Digital Educational Architecture (NDEAR) to develop digital infrastructure and support educational planning efforts, reflecting a broader trend of governmental initiatives aimed at promoting digital education.Interactive displays foster interactive and collaborative classroom experiences by enabling touch-enabled interfaces, real-time feedback, and multimedia content sharing. Reports indicate that 80% of schools in developed countries have adopted these technologies to facilitate teaching and learning, underscoring their effectiveness in creating engaging educational environments. Additionally, statistics show that interactive displays are used daily in over 60% of classrooms, highlighting their role in supporting blended learning and interactive teaching methodologies. The shift toward digital learning environments, accelerated by the COVID-19 pandemic, continues to encourage schools, universities, and corporate training centers to adopt these advanced technologies. Furthermore, government initiatives and policies promoting digital education further propel the demand for interactive displays worldwide, establishing this segment as a major driver for market growth.

Growing Demand for Touchscreen Technologies and Immersive User Experiences

Interactive displays are widely favored for their ability to deliver touchscreen capabilities and immersive user experiences across various industries, including retail, corporate, healthcare, and hospitality sectors. Retailers use interactive kiosks, digital signage, and in-store displays to enhance customer engagement, deliver personalized recommendations, and offer immersive product experiences. Corporate environments benefit from interactive displays in collaborative spaces, meeting rooms, and video conferencing setups, where touchscreens facilitate real-time information sharing, visual presentations, and seamless communication. The healthcare sector also leverages interactive displays for patient engagement, diagnosis, and administrative functions. This growing demand for touch and gesture-enabled displays, combined with features like multi-touch recognition, real-time annotation, and easy connectivity, is a key driver of the market’s growth trajectory.

Technological Advancements and Integration of Artificial Intelligence (AI) and the Internet of Things (IoT)

Rapid technological advancements in display technology and the integration of artificial intelligence (AI) and the Internet of Things (IoT) with interactive displays are propelling market demand. AI-powered displays offer personalized content recommendations, predictive analytics, and adaptive learning, improving user interactions and enabling data-driven insights. IoT-enabled interactive displays provide seamless connectivity between devices, facilitating smart building management, smart classrooms, and interactive digital ecosystems. Innovations in display technology—including ultra-high-definition (UHD) and OLED panels—enhanced durability, and energy-efficient designs continue to redefine user experiences across sectors. These technological advancements support the widespread deployment of interactive displays, creating new opportunities for customization and automation that enhance user engagement and efficiency.

Increasing Investments in Smart Infrastructure and Digital Transformation Initiatives

The global emphasis on smart infrastructure development and digital transformation initiatives is creating a conducive environment for the adoption of interactive displays. Governments and private enterprises around the world are investing heavily in smart city projects, digital workplaces, and intelligent building solutions. Interactive displays play a pivotal role in transforming public spaces, enabling digital information dissemination, and improving connectivity through interactive kiosks, public displays, and wayfinding systems. Corporate entities are also making significant investments in digital workplace solutions, where interactive displays serve as the backbone of collaborative spaces, virtual meetings, and hybrid work models. The combination of favorable government policies, industry collaborations, and growing digital literacy is propelling the demand for interactive displays as a critical enabler of smart and digitally connected ecosystems.

Market Trends

Increased Integration of AI and IoT for Enhanced Functionality 

The integration of artificial intelligence (AI) and the Internet of Things (IoT) within interactive displays has become a prominent trend in the market. AI-powered features enable interactive displays to offer adaptive learning environments, intuitive user interfaces, and content personalization. By utilizing data analytics, these displays provide insights into user behavior, optimize content delivery, and offer predictive analytics that enhance engagement and effectiveness, particularly in educational and corporate settings. For instance, in smart classrooms, interactive displays equipped with AI can analyze student engagement in real-time, adjusting content dynamically to meet individual learning needs. This capability allows educators to provide personalized learning experiences, thereby improving educational outcomes. In retail environments, IoT-enabled displays can interact with sensors to alter advertising content based on customer demographics and inventory levels. For example, a display may show promotions for seasonal products when sensors detect a surge in foot traffic, thus optimizing marketing efforts and increasing sales potential.Moreover, corporate settings are leveraging these technologies to create collaborative workspaces. Interactive displays can connect with employees’ devices, enabling seamless sharing of information during meetings. This integration fosters a more engaged and productive workforce by facilitating real-time collaboration and feedback. The rise of IoT connectivity allows interactive displays to seamlessly connect with other smart devices, creating a cohesive network for data sharing and collaborative interaction. This trend is especially prevalent in smart classrooms, workplaces, and retail spaces, where displays can interact with sensors, mobile devices, and cloud-based platforms to deliver dynamic, context-driven experiences. The adoption of these technologies is driving market growth by elevating user satisfaction, offering convenience, and enabling intelligent ecosystems that cater to specific user needs.

Growing Demand for Ultra-High-Definition (UHD) and OLED Displays 

The demand for high-resolution display technologies, such as Ultra-High-Definition (UHD) and Organic Light-Emitting Diode (OLED) panels, is transforming the interactive display market. These advanced display technologies provide enhanced color accuracy, sharper image clarity, and improved viewing angles, leading to more immersive and engaging user experiences.For instance, in design studios, professionals are adopting UHD displays for their superior color accuracy and image clarity, which are crucial for detailed design work. This technology allows designers to visualize their projects more accurately, ultimately leading to higher quality outputs. Additionally, healthcare facilities are utilizing OLED displays for patient monitoring systems. These displays provide clear visuals of patient data, ensuring that healthcare providers can make informed decisions quickly. The adoption of such high-quality display technologies not only enhances the functionality of healthcare tools but also improves patient care by facilitating better communication of vital information.Educational institutions, corporate offices, and commercial spaces are adopting UHD and OLED interactive displays to support visually intensive applications such as design collaboration, multimedia presentations, and immersive learning experiences. Additionally, these high-end displays offer energy efficiency, longer lifespans, and sleek form factors, making them highly attractive for diverse applications. As the cost of UHD and OLED panels continues to decrease, their adoption is becoming increasingly accessible, driving widespread market penetration and elevating the quality of interactive display offerings globally.

Market Restraints and Challenges

High Initial Costs and Budget Constraints 

The high initial cost of acquiring and implementing interactive displays remains a significant barrier for many potential users, especially small and medium-sized enterprises (SMEs) and educational institutions in developing regions. Advanced interactive displays often require substantial investments not only in hardware but also in associated infrastructure, software, installation, and maintenance. Budget limitations and concerns about the return on investment (ROI) can lead organizations to delay or reconsider adopting these technologies. This challenge is particularly relevant in price-sensitive markets where affordability plays a critical role in technology adoption. Additionally, the rapid pace of technological advancements means that organizations may hesitate to invest, fearing obsolescence or the need for frequent upgrades. These financial considerations present a significant challenge to market expansion and widespread adoption.

Complex Integration and Limited Technical Expertise 

The successful implementation of interactive displays often involves integrating with existing systems, which can be complex and challenging for many organizations. Compatibility issues, network integration, and the need for specialized software can complicate deployment, making it difficult for some businesses to seamlessly adopt interactive display solutions. Furthermore, the lack of skilled professionals with expertise in configuring, maintaining, and optimizing interactive display systems poses an additional challenge. Without adequate support, organizations may face operational inefficiencies, technical glitches, and limited utilization of these systems’ full potential. This issue is particularly evident in regions with limited access to skilled IT personnel and technical support services, hampering market growth and adoption. As a result, addressing integration challenges and building technical expertise will be essential for overcoming this market restraint and ensuring a smoother transition to interactive display technologies.

Market Segmentation Analysis

By Display Type

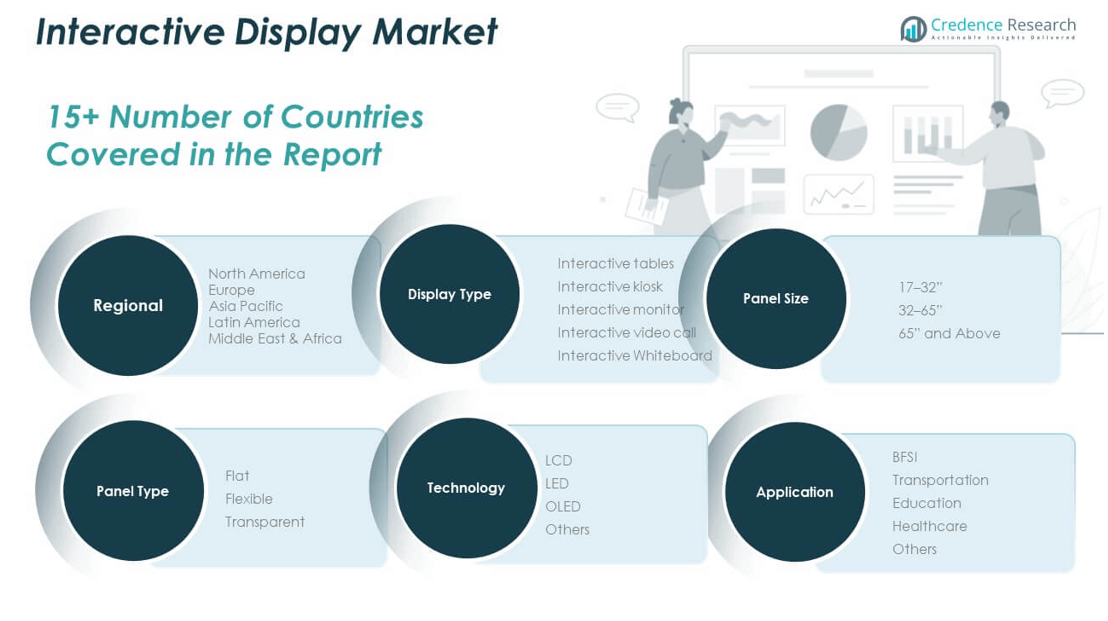
The interactive display market encompasses various display types, each serving distinct purposes across different sectors. Interactive kiosks play a crucial role in retail, transportation, and hospitality, offering self-service solutions, enhancing customer engagement, and optimizing operations through features like interactive catalog browsing, ticketing, and personalized promotions. Interactive video walls, widely adopted in corporate lobbies, public spaces, and command centers, provide impactful visual content, real-time data visualization, and immersive experiences that facilitate branding and multi-user interaction. Interactive tables are popular in educational and corporate settings, enabling collaborative activities, group learning, and brainstorming through multitasking touch surfaces, while also enhancing hospitality and entertainment experiences. Interactive monitors are versatile tools utilized across corporate offices, educational environments, and healthcare facilities, offering seamless integration with collaborative software for effective presentations, video conferencing, and training. Finally, interactive whiteboards remain a key component in education, fostering student engagement and interactive learning, and are also leveraged for team collaboration and strategic planning in corporate environments.

By Application

Interactive displays are transforming various sectors by enhancing engagement, productivity, and user experiences. In retail, they offer personalized promotions, product demonstrations, and seamless self-service options, while the hospitality sector benefits from self-check-ins, personalized room controls, and digital concierge services, boosting guest satisfaction. Healthcare facilities use them for patient engagement, diagnostics, training, and administrative tasks, improving care delivery. Transportation applications include ticketing, wayfinding, and real-time updates, enhancing passenger convenience. In the BFSI sector, interactive displays optimize service delivery through self-service banking, customer education, and personalized interactions. Corporations utilize them for video conferencing, digital presentations, and collaborative workspaces, improving communication and productivity. The entertainment industry leverages displays for gaming, immersive experiences, and engaging content. Education institutions use interactive displays to enrich teaching methodologies, boost student engagement, and promote collaborative learning. Additionally, other applications span government, museums, and public sector projects, where displays facilitate public information dissemination, exhibitions, and smart city initiatives.

Segments

Based on Display Type

  • Interactive Kiosk
  • Interactive Video Wall
  • Interactive Table
  • Interactive Monitor
  • Interactive Whiteboard

Based on Application

  • Retail
  • Hospitality
  • Healthcare
  • Transportation
  • BFSI
  • Corporate
  • Entertainment
  • Education
  • Others

Based on Region

  • North America
    • S.
    • Canada
  • Europe
    • K.
    • Germany
    • France
  • Asia Pacific
    • China
    • India
    • Japan
  • Latin America
    • Brazil
    • Mexico
  • Middle East & Africa

Regional Analysis

North America (35%) 

North America holds the largest market share in the interactive display market, accounting for approximately 35%. The region’s growth is fueled by the high adoption of advanced technologies across sectors such as education, corporate, and retail. The United States leads this market with strong demand for interactive displays in smart classrooms, corporate meeting rooms, and retail spaces. North American enterprises are embracing digital transformation initiatives, which, combined with substantial investments in smart infrastructure, contribute to market expansion. The presence of major industry players and a tech-savvy population further support growth, fostering continuous innovation and integration of interactive solutions.

Europe (27%) 

Europe represents around 27% of the market share, driven by increasing adoption in education, corporate, and public infrastructure projects. Countries like Germany, the United Kingdom, and France are major contributors to market growth due to government initiatives promoting digital learning, smart city projects, and advanced healthcare infrastructure. Interactive whiteboards, kiosks, and video walls are widely used in public and private sectors to enhance collaboration, improve customer experiences, and optimize service delivery. The European market emphasizes user engagement and sustainability, encouraging the adoption of energy-efficient and eco-friendly display technologies.

Key players

  • Box Light Corporation
  • eyefactive GmbH
  • HORIZON DISPLAY INC.
  • IDEUM
  • LG Display Co.
  • Marvel Technology (China) Co., Ltd.
  • MMT GmbH & Co. KG.
  • Panasonic Corporation
  • SHARP CORPORATION
  • TableConnect

Competitive Analysis

The interactive display market is marked by intense competition, with key players focusing on innovation, product differentiation, and strategic partnerships to strengthen their market positions. Leading companies such as LG Display Co., Panasonic Corporation, and SHARP CORPORATION leverage their established brand presence, extensive R&D capabilities, and global reach to introduce cutting-edge display technologies tailored to diverse sectors. Companies like Box Light Corporation and IDEUM are recognized for their specialized solutions targeting education and interactive environments. Players such as eyefactive GmbH and MMT GmbH & Co. KG. emphasize custom-made interactive solutions, meeting niche demands and enhancing user engagement. Emerging competitors, including Marvel Technology and TableConnect, provide cost-effective and innovative interactive display solutions, particularly for smaller markets. The competitive landscape reflects a blend of established and emerging players striving to capture market share through innovation, strategic expansion, and partnerships.

Recent Developments

  • In November 2024, Boxlight launched the new **IMPACT Max 2 interactive panel**, featuring upgraded storage, access to Google Chrome, and an exclusive chipset for enhanced performance. This product aims to provide a faster and more intuitive display experience for educational and corporate environments.
  • In October 2024, eyefactive announced the launch of their latest **interactive display software**, which integrates augmented reality features to enhance user engagement in retail and educational settings. This software update allows users to create interactive content that responds to touch and gestures.
  • In September 2024, HORIZON DISPLAY INC. introduced a new line of **modular interactive displays** designed for collaborative environments. These displays can be customized with various modules for different functionalities, catering to diverse user needs in corporate and educational spaces.
  • In August 2024, IDEUM launched an upgraded version of their **multitouch tables**, featuring enhanced processing power and improved graphics capabilities. This new version is aimed at museums and educational institutions, providing more immersive interactive experiences.
  • In July 2024, LG Display unveiled its latest **OLED interactive displays**, which boast improved color accuracy and energy efficiency. These displays are targeted at high-end retail environments, offering vibrant visuals that enhance product presentations.
  • In June 2024, Marvel Technology announced the release of a new series of **interactive flat panels** equipped with AI-driven features for smart classrooms. These panels are designed to facilitate personalized learning experiences by adapting content based on student interactions.
  • In May 2024, MMT launched a new range of **interactive whiteboards** that incorporate advanced gesture recognition technology. This innovation allows for more intuitive interaction during presentations and collaborative sessions in educational institutions.
  • In April 2024, Panasonic introduced its latest **interactive display solutions** tailored for corporate environments, featuring enhanced connectivity options and collaboration tools to support hybrid work models.
  • In March 2024, SHARP launched a new line of **4K interactive displays**, designed specifically for educational purposes. These displays include features such as built-in lesson planning tools and cloud connectivity for easy content sharing.
  • In February 2024, TableConnect announced the launch of its innovative **interactive tabletop displays**, which allow multiple users to interact simultaneously with digital content in a shared space. This product is aimed at restaurants and collaborative work environments.

Market Concentration and Characteristics 

The interactive display market is moderately fragmented, with a mix of established global players and emerging regional companies competing for market share. Key characteristics of this market include rapid technological innovation, high customization potential, and a strong emphasis on enhancing user engagement through advanced features like touchscreens, AI integration, and connectivity with IoT devices. Companies are focused on differentiating themselves by offering solutions tailored to specific sectors such as education, corporate, retail, and healthcare, creating diverse applications for interactive displays. Strategic partnerships, product innovations, and expanding geographic reach are common strategies used to gain competitive advantage, while market concentration varies across regions, with major players dominating North America and Europe, and emerging local companies gaining traction in Asia-Pacific and other developing markets.

Shape Your Report to Specific Countries or Regions & Enjoy 30% Off!

Report Coverage

The research report offers an in-depth analysis based on Display Type, Application and Region. It details leading market players, providing an overview of their business, product offerings, investments, revenue streams, and key applications. Additionally, the report includes insights into the competitive environment, SWOT analysis, current market trends, as well as the primary drivers and constraints. Furthermore, it discusses various factors that have driven market expansion in recent years. The report also explores market dynamics, regulatory scenarios, and technological advancements that are shaping the industry. It assesses the impact of external factors and global economic changes on market growth. Lastly, it provides strategic recommendations for new entrants and established companies to navigate the complexities of the market.

Future Outlook

  1. The continued growth of smart city projects worldwide will drive demand for interactive displays in public spaces, enhancing connectivity and user engagement.
  2. AI-powered interactive displays will gain prominence, offering personalized experiences, adaptive learning solutions, and predictive analytics to improve user interactions.
  3. Increasing adoption of digital learning solutions will propel the demand for interactive whiteboards and flat panels, transforming educational methodologies across institutions.
  4. Innovations in OLED, UHD, and energy-efficient displays will lead to better image quality, durability, and performance, enhancing the market appeal of interactive displays.
  5. Retailers will continue leveraging interactive displays for personalized marketing, self-service kiosks, and immersive product demonstrations, driving customer engagement.
  6. With remote and hybrid work models becoming standard, interactive displays will play a critical role in enhancing virtual meetings, collaboration, and team productivity.
  7. Healthcare facilities will increasingly use interactive displays for patient engagement, real-time diagnostics, and training, optimizing care delivery and operational efficiency.
  8. Emerging markets, particularly in Asia-Pacific, Latin America, and Africa, will witness higher adoption driven by investments in smart infrastructure and digital transformation.
  9. The integration of interactive displays with IoT networks will enable seamless connectivity and data exchange, enhancing the functionality of smart homes, offices, and public spaces.
  10. Manufacturers will focus on developing customized solutions tailored to specific industry needs, including hospitality, BFSI, and entertainment, driving market differentiation and growth.

1. Introduction
1.1. Report Description
1.2. Purpose of the Report
1.3. USP & Key Offerings
1.4. Key Benefits for Stakeholders
1.5. Target Audience
1.6. Report Scope
1.7. Regional Scope
2. Scope and Methodology
2.1. Objectives of the Study
2.2. Stakeholders
2.3. Data Sources
2.3.1. Primary Sources
2.3.2. Secondary Sources
2.4. Market Estimation
2.4.1. Bottom-Up Approach
2.4.2. Top-Down Approach
2.5. Forecasting Methodology
3. Executive Summary
4. Introduction
4.1. Overview
4.2. Key Industry Trends
5. Global Interactive Display Market
5.1. Market Overview
5.2. Market Performance
5.3. Impact of COVID-19
5.4. Market Forecast
6. Market Breakup by Display Type
6.1. Interactive Kiosk
6.1.1. Market Trends
6.1.2. Market Forecast
6.1.3. Revenue Share
6.1.4. Revenue Growth Opportunity
6.2. Interactive Video Wall
6.2.1. Market Trends
6.2.2. Market Forecast
6.2.3. Revenue Share
6.2.4. Revenue Growth Opportunity
6.3. Interactive Table
6.3.1. Market Trends
6.3.2. Market Forecast
6.3.3. Revenue Share
6.3.4. Revenue Growth Opportunity
6.4. Interactive Monitor
6.4.1. Market Trends
6.4.2. Market Forecast
6.4.3. Revenue Share
6.4.4. Revenue Growth Opportunity
6.5. Interactive Whiteboard
6.5.1. Market Trends
6.5.2. Market Forecast
6.5.3. Revenue Share
6.5.4. Revenue Growth Opportunity
7. Market Breakup by Application
7.1. Retail
7.1.1. Market Trends
7.1.2. Market Forecast
7.1.3. Revenue Share
7.1.4. Revenue Growth Opportunity
7.2. Hospitality
7.2.1. Market Trends
7.2.2. Market Forecast
7.2.3. Revenue Share
7.2.4. Revenue Growth Opportunity
7.3. Healthcare
7.3.1. Market Trends
7.3.2. Market Forecast
7.3.3. Revenue Share
7.3.4. Revenue Growth Opportunity
7.4. Transportation
7.4.1. Market Trends
7.4.2. Market Forecast
7.4.3. Revenue Share
7.4.4. Revenue Growth Opportunity
7.5. BFSI
7.5.1. Market Trends
7.5.2. Market Forecast
7.5.3. Revenue Share
7.5.4. Revenue Growth Opportunity
7.6. Corporate
7.6.1. Market Trends
7.6.2. Market Forecast
7.6.3. Revenue Share
7.6.4. Revenue Growth Opportunity
7.7. Entertainment
7.7.1. Market Trends
7.7.2. Market Forecast
7.7.3. Revenue Share
7.7.4. Revenue Growth Opportunity
7.8. Education
7.8.1. Market Trends
7.8.2. Market Forecast
7.8.3. Revenue Share
7.8.4. Revenue Growth Opportunity
7.9. Others
7.9.1. Market Trends
7.9.2. Market Forecast
7.9.3. Revenue Share
7.9.4. Revenue Growth Opportunity
8. Market Breakup by Region
8.1. North America
8.1.1. United States
8.1.1.1. Market Trends
8.1.1.2. Market Forecast
8.1.2. Canada
8.1.2.1. Market Trends
8.1.2.2. Market Forecast
8.2. Europe
8.2.1. Germany
8.2.2. United Kingdom
8.2.3. France
8.2.4. Italy
8.2.5. Spain
8.2.6. Others
8.3. Asia-Pacific
8.3.1. China
8.3.2. Japan
8.3.3. India
8.3.4. South Korea
8.3.5. Australia
8.3.6. Others
8.4. Latin America
8.4.1. Brazil
8.4.2. Mexico
8.4.3. Others
8.5. Middle East and Africa
8.5.1. Market Trends
8.5.2. Market Breakup by Country
8.5.3. Market Forecast

9. Competitive Landscape
9.1. Market Structure
9.2. Key Players
9.3. Profiles of Key Players
9.3.1. Box Light Corporation
9.3.1.1. Company Overview
9.3.1.2. Product Portfolio
9.3.1.3. Financials
9.3.1.4. SWOT Analysis
9.3.2. eyefactive GmbH
9.3.3. HORIZON DISPLAY INC.
9.3.4. IDEUM
9.3.5. LG Display Co.
9.3.6. Marvel Technology (China) Co., Ltd
9.3.7. MMT GmbH & Co. KG
9.3.8. Panasonic Corporation
9.3.9. SHARP CORPORATION
9.3.10. TableConnect

10. Research Methodology

 Frequently Asked Question:

What is the market size of the interactive display market in 2023 and 2032, and what is the expected CAGR?

The market is projected to grow from USD 45,305 million in 2023 to an estimated USD 81,101.6 million by 2032, with a CAGR of 7.55% from 2024 to 2032.

What are the main drivers of growth for the interactive display market?

The market growth is driven by the increasing adoption of interactive displays in education, corporate offices, and commercial spaces, as well as the rising demand for user-friendly and advanced display technologies.

How is artificial intelligence (AI) shaping the interactive display market?

The integration of AI with interactive displays enables personalized experiences, predictive analytics, and smart interactions, driving increased adoption across various sectors.

Which geographical regions lead the interactive display market?

North America holds a major share due to the high adoption rate of advanced technologies, while Asia-Pacific is expected to experience robust growth fueled by investments in smart infrastructure.

Who are the key players in the interactive display market?

Leading players include Samsung Electronics Co., Ltd., LG Display Co., Ltd., NEC Corporation, Panasonic Corporation, and Sharp Corporation, focusing on innovation, partnerships, and market expansion.

Interactive Wound Dressing Market

Published:
Report ID: 62904

Interactive And Self-Service Kiosk Market

Published:
Report ID: 6956

Interactive Tables Market

Published:
Report ID: 38116

Interactive Whiteboards Market

Published:
Report ID: 6974

Video Wall Market

Published:
Report ID: 12071

Visualization And 3D Rendering Software Market

Published:
Report ID: 11469

Virtual Fitting Room Market

Published:
Report ID: 11350

Social TV Market

Published:
Report ID: 10451

E Textiles Market

Published:
Report ID: 61960

Account Based Direct Mail Software Market

Published:
Report ID: 64517

Saudi Arabia Data Center Cooling Market

Published:
Report ID: 64503

Kuwait Data Center Cooling Market

Published:
Report ID: 64500

Biometric Driver Identification System market

Published:
Report ID: 64466

Artificial Intelligence (AI) Market

Published:
Report ID: 64108

LED Video Walls Market

Published:
Report ID: 12216

Biometrics Technology Market

Published:
Report ID: 1464

Air Transport MRO Market

Published:
Report ID: 1191

Air Separation Plant Market

Published:
Report ID: 1279

Asset Tracking And Inventory Management Solutions Market

Published:
Report ID: 2327

Architectural Services Market

Published:
Report ID: 54588

Advanced Cinema Projector Market

Published:
Report ID: 1576

Purchase Options

The report comes as a view-only PDF document, optimized for individual clients. This version is recommended for personal digital use and does not allow printing.
$4699

To meet the needs of modern corporate teams, our report comes in two formats: a printable PDF and a data-rich Excel sheet. This package is optimized for internal analysis and multi-location access, making it an excellent choice for organizations with distributed workforce.
$5699

The report will be delivered in printable PDF format along with the report’s data Excel sheet. This license offers 100 Free Analyst hours where the client can utilize Credence Research Inc.’s research team. It is highly recommended for organizations seeking to execute short, customized research projects related to the scope of the purchased report.
$7699

Smallform of Sample request

Have a question?

User Profile

Don’t settle for less – trust Mitul to help you find the best solution.

Report delivery within 24 to 48 hours

– Other Info –

What people say?-

User Review

I am very impressed with the information in this report. The author clearly did their research when they came up with this product and it has already given me a lot of ideas.

Jana Schmidt
CEDAR CX Technologies

– Connect with us –

Phone

+91 6232 49 3207


support

24/7 Research Support


sales@credenceresearch.com

– Research Methodology –

Going beyond the basics: advanced techniques in research methodology

– Trusted By –

Pepshi, LG, Nestle
Motorola, Honeywell, Johnson and johnson
LG Chem, SIEMENS, Pfizer
Unilever, Samsonite, QIAGEN