Market Overview
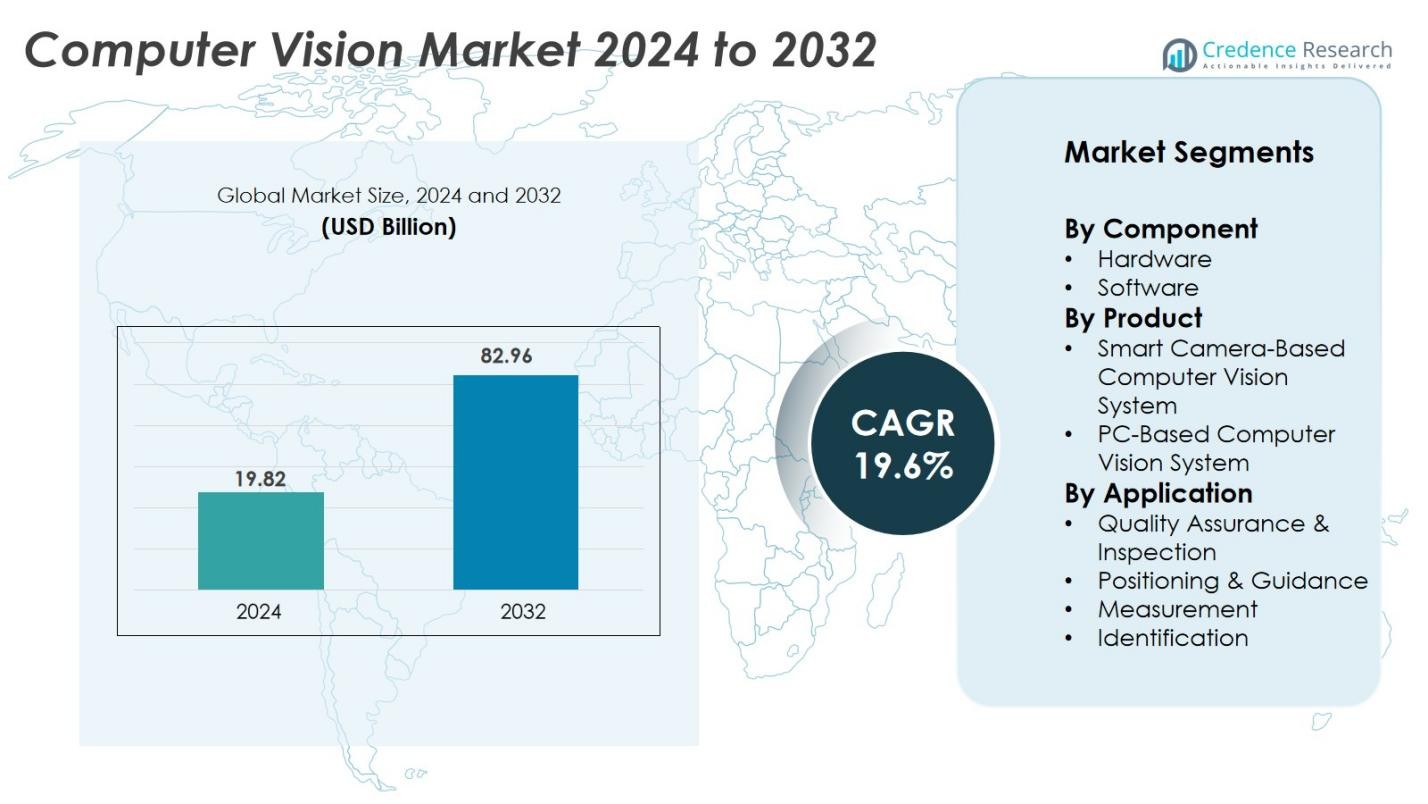
The Computer Vision market was valued at USD 19.82 billion in 2024 and is expected to reach USD 82.96 billion by 2032, growing at a CAGR of 19.6% during the forecast period.
| REPORT ATTRIBUTE |
DETAILS |
| Historical Period |
2020-2023 |
| Base Year |
2024 |
| Forecast Period |
2025-2032 |
| Computer Vision market Size 2024 |
USD 19.82 Billion |
| Computer Vision market , CAGR |
19.6% |
| Computer Vision market Size 2032 |
USD 82.96 Billion |
The Computer Vision market is shaped by leading players including Amazon Web Services, Cognex Corporation, Basler AG, Intel Corporation, Microsoft, NVIDIA Corporation, Qualcomm Technologies, Omron Corporation, Teledyne Vision Solutions, and Google. These companies compete through advanced AI processors, smart cameras, cloud-based vision platforms, and industry-specific inspection systems. Their solutions support automation, robotic guidance, healthcare imaging, and autonomous mobility. North America remains the leading region with a 41% market share, driven by strong investment in industrial automation, autonomous vehicles, medical imaging, and retail analytics. High R&D spending and early commercial adoption help global players expand their reach across manufacturing and enterprise applications.
Access crucial information at unmatched prices!
Request your sample report today & start making informed decisions powered by Credence Research Inc.!
Download Sample
Market Insights
- The Computer Vision market was valued at USD 19.82 billion in 2024 and is projected to reach USD 82.96 billion by 2032, growing at a CAGR of 19.6%.
- Rising automation in manufacturing drives adoption, as companies use smart cameras and AI analytics for faster inspection, defect detection, and production accuracy.
- A key trend is the shift toward edge AI systems that process images locally, reducing latency and improving real-time decision-making in factories, retail stores, and autonomous vehicles.
- Major players such as NVIDIA, Intel, Cognex, and Amazon Web Services expand their competitive position through advanced processors, machine-vision cameras, and scalable cloud platforms. However, high deployment costs and integration challenges limit adoption among small industries.
- North America leads the market with a 41% share, followed by Europe at 28% and Asia-Pacific at 26%. The hardware segment dominates with a 62% share due to growing demand for sensors, processors, and smart cameras across automation and robotics.
Market Segmentation Analysis:
By Component
The hardware segment holds the dominant share of the Computer Vision market with 62%, driven by rising demand for high-performance chips, sensors, and imaging devices in automation and industrial inspection. Companies invest in embedded processors, machine-vision cameras, and edge AI accelerators to improve speed and accuracy. Hardware adoption expands across automotive manufacturing, healthcare imaging, and robotics. The software segment grows steadily as deep-learning models and cloud-based vision platforms enable real-time analytics, predictive insights, and image recognition. Advancements in AI frameworks and neural networks further strengthen software-driven automation in enterprises.
- For instance, NVIDIA enables hardware-accelerated industrial inspection pipelines that automate defect detection in manufacturing, enhancing quality and throughput.
By Product
Smart camera-based computer vision systems account for the 58% share, making this the dominant product category. The growth comes from simplified installation, built-in processing, reduced wiring, and lower maintenance needs. Manufacturers favor smart cameras for defect detection, barcode reading, and robotic guidance in assembly lines. PC-based systems remain relevant for complex processing and multi-camera setups, especially in research and large manufacturing environments. However, they face higher system costs and integration challenges, which keeps smart camera systems ahead as industries lean toward flexible, compact, and scalable machine-vision solutions.
- For instance, Hanwha Vision introduced a Dual-Lens Barcode Reader Camera that combines barcode recognition and video capture in one device, significantly reducing installation and maintenance costs in logistics operations.
By Application
Quality assurance and inspection lead the market with a 42% share, as industries rely on automated defect detection, surface inspection, and dimensional accuracy checks to reduce product waste and improve consistency. Computer vision systems support 24/7 production monitoring in electronics, automotive, and food processing facilities. Positioning and guidance applications grow due to rising demand for autonomous robots and pick-and-place systems in logistics and warehousing. Measurement and identification also expand with barcode scanning, object counting, and 3D measurement. The push toward precision manufacturing and error-free production strengthens adoption across critical inspection tasks.
Key Growth Drivers
Rising Automation and Industrial Inspection Demand
Manufacturers use computer vision to automate quality checks, reduce defects, and improve productivity. Smart cameras and AI-driven sensors detect surface flaws, measure components, and verify assembly accuracy in real time. Automotive and electronics factories depend on vision-based systems to maintain zero-defect production and lower labor costs. Faster image processing and deep-learning software improve defect detection rates. Robotics and cobots integrate vision guidance for pick-and-place tasks, welding, packaging, and palletizing. As factories shift to Industry 4.0, companies invest in machine vision to support predictive maintenance, continuous monitoring, and digital twins.
- For instance, Keyence’s XG-X/CV-X Series employs advanced profile search and multi-point edge detection to automate the precise assembly of car bodies, such as windshield and door positioning, significantly reducing manual calibration time.
Expanding Use in Healthcare Imaging and Diagnostics
Hospitals and medical device makers rely on computer vision for imaging, diagnostics, and surgical guidance. AI-based systems analyze MRI, CT, and X-ray scans to detect tumors, fractures, and organ abnormalities with improved speed and precision. Clinicians gain faster diagnosis support, reducing workload during high patient volumes. Vision-enabled surgical robots assist with instrument navigation and real-time imaging. Medical labs use automated vision systems for blood sample inspection and slide analysis. Aging populations and chronic diseases drive demand for accurate imaging tools. These clinical benefits accelerate adoption across hospitals, diagnostic centers, and research labs.
- For instance, Zimmer Biomet’s ROSA robotic surgical assistant, cleared by the FDA in 2019, which aids knee replacement surgeries by integrating pre-, intra-, and post-operative data to improve precision and personalized care plans.
Growing Integration in Consumer Electronics and Retail
Smartphones, home security devices, and AR/VR systems use advanced vision processors for face unlock, gesture control, and object tracking. Vision chips support high-speed image capture, edge computing, and real-time scene recognition. Retailers adopt computer vision for automated checkouts, shelf monitoring, and inventory tracking. Smart stores reduce human errors and improve stock availability. E-commerce companies deploy vision systems in warehouses for parcel sorting and autonomous delivery. Wearable devices rely on vision-based sensing for health monitoring and motion tracking. These consumer and retail benefits expand commercial adoption and drive market growth.
Key Trends & Opportunities
Emergence of Edge AI-Based Vision Systems
Industries shift from cloud processing to edge-based computer vision to reduce latency and bandwidth load. Edge processors deliver instant decision-making in robotics, vehicles, and factory machines. Manufacturers use edge devices for real-time defect detection without network delays. Smart cameras embed neural accelerators and FPGA chips to handle inference locally. This trend helps factories operate in low-connectivity environments. Edge vision also improves privacy in hospitals, retail stores, and banks. As edge hardware becomes cheaper, adoption accelerates across industrial automation, surveillance, and smart mobility.
- For instance, Lattice Semiconductor showcased FPGA-powered smart cameras delivering low-power, high-performance edge AI suitable for continuous industrial monitoring.
Growth of Vision in Autonomous and Smart Mobility
Autonomous cars, drones, and delivery robots rely on computer vision for lane detection, traffic monitoring, object recognition, and obstacle avoidance. Automotive companies pair vision sensors with LiDAR and radar to improve safety. Smart mobility platforms use vision analytics for parking guidance, license-plate recognition, and public transport monitoring. Logistics firms deploy autonomous robots for warehouse navigation and package movement. Governments support smart transport projects to reduce congestion. These mobility applications create major opportunities for sensor makers, AI chip developers, and vision software vendors.
- For instance, Tesla’s Autopilot system employs computer vision to detect lanes, vehicles, and obstacles, enabling semi-autonomous driving with enhanced safety features.
Key Challenges
High Deployment Costs and Integration Complexity
Computer vision systems require advanced cameras, lighting, GPUs, and integration with factory equipment. Installation and calibration demand skilled expertise, raising project costs. Small manufacturers struggle to afford high-speed sensors and deep-learning hardware. Legacy factories need system upgrades and network restructuring. Integration becomes harder when environments involve dust, vibration, or variable lighting. Maintenance teams must retrain staff and adopt new workflows. These cost and skill constraints delay adoption in small and medium industries.
Data Privacy and Accuracy Limitations
Vision systems collect sensitive images in hospitals, banks, and retail stores, raising privacy concerns. Companies must enforce strict data storage and encryption to comply with regulations. Accuracy drops when systems face poor lighting, occlusions, or rapidly moving objects. AI models require large, diverse datasets for reliable detection. Errors in medical or industrial inspection can cause serious risks. Vendors continue improving model training and sensor quality to overcome these challenges.
Regional Analysis
North America
North America leads the Computer Vision market with a 41% share, supported by strong adoption in industrial automation, autonomous vehicles, healthcare imaging, and retail analytics. The U.S. hosts major AI and semiconductor developers that supply advanced processors, smart cameras, and cloud-based vision platforms. Automotive OEMs test vision-enabled driver-assistance and autonomous systems, while hospitals use AI imaging tools for diagnostics and surgical support. Retail chains deploy vision analytics for automated checkouts and inventory tracking. High R&D funding and early technology commercialization keep North America ahead in large-scale industrial, medical, and commercial deployments.
Europe
Europe holds a 28% market share, led by Germany, France, the UK, and Italy. Automotive factories in Germany and the Czech Republic integrate machine-vision systems for robotic welding, sensor-guided assembly, and automated inspection. Food and pharmaceutical producers use advanced cameras for quality control and packaging verification. Vision-enabled smart mobility projects expand across public transport, traffic management, and smart parking. Regulations promoting workplace safety and automation drive enterprise spending. Strong academic research and industrial robotics expertise also support continued innovation.
Asia-Pacific
Asia-Pacific accounts for a 26% share and remains the fastest-growing region as China, Japan, South Korea, and India expand AI-driven manufacturing. Electronics and semiconductor plants use high-precision camera systems for wafer inspection, component alignment, and defect mapping. Logistics hubs deploy vision-guided robots for warehouse automation and parcel handling. China advances smart city and autonomous vehicle projects, increasing demand for vision sensors and edge-AI modules. Expanding smartphone and consumer electronics production further boosts system adoption. Government investment in industrial modernization strengthens regional growth.
Latin America
Latin America holds a 3% market share, driven by gradual adoption of vision-based inspection and packaging automation in food, beverage, and automotive sectors. Brazil and Mexico lead deployments as factories replace manual quality checks with smart cameras and sensors. Retail chains explore computer vision for inventory tracking and self-checkout. Local adoption grows slower due to high integration costs, limited skilled labor, and dependence on imported hardware. However, rising manufacturing investments and e-commerce growth create long-term opportunities for automation providers.
Middle East & Africa
The Middle East & Africa region represents a 2% market share, with early adoption in oil and gas inspection, infrastructure monitoring, and security surveillance. The UAE and Saudi Arabia invest in smart city projects that use vision analytics for traffic control, public safety, and logistics automation. Hospitals begin applying AI-based diagnostic imaging, while retail companies test automated checkout systems. Although adoption remains limited by cost and technical workforce shortages, expanding digital transformation programs are expected to increase deployments in coming years.
Market Segmentations:
By Component
By Product
- Smart Camera-Based Computer Vision System
- PC-Based Computer Vision System
By Application
- Quality Assurance & Inspection
- Positioning & Guidance
- Measurement
- Identification
By Geography
- North America
- Europe
- Germany
- France
- U.K.
- Italy
- Spain
- Rest of Europe
- Asia Pacific
- China
- Japan
- India
- South Korea
- South-east Asia
- Rest of Asia Pacific
- Latin America
- Brazil
- Argentina
- Rest of Latin America
- Middle East & Africa
- GCC Countries
- South Africa
- Rest of the Middle East and Africa
Competitive Landscape
The competitive landscape of the Computer Vision market includes global technology leaders, chip manufacturers, camera suppliers, and AI software developers competing through product innovation, partnerships, and industry-specific solutions. Companies such as NVIDIA, Intel, Qualcomm, and Google drive the market with high-performance processors, AI frameworks, and edge-computing platforms designed for instant image analysis. Cognex, Basler, Omron, and Teledyne focus on machine-vision cameras, smart sensors, and industrial inspection systems used in electronics, automotive, and packaging plants. Cloud providers like AWS and Microsoft Azure offer scalable vision APIs for object detection, facial recognition, and retail analytics. Vendors expand through acquisitions, R&D investment, and integration with robotics, autonomous vehicles, and medical imaging tools. Custom solutions for warehouses, factories, and hospitals strengthen market reach as companies target faster processing speeds, low-latency analytics, and lower installation costs to stay competitive.
Shape Your Report to Specific Countries or Regions & Enjoy 30% Off!
Key Player Analysis
- Omron Corporation
- Cognex Corporation
- Qualcomm Technologies, Inc.
- Microsoft
- Basler AG
- Teledyne Vision Solutions
- Intel Corporation
- NVIDIA Corporation
- Amazon Web Services, Inc.
- Google
Recent Developments
- In August 2024, Zebra Technologies Corp., a mobile computing company, enhanced its Aurora machine vision software with advanced AI features, providing deep learning capabilities for complex visual inspection use cases.
- In May 2024, Aetina Corporation, an Edge AI solution provider, launched the AIP-KQ67 for computing and AI interference. This product is powered by Intel Corporation’s 13th/12th generation Core™ i9/i7/i5 processors and carries NVIDIA NCS certification.
- In April 2024, Cognex Corporation, a provider of industrial machine vision systems, introduced the In-Sight L38 3D Vision System, combining AI with 3D and 2D vision technologies to address various inspection and measurement tasks.
Report Coverage
The research report offers an in-depth analysis based on Component, Product, Application, and Geography. It details leading market players, providing an overview of their business, product offerings, investments, revenue streams, and key applications. Additionally, the report includes insights into the competitive environment, SWOT analysis, current market trends, as well as the primary drivers and constraints. Furthermore, it discusses various factors that have driven market expansion in recent years. The report also explores market dynamics, regulatory scenarios, and technological advancements that are shaping the industry. It assesses the impact of external factors and global economic changes on market growth. Lastly, it provides strategic recommendations for new entrants and established companies to navigate the complexities of the market.
Future Outlook
- Adoption of real-time vision analytics will increase across factories, hospitals, and retail sites.
- Edge-based vision systems will expand as industries demand faster processing and low-latency decisions.
- Vision-guided robots will grow in logistics, warehousing, and automated manufacturing lines.
- Autonomous vehicles and drones will accelerate demand for advanced object detection and navigation systems.
- Healthcare imaging will use AI-powered vision tools for diagnostics and surgical assistance.
- Smart cities will deploy vision systems for traffic monitoring, safety, and public infrastructure management.
- Retailers will increase usage of automated checkout, shelf tracking, and customer analytics.
- Vision processors and neural accelerators will become more energy-efficient and compact.
- Cloud platforms will support scalable vision APIs for enterprises and software developers.
- Integration with IoT and 5G networks will improve connectivity, speed, and real-time communication for vision deployments.



