Tap-to-pay and account systems replace magnetic cards
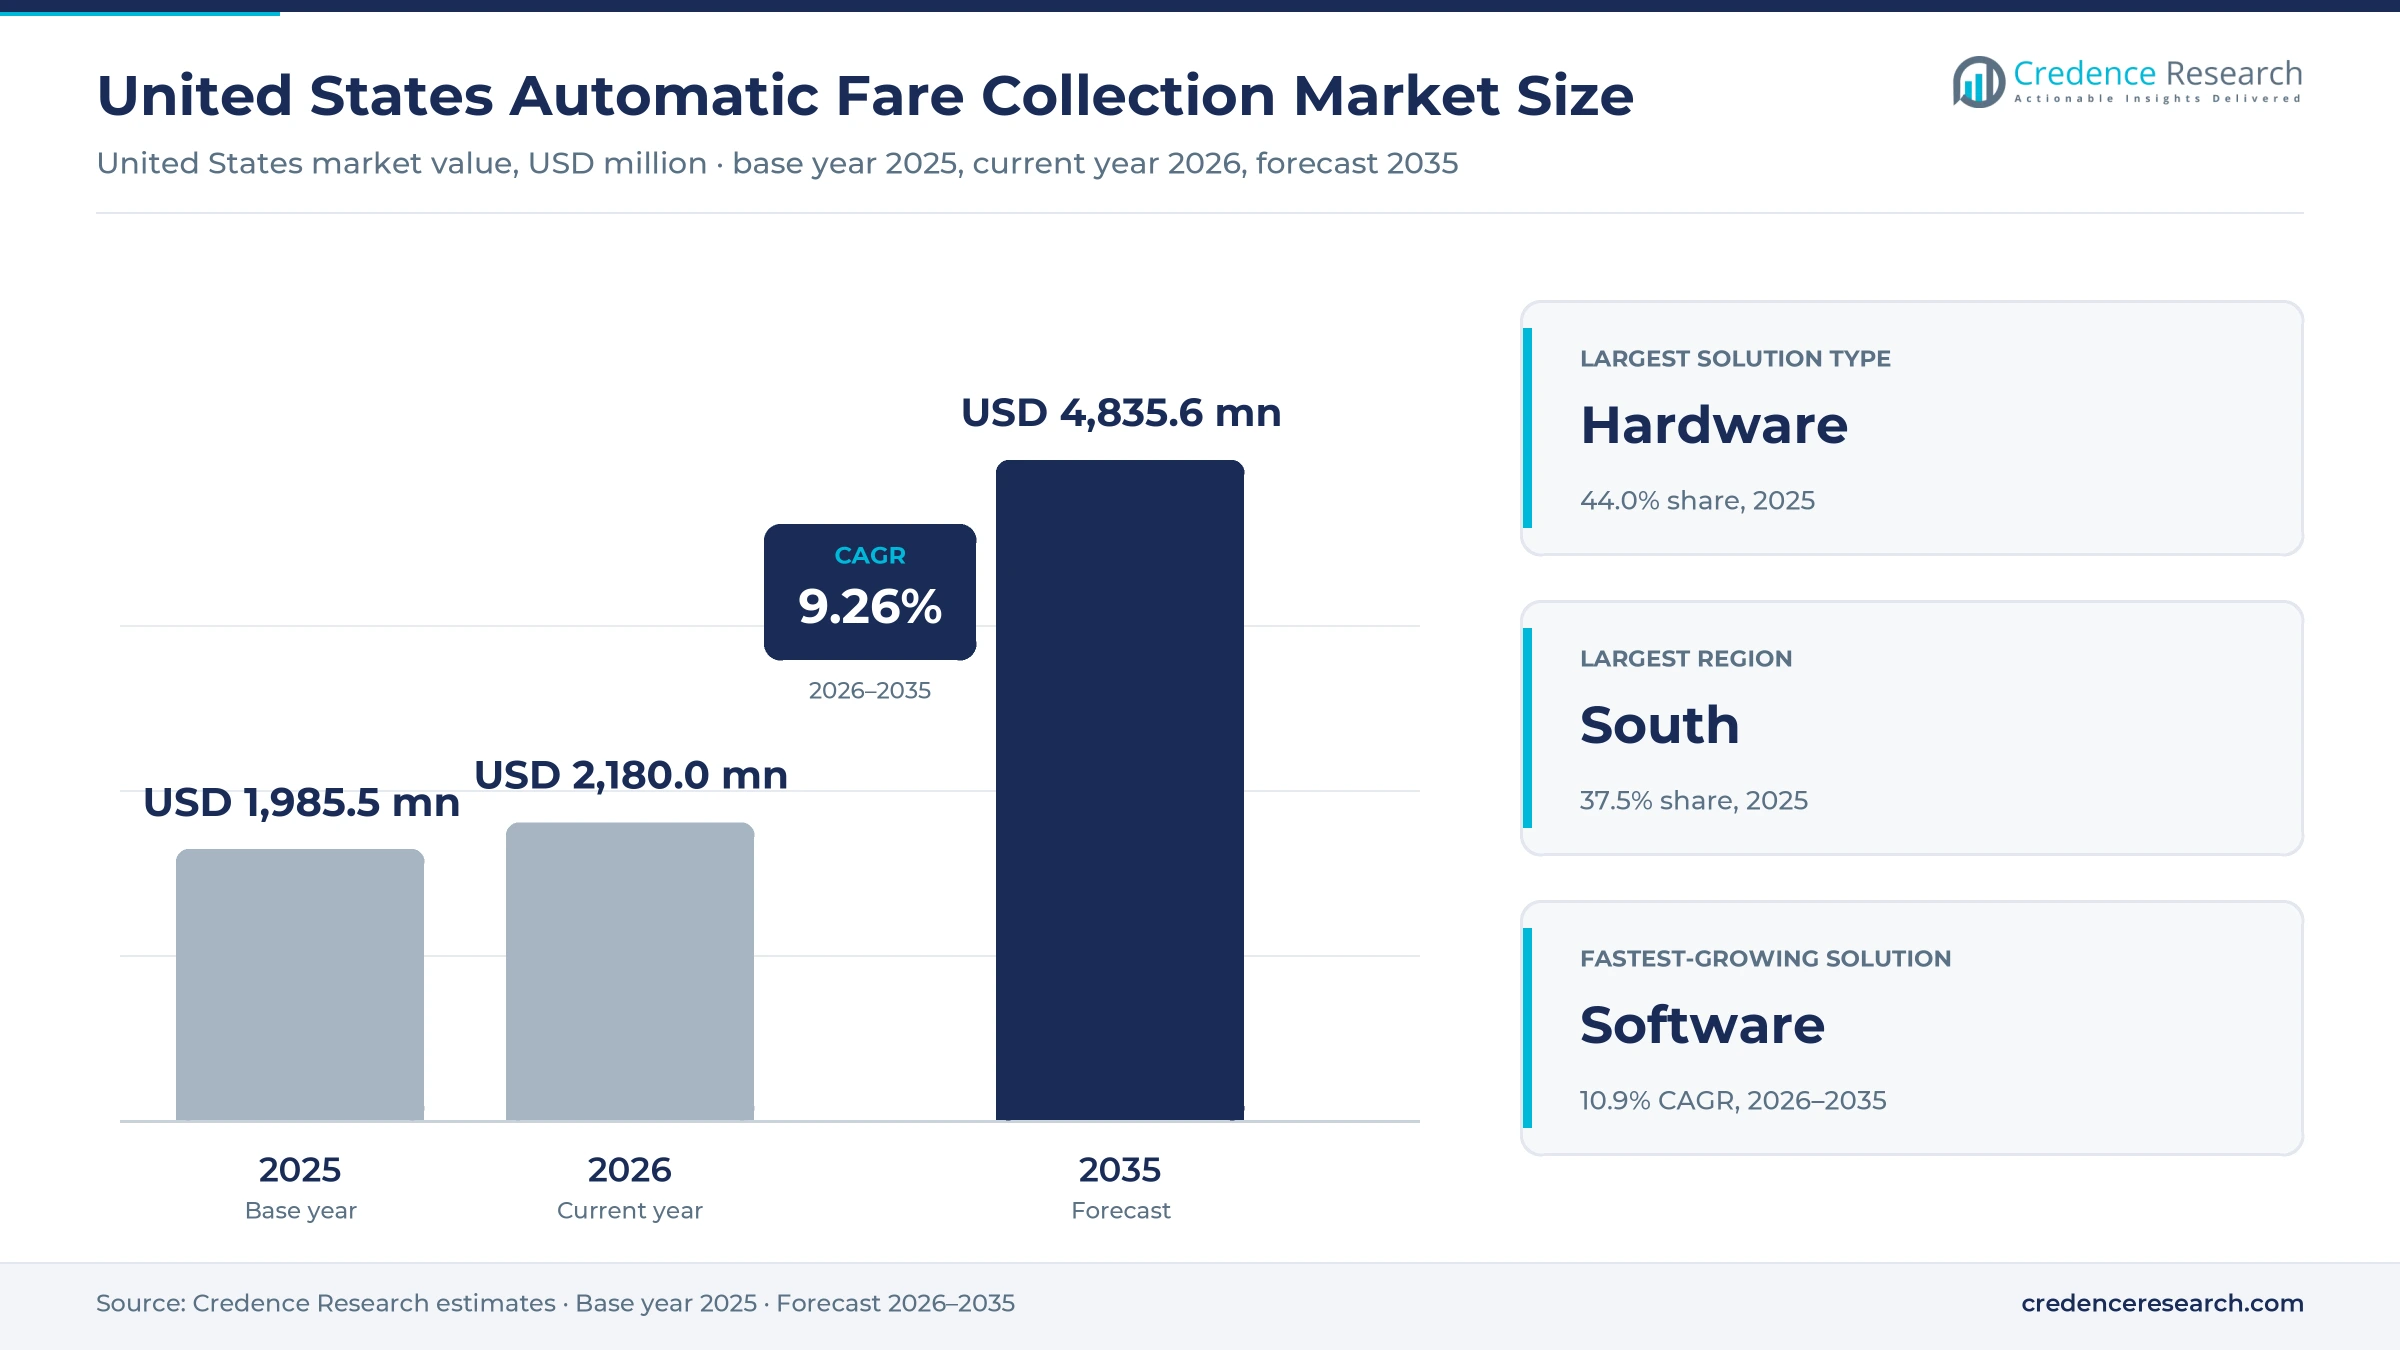
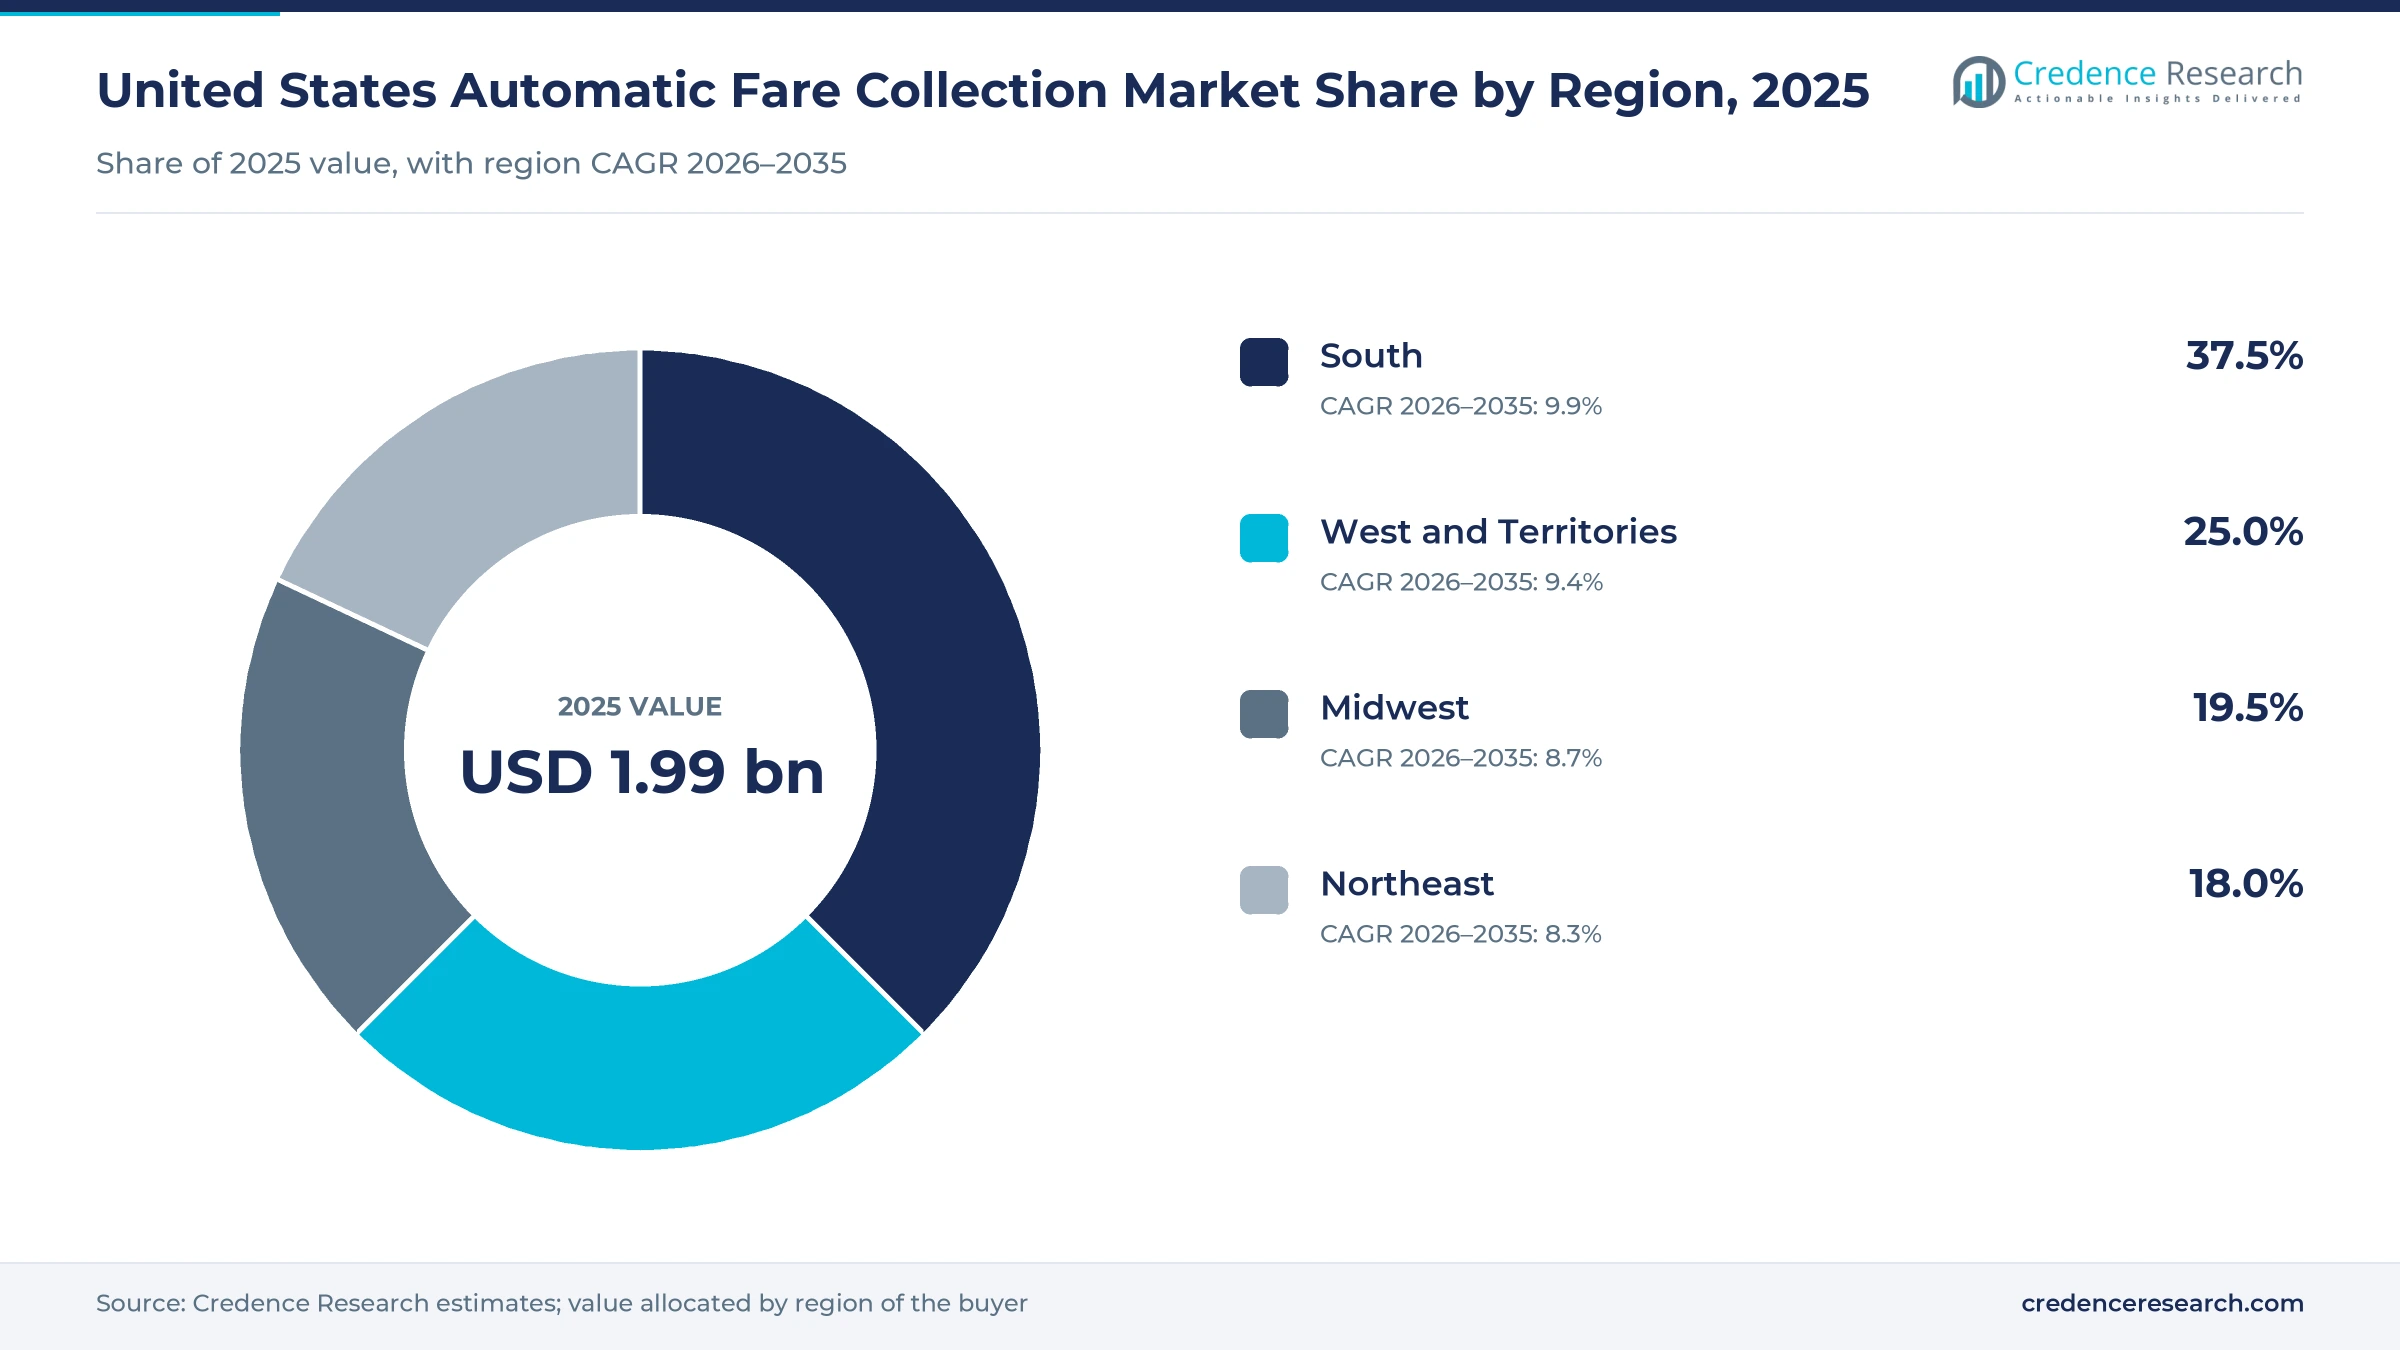
The United States automatic fare collection market was valued at USD 1.99 billion in 2025 and is projected to increase from USD 2.18 billion in 2026 to USD 4.84 billion by 2035, registering a CAGR of 9.26% during 2026–2035. Demand comes from transit authorities replacing magnetic and closed smart card systems with validators that accept bank cards and phones, back offices that cap fares across trips, and multiyear operating contracts with their suppliers. The South held the largest regional share, 37.5% in 2025, and is also the fastest-growing region at 9.9% a year, as agencies in Washington, Atlanta, Miami and Nashville replace fareboxes, gates and ticket machines. The West and Territories follow with 25.0%, led by Los Angeles, the Bay Area, Salt Lake City and San Juan. The main commercial change is that agencies increasingly buy fare software as a hosted service under long contracts, rather than owning every server and device outright.
Which equipment, software and services the U.S. figures include
The market covers fare collection systems bought by U.S. public transit authorities, contracted operators and university transit services, from bus fareboxes, rail fare gates, validators and ticket vending machines to account-based back offices, mobile ticketing, fare capping engines and the operations, maintenance and payment services billed under fare system contracts.
Fare revenue itself, road tolls, parking payment systems sold on their own, card network interchange and the transit vehicles and stations are excluded. The value chain runs from device makers and software developers to systems integrators, payment processors and the service crews that keep gates, machines and back offices running for 10 years or more.
United States Automatic Fare Collection Market Insights
- The automatic fare collection market grows from USD 1.99 billion in 2025 to USD 4.84 billion by 2035 at a 9.26% CAGR, as agencies replace magnetic and closed card systems with open payments.
- The South held 37.5% of 2025 value and grows fastest, with fare system programs in Washington, Atlanta, Miami and Nashville.
- Hardware led solution types with 44.0% of 2025 value, while software grows fastest at 10.9% a year as agencies add hosted back offices.
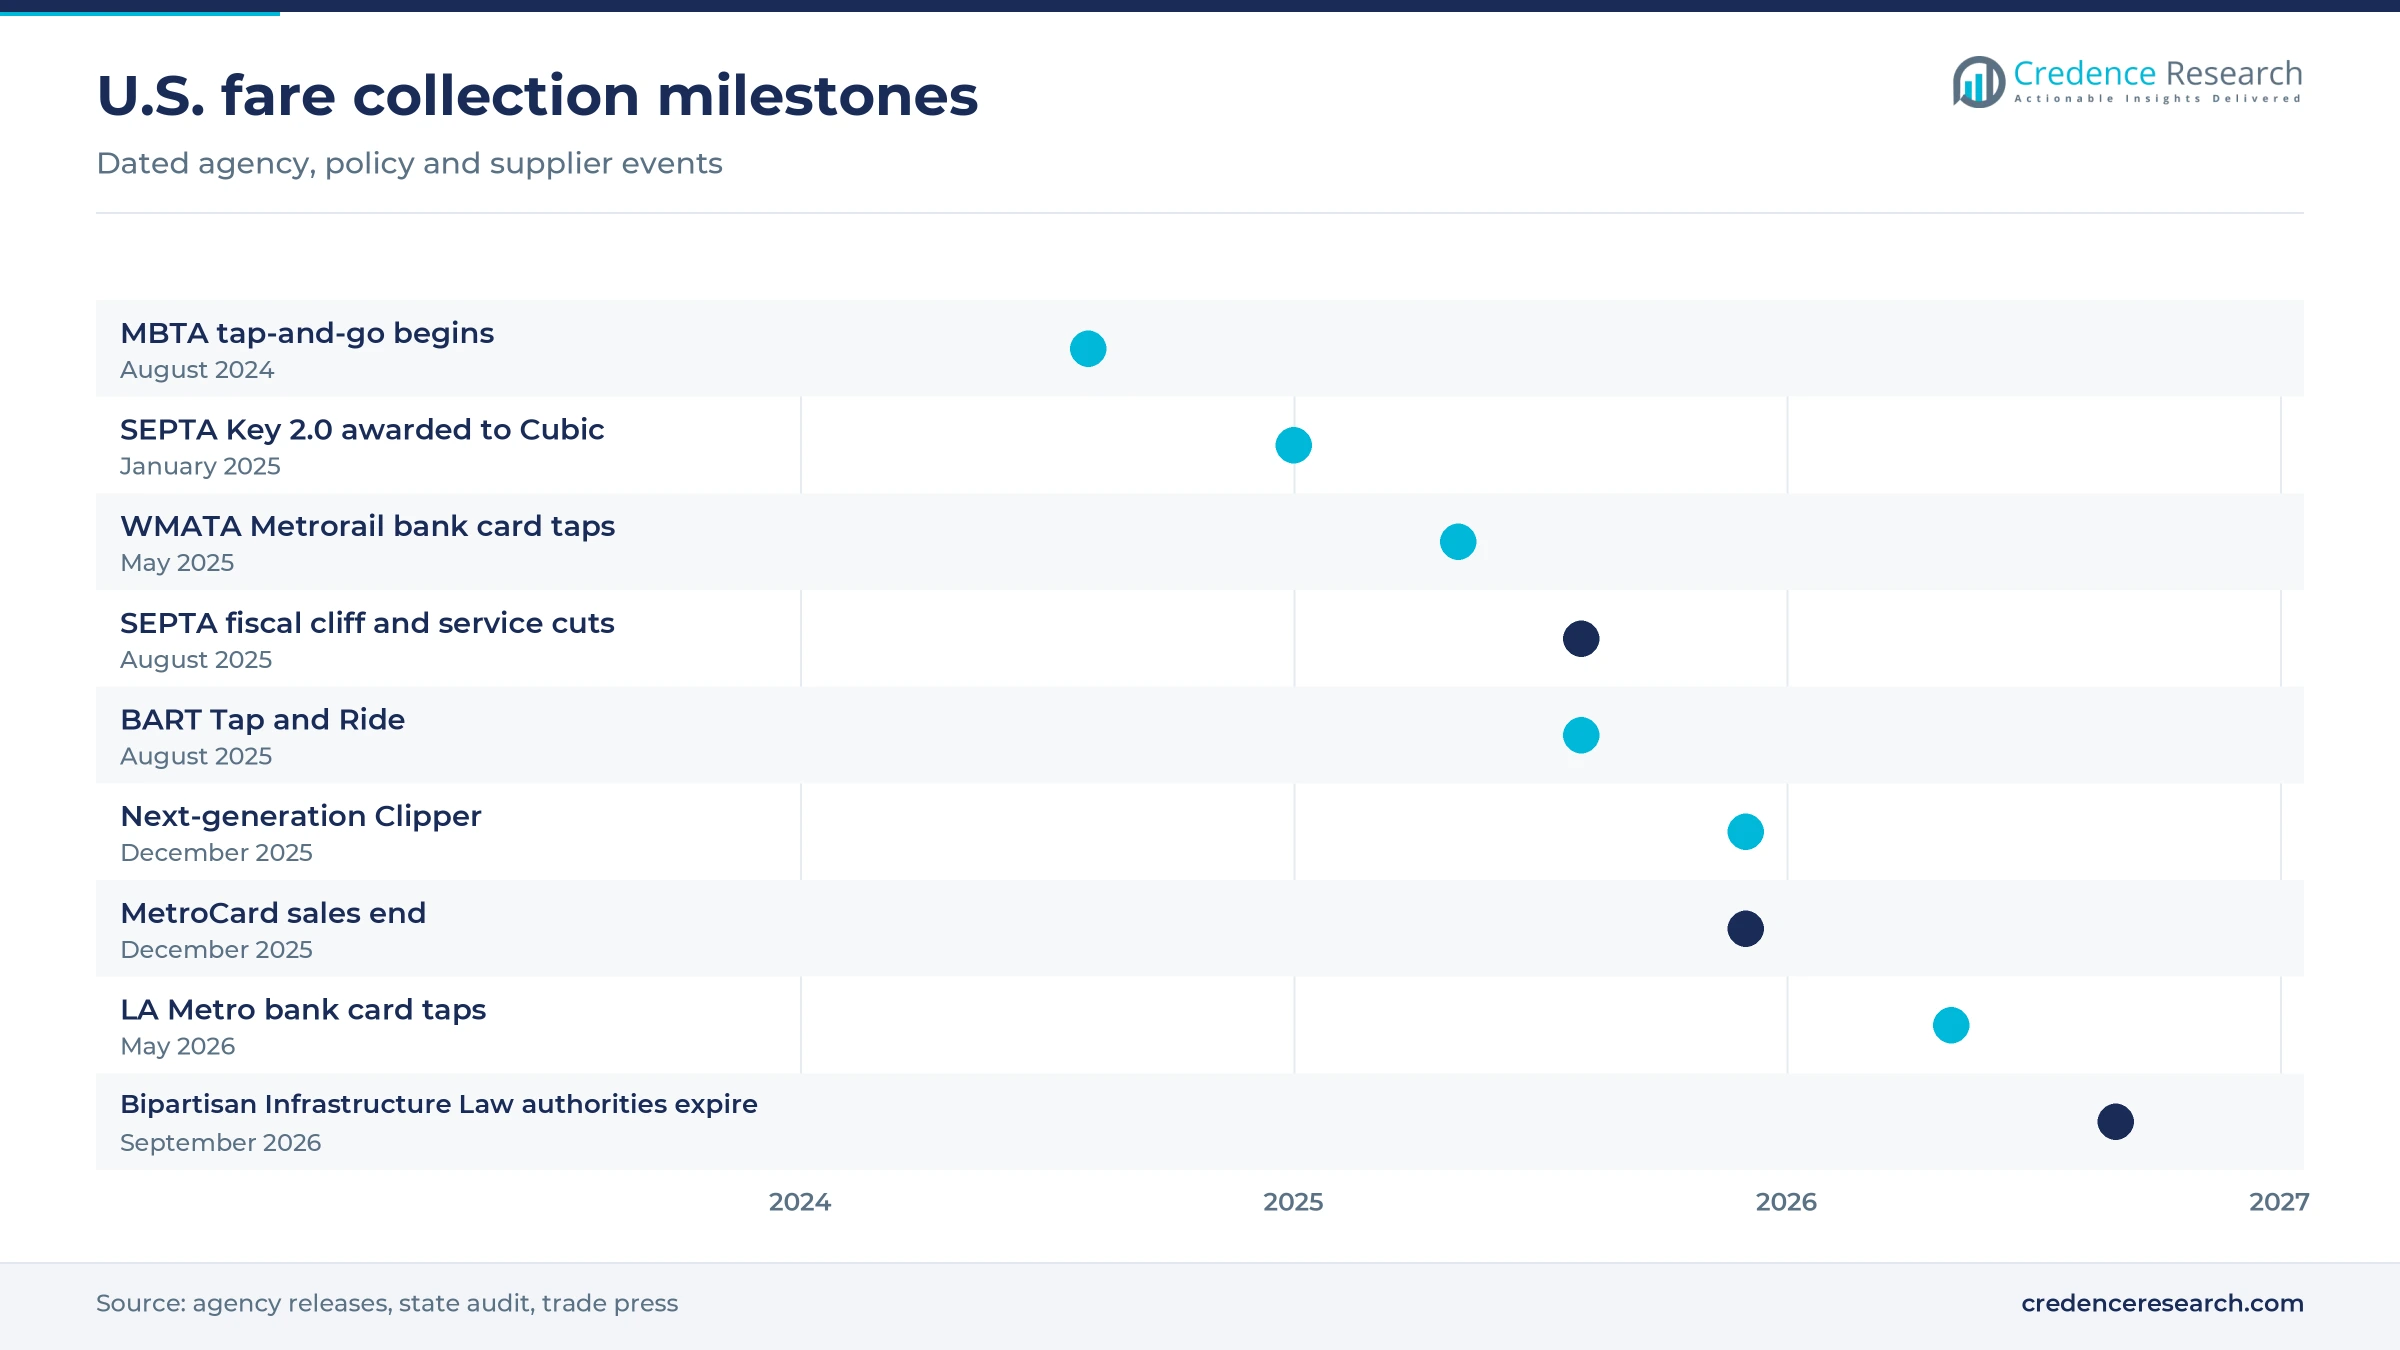
- The MTA ended MetroCard sales on Dec. 31, 2025, after tap-and-go reached 65% of riders, moving New York to a single tap-based fare method.
- Masabi won a Sourcewell cooperative contract in June 2026 that lets more than 50,000 public agencies in the U.S. and Canada buy fare software without a full tender.
Hardware leads value while software and cloud gain fastest
Why hardware leads and software grows fastest
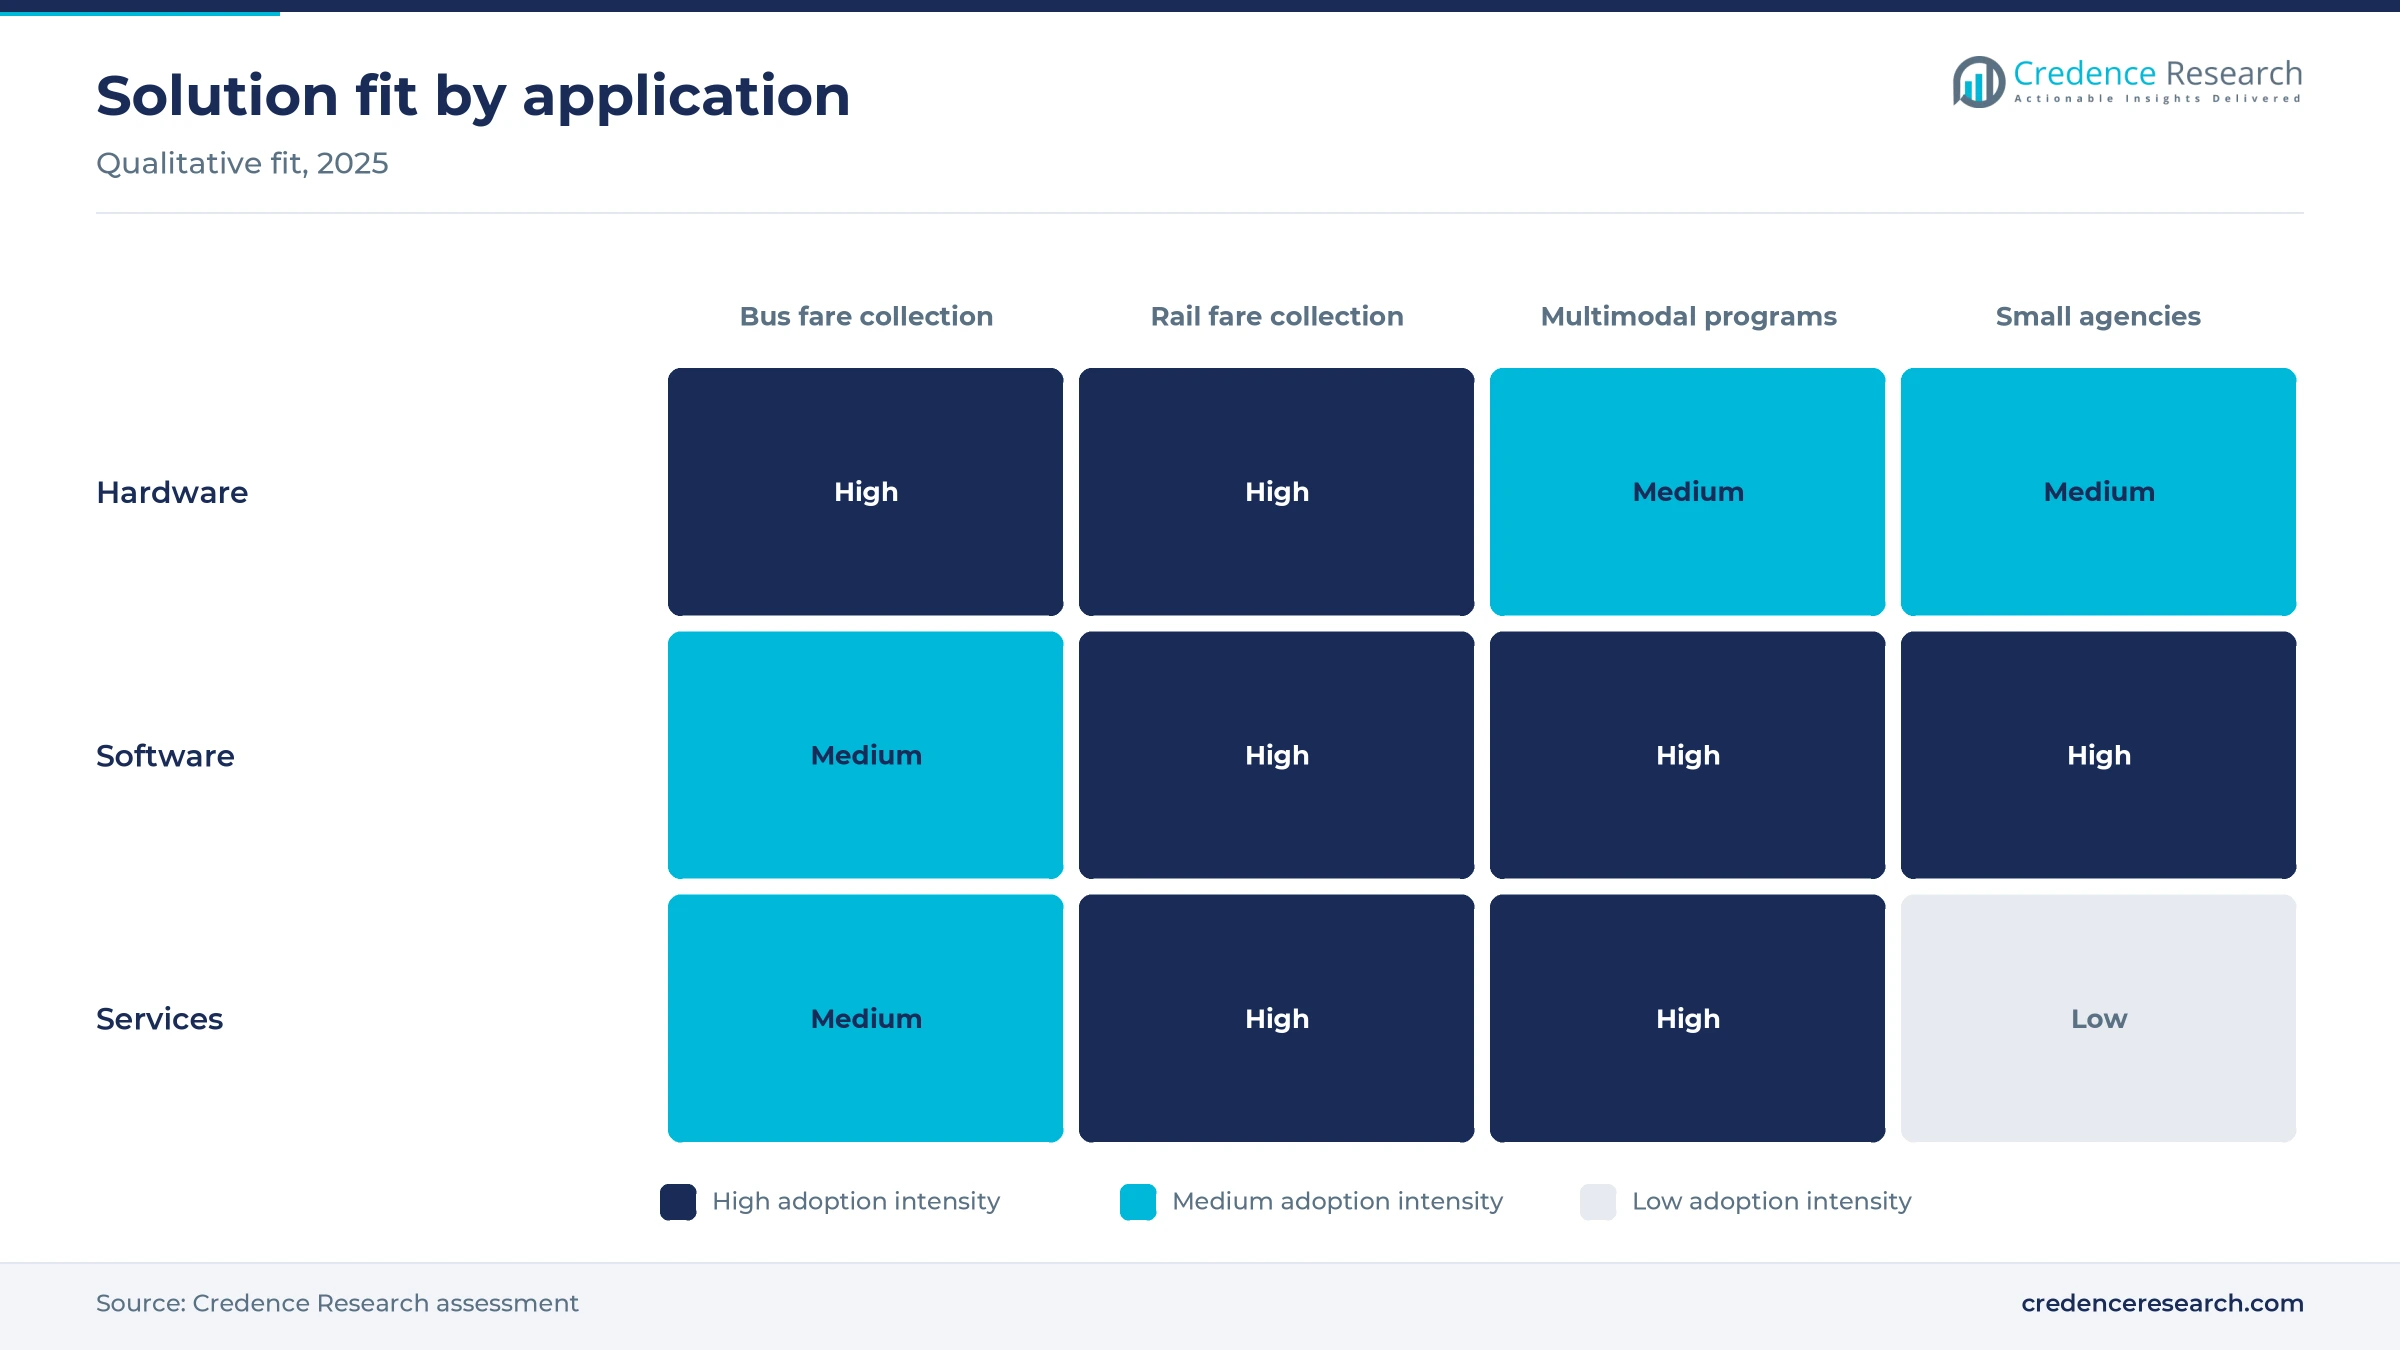
Based on solution type, the market is categorized into hardware, software and services. Hardware led with 44.0% of 2025 value because every bus and station still needs fareboxes, gates and machines, and Miami-Dade County negotiated a $72 million Genfare contract in 2024 covering about 900 fareboxes, 270 fare gates and 120 ticket machines, according to Miami New Times. Software grows fastest at 10.9% a year, as California's Cal-ITP program lists four transit processors, Bytemark, Enghouse, INIT and Littlepay, on state master agreements that agencies can buy from directly. Software now carries the fare rules that hardware once held.
Bus systems lead while multimodal programs gain
Based on application, the market is categorized into bus fare collection, rail fare collection and multimodal fare collection. Bus Fare Collection led with 42.0% of 2025 value because most agencies run buses only, and even large systems buy in bulk, as the Chicago Transit Board did in October 2022 when it approved 2,240 Scheidt & Bachmann fareboxes for its whole bus fleet. Multimodal Fare Collection grows fastest at 10.8% a year, as LA Metro opened bank card tapping in May 2026 across Metro and 26 TAP-participating agencies, Metro Magazine reported. Regional programs spread one back office across many operators and bus rapid transit lines, which lifts the value of each contract.
Agency-hosted systems lead and cloud hosting grows fastest
Based on deployment model, the market is categorized into agency-hosted, cloud-hosted and hybrid systems. Agency-Hosted systems led with 46.0% of 2025 value because large rail agencies still buy a dedicated back office with their gates, as MARTA did in January 2024 when it contracted INIT for MOBILEvario software, more than 1,800 validators and more than 275 ticket machines. Cloud-Hosted systems grow fastest at 11.4% a year, as the Puerto Rico Highways and Transportation Authority chose Cubic's cloud-based Umo platform as a service for Tren Urbano and its bus network. Hosted platforms shift upgrade and security risk from the agency to the supplier.
Capital purchases lead while transaction fees grow fastest
Based on pricing model, the market is categorized into capital purchase, subscription contracts and transaction-based contracts. Capital Purchase led with 52.0% of 2025 value because federal and local capital budgets still fund equipment as assets, and Pittsburgh Regional Transit planned a five-year, $20.9 million farebox contract for about 720 buses in October 2025, Union Progress reported. Transaction-Based Contracts grow fastest at 11.0% a year from a small base, and Cal-ITP agencies paid only about $11,200 in gateway and inspection fees in the second quarter of 2024, according to Mobility Payments, a figure that rises with every new open payment rollout.
| Segment Group | Leading Sub-segment | Share, 2025 | Fastest-growing Sub-segment | CAGR, 2026–2035 |
|---|---|---|---|---|
| By Solution Type | Hardware | 44.0% | Software | 10.9% |
| By Application | Bus Fare Collection | 42.0% | Multimodal Fare Collection | 10.8% |
| By Deployment Model | Agency-Hosted | 46.0% | Cloud-Hosted | 11.4% |
| By Pricing Model | Capital Purchase | 52.0% | Transaction-Based Contracts | 11.0% |
Contract values reflect decade-long service terms
Fare systems in the United States are priced as long programs rather than as products. An agency signs one contract that bundles devices, back-office software, installation and years of operations and maintenance, and the headline value depends mostly on the length of the service term and the number of modes covered. The MBTA program discussed under drivers below shows the pattern, with a large share of its value paid for operations and management after launch. That structure means suppliers earn much of their margin after launch, while agencies compare bids on lifecycle cost per rider rather than on device prices.
| Contract or benchmark | Typical price or fee | Basis |
|---|---|---|
| MBTA AFC 2.0, Boston, amended contract | USD 926 million total, design, build, operate and maintain | WCVB, May 2024 |
| SEPTA Key 2.0, Philadelphia, Cubic | USD 211 million | Mobility Payments and WHYY, January 2025 |
| Maryland Transit Administration, Scheidt & Bachmann | USD 63.6 million over 14 years | Mobility Payments, February 2025 |
| Miami-Dade, Genfare fareboxes, gates and machines | USD 72 million, six-year initial term | Miami New Times, 2024 |
| Pittsburgh Regional Transit fareboxes | USD 20.9 million over five years, about USD 29,000 per bus | Union Progress, October 2025; per-bus value a Credence Research estimate |
Request a Free Sample
Fill in your details and we'll send you a free sample report.
- Sample data tables & charts
- Research methodology
Federal capital, tap-to-pay and service terms lift spending
Federal transit capital funds pay for new fare systems
Public transit technology funding is the base of demand, because fare equipment is a capital asset that agencies buy with federal formula money and local matches. The Federal Transit Administration apportioned $20.6 billion for fiscal 2026, of which about $14.6 billion came under the Bipartisan Infrastructure Law and its five-year, $91 billion transit commitment, Railway News reported in April 2026. U.S. transit capital expenditures reached $27.6 billion in 2023, according to the American Public Transportation Association's 2025 Fact Book. In July 2026, the FTA opened a further $610 million round for buses, bus facilities and low- and no-emission projects. New buses and stations each need validators and fareboxes, so fleet and facility grants pull fare equipment orders along with them.
Account-based and contactless migration reaches large systems
Account-based and contactless migration has moved from pilots to the largest U.S. systems, which forces each agency to replace readers, back offices and retail networks. In New York, 65% of riders already used tap-and-go, including about 85% of regular fare customers, when the MTA said in March 2025 that MetroCard sales would end on Dec. 31, 2025. Washington's WMATA recorded more than 6 million contactless trips after Metrorail began accepting bank cards in May 2025. BART followed on Aug. 20, 2025, with a Tap and Ride system implemented by Cubic, Railway Gazette reported. Each conversion creates a wave of device, software and support spending, and it moves riders to the contactless card payments they already use in shops.
Lifecycle service terms extend revenue for a decade or more
Lifecycle service expansion turns each installation into a long revenue stream, because agencies now buy operations, maintenance and software updates in the same contract as the equipment. The City of Phoenix and Valley Metro chose Vix Technology in July 2020 under a 19-year capital, operation and maintenance contract covering bus, light rail and streetcar. The Utah Transit Authority's April 2023 award to Scheidt & Bachmann includes eight years of hardware and software services with an option to extend. Chicago's award for 2,240 fareboxes adds five years of support and warranty. In Boston, the State Auditor found that operations and management after launch account for $337.9 million of the MBTA program. These terms lock in service revenue and make incumbents hard to displace when a system is renewed.
Regional integration and fare capping widen each program
Regional fare integration is widening the scope of each program, because one back office now settles trips across many operators and applies caps that reward frequent riders. The next generation of Clipper launched on Dec. 10, 2025, across more than 20 Bay Area agencies with free and discounted transfers, cutting one sample trip from $9.85 to $4.85 in a Seamless Bay Area example cited by the Piedmont Exedra. Rochester's Regional Transit Service caps fares at $3 a day and $56 a month and added open payments with Masabi in October 2025. MARTA's contract extends contactless payment to CobbLinc, Ride Gwinnett and Xpress. Larger regional scope raises both contract values and the integration work each supplier must deliver.
Software layers and cooperative buying reshape procurement
Shift to software layered on existing hardware
Agencies are shifting toward software that runs on existing devices, rather than replacing every reader and gate at once. WMATA brought bank card taps to Metrobus on Nov. 18, 2025, on 125 routes, with Littlepay supplying the software and Cubic the fareboxes, the authority said. In Boston, the MBTA mounted new readers on top of existing subway fare gates and inside buses and trolleys, WCVB reported in May 2024. In Pittsburgh, Flowbird is installing more than 80 Astreo ticket machines that connect to the agency's existing account-based back office. This layering lowers the cost of each upgrade, links fare data with wider intelligent transportation systems and gives software specialists a way into systems once controlled by a single supplier.
Rise of cooperative purchasing for fare software
Cooperative purchasing is rising as a route to market, because smaller agencies cannot run a two-year tender for a fare system. Masabi won a Sourcewell contract on June 17, 2026, that lets public agencies, counties, tribal governments and transit authorities in the U.S. and Canada buy its Justride platform and hardware at pre-negotiated rates without a separate solicitation. More than 50,000 public agencies are eligible to use the vehicle, and Masabi says it serves more than 300 transit agencies worldwide. California's Cal-ITP program works the same way, with Fiserv and Elavon on state agreements as payment processors. Faster buying shortens sales cycles for smart ticketing at agencies that run 50 or fewer buses.
Opportunity in gates and inspection to cut evasion
Fare evasion is an opening for gate, validator and inspection suppliers, because lost fares now rival the cost of a new system. The Citizens Budget Commission estimated that New York lost about $918 million to subway and bus fare evasion in 2024, including $568 million on buses, where 44% of riders did not pay in the first quarter of 2025. NJ Transit awarded Conduent a contract in April 2025 for 72 3D fare gates at Secaucus Junction and Newark Liberty International Airport, with an option to expand. Agencies that can show recovered fares can justify gate upgrades from operating savings rather than grants.
Retail cash networks open fare access for the unbanked
Riders who pay cash are an opening for retail and account services, because open payments alone leave them out. The FDIC found that 4.2% of U.S. households, about 5.6 million, were unbanked in 2023, and two-thirds of those were cash only. Valley Metro's Vix system adds more than 1,000 retail locations for cash-dependent riders, and MARTA's program sells fares through about 240 retail outlets. In Dayton, Masabi's Justride lets riders add cash at stores through InComm's VanillaDirect barcodes. Suppliers that pair accounts with retail cash loading can win equity-focused agencies and avoid costly cash fareboxes.
Overruns, deficits and funding deadlines slow new awards
Cost overruns and delays erode confidence in big programs
Large fare programs often run late and over budget, which makes boards cautious about the next award. The MBTA's AFC 2.0 program started with a $753 million budget, peaked at $967 million and was first expected to be deployed in 2020, WCVB reported in May 2024. Delays force agencies to keep maintaining old equipment for years. Agencies now ask for milestone payments, incentives tied to dates and phased launches to limit that exposure.
Operating deficits squeeze fare technology budgets
Operating deficits compete with fare technology for scarce local money, which delays upgrades at the agencies under the most pressure. SEPTA reached its fiscal cliff on Aug. 24, 2025, with a $213 million budget gap, cut about 20% of service and scheduled a 21.5% fare increase, The Bond Buyer reported. Agencies in that position defer optional software modules and stretch equipment life. Suppliers respond with subscription pricing that spreads cost over operating budgets.
Federal funding deadlines cloud future capital plans
Uncertainty over federal funding after 2026 makes agencies hesitant to commit to fare programs that run past the current law. Bipartisan Infrastructure Law authorities were set to expire on Sept. 30, 2026, and advance appropriations, which supplied 15% of guaranteed highway, bridge, transit and safety funding, cover only fiscal 2022 to 2026, the National Association of Counties noted, citing the Congressional Research Service. Agencies may phase awards until a new law sets funding levels.
Procurement disputes and terminations add project risk
Procurement disputes and contract terminations add risk for both agencies and suppliers, because each restart costs months. Mobility Payments reported in February 2025 that Maryland's transit agency had likely ended a Scheidt & Bachmann fare contract expected to be worth $63.6 million over 14 years. In Pittsburgh, Genfare formally challenged the October 2025 farebox award, and the board vote was pulled. Clear specifications and staged testing help agencies reduce such disputes before award.
The South holds the largest share and the fastest growth
The four regions differ mainly in transit ridership, population growth and where agencies are in their replacement cycle. The South and the West and Territories together held 62.5% of 2025 value, because both are in the middle of large procurements.
| Region | Value, 2025 (USD billion) | Share, 2025 | CAGR, 2026–2035 |
|---|---|---|---|
| South | 0.74 | 37.5% | 9.9% |
| West and Territories | 0.50 | 25.0% | 9.4% |
| Midwest | 0.39 | 19.5% | 8.7% |
| Northeast | 0.36 | 18.0% | 8.3% |
South leads on programs in Washington, Atlanta and Miami
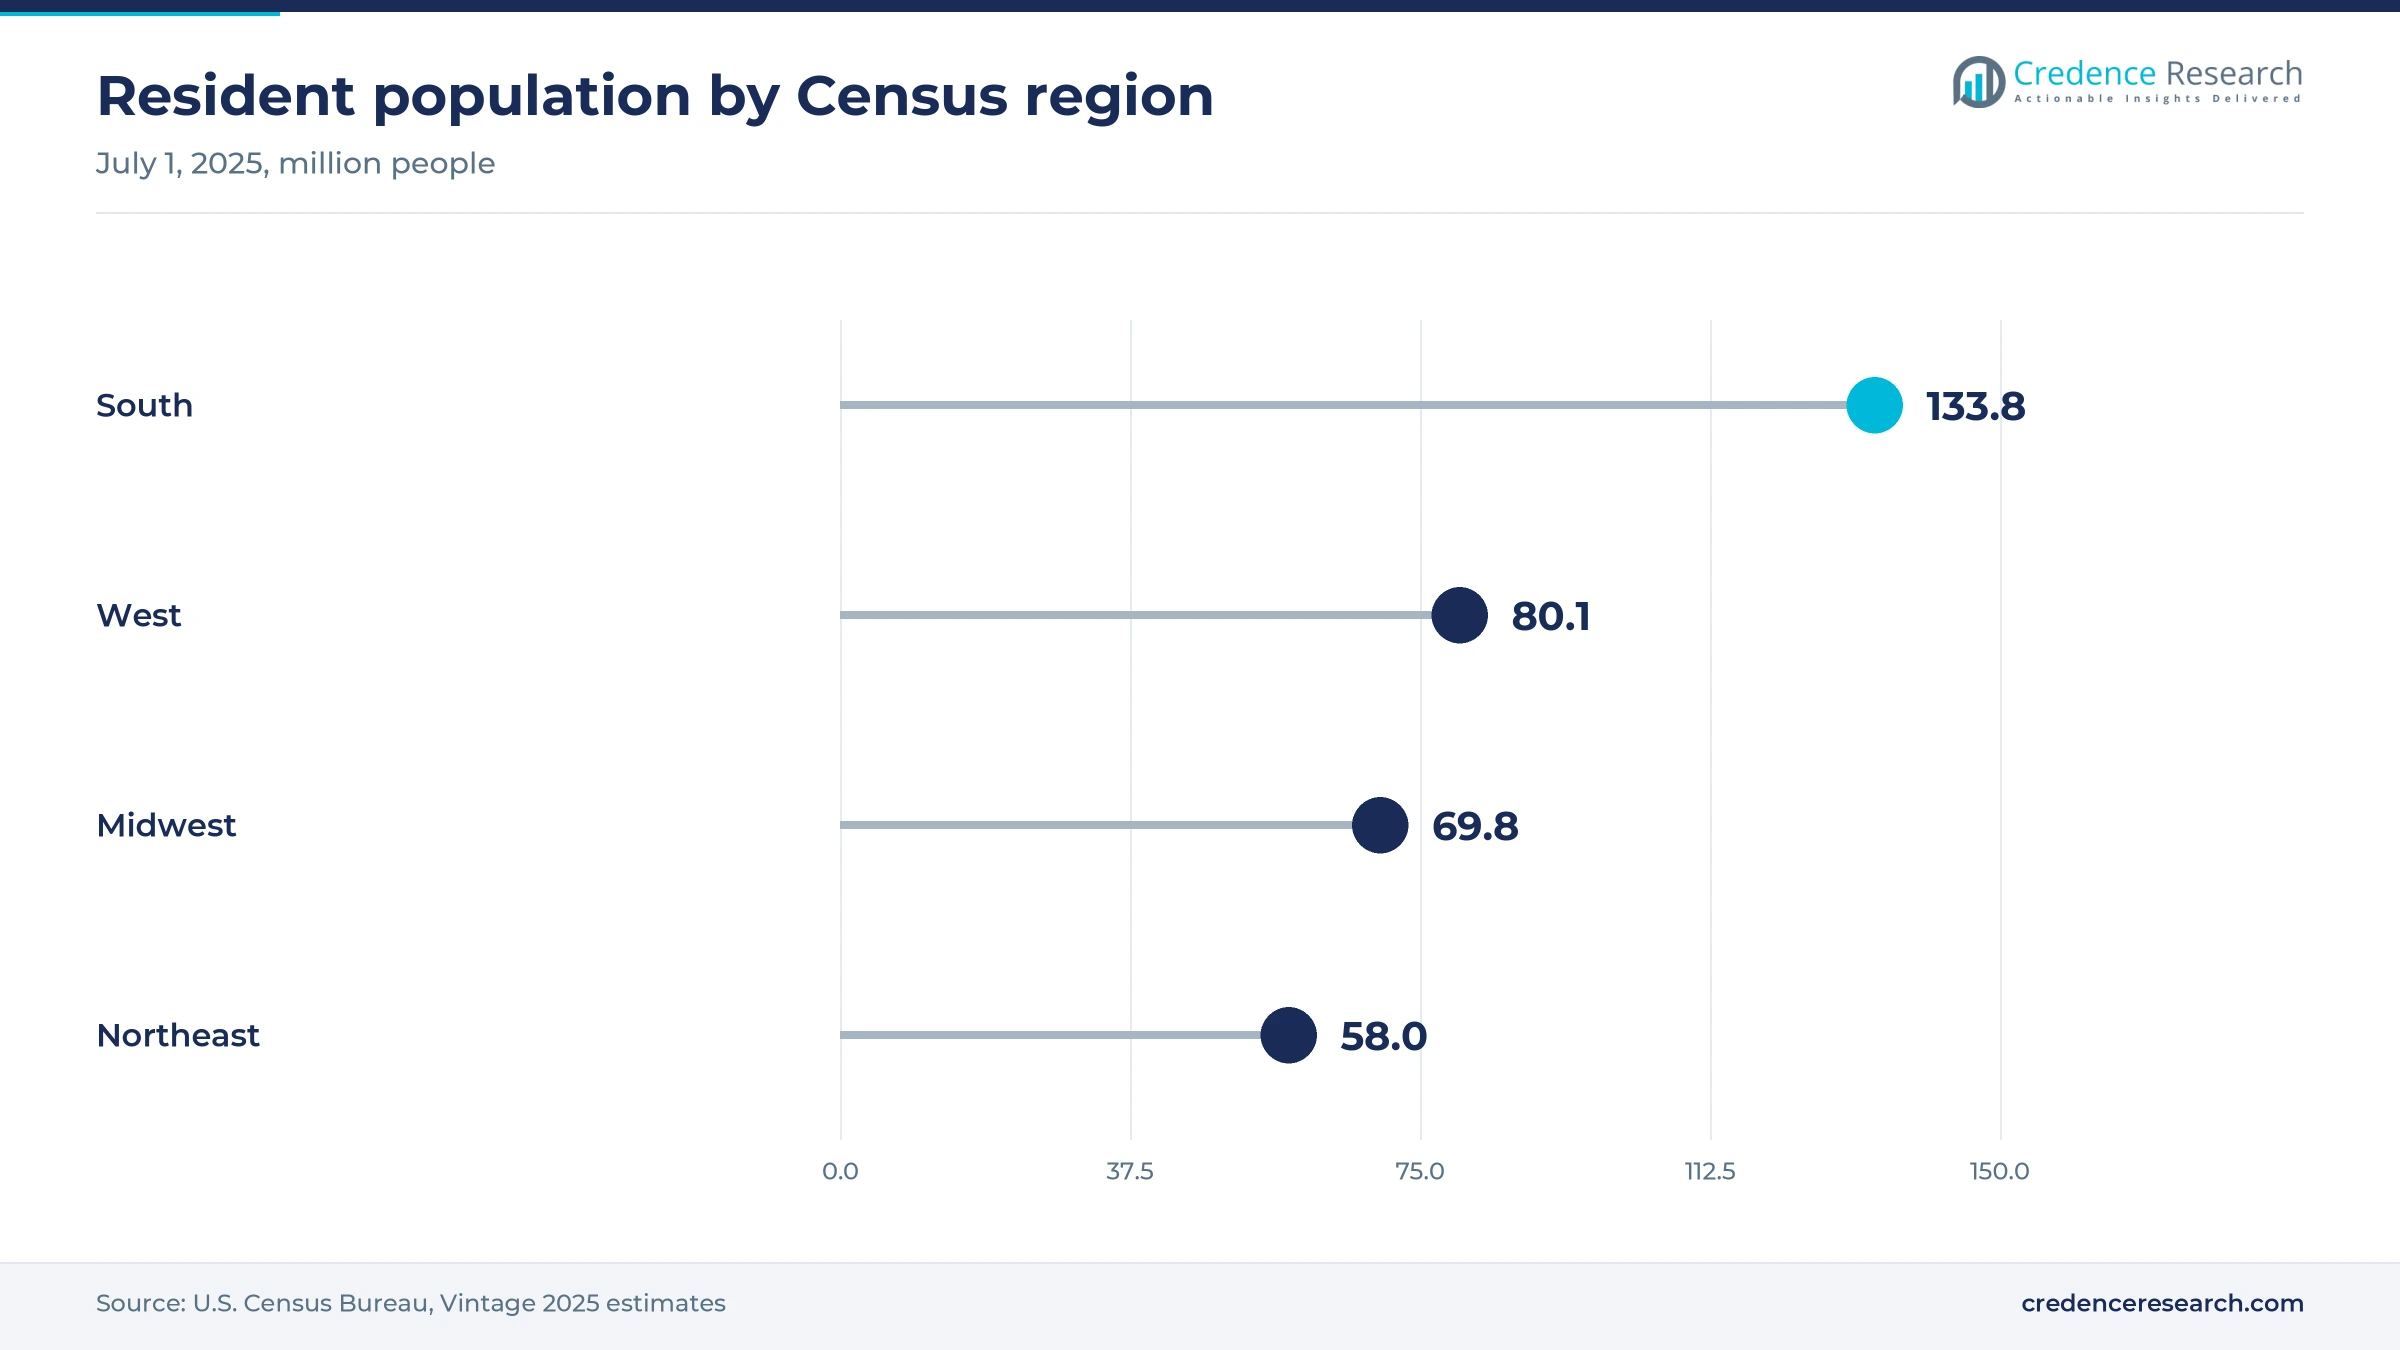
The South held 37.5% of 2025 value and is the fastest-growing region at 9.9% a year. The Census Bureau counts 133.8 million South residents in 2025, up 6.0% since 2020, nearly double the national rate. WMATA in the District of Columbia, MARTA in Atlanta and Miami-Dade all have fare programs under way. Nashville's WeGo, working with INIT, recorded more than 28,000 contactless taps, or 22% of fare payments, in its first month in 2025. Population growth keeps new routes, vehicles and fare devices coming into service.
West and Territories build on regional card programs
The West and Territories held 25.0% of 2025 value and grow at 9.4% a year. The Census Bureau counts 80.1 million people in the West, up 1.9% since 2020. Demand rests on regional programs, with LA Metro's TAP network, Clipper in the Bay Area, the Utah Transit Authority's account-based system and Valley Metro in Phoenix. In Puerto Rico, Cubic's Umo platform serves Tren Urbano and bus services with more than 10 million annual riders. Ridership recovery on rail systems sets the pace of new orders in the region.
Midwest demand centers on Chicago and mid-size cities
The Midwest held 19.5% of 2025 value and grows at 8.7% a year. The region had about 69.8 million residents in 2025, up only 1.1% since 2020, according to the Census Bureau. Chicago's CTA, Metra and Pace share the Ventra system, and the CTA farebox replacement is the largest single equipment order in the region. Mid-size agencies such as the Greater Dayton Regional Transit Authority use Masabi's Justride with fare capping and retail cash loading. Slow population growth keeps the pace below the national rate.
Northeast spending shifts from builds to operations
The Northeast held 18.0% of 2025 value and grows at 8.3% a year, the slowest of the four regions. The Massachusetts State Auditor puts the cost of New York's comparable fare project, completed in January 2021, at $590 million, and the MTA expects to save at least $20 million a year from a single fare method. Boston and Philadelphia are mid-way through new systems, and NJ Transit awarded Conduent a five-year contactless contract in 2024. With only 0.7% population growth since 2020, Census Bureau data show, new spending in the region comes mainly from operating and upgrading systems already built.
Philadelphia, Washington and LA set the 2025-2026 pace
| Development | Status and market relevance |
|---|---|
| In January 2025, the SEPTA board approved a $211 million Key 2.0 fare system contract with Cubic Transportation Systems. | Replaces incumbent Conduent on Philadelphia's card system |
| In November 2025, WMATA launched bank card and mobile wallet taps on Metrobus with Littlepay software and Cubic fareboxes. | Completes open payments across Washington's rail and bus network |
| In December 2025, the Metropolitan Transportation Commission began the next-generation Clipper rollout across more than 20 Bay Area agencies. | Adds free and discounted transfers between operators |
| In May 2026, LA Metro launched contactless bank card payments and a new app across Metro and 26 TAP agencies. | Prepares the region for World Cup visitors |
| In June 2026, Masabi won a Sourcewell cooperative contract for its Justride fare platform. | Lets U.S. and Canadian agencies buy fare software without a separate tender |
Four architectures decide how riders pay and agencies settle
- Card-based closed loop systems store value on an agency smart card, which suits riders without bank cards but ties the agency to one supplier.
- Account-based ticketing keeps fares and passes in a central account, so any card, phone or barcode becomes a token and caps apply automatically.
- Open payment acceptance lets riders tap their own bank card or phone, which removes card issuance cost but adds payment processing fees.
- Mobile ticketing and barcodes sell fares through an app with visual or scanned validation, a low-cost entry point for small and university agencies.
Need a Custom Version of This Report?
Tailor the scope, geography, or segments to your exact requirements.
- Custom geography or segment scope
- Direct access to our analyst team
Integration record and lifecycle service decide contracts
U.S. automatic fare collection suppliers compete on references from operating systems, the ability to integrate rail gates, bus fareboxes and regional back offices, and the depth of their long-term service teams. Cubic Transportation Systems leads the largest programs, including New York, Boston, Philadelphia, the Bay Area and Washington. Conduent holds NJ Transit work, while Scheidt & Bachmann supplies fareboxes in Chicago and the account-based system in Utah. INIT competes for full systems in Atlanta and Nashville, and Vix Technology runs Phoenix under a 19-year term. Genfare supplies fareboxes and gates to bus and rail agencies such as Miami-Dade and MARTA. Masabi and Littlepay compete with hosted software and transit processing priced as a service. Bid protests and price competition have become more common as agencies split hardware and software into separate packages.
A concentrated top tier with a growing software fringe
The U.S. supply side has a concentrated top tier of systems integrators, led by Cubic in the largest rail and regional programs, with Conduent, Scheidt & Bachmann, INIT and Vix Technology competing for full systems. Genfare is a leading farebox supplier to bus agencies, while Flowbird supplies ticket machines. A fringe of software specialists, including Masabi and Littlepay, now sells hosted back offices and transit processing on top of other suppliers' hardware. Entry barriers come from payment security certification, references from operating systems and the ability to fund long build periods, and margins sit mainly in software and multiyear service.
Companies profiled and their roles in this market
| Company | Type | Role in the market |
|---|---|---|
| Cubic Transportation Systems | Systems integrator, San Diego | OMNY, MBTA AFC 2.0, SEPTA Key 2.0, Clipper and WMATA fareboxes |
| Conduent Transportation | Systems integrator, New Jersey | NJ Transit contactless system and 3D fare gates |
| Scheidt & Bachmann Fare Collection Systems | Equipment and systems supplier | CTA fareboxes and UTA account-based system |
| Genfare | Farebox and equipment maker, Illinois | Miami-Dade fareboxes, gates and machines; MARTA onboard fareboxes |
| INIT | Systems integrator | MARTA AFC 2.0 and WeGo contactless payments in Nashville |
| Masabi | Fare software as a service | Justride for Rochester RTS and Greater Dayton RTA; Sourcewell contract |
| Vix Technology | Systems integrator | Account-based system for Phoenix and Valley Metro |
| Flowbird Transit | Ticket machine supplier | Astreo ticket machines for Pittsburgh Regional Transit |
| Littlepay | Transit payment processor | Open payment software for WMATA Metrobus and Cal-ITP agencies |
Agencies now buy fare systems as long service contracts
Credence Research's view is that U.S. agencies no longer buy fare collection as equipment but as a decade-long service, and that changes who wins. New York reached 65% tap-and-go use before MetroCard sales ended, so growth in the largest systems now comes from regional integration, hosted software and the service terms attached to each award. Suppliers with operating references and payment security credentials keep the big programs, while software specialists take mid-size and small agencies through cooperative contracts. The main risk is fiscal, because agencies with operating deficits delay replacements first.
Fare revenue and contract values anchor the estimates
The report uses 2025 as the base year and forecasts to 2035 in current U.S. dollars. Market values come from the Credence Research model, which combines passenger fare revenue from the American Public Transportation Association, the share of fares that agencies spend on fare systems, and published contract values from agency boards, state audits and trade press. Regional shares follow the Credence Research regional model, informed by Census Bureau population data and agency programs in each region. Segment splits are Credence Research estimates based on contract scopes and agency programs. No primary interviews or surveys were used in building these estimates.
Regional integration and cloud software set the upper range
Through 2035, spending is likely to rise in two phases toward USD 4.84 billion. Until about 2029, replacements in Philadelphia, Boston, Atlanta, Miami and the Bay Area, plus open payment rollouts at mid-size agencies, carry most of the gains. After that, growth depends on hosted software and regional programs that settle trips across many operators. Hardware, at 44.0% of 2025 value, remains the largest solution type through the forecast, while software and transaction-based fees gain share as more agencies adopt open payments. Federal reauthorization will decide whether the second phase arrives early or late.
Federal funding and regional integration set the range to 2035
The range of outcomes depends on how Congress funds transit after the current law, and on how fast regional agencies move to shared, hosted fare platforms. A downside case combines lower federal capital funding with operating deficits that delay replacements. The upside requires multiyear reauthorization at current levels, cooperative purchasing for small agencies and wider regional fare integration with capping.
| Scenario | CAGR, 2026–2035 | Value, 2035 | What has to hold |
|---|---|---|---|
| Downside | 7.3% | USD 4.10 billion | Federal capital funding falls and deficit-hit agencies stretch old equipment past its life |
| Base | 9.26% | USD 4.84 billion | Steady formula funding, gradual open payment rollout and longer service contracts |
| Upside | 10.8% | USD 5.47 billion | Full reauthorization, wide cooperative buying and regional caps across most large metros |
Frequently Asked Questions
How big is the United States automatic fare collection market?
Which region leads the U.S. market?
Which solution type holds the largest share?
How far has contactless payment spread in U.S. transit?
What do large U.S. fare system contracts cost?
What limits growth in the United States?
How do smaller agencies buy fare systems faster?
Which companies are active in the U.S. market?
Table of Content
Chapter 1 Market Segmentation
- 1.1 Segmentation Framework
- 1.1.1 Product and Service Classification
- 1.1.2 Application and End-Use Classification
- 1.1.3 Technology and Solution Classification
- 1.1.4 Customer and Distribution Channel Classification
- 1.1.5 Geographic Segmentation
- 1.1.6 Market Segment Definitions and Boundaries
- 1.2 By Solution Type
- 1.2.1 Hardware
- 1.2.2 Software
- 1.2.3 Services
- 1.3 By Application
- 1.3.1 Bus Fare Collection
- 1.3.2 Rail Fare Collection
- 1.3.3 Multimodal Fare Collection
- 1.4 By Deployment Model
- 1.4.1 Agency-Hosted
- 1.4.2 Hybrid
- 1.4.3 Cloud-Hosted
- 1.5 By Pricing Model
- 1.5.1 Capital Purchase
- 1.5.2 Subscription Contracts
- 1.5.3 Transaction-Based Contracts
Chapter 2 Introduction
- 2.1 Report Objectives and Scope
- 2.2 Product Definition and Industry Terminology
- 2.3 Market Inclusions and Exclusions
- 2.4 Research Process
- 2.4.1 Primary Research and Expert Interviews
- 2.4.2 Secondary Research and Source Review
- 2.4.3 Top-Down and Bottom-Up Estimation
- 2.4.4 Data Triangulation and Verification
- 2.5 Market Size Measurement Basis
- 2.5.1 2025: USD 1.99 billion → 2035: USD 4.84 billion
- 2.6 Historical and Forecast Reference Periods
- 2.6.1 Historical Period: 2018-2025
- 2.6.2 Base Year: 2025
- 2.6.3 Forecast Period: 2025-2035
- 2.7 Research Assumptions and Limitations
Chapter 3 Executive Summary
- 3.1 Market Snapshot and Key Findings
- 3.2 Base-Year Market Size, 2025
- 3.3 Forecast Market Size, 2035
- 3.4 Revenue and Volume Growth Outlook
- 3.5 Key Demand and Supply Indicators
- 3.6 Leading Market Segments
- 3.7 Fastest-Growing Market Opportunities
- 3.8 Regional Performance Highlights
- 3.9 Technology and Industry Transformation
- 3.10 Competitive Landscape Summary
- 3.11 Analyst View and Strategic Implications
Chapter 4 United States Automatic Fare Collection Market Trends and Developments
- 4.1 Historical Industry Development, 2018-2025
- 4.2 Recent Market Trends and Developments
- 4.3 Demand and Customer Behavior Trends
- 4.4 Technology and Product Innovation
- 4.5 Artificial Intelligence, Automation and Digitalization
- 4.6 Local Manufacturing and Supply Chain Realignment
- 4.7 Industry Partnerships, Mergers and Acquisitions
- 4.8 Sustainability and Circular Economy Developments
- 4.9 Government and Private Sector Investment Trends
- 4.10 Emerging Business Models and Commercialization
- 4.11 Industry Developments and Announcements
Chapter 5 United States Automatic Fare Collection Market Production, Supply and Demand Analysis
- 5.1 Demand Trend and Consumption Analysis, 2018-2025
- 5.2 Demand Forecast, 2025-2035
- 5.3 Production and Output Trend, 2018-2025
- 5.4 Production and Output Forecast, 2025-2035
- 5.5 Installed Capacity and Capacity Utilization
- 5.6 Company-Wise Production Plants and Statistics
- 5.6.1 Installed Production Capacity
- 5.6.2 Actual Production
- 5.6.3 Planned Capacity and Expansion Targets
- 5.7 Supply Chain Structure and Procurement Trends
- 5.8 Supply-Demand Gap and Bottlenecks
- 5.9 Import Dependence and Sourcing Structure
- 5.10 Contract Manufacturing and Outsourcing
- 5.11 Regional Supply and Demand Concentration
Chapter 6 United States Automatic Fare Collection Market Pricing Analysis
- 6.1 Pricing Structure and Measurement
- 6.2 Historical Pricing Trends, 2018-2025
- 6.3 Pricing Outlook, 2025-2035
- 6.4 Average Selling Price and Unit Economics
- 6.5 Pricing by Product and Market Segment
- 6.6 Geographic Pricing Differences
- 6.7 Key Input, Energy, Labor and Logistics Costs
- 6.8 Contract Pricing and Purchasing Models
- 6.9 Pricing Sensitivity and Competitive Positioning
- 6.10 Price, Margin and Profitability Implications
Chapter 7 United States Automatic Fare Collection Market Dynamics
- 7.1 Market Growth Drivers
- 7.1.1 Demand-Side Drivers
- 7.1.2 Technology and Innovation Drivers
- 7.1.3 Infrastructure and Investment Drivers
- 7.1.4 Regulatory and Policy Drivers
- 7.2 Market Restraints
- 7.2.1 Cost and Affordability Constraints
- 7.2.2 Technology and Adoption Barriers
- 7.2.3 Supply Chain and Operational Constraints
- 7.3 Market Challenges
- 7.3.1 Competitive Pressure and Margin Erosion
- 7.3.2 Skills, Infrastructure and Implementation Gaps
- 7.4 Emerging Market Opportunities
- 7.5 Market Dynamics Impact and Time-Horizon Assessment
Chapter 8 United States Automatic Fare Collection Value Chain Analysis
- 8.1 Industry Value Chain Overview
- 8.2 Upstream Suppliers and Critical Inputs
- 8.3 Technology and Component Providers
- 8.4 Manufacturing or Service Delivery
- 8.5 Distribution, Channel Partners and Integrators
- 8.6 Downstream Applications and End Users
- 8.7 Value Addition and Profit Pools
- 8.8 Vertical Integration and Outsourcing
- 8.9 Supplier Concentration and Risk
- 8.10 Supply Chain Localization and Resilience
Chapter 9 United States Automatic Fare Collection Market Regulations and Policies
- 9.1 Relevant Laws, Standards and Compliance Frameworks
- 9.2 Product, Service, Safety and Quality Requirements
- 9.3 Government Policies, Incentives and Subsidies
- 9.4 Imports, Exports and Trade Barriers
- 9.5 Public Procurement and Local Content Requirements
- 9.6 Environmental and Sustainability Compliance
- 9.7 Upcoming Policy Changes and Market Implications
Chapter 10 United States Automatic Fare Collection Market Hotspots and Opportunities
- 10.1 Market Opportunity Mapping and Growth Hotspots
- 10.2 High-Growth Applications and Customer Groups
- 10.3 Underserved Markets and White-Space Opportunities
- 10.4 Emerging Technology and Product Opportunities
- 10.5 New Capacity and Investment Hotspots
- 10.6 Market Entry and Expansion Opportunities
- 10.7 Distribution and Partnership Opportunities
- 10.8 Near-Term and Long-Term Commercial Potential
- 10.9 Opportunity Attractiveness and Execution Risks
Chapter 11 United States Automatic Fare Collection Market Outlook, 2025-2035
- 11.1 Market Size and Analysis
- 11.1.1 Revenue (Market Measurement: 2025: USD 1.99 billion → 2035: USD 4.84 billion)
- 11.1.2 Market Volume and Quantity Sold
- 11.1.3 Historical Market Size, 2018-2025
- 11.1.4 Base-Year Market Size, 2025
- 11.2 Market Forecast, 2025-2035
- 11.2.1 Revenue Forecast to 2035
- 11.2.2 Volume Forecast to 2035
- 11.2.3 CAGR and Year-on-Year Growth
- 11.2.4 Incremental Revenue Opportunity
- 11.3 Forecast Assumptions and Scenario Analysis
- 11.3.1 Base-Case Forecast
- 11.3.2 Optimistic and Conservative Scenarios
- 11.3.3 Technology, Pricing and Policy Sensitivities
- 11.4 Market Attractiveness and Growth Outlook
Chapter 12 United States Automatic Fare Collection Market Segmentation and Outlook
- 12.1 Segmentation Summary and Market Shares, 2025
- 12.2 Largest and Fastest-Growing Segments
- 12.3 By Solution Type - Market Size and Forecast, 2025-2035
- 12.3.1 Segment Definition and Scope
- 12.3.2 Historical Market Size, 2018-2025
- 12.3.3 Revenue Forecast, 2025-2035
- 12.3.4 Volume Forecast, 2025-2035
- 12.3.5 Base-Year Market Share, 2025
- 12.3.6 Segment CAGR and Growth Drivers
- 12.3.7 Subsegment Market Size and Forecast
- 12.3.7.1 Hardware
- 12.3.7.2 Software
- 12.3.7.3 Services
- 12.3.8 Subsegment Pricing and Adoption Trends
- 12.3.9 Leading Suppliers and Competition
- 12.3.10 Regional Demand and Opportunities
- 12.4 By Application - Market Size and Forecast, 2025-2035
- 12.4.1 Segment Definition and Scope
- 12.4.2 Historical Market Size, 2018-2025
- 12.4.3 Revenue Forecast, 2025-2035
- 12.4.4 Volume Forecast, 2025-2035
- 12.4.5 Base-Year Market Share, 2025
- 12.4.6 Segment CAGR and Growth Drivers
- 12.4.7 Subsegment Market Size and Forecast
- 12.4.7.1 Bus Fare Collection
- 12.4.7.2 Rail Fare Collection
- 12.4.7.3 Multimodal Fare Collection
- 12.4.8 Subsegment Pricing and Adoption Trends
- 12.4.9 Leading Suppliers and Competition
- 12.4.10 Regional Demand and Opportunities
- 12.5 By Deployment Model - Market Size and Forecast, 2025-2035
- 12.5.1 Segment Definition and Scope
- 12.5.2 Historical Market Size, 2018-2025
- 12.5.3 Revenue Forecast, 2025-2035
- 12.5.4 Volume Forecast, 2025-2035
- 12.5.5 Base-Year Market Share, 2025
- 12.5.6 Segment CAGR and Growth Drivers
- 12.5.7 Subsegment Market Size and Forecast
- 12.5.7.1 Agency-Hosted
- 12.5.7.2 Hybrid
- 12.5.7.3 Cloud-Hosted
- 12.5.8 Subsegment Pricing and Adoption Trends
- 12.5.9 Leading Suppliers and Competition
- 12.5.10 Regional Demand and Opportunities
- 12.6 By Pricing Model - Market Size and Forecast, 2025-2035
- 12.6.1 Segment Definition and Scope
- 12.6.2 Historical Market Size, 2018-2025
- 12.6.3 Revenue Forecast, 2025-2035
- 12.6.4 Volume Forecast, 2025-2035
- 12.6.5 Base-Year Market Share, 2025
- 12.6.6 Segment CAGR and Growth Drivers
- 12.6.7 Subsegment Market Size and Forecast
- 12.6.7.1 Capital Purchase
- 12.6.7.2 Subscription Contracts
- 12.6.7.3 Transaction-Based Contracts
- 12.6.8 Subsegment Pricing and Adoption Trends
- 12.6.9 Leading Suppliers and Competition
- 12.6.10 Regional Demand and Opportunities
- 12.7 Segment Growth Comparison
- 12.8 Segment Attractiveness and Priority Matrix
Chapter 13 United States Automatic Fare Collection End-Use and Application Market Outlook
- 13.1 End-Use Industry and Customer Demand Structure
- 13.2 Leading Applications and Customer Groups
- 13.3 End-Use Market Size, Share and Forecast
- 13.4 Major End-Use Industry Deep Dives
- 13.4.1 Customer Requirements and Use Cases
- 13.4.2 Demand and Replacement Cycles
- 13.4.3 Technical and Regulatory Considerations
- 13.4.4 Purchasing and Procurement Models
- 13.4.5 Leading Vendors and Distribution Channels
- 13.4.6 Forecast and Commercial Opportunities
- 13.5 Emerging Applications and Cross-Segment Demand
- 13.6 End-Use Industry Investment Priorities
Chapter 14 United States Automatic Fare Collection Geographic Market Outlook, 2025-2035
- 14.1 Domestic Market Distribution and Demand Clusters
- 14.2 State- or Province-Wise Market Size and Forecast, 2025-2035
- 14.3 City and Metropolitan Market Outlook
- 14.4 Industrial, Manufacturing and Commercial Clusters
- 14.5 Geographic Concentration of Key End Users
- 14.6 Local Pricing and Purchasing Differences
- 14.7 Domestic Production Facilities and Capacity Map
- 14.8 Local Infrastructure and Project Pipeline
- 14.9 State-Level Policy and Incentive Differences
- 14.10 Subnational Investment Hotspots and Opportunities
- 14.11 Distribution and Logistics Networks
- 14.12 Domestic Competitive Footprint
Chapter 15 United States Automatic Fare Collection Technology, Innovation and Sustainability Outlook
- 15.1 Technology Landscape and Maturity
- 15.2 Product, Process and Service Innovation
- 15.3 AI, Automation and Digital Tools in the Industry
- 15.4 Technology Adoption and Performance Benchmarking
- 15.5 Innovation Pipeline and R&D Investment
- 15.6 Patent and Intellectual Property Trends
- 15.7 Energy Efficiency and Resource Management
- 15.8 Sustainability, Recycling and Circularity
- 15.9 Technology Roadmap, 2025-2035
- 15.10 Risks of Obsolescence and Technology Substitution
Chapter 16 United States Automatic Fare Collection Market Key Strategic Imperatives
- 16.1 Growth and Market Entry Priorities
- 16.2 High-Return Products and Segments
- 16.3 Pricing, Profitability and Cost Optimization
- 16.4 Technology Investment and Product Differentiation
- 16.5 Supply Chain Localization and Resilience
- 16.6 Distribution and Customer Acquisition
- 16.7 Partnership, Acquisition and Capacity Strategy
- 16.8 Regional Expansion Priorities
- 16.9 Short-, Medium- and Long-Term Actions
Chapter 17 Competition Outlook
- 17.1 Industry Competition Characteristics
- 17.2 Market Structure and Concentration
- 17.3 Market Share and Competitive Positioning, 2025
- 17.4 Company-Wise Revenue and Product Benchmarking
- 17.5 Production and Service Capacity Benchmarking
- 17.6 Technology, Pricing and Differentiation
- 17.7 Regional Footprint and Distribution Strength
- 17.8 Mergers, Acquisitions and Strategic Alliances
- 17.9 New Entrants and Competitive Threats
- 17.10 Porter's Five Forces and Industry Attractiveness
- 17.11 Competitive Outlook, 2025-2035
Chapter 18 Company Profiles
- 18.1 Company Coverage and Selection Criteria
- 18.2 Cubic Transportation Systems
- 18.2.1 Business Description
- 18.2.2 Company Ownership and Geographic Presence
- 18.2.3 Product and Service Portfolio
- 18.2.4 Manufacturing and Operating Footprint
- 18.2.5 Production Capacity and Expansion Plans
- 18.2.6 Financial Performance and Investment
- 18.2.7 Market Share and Competitive Position
- 18.2.8 Technology and Innovation Capabilities
- 18.2.9 Strategic Alliances or Partnerships
- 18.2.10 Recent Developments
- 18.2.11 Growth Strategy and Outlook
- 18.3 Conduent Transportation
- 18.4 Scheidt & Bachmann Fare Collection Systems
- 18.5 Hitachi Rail
- 18.6 Genfare
- 18.7 INIT
- 18.8 Masabi
- 18.9 Vix Technology
- 18.10 Flowbird Transit
- 18.11 Littlepay
- 18.12 Other Relevant Market Participants
Note: Every listed company is profiled on the structure shown under the first company. The company list is preliminary and may change based on research findings, market developments, data availability and client requirements.
Chapter 19 Disclaimer
- 19.1 Research and Forecast Disclaimer
- 19.2 Data Source and Estimation Limitations
Note: The depth of individual sections depends on data availability for this market. Volume, capacity, trade and other unit-based metrics are included where applicable.