Part-time finance chiefs replace full-time CFO hires
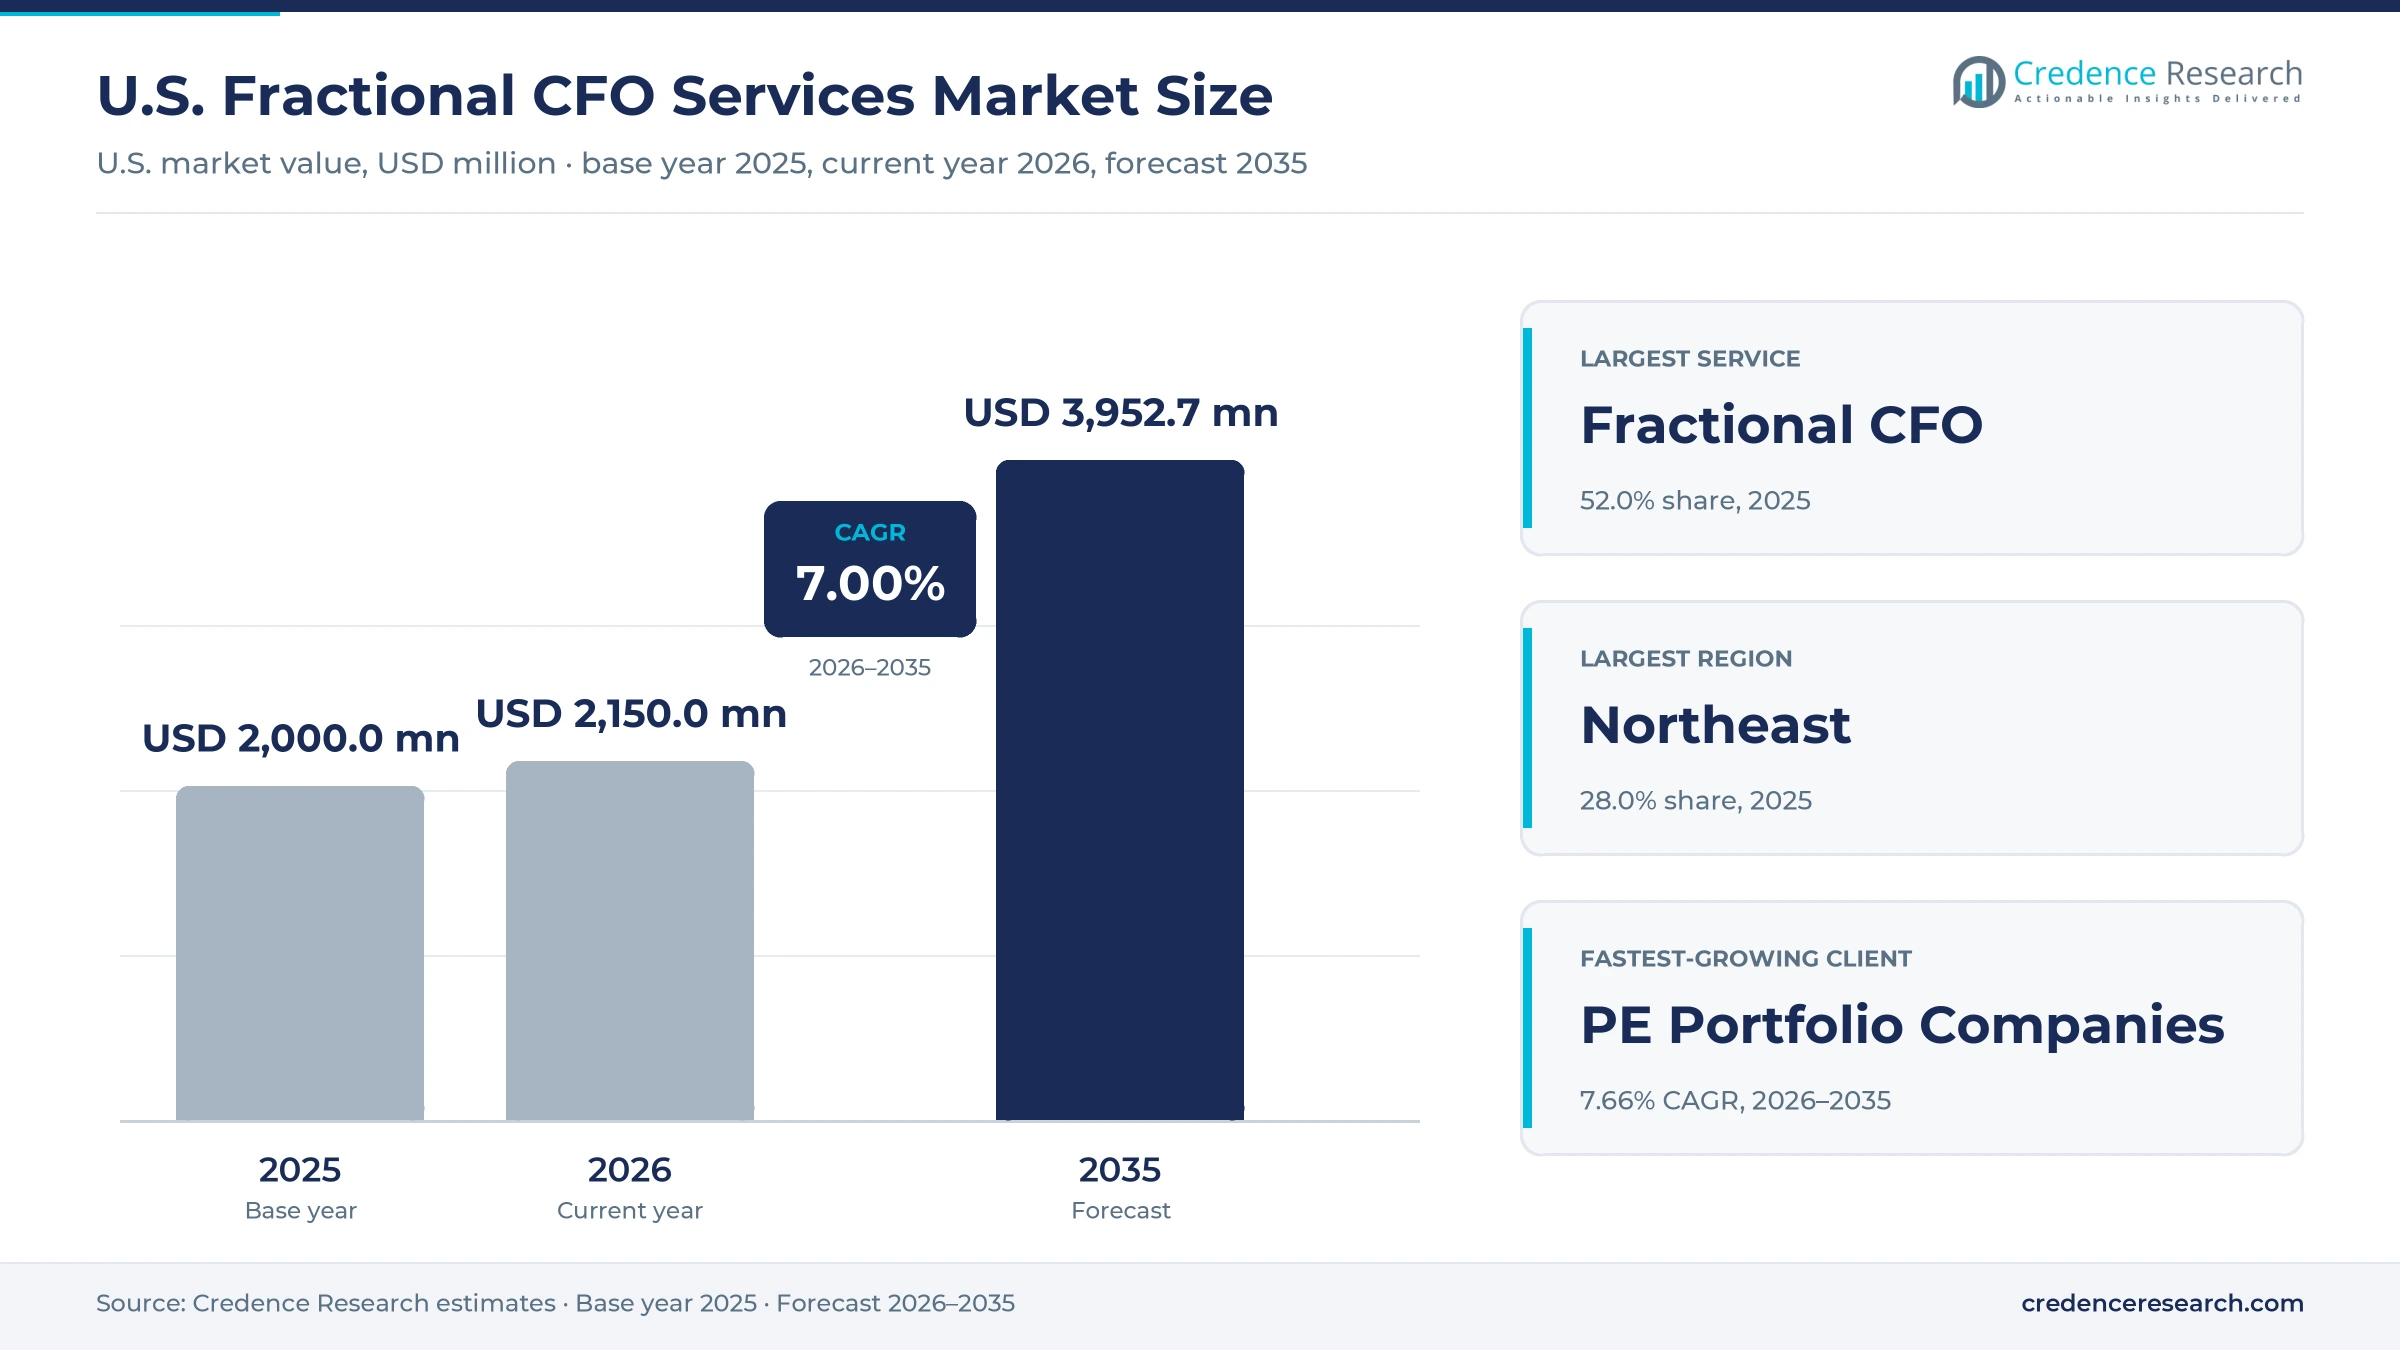
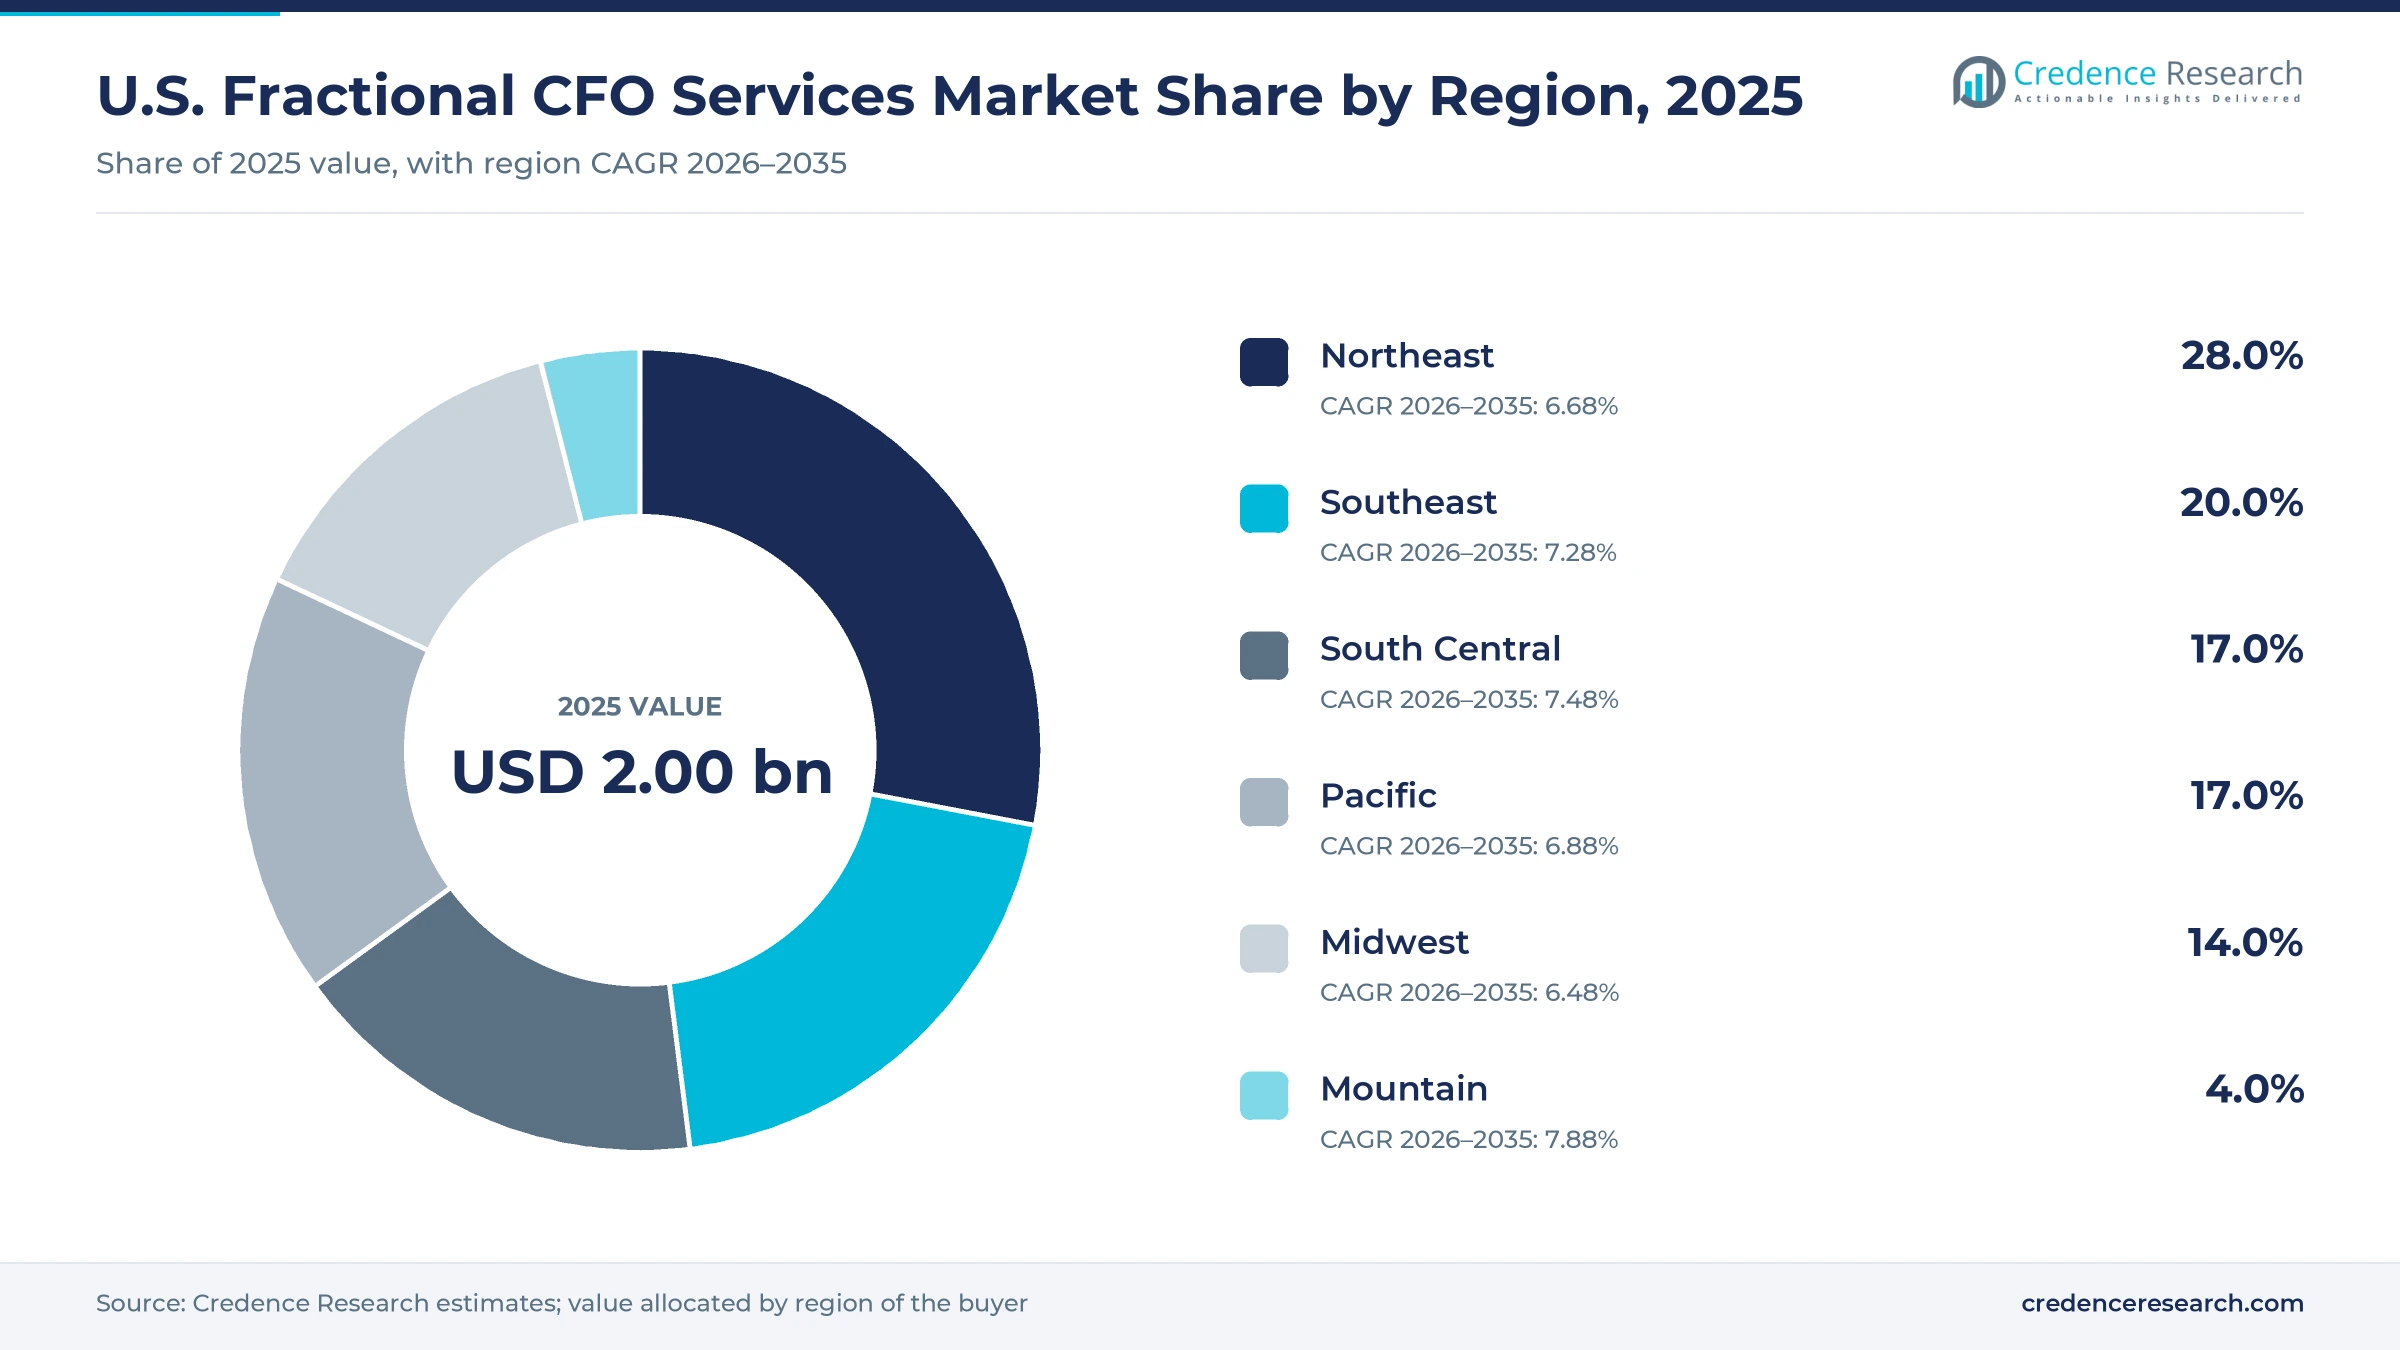
The U.S. fractional CFO services market was valued at USD 2.00 billion in 2025 and is projected to increase from USD 2.15 billion in 2026 to USD 3.95 billion by 2035, registering a CAGR of 7.00% during 2026–2035. Demand comes from venture-backed startups, small and midsize businesses and private equity portfolio companies that buy part-time finance leadership, FP&A and fundraising support instead of hiring a full-time chief financial officer. The Northeast region held the largest share, 28.0% of 2025 value, supported by dense startup and investor clusters around New York and Boston, while the Mountain region grows fastest at 7.88% a year as Salt Lake City and Colorado providers expand. Cost shapes the decision, because the Bureau of Labor Statistics put median pay for financial managers at $166,570 in May 2025, before bonuses and equity. On the commercial side, private equity is consolidating providers, and CenterOak Partners completed a majority recapitalization of Salt Lake City-based NOW CFO in June 2025.
What does fractional CFO spending include in the U.S.?
The market counts what U.S. companies pay outside providers for part-time chief financial officer leadership, financial planning and analysis, and fundraising or transaction support. Value covers monthly retainers, hourly CFO time and fixed-fee projects such as investor models, board decks, data rooms, budgets and interim cover while a permanent finance chief is recruited.
The estimate excludes stand-alone bookkeeping, tax preparation, audit and payroll, even when the same provider sells them in a bundle. Executive search fees, full-time CFO salaries and finance software subscriptions bought directly by clients are also excluded, because they sit outside the advisory fee paid for fractional finance leadership.
U.S. Fractional CFO Services Market Insights
- The market grows from USD 2.00 billion in 2025 to USD 3.95 billion by 2035, a 7.00% CAGR, as companies rent senior finance skills instead of hiring a full-time chief financial officer.
- The Northeast held 28.0% of 2025 value, and the New York-Newark-Jersey City metro alone counted about 2.6 million small businesses in 2022 SBA data.
- Fractional CFO engagements held 52.0% of 2025 value, with provider retainers listed at $3,000 to $15,000 a month for 20 to 60 hours.
- Pilot launched its Meridian AI system for bookkeeping and financial reporting on June 16, 2026, four months after releasing an AI bookkeeper.
- Carr, Riggs & Ingram acquired San Diego-based CFO Hub in March 2026, after CenterOak Partners recapitalized NOW CFO in June 2025.
CFO retainers lead while fundraising work grows fastest
Why do CFO retainers lead while fundraising work grows fastest?
Based on service, the market is categorized into fractional CFO, FP&A and fundraising support. Fractional CFO engagements led with 52.0% of 2025 value because owners buy a senior finance lead first, and Eagle Rock CFO lists retainers of $3,000 to $15,000 a month for 20 to 60 hours of CFO time. Kruze Consulting packages budgets, forecasts and burn-rate management into its fractional CFO service for startups. Fundraising Support grows fastest at 7.58% a year as venture rounds recover, with the NVCA reporting $320 billion of U.S. venture deal value across 15,352 deals in 2025. Each round needs models, data rooms and investor reporting prepared on a tight deadline.
Why do SMBs lead while PE portfolio companies grow fastest?
Based on client, the market is categorized into startups, SMBs and PE portfolio companies. SMBs led with 44.0% of 2025 value because the SBA Office of Advocacy counted about 36.2 million small businesses in June 2025, and most cannot justify a full-time finance chief. NOW CFO, which focuses mainly on small and midsize firms, employs more than 500 full-time professionals across more than 20 states. PE Portfolio Companies grow fastest at 7.66% a year as sponsors install finance leaders quickly after a deal, and CenterOak Partners and Unity Partners both invested in fractional CFO providers in June 2025. Renovus Capital Partners, the backer of SolomonEdwards, holds more than 30 U.S. portfolio businesses.
Why do retainers lead while project work grows faster?
Based on model, the market is categorized into retainer and project engagements. Retainer contracts led with 68.0% of 2025 value because most clients want a steady monthly finance cadence, and Eagle Rock CFO says retainers make up about 60% of engagements, which last 18 to 24 months on average. Annual contracts are also common, with a June 2026 Graphite Financial comparison noting that Pilot requires them. Project work grows fastest at 7.41% a year as transactions and leadership gaps create short, high-value assignments. Crist Kolder Associates put CFO turnover at 18.1% across Fortune 500 and S&P 500 companies in 2025, leaving many firms in need of interim cover.
| Segment Group | Leading Sub-segment | Share, 2025 | Fastest-growing Sub-segment | CAGR, 2026–2035 |
|---|---|---|---|---|
| By Service | Fractional CFO | 52.0% | Fundraising Support | 7.58% |
| By Client | SMBs | 44.0% | PE Portfolio Companies | 7.66% |
| By Model | Retainer | 68.0% | Project | 7.41% |
Request a Free Sample
Fill in your details and we'll send you a free sample report.
- Sample data tables & charts
- Research methodology
Startups, retainers, deal work and turnover lift demand
Startups and midmarket firms outsource finance leadership
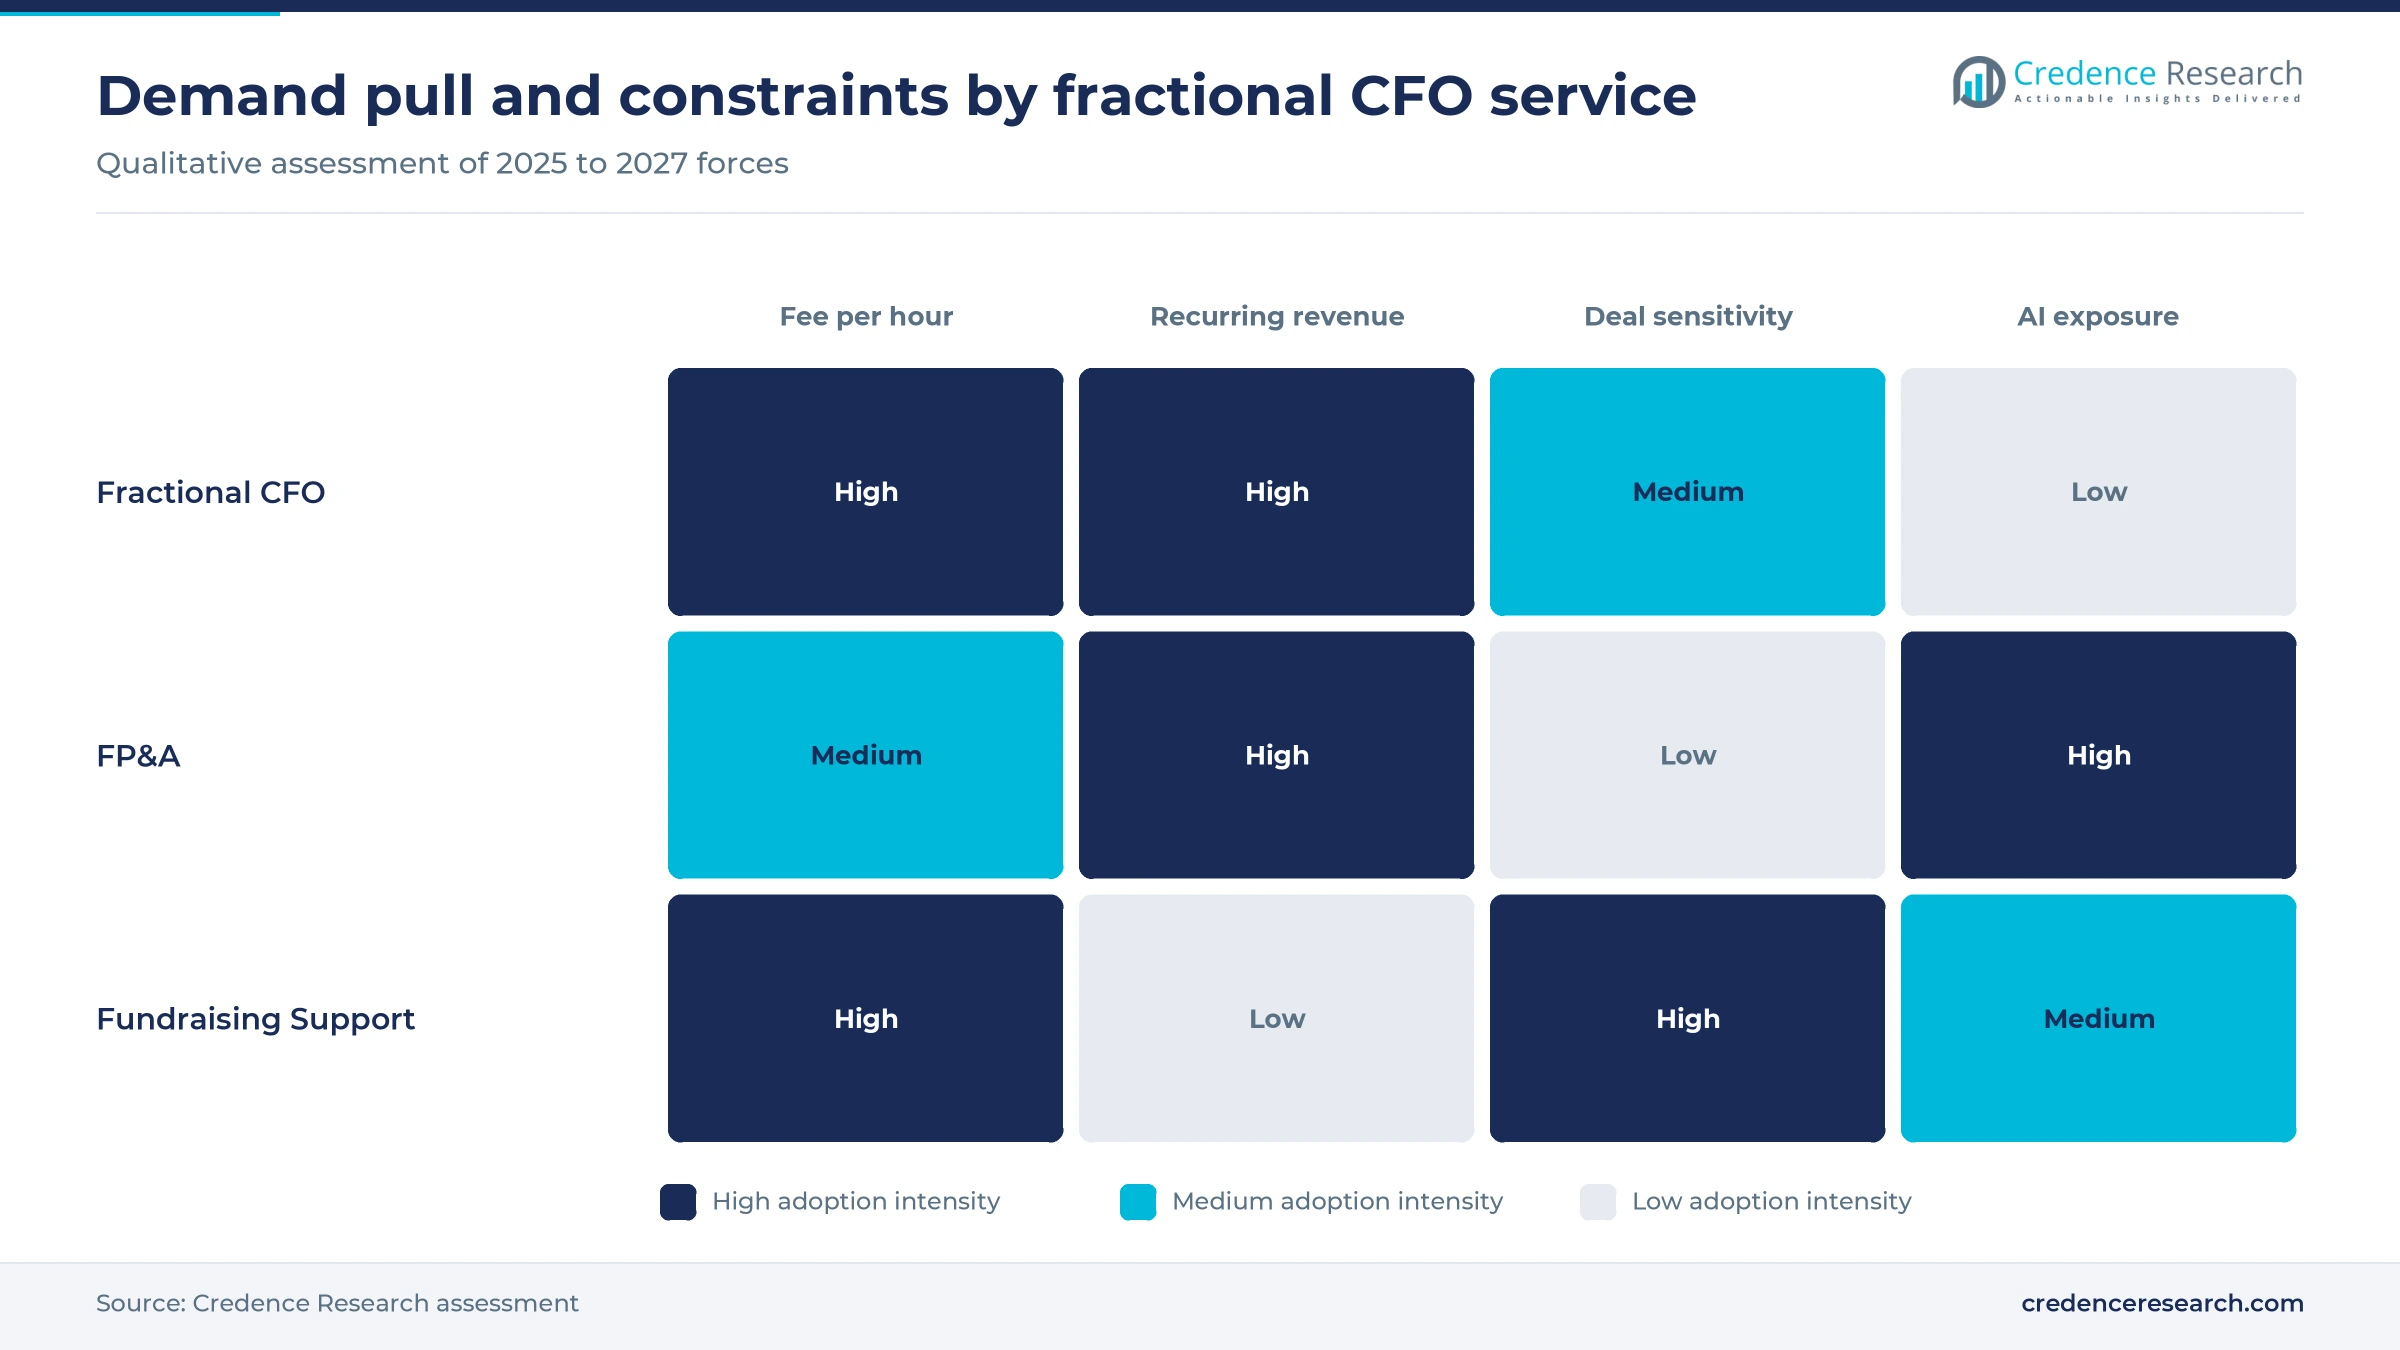
Young and midsize companies increasingly rent senior finance skills rather than hire them, because their revenue cannot yet carry a full executive salary. New firms keep arriving, and the Census Bureau reported 534,947 business applications in September 2026, up 0.5% from August on a seasonally adjusted basis. The installed base is also large, as the SBA Office of Advocacy counted about 36.2 million small businesses in June 2025, providing roughly 46% of private-sector jobs. Providers are scaling to meet this need, with Pilot saying it serves more than 1,000 high-growth startups and Graphite Financial citing more than 500 funded startups. In the Credence Research model this adds about 2.73 percentage points to annual growth to 2035, the largest single effect.
Subscription CFO retainers replace full-time hires
Monthly retainers give companies CFO judgment at a fraction of the cost of a permanent executive, which makes the subscription model the default purchase. The Bureau of Labor Statistics put median pay for financial managers at $166,570 in May 2025, and it expects employment in the occupation to grow 10% from 2025 to 2035, keeping senior finance pay high. Against that, Eagle Rock CFO lists fractional retainers of $3,000 to $15,000 a month and estimates that engagements cost 40% to 60% less than full-time equivalents. Talent is also scarce, because the AICPA counted 55,152 accounting graduates in the 2023-24 academic year, down 6.6%. In the Credence Research model this adds about 1.89 percentage points to annual growth to 2035, with retainers holding 68.0% of 2025 value.
Funding and deal work creates premium project demand
Fundraising rounds, acquisitions and exits need investor-grade models within weeks, which creates premium project work for fractional finance teams. The NVCA reported in April 2026 that U.S. venture deal value reached $320 billion across 15,352 deals in 2025, a 51% increase, with artificial intelligence taking 65.4% of value. Kruze Consulting says its startup clients have collectively raised more than $15 billion in venture funding, and it sells VC due diligence, M&A accounting and 409A valuations beside its CFO service. Private equity adds deal flow too, as Renovus Capital Partners reported more than 30 U.S. portfolio businesses in February 2026. In the Credence Research model this adds about 1.26 percentage points to annual growth to 2035, and fundraising support grows at 7.58% a year.
Record CFO turnover lifts demand for interim cover
Turnover among finance chiefs creates gaps that fractional and interim CFOs fill while companies search for a permanent hire. Russell Reynolds Associates reported in February 2026 that S&P 500 companies hired a record 106 CFOs in 2025, up 19% from 89 in 2024, while about 62% of exiting U.S. CFOs retired. Crist Kolder Associates measured 18.1% CFO turnover across Fortune 500 and S&P 500 companies in 2025 and projected 18.3% for 2026 in a September update. Succession planning is thin as well, because only 16% of CFOs say their organization has a proactive plan, according to the same Russell Reynolds index. As a result, more buyers book short engagements, and project work grows at 7.41% a year in the Credence Research estimate.
AI close tools and PE roll-ups reshape the CFO bench
Shift to AI-assisted close and reporting
Providers are moving routine close work onto AI systems so that CFO hours go to analysis, forecasting and investor work instead. Pilot launched Meridian on June 16, 2026, at the Scaling New Heights conference in Orlando, describing an AI system that automates onboarding, reconciliation and real-time reporting under existing staff. That launch came four months after Pilot released its AI bookkeeper, and its CEO said three out of four accounting firms were turning away clients for lack of capacity. Labor supply explains the push, because the AICPA counted 28,082 new CPA exam candidates in 2024, roughly 34% fewer than in 2023. Tools for AI in accounting therefore let each fractional CFO cover more clients at similar quality.
Rise of private equity-backed CFO platforms
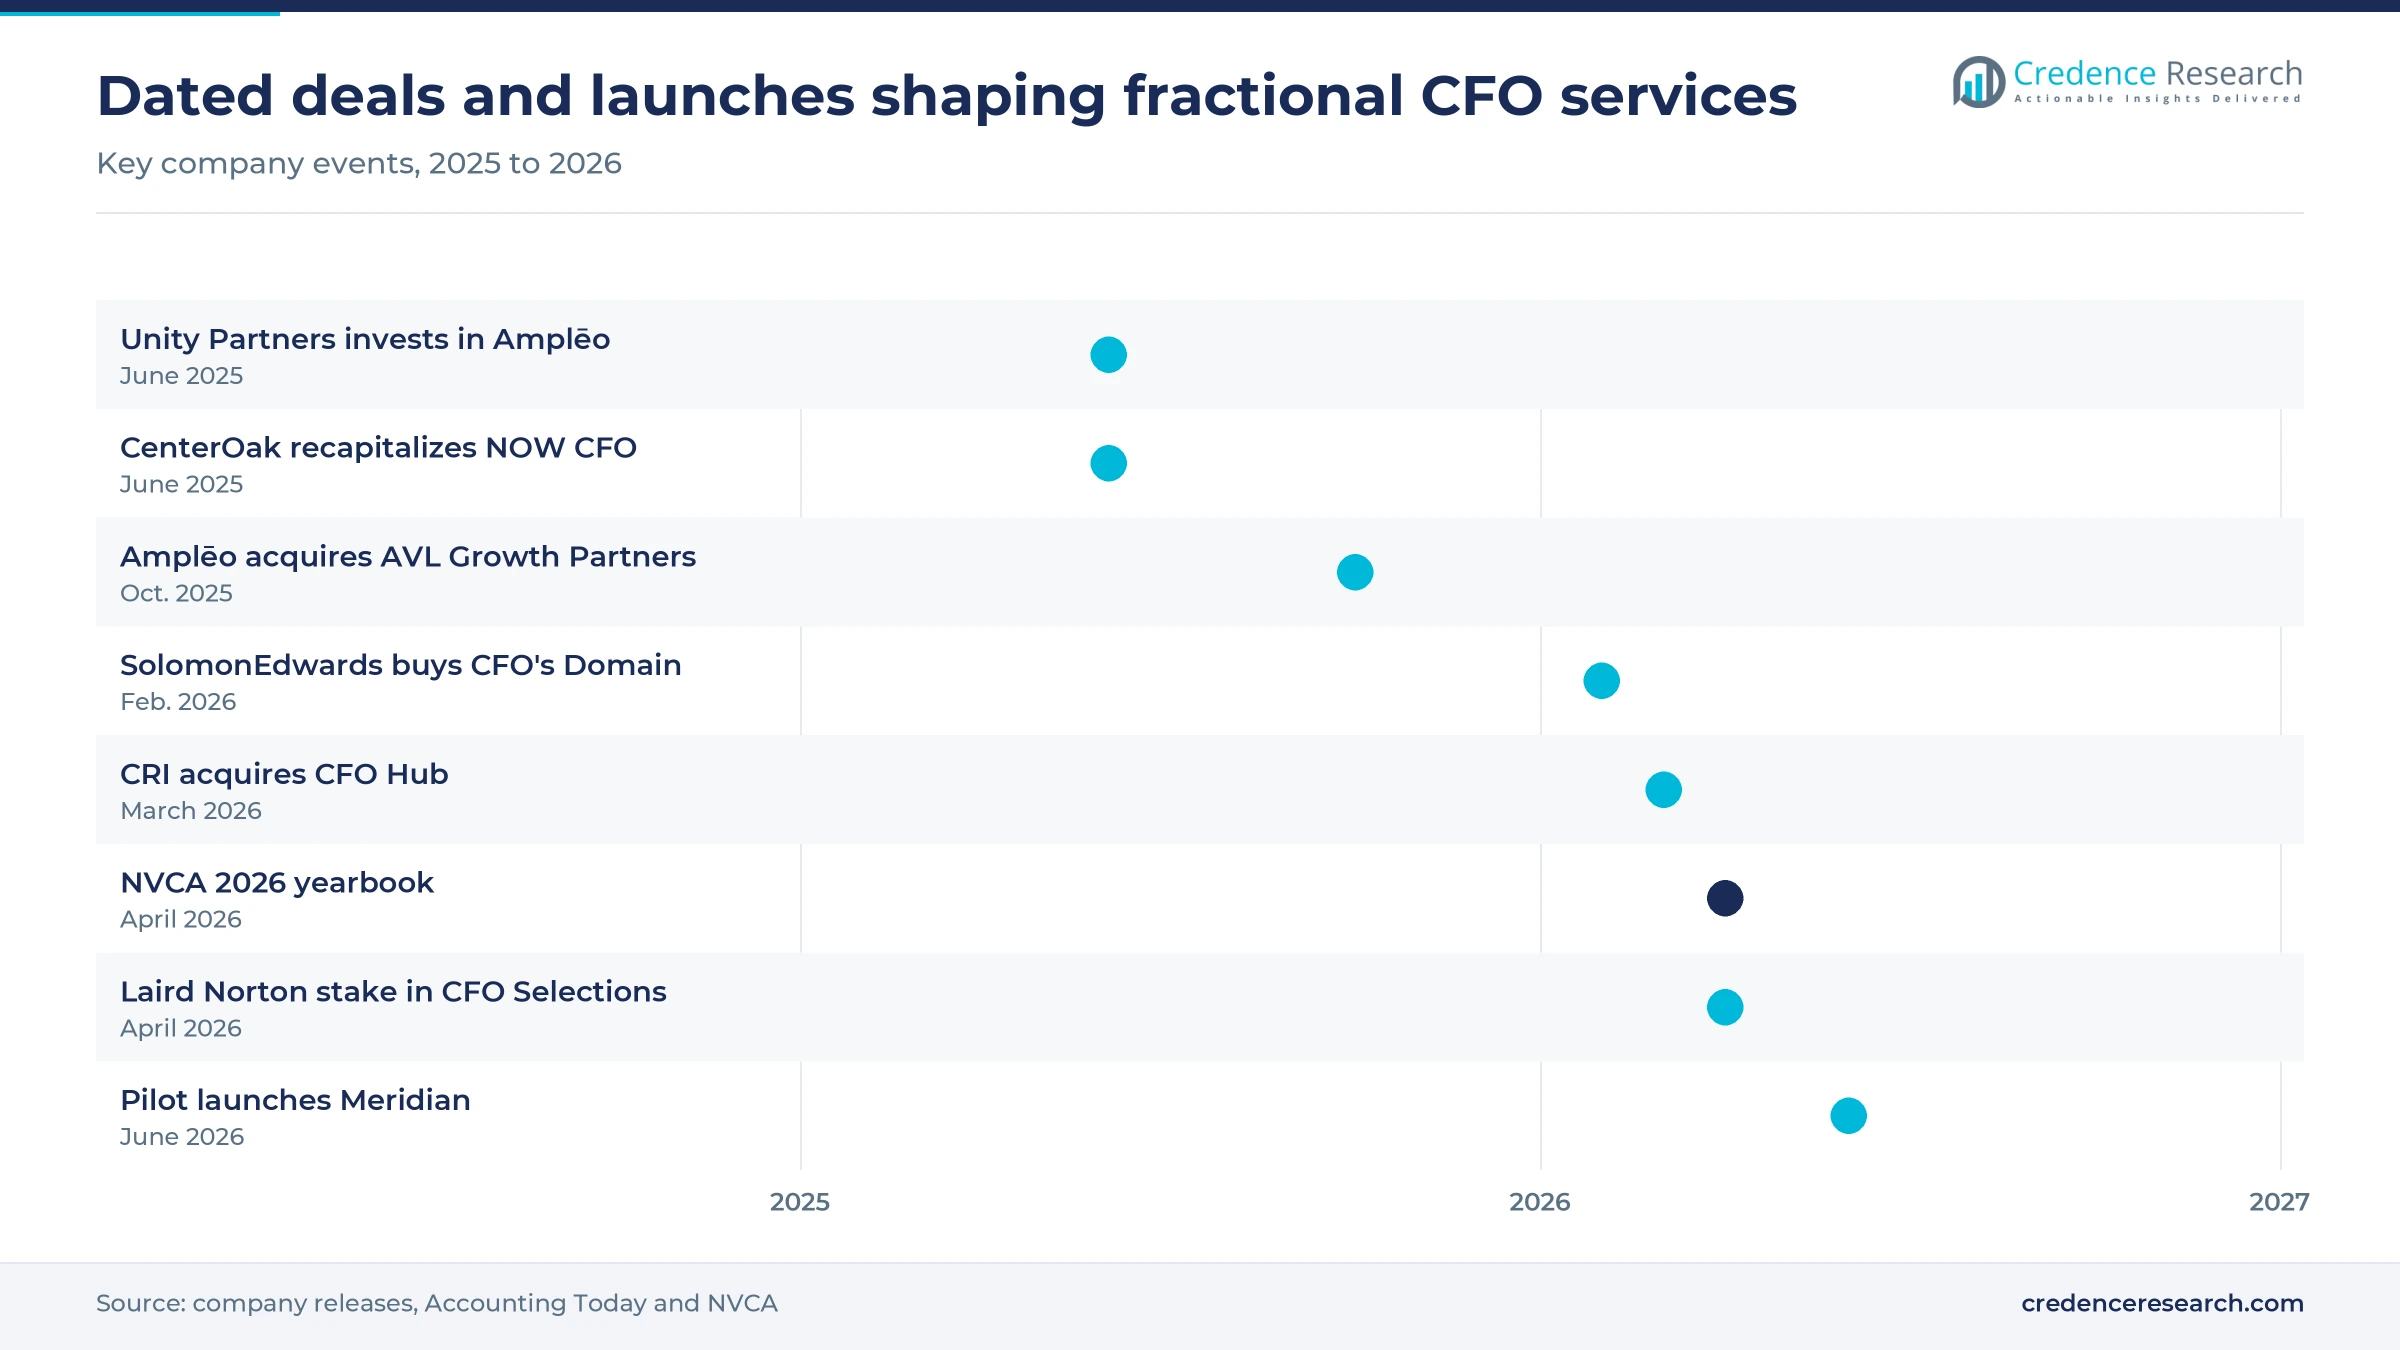
Private equity and large accounting firms are rolling up fractional CFO providers into national platforms with deeper benches. CenterOak Partners completed a majority recapitalization of NOW CFO on June 30, 2025, and Unity Partners invested in Amplēo the same month. Amplēo then acquired Boulder-based AVL Growth Partners in October 2025, its fifth acquisition of the year, which it said doubled its finance and accounting capability. Carr, Riggs & Ingram acquired San Diego-based CFO Hub in March 2026, extending its reach into California, and Laird Norton Company took a minority stake in CFO Selections in April 2026. As a result, buyers can now source fractional CFOs from firms with hundreds of professionals rather than solo practitioners.
Opening in support for PE portfolio companies
Private equity portfolio companies offer an opening because sponsors need reliable reporting soon after every acquisition, often before a permanent CFO is in place. SolomonEdwards acquired Los Angeles-based CFO's Domain in February 2026 to add Office of the CFO consulting and interim placement, backed by Renovus Capital Partners and its more than 30 U.S. portfolio businesses. Leadership churn adds to the need, as Russell Reynolds Associates found that 57% of incoming CFOs worldwide in 2025 were first-time finance chiefs. CenterOak Partners and Unity Partners, both Dallas firms, invested in fractional providers in June 2025. Providers that standardize 100-day finance plans can therefore capture PE portfolio companies, which grow at 7.66% a year.
Opening in bundled finance services for SMBs
Bundled finance services give providers an opening with small firms that want one vendor for books, payroll and strategic advice. Escalon groups CFO services, bookkeeping and accounting with HR, payroll and insurance, and it says it has served more than 20,000 organizations since 2006. Amplēo pairs fractional CFOs with fractional marketing and HR leaders and says it is trusted by more than 14,000 companies. Kruze Consulting combines accounting, tax and CFO advisory for startups and holds California Board of Accountancy license number 7637. Providers that connect CFO advice with payroll and HR solutions can therefore raise revenue per client while lowering the switching risk.
Talent gaps, churn and cheap bundles test provider margins
Can providers hire enough senior finance talent?
Talent supply is the tightest constraint, because every fractional engagement depends on an experienced finance leader. The AICPA counted 55,152 accounting graduates in the 2023-24 academic year, down 6.6% after a 9.6% fall a year earlier, and new CPA exam candidates dropped to 28,082 in 2024. This limits how fast providers can add CFO capacity, so firms raise rates, recruit former investors and bankers, and lean on AI tools to stretch each partner across more clients.
Do clients outgrow fractional CFO engagements?
Successful clients eventually hire a full-time CFO, which caps the lifetime value of each relationship. Eagle Rock CFO puts the average fractional engagement at 18 to 24 months, with a transition overlap of three to six months when a permanent hire arrives. Providers therefore must replace a large share of their book every two years, which raises sales costs. Many respond by selling search support, controller services and board work to stay with growing clients.
Will venture concentration narrow the startup client base?
Venture money is concentrating in fewer, larger deals, which can leave many small startups short of funds for outside CFO help. The NVCA reported that artificial intelligence took 65.4% of U.S. venture deal value in 2025, and Census Bureau data showed business applications falling 7.3% from November to December 2025. Seed-stage clients feel this pressure first, so providers diversify toward SMBs and PE portfolio companies with steadier finance budgets and longer engagements.
Do low-cost bundles pressure CFO pricing?
Software-led bundles built on small business accounting software are pushing down the price buyers expect for finance support, especially at early-stage startups. A June 2026 Graphite Financial comparison put Zeni's full CFO engagement at $2,500 to $5,000 or more a month, at the low end of the $3,000 to $15,000 range common for fractional retainers. Pilot's June 2026 Meridian launch shows how AI can automate the close work that used to justify fees. Senior providers therefore stress fundraising, board and transaction expertise to defend pricing.
The Northeast leads as the Mountain region grows fastest
| Region | Value, 2025 (USD billion) | Share, 2025 | CAGR, 2026–2035 |
|---|---|---|---|
| Northeast | 0.56 | 28.0% | 6.68% |
| Southeast | 0.40 | 20.0% | 7.28% |
| South Central | 0.34 | 17.0% | 7.48% |
| Pacific | 0.34 | 17.0% | 6.88% |
| Midwest | 0.28 | 14.0% | 6.48% |
| Mountain | 0.08 | 4.0% | 7.88% |
The Northeast leads on startup and investor density
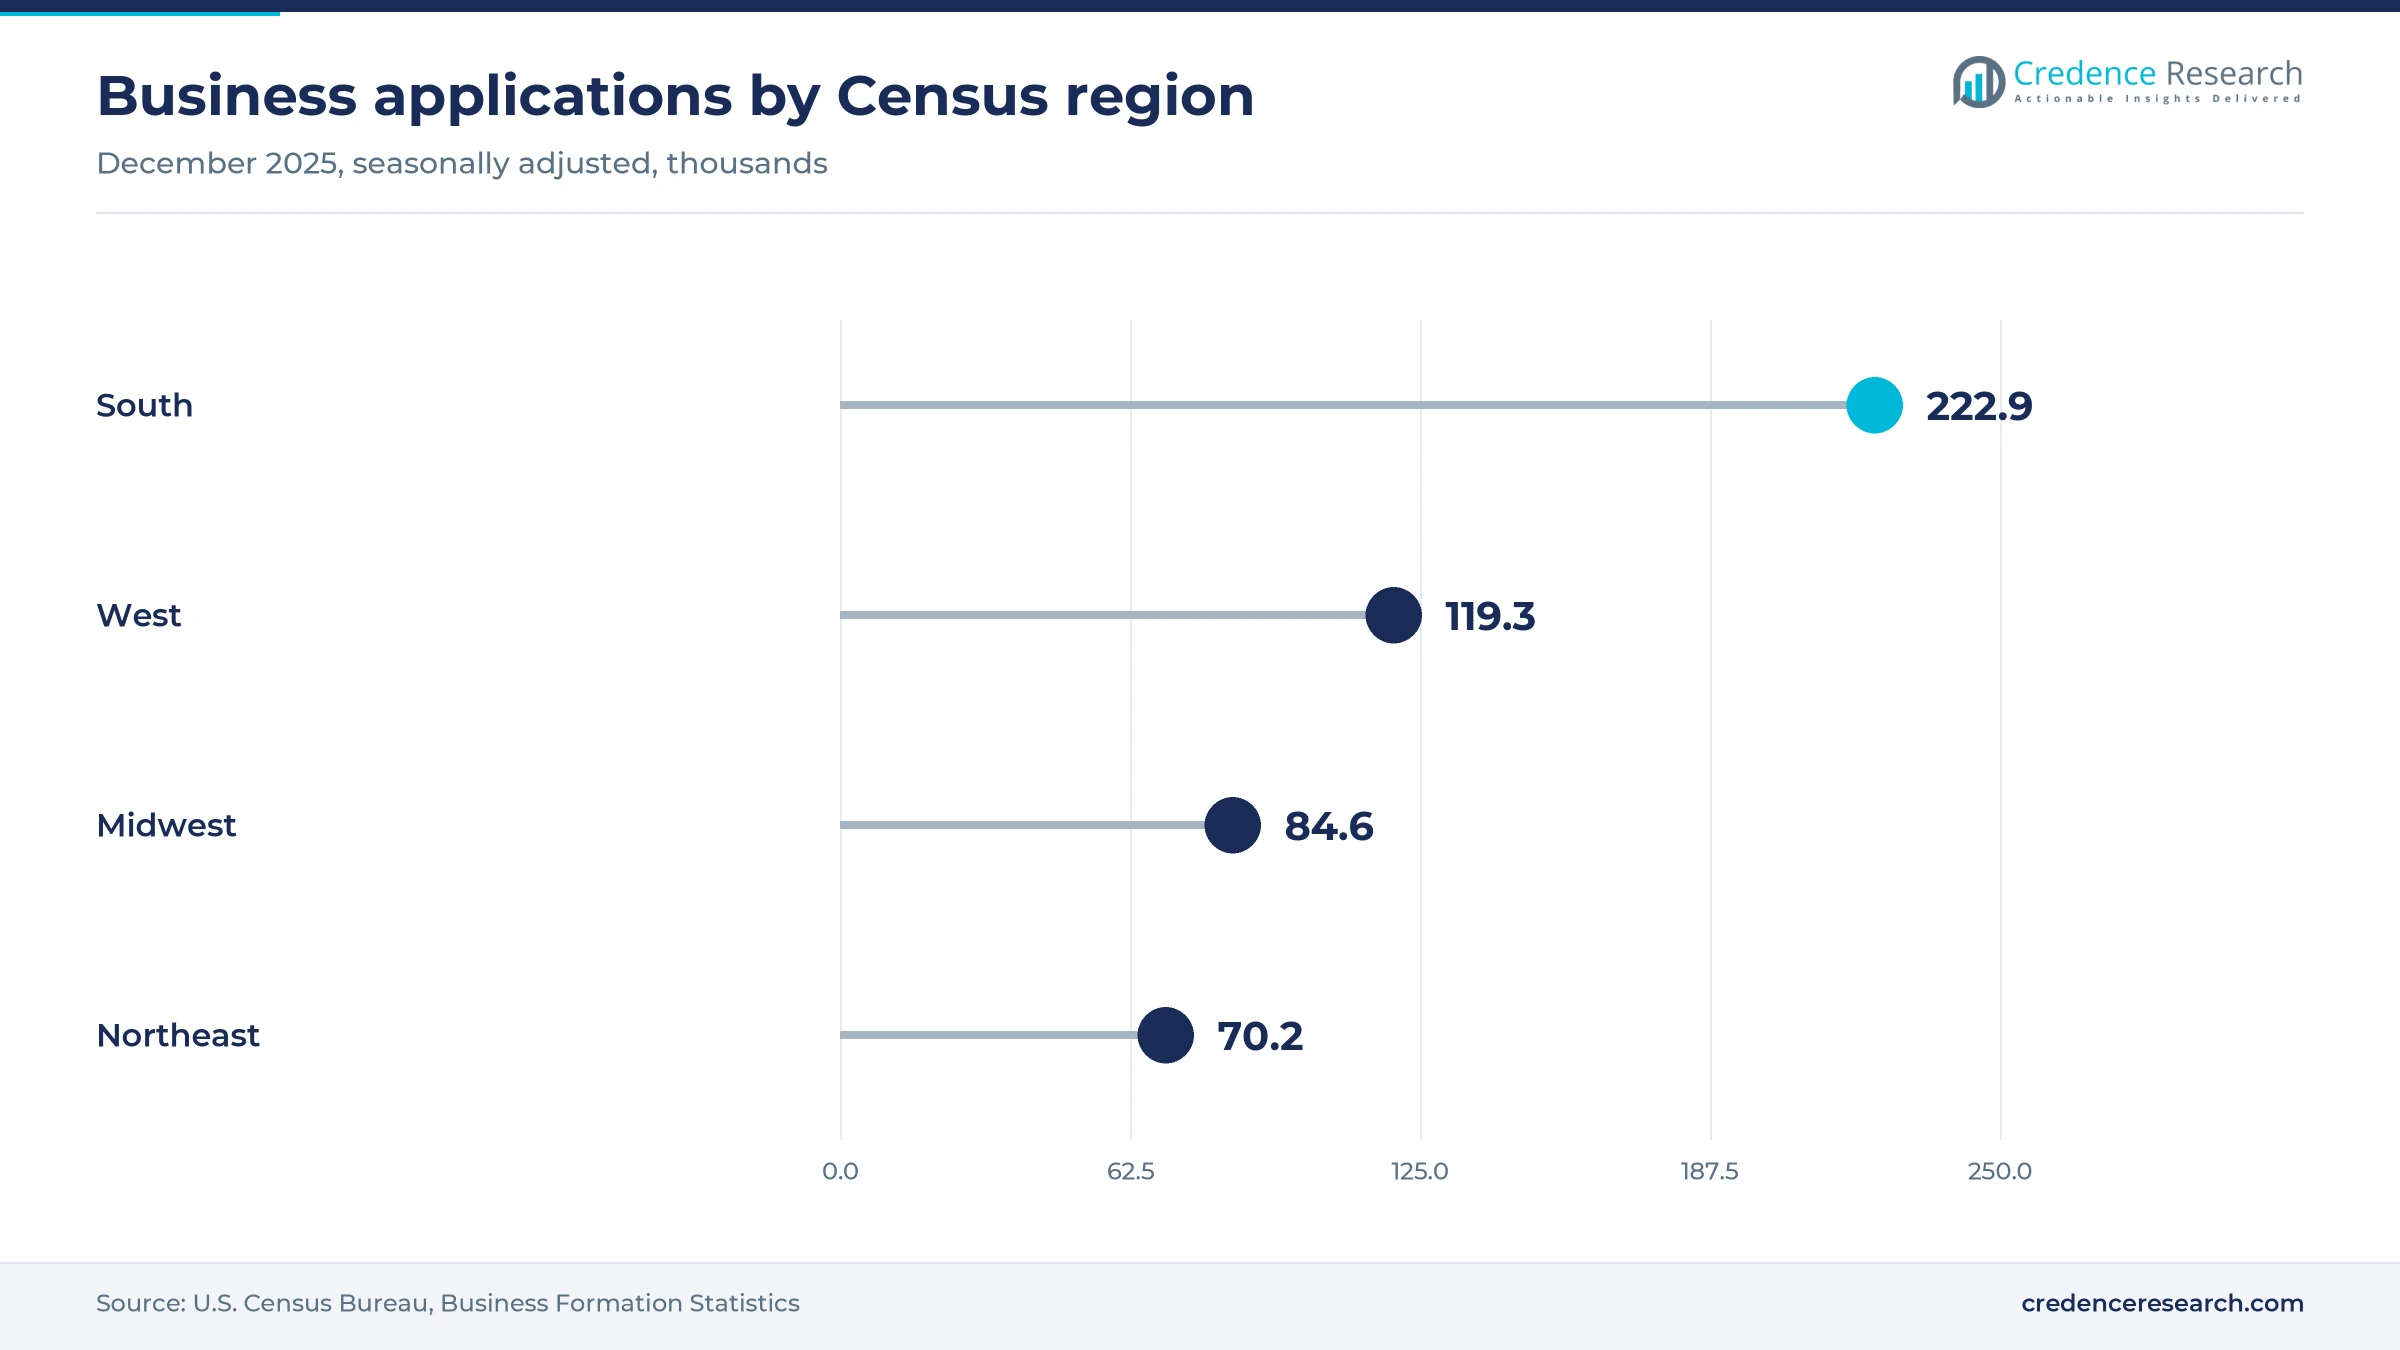
The Northeast held 28.0% of 2025 value and grows at 6.68% a year, the largest share of the six zones. Demand is concentrated around large business clusters, because SBA data showed about 2.6 million small businesses in the New York-Newark-Jersey City metro and 552,091 in the Boston area in 2022. Graphite Financial is headquartered in New York, and SolomonEdwards works from Philadelphia. Growth is slower, however, as the Northeast filed 70,229 business applications in December 2025, the fewest of any Census region.
The Southeast gains from new business formation
The Southeast held 20.0% of 2025 value and grows at 7.28% a year, faster than the national pace. New companies keep arriving, because the Census Bureau counted 222,924 business applications in the South in December 2025, more than any other Census region. Carr, Riggs & Ingram, based in Enterprise, Alabama, reported more than 2,600 employees and 41 offices in March 2026, when it added fractional CFO capacity through CFO Hub. Regional accounting firms are therefore building fractional finance teams for local clients.
South Central grows on Texas deal activity
The South Central region held 17.0% of 2025 value and grows at 7.48% a year, one of the faster rates. Texas anchors demand, and Dallas-based private equity firms CenterOak Partners and Unity Partners both invested in fractional CFO providers in June 2025. CFO Selections also operates in Texas, and Laird Norton Company took a minority stake in the firm in April 2026. The CFO Hub deal strengthened CRI's presence in Austin, which adds fractional coverage for growth companies across the zone.
The Pacific region serves venture-backed startups
The Pacific region held 17.0% of 2025 value and grows at 6.88% a year, close to the national pace. Venture-backed startups drive most of the spending, and Pilot and Kruze Consulting both serve that client base from San Francisco. Consolidation is active too, as CFO's Domain in Los Angeles and CFO Hub in San Diego were acquired in February and March 2026. The Los Angeles metro counted about 1.8 million small businesses in 2022 SBA data, which widens the SMB client pool beyond technology.
The Midwest relies on midsize manufacturers and services
The Midwest held 14.0% of 2025 value and grows at 6.48% a year, the slowest pace among the six zones. Demand comes mainly from established small and midsize firms, because SBA data counted 1,098,690 small businesses in the Chicago metro and 480,449 in the Detroit area in 2022. New formation is moderate, as the Midwest filed 84,612 business applications in December 2025, according to the Census Bureau. Venture activity is thinner than on the coasts, so retainer work dominates.
The Mountain region grows fastest on new platforms
The Mountain region held 4.0% of 2025 value and grows at 7.88% a year, the fastest pace among the six zones. Salt Lake City is home to NOW CFO, which has more than 500 full-time professionals, and Amplēo, based in Lehi, Utah, began as a part-time CFO provider in 1996. Amplēo acquired Boulder-based AVL Growth Partners in October 2025, and CFO Selections also operates in Colorado. SBA data counted 505,607 small businesses in the Phoenix metro and 378,321 in Denver in 2022.
Buyouts, acquisitions and AI launches from 2025 to 2026
| Development | Status and market relevance |
|---|---|
| In June 2025, CenterOak Partners completed a majority recapitalization of NOW CFO, a Salt Lake City outsourced finance provider with more than 500 professionals. | Closed; funds expansion across more than 20 states |
| In October 2025, Amplēo acquired Boulder-based AVL Growth Partners, its fifth acquisition of 2025. | Closed; doubles its finance and accounting capability |
| In February 2026, SolomonEdwards acquired Los Angeles-based CFO's Domain to add Office of the CFO consulting and interim placement. | Closed; extends its West Coast footprint |
| In March 2026, Carr, Riggs & Ingram acquired San Diego-based CFO Hub, which now operates as CRI CFO Hub. | Closed; adds fractional CFO and controller services |
| In June 2026, Pilot launched Meridian, an AI system for bookkeeping and financial reporting, at the Scaling New Heights conference. | Launched; frees CFO staff time from routine close work |
AI close engines and cloud models speed CFO work
- AI close engines automate onboarding, reconciliation and reporting, as Pilot described for its Meridian system launched in June 2026.
- Cloud FP&A models connect budgets, forecasts and burn-rate tracking, which Kruze Consulting includes in its fractional CFO service for startups.
- Investor reporting kits prepare board decks, data rooms and investor updates, a core part of the startup CFO offer that Pilot sells.
- Valuation and diligence tools support 409A valuations, M&A accounting and VC due diligence, which Kruze Consulting sells beside its CFO advisory.
Need a Custom Version of This Report?
Tailor the scope, geography, or segments to your exact requirements.
- Custom geography or segment scope
- Direct access to our analyst team
Startup specialists and PE-backed platforms compete
Competition in U.S. fractional CFO services splits between startup specialists, private equity-backed platforms and thousands of independent CFOs. Pilot and Kruze Consulting sell bookkeeping, tax and CFO advisory to venture-backed startups, with Pilot citing more than 1,000 high-growth startup clients. Graphite Financial, based in New York, focuses on funded companies and offers FP&A, financial modeling and CFO-level advice. Escalon bundles CFO services with HR, payroll and insurance and says it has served more than 20,000 organizations since 2006. Platforms backed by investors, including NOW CFO, Amplēo and CFO Selections, are adding offices and acquisitions to serve SMBs across several states. Accounting firms are entering through deals, as Carr, Riggs & Ingram did with CFO Hub in March 2026. Independent CFOs, such as Capitis Advisors in Maine, still serve a few clients each. Firms that pair financial advisory depth with automated close work are best placed to win larger accounts.
How do the leading fractional CFO providers position their offer?
| Company | Type | Role in the market |
|---|---|---|
| Graphite Financial | Startup finance outsourcer | Offers CFO advisory, FP&A and modeling to more than 500 funded startups |
| Escalon | Bundled back-office provider | Pairs CFO services with HR, payroll and insurance for 20,000 organizations since 2006 |
| Pilot | Startup finance platform | Serves more than 1,000 startups and launched its Meridian AI system in June 2026 |
| Kruze Consulting | Startup CPA firm | Sells fractional CFO, tax and 409A work to clients that raised more than $15 billion |
| NOW CFO | PE-backed SMB finance provider | Fields more than 500 professionals in more than 20 states after a June 2025 recapitalization |
| Independent CFOs | Solo practitioners | Serve a handful of local clients each, such as Capitis Advisors in Yarmouth, Maine |
Scale and deal skills decide which CFO firms win share
Credence Research's view is that bench scale and transaction skills, rather than hourly price alone, will decide share in U.S. fractional CFO services. Retainers will remain the base of the market because companies want monthly finance leadership without a $166,570 median salary plus equity. Growth above that base comes from fundraising, acquisitions and interim cover, which reward providers with former bankers and investors on staff. Private equity-backed platforms are consolidating independent firms, so mid-sized providers face a choice between specializing and selling. The Mountain and South Central regions deserve attention, because new platforms and Texas deal activity are expanding there fastest.
How fractional CFO spending was modeled
The report uses 2025 as the base year and 2035 as the forecast year, with market values taken from the Credence Research model. Service, client, model and regional splits are Credence Research estimates informed by public data and are not reported by any single source. Inputs include Census Bureau business formation statistics, Bureau of Labor Statistics occupational data, SBA Office of Advocacy small business profiles, NVCA venture data, AICPA workforce figures, company press releases and published provider price ranges. Values cover fees paid for fractional CFO leadership, FP&A and fundraising support, and they are cross-checked against provider client counts and retainer prices.
Steady retainer growth carries fractional CFOs to 2035
From USD 2.15 billion in 2026, the market is expected to reach USD 3.95 billion by 2035 as startups, SMBs and portfolio companies keep renting finance leadership instead of hiring it. Fractional CFO retainers will keep the largest service share, although fundraising support will grow faster as venture and acquisition activity continues. Private equity portfolio companies will gain on startups, because sponsors need dependable reporting soon after each deal. AI close tools such as Pilot's Meridian should let each CFO serve more clients, which will widen access for smaller firms. The Mountain region is expected to grow fastest, supported by platforms based in Salt Lake City, Lehi and Boulder.
Frequently Asked Questions
How big is the U.S. fractional CFO services market?
Which service holds the largest share?
Why do companies hire a fractional CFO?
Which region leads and which grows fastest?
Which client group grows fastest?
How is AI changing fractional CFO work?
What limits growth in fractional CFO services?
Who are the leading companies?
Table of Content
Chapter 1 Market Segmentation
- 1.1 Segmentation Framework
- 1.1.1 Product and Service Classification
- 1.1.2 Application and End-Use Classification
- 1.1.3 Technology and Solution Classification
- 1.1.4 Customer and Distribution Channel Classification
- 1.1.5 Geographic Segmentation
- 1.1.6 Market Segment Definitions and Boundaries
- 1.2 By Service
- 1.2.1 Fractional CFO
- 1.2.2 FP&A
- 1.2.3 Fundraising Support
- 1.3 By Client
- 1.3.1 SMBs
- 1.3.2 Startups
- 1.3.3 PE Portfolio Companies
- 1.4 By Model
- 1.4.1 Retainer
- 1.4.2 Project
Chapter 2 Introduction
- 2.1 Report Objectives and Scope
- 2.2 Product Definition and Industry Terminology
- 2.3 Market Inclusions and Exclusions
- 2.4 Research Process
- 2.4.1 Primary Research and Expert Interviews
- 2.4.2 Secondary Research and Source Review
- 2.4.3 Top-Down and Bottom-Up Estimation
- 2.4.4 Data Triangulation and Verification
- 2.5 Market Size Measurement Basis
- 2.5.1 2025: USD 2.00 billion → 2035: USD 3.95 billion
- 2.6 Historical and Forecast Reference Periods
- 2.6.1 Historical Period: 2018-2025
- 2.6.2 Base Year: 2025
- 2.6.3 Forecast Period: 2025-2035
- 2.7 Research Assumptions and Limitations
Chapter 3 Executive Summary
- 3.1 Market Snapshot and Key Findings
- 3.2 Base-Year Market Size, 2025
- 3.3 Forecast Market Size, 2035
- 3.4 Revenue and Volume Growth Outlook
- 3.5 Key Demand and Supply Indicators
- 3.6 Leading Market Segments
- 3.7 Fastest-Growing Market Opportunities
- 3.8 Regional Performance Highlights
- 3.9 Technology and Industry Transformation
- 3.10 Competitive Landscape Summary
- 3.11 Analyst View and Strategic Implications
Chapter 4 U.S. Fractional CFO Services Market Trends and Developments
- 4.1 Historical Industry Development, 2018-2025
- 4.2 Recent Market Trends and Developments
- 4.3 Demand and Customer Behavior Trends
- 4.4 Technology and Product Innovation
- 4.5 Artificial Intelligence, Automation and Digitalization
- 4.6 Local Manufacturing and Supply Chain Realignment
- 4.7 Industry Partnerships, Mergers and Acquisitions
- 4.8 Sustainability and Circular Economy Developments
- 4.9 Government and Private Sector Investment Trends
- 4.10 Emerging Business Models and Commercialization
- 4.11 Industry Developments and Announcements
Chapter 5 U.S. Fractional CFO Services Market Supply and Demand Analysis
- 5.1 Demand Trend and Consumption Analysis, 2018-2025
- 5.2 Demand Forecast, 2025-2035
- 5.3 Supply Chain Structure and Procurement Trends
- 5.4 Supply-Demand Gap and Bottlenecks
- 5.5 Import Dependence and Sourcing Structure
- 5.6 Regional Supply and Demand Concentration
Chapter 6 U.S. Fractional CFO Services Market Pricing Analysis
- 6.1 Pricing Structure and Measurement
- 6.2 Historical Pricing Trends, 2018-2025
- 6.3 Pricing Outlook, 2025-2035
- 6.4 Pricing by Product and Market Segment
- 6.5 Geographic Pricing Differences
- 6.6 Key Input, Energy, Labor and Logistics Costs
- 6.7 Contract Pricing and Purchasing Models
- 6.8 Pricing Sensitivity and Competitive Positioning
- 6.9 Price, Margin and Profitability Implications
Chapter 7 U.S. Fractional CFO Services Market Dynamics
- 7.1 Market Growth Drivers
- 7.1.1 Demand-Side Drivers
- 7.1.2 Technology and Innovation Drivers
- 7.1.3 Infrastructure and Investment Drivers
- 7.1.4 Regulatory and Policy Drivers
- 7.2 Market Restraints
- 7.2.1 Cost and Affordability Constraints
- 7.2.2 Technology and Adoption Barriers
- 7.2.3 Supply Chain and Operational Constraints
- 7.3 Market Challenges
- 7.3.1 Competitive Pressure and Margin Erosion
- 7.3.2 Skills, Infrastructure and Implementation Gaps
- 7.4 Emerging Market Opportunities
- 7.5 Market Dynamics Impact and Time-Horizon Assessment
Chapter 8 U.S. Fractional CFO Services Value Chain Analysis
- 8.1 Industry Value Chain Overview
- 8.2 Upstream Suppliers and Critical Inputs
- 8.3 Technology and Component Providers
- 8.4 Manufacturing or Service Delivery
- 8.5 Distribution, Channel Partners and Integrators
- 8.6 Downstream Applications and End Users
- 8.7 Value Addition and Profit Pools
- 8.8 Vertical Integration and Outsourcing
- 8.9 Supplier Concentration and Risk
- 8.10 Supply Chain Localization and Resilience
Chapter 9 U.S. Fractional CFO Services Market Regulations and Policies
- 9.1 Relevant Laws, Standards and Compliance Frameworks
- 9.2 Product, Service, Safety and Quality Requirements
- 9.3 Government Policies, Incentives and Subsidies
- 9.4 Imports, Exports and Trade Barriers
- 9.5 Public Procurement and Local Content Requirements
- 9.6 Data Protection, AI and Cybersecurity Compliance
- 9.7 Upcoming Policy Changes and Market Implications
Chapter 10 U.S. Fractional CFO Services Market Hotspots and Opportunities
- 10.1 Market Opportunity Mapping and Growth Hotspots
- 10.2 High-Growth Applications and Customer Groups
- 10.3 Underserved Markets and White-Space Opportunities
- 10.4 Emerging Technology and Product Opportunities
- 10.5 New Capacity and Investment Hotspots
- 10.6 Market Entry and Expansion Opportunities
- 10.7 Distribution and Partnership Opportunities
- 10.8 Near-Term and Long-Term Commercial Potential
- 10.9 Opportunity Attractiveness and Execution Risks
Chapter 11 U.S. Fractional CFO Services Market Outlook, 2025-2035
- 11.1 Market Size and Analysis
- 11.1.1 Revenue (Market Measurement: 2025: USD 2.00 billion → 2035: USD 3.95 billion)
- 11.1.2 Historical Market Size, 2018-2025
- 11.1.3 Base-Year Market Size, 2025
- 11.2 Market Forecast, 2025-2035
- 11.2.1 Revenue Forecast to 2035
- 11.2.2 CAGR and Year-on-Year Growth
- 11.2.3 Incremental Revenue Opportunity
- 11.3 Forecast Assumptions and Scenario Analysis
- 11.3.1 Base-Case Forecast
- 11.3.2 Optimistic and Conservative Scenarios
- 11.3.3 Technology, Pricing and Policy Sensitivities
- 11.4 Market Attractiveness and Growth Outlook
Chapter 12 U.S. Fractional CFO Services Market Segmentation and Outlook
- 12.1 Segmentation Summary and Market Shares, 2025
- 12.2 Largest and Fastest-Growing Segments
- 12.3 By Service - Market Size and Forecast, 2025-2035
- 12.3.1 Segment Definition and Scope
- 12.3.2 Historical Market Size, 2018-2025
- 12.3.3 Revenue Forecast, 2025-2035
- 12.3.4 Base-Year Market Share, 2025
- 12.3.5 Segment CAGR and Growth Drivers
- 12.3.6 Subsegment Market Size and Forecast
- 12.3.6.1 Fractional CFO
- 12.3.6.2 FP&A
- 12.3.6.3 Fundraising Support
- 12.3.7 Subsegment Pricing and Adoption Trends
- 12.3.8 Leading Suppliers and Competition
- 12.3.9 Regional Demand and Opportunities
- 12.4 By Client - Market Size and Forecast, 2025-2035
- 12.4.1 Segment Definition and Scope
- 12.4.2 Historical Market Size, 2018-2025
- 12.4.3 Revenue Forecast, 2025-2035
- 12.4.4 Base-Year Market Share, 2025
- 12.4.5 Segment CAGR and Growth Drivers
- 12.4.6 Subsegment Market Size and Forecast
- 12.4.6.1 SMBs
- 12.4.6.2 Startups
- 12.4.6.3 PE Portfolio Companies
- 12.4.7 Subsegment Pricing and Adoption Trends
- 12.4.8 Leading Suppliers and Competition
- 12.4.9 Regional Demand and Opportunities
- 12.5 By Model - Market Size and Forecast, 2025-2035
- 12.5.1 Segment Definition and Scope
- 12.5.2 Historical Market Size, 2018-2025
- 12.5.3 Revenue Forecast, 2025-2035
- 12.5.4 Base-Year Market Share, 2025
- 12.5.5 Segment CAGR and Growth Drivers
- 12.5.6 Subsegment Market Size and Forecast
- 12.5.6.1 Retainer
- 12.5.6.2 Project
- 12.5.7 Subsegment Pricing and Adoption Trends
- 12.5.8 Leading Suppliers and Competition
- 12.5.9 Regional Demand and Opportunities
- 12.6 Segment Growth Comparison
- 12.7 Segment Attractiveness and Priority Matrix
Chapter 13 U.S. Fractional CFO Services Geographic Market Outlook, 2025-2035
- 13.1 Domestic Market Distribution and Demand Clusters
- 13.2 State- or Province-Wise Market Size and Forecast, 2025-2035
- 13.3 City and Metropolitan Market Outlook
- 13.4 Industrial, Manufacturing and Commercial Clusters
- 13.5 Geographic Concentration of Key End Users
- 13.6 Local Pricing and Purchasing Differences
- 13.7 Domestic Production Facilities and Capacity Map
- 13.8 Local Infrastructure and Project Pipeline
- 13.9 State-Level Policy and Incentive Differences
- 13.10 Subnational Investment Hotspots and Opportunities
- 13.11 Distribution and Logistics Networks
- 13.12 Domestic Competitive Footprint
Chapter 14 U.S. Fractional CFO Services Technology, Innovation and Sustainability Outlook
- 14.1 Technology Landscape and Maturity
- 14.2 Product, Process and Service Innovation
- 14.3 AI, Automation and Digital Tools in the Industry
- 14.4 Technology Adoption and Performance Benchmarking
- 14.5 Innovation Pipeline and R&D Investment
- 14.6 Energy Efficiency and Resource Management
- 14.7 Sustainability, Recycling and Circularity
- 14.8 Technology Roadmap, 2025-2035
- 14.9 Risks of Obsolescence and Technology Substitution
Chapter 15 U.S. Fractional CFO Services Market Key Strategic Imperatives
- 15.1 Growth and Market Entry Priorities
- 15.2 High-Return Products and Segments
- 15.3 Pricing, Profitability and Cost Optimization
- 15.4 Technology Investment and Product Differentiation
- 15.5 Supply Chain Localization and Resilience
- 15.6 Distribution and Customer Acquisition
- 15.7 Partnership, Acquisition and Capacity Strategy
- 15.8 Regional Expansion Priorities
- 15.9 Short-, Medium- and Long-Term Actions
Chapter 16 Competition Outlook
- 16.1 Industry Competition Characteristics
- 16.2 Market Structure and Concentration
- 16.3 Market Share and Competitive Positioning, 2025
- 16.4 Company-Wise Revenue and Product Benchmarking
- 16.5 Production and Service Capacity Benchmarking
- 16.6 Technology, Pricing and Differentiation
- 16.7 Regional Footprint and Distribution Strength
- 16.8 Mergers, Acquisitions and Strategic Alliances
- 16.9 New Entrants and Competitive Threats
- 16.10 Porter's Five Forces and Industry Attractiveness
- 16.11 Competitive Outlook, 2025-2035
Chapter 17 Company Profiles
- 17.1 Company Coverage and Selection Criteria
- 17.2 Graphite Financial
- 17.2.1 Business Description
- 17.2.2 Company Ownership and Geographic Presence
- 17.2.3 Product and Service Portfolio
- 17.2.4 Manufacturing and Operating Footprint
- 17.2.5 Financial Performance and Investment
- 17.2.6 Market Share and Competitive Position
- 17.2.7 Technology and Innovation Capabilities
- 17.2.8 Strategic Alliances or Partnerships
- 17.2.9 Recent Developments
- 17.2.10 Growth Strategy and Outlook
- 17.3 Escalon
- 17.4 Pilot
- 17.5 Kruze Consulting
- 17.6 NOW CFO
- 17.7 Amplēo
- 17.8 CFO Selections
- 17.9 CRI CFO Hub
- 17.10 Independent CFOs
- 17.11 Other Relevant Market Participants
Note: Every listed company is profiled on the structure shown under the first company. The company list is preliminary and may change based on research findings, market developments, data availability and client requirements.
Chapter 18 Disclaimer
- 18.1 Research and Forecast Disclaimer
- 18.2 Data Source and Estimation Limitations
Note: The depth of individual sections depends on data availability for this market. Volume, capacity, trade and other unit-based metrics are included where applicable.