QR, wallets and sandbox rules reshape financial access
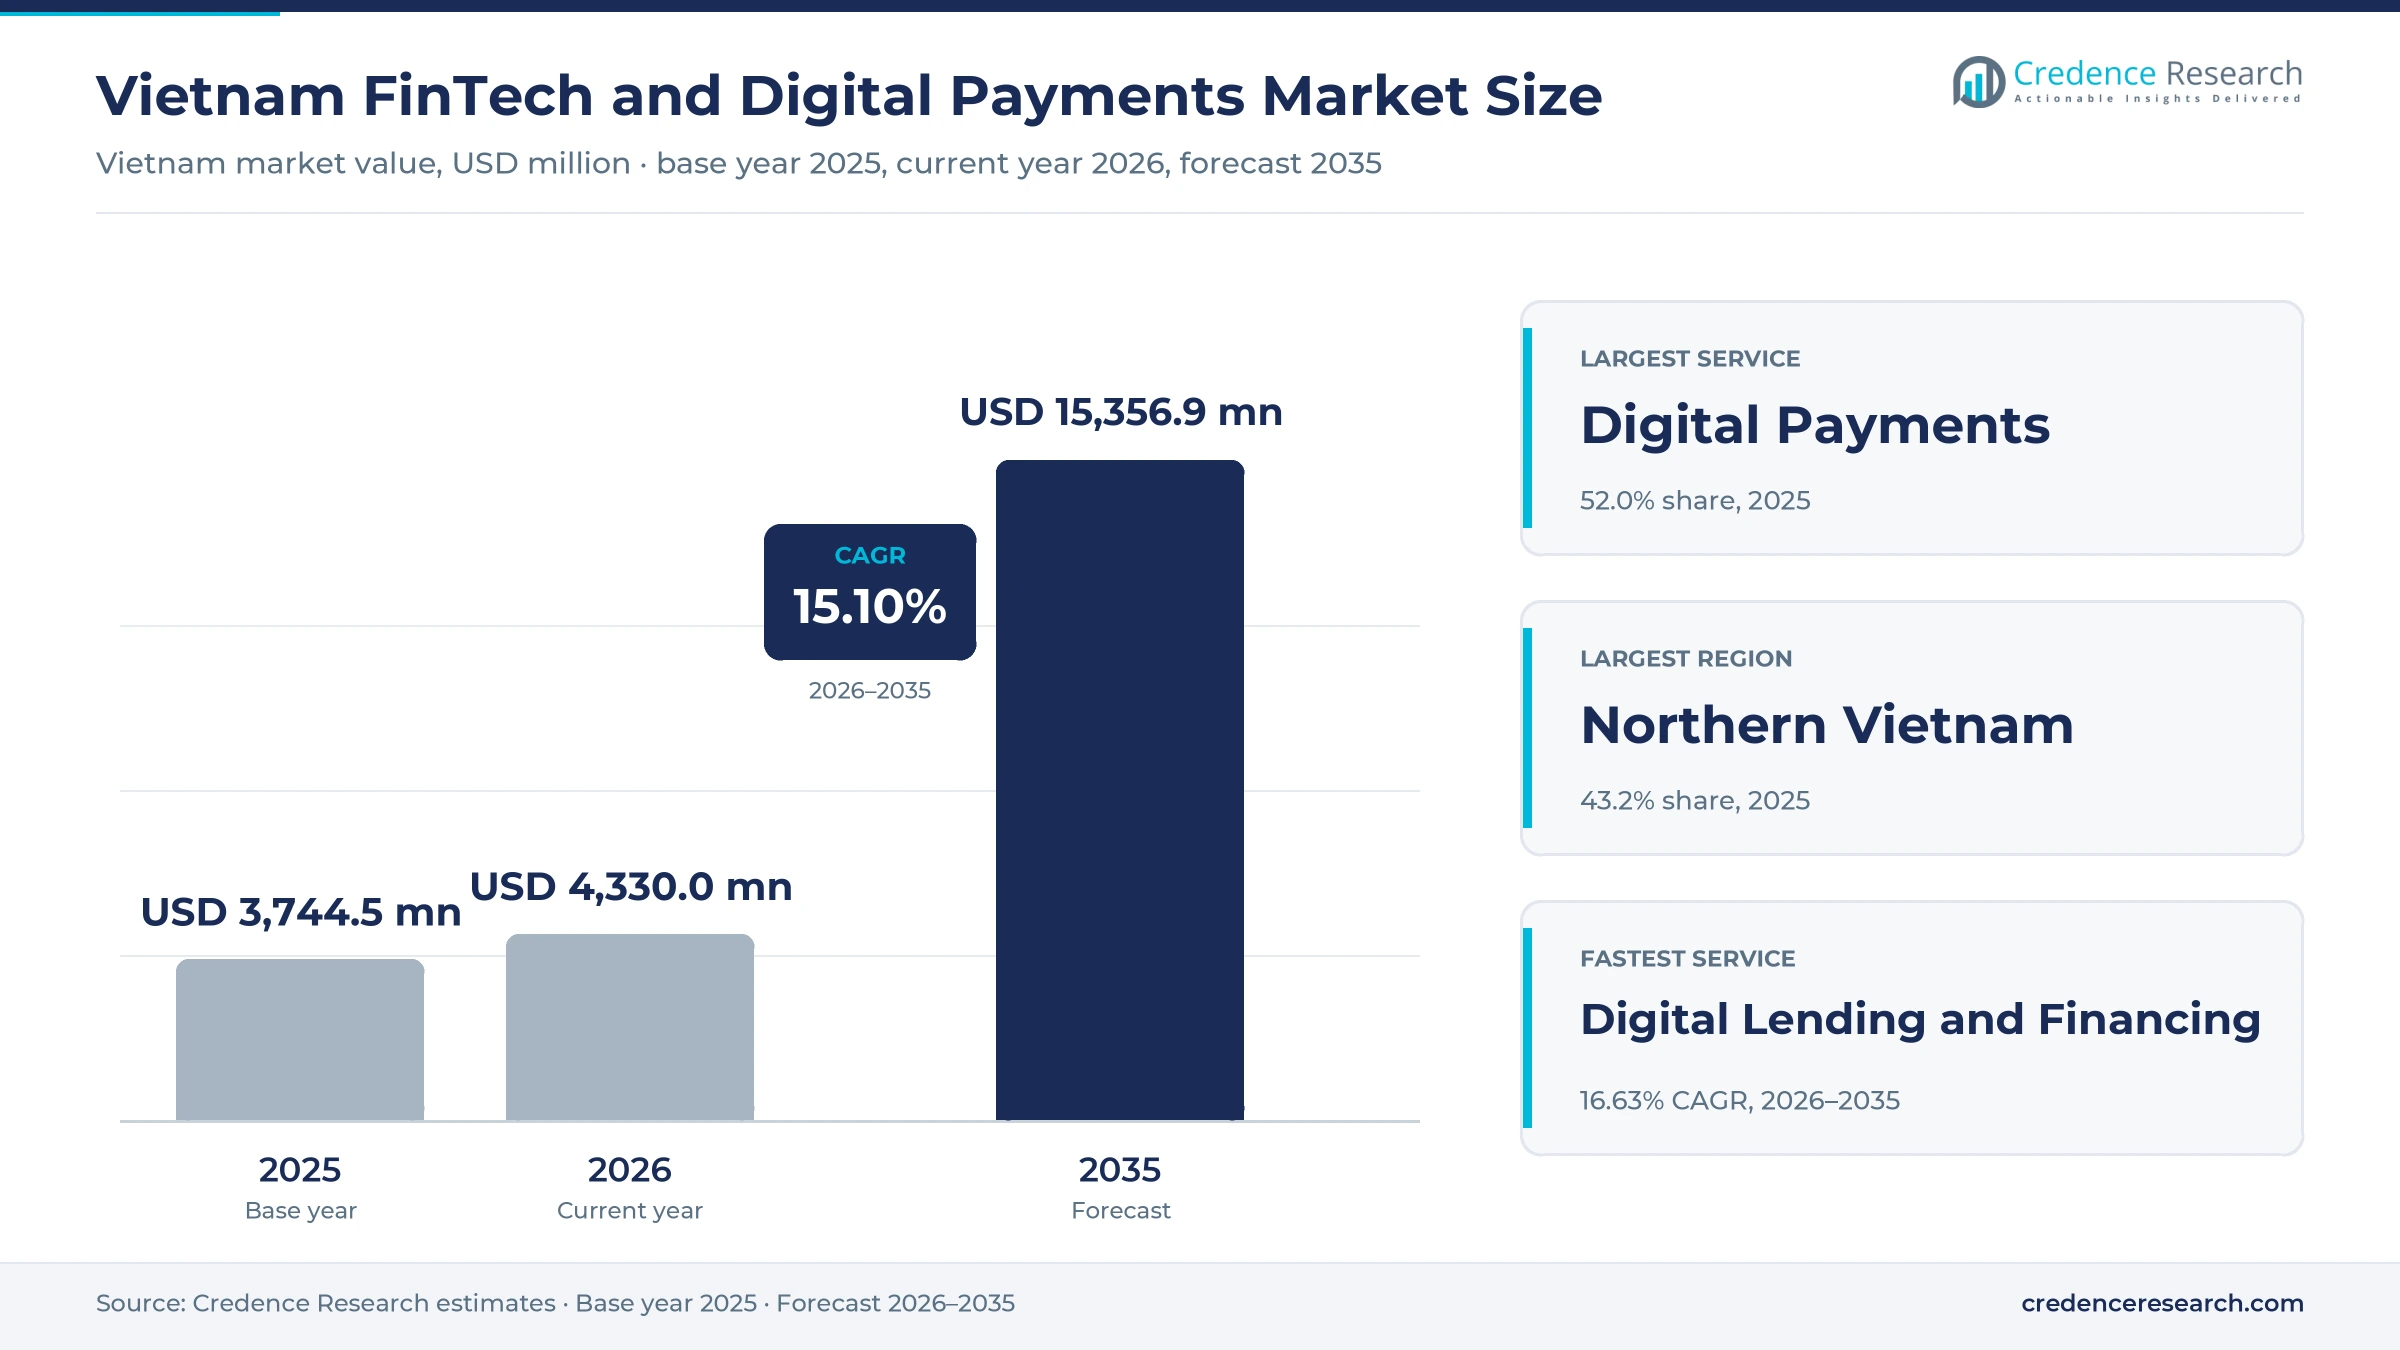
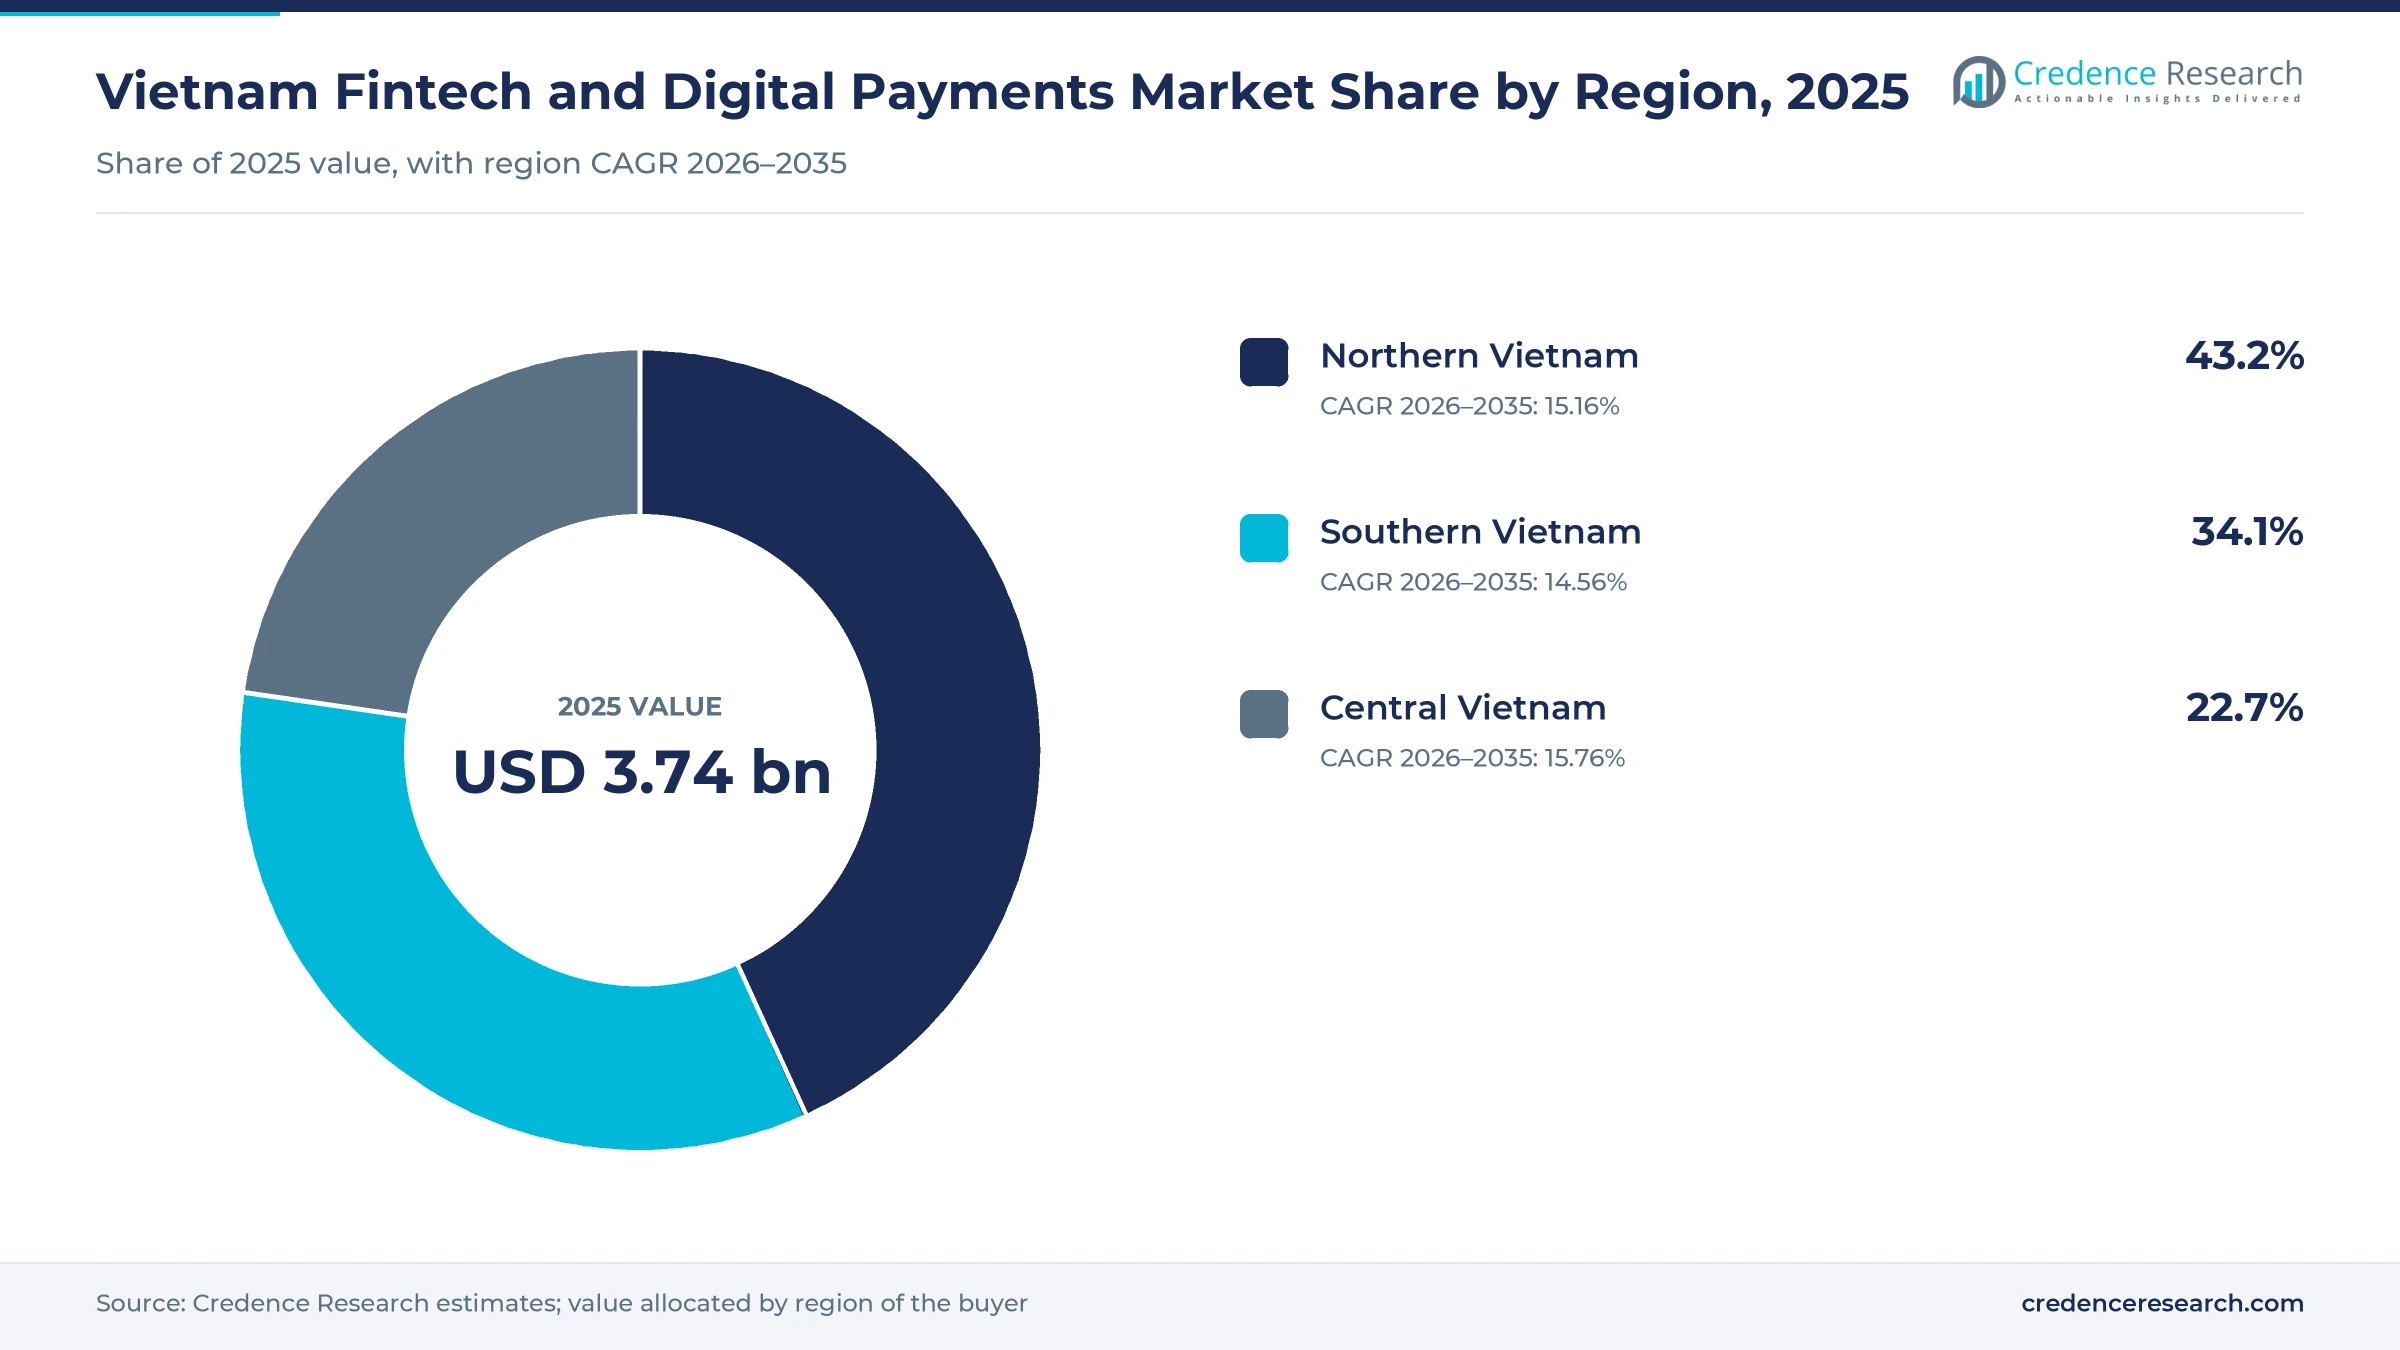
The Vietnam fintech and digital payments market was valued at USD 3.74 billion in 2025 and is projected to increase from USD 4.33 billion in 2026 to USD 15.36 billion by 2035, registering a CAGR of 15.10% during 2026–2035. Demand comes from households moving daily spending to QR codes and wallets, from merchants that must now keep digital sales records, and from small firms seeking credit outside collateral-based bank lending. Northern Vietnam held the largest regional share, 43.2% in 2025, supported by Hanoi and the fast-growing Red River Delta economy. Central Vietnam is the fastest-growing zone at 15.76% a year, helped by the financial center that opened in Da Nang in January 2026. The main commercial change is a formal legal path for new models, since the fintech sandbox decree took effect on July 1, 2025 and covers credit scoring, open APIs and peer-to-peer lending.
Which provider income lines does this estimate count?
The market counts provider income from wallets, payment gateways, online lending, digital-only banking, online investing and insurance distribution. It covers transaction fees, merchant service fees, software subscriptions, origination fees and commissions, so it reports revenue earned by providers rather than the value of the money moved. Consumers buy through mobile apps, while merchants buy through acquirers, POS software and platform integrations.
The market excludes the interest margins that traditional banks earn on branch lending and excludes the gross value of transactions passing through national rails. Its value chain runs from licensed banks and the national switch through payment intermediaries, wallets and lenders to merchants, partner retailers and end users across the three zones.
Vietnam Fintech and Digital Payments Market Insights
- The market grows from USD 3.74 billion in 2025 to USD 15.36 billion by 2035, a 15.10% CAGR, as provider income follows rising transaction counts and new credit products.
- Northern Vietnam held 43.2% of 2025 value, while Central Vietnam grows fastest at 15.76% a year from a smaller base near Da Nang.
- Digital Payments held 52.0% of 2025 value, and Mobile Applications carried 66.0% of value through consumer and merchant smartphone use.
- Decree 94/2025/ND-CP opened a sandbox on July 1, 2025 for credit scoring, open APIs and peer-to-peer lending, moving unlicensed models toward supervised testing.
- Kredivo agreed to buy Timo in March 2026 and planned USD 15 million of investment, showing how foreign lenders are entering through local digital banking platforms.
Payments lead while lending and embedded channels gain
Why do digital payments lead while digital lending grows fastest?
Based on service type, the market is categorized into digital payments, digital lending and financing, digital banking and neobanking, WealthTech and digital investments and InsurTech. Digital Payments led with 52.0% of 2025 value because Google's e-Conomy SEA report, cited by VnEconomy in November 2025, expected payments gross transaction value of USD 178 billion, the largest digital finance pool. Digital Lending and Financing grows fastest at 16.63% a year as State Bank data cited by Vietstock in May 2026 put small firms at only about 20% of VND19.4 quadrillion in total credit.
How do tax rules push small businesses onto digital tools?
Based on customer segment, the market is categorized into retail consumers, micro and small businesses, mid-market and large enterprises and underserved and newly banked users. Retail Consumers led with 58.0% of 2025 value because MoMo counted over 40 million active users in late 2025, according to Digital in Asia. Micro and Small Businesses grows fastest at 16.59% a year as Decree 70/2025/ND-CP, effective June 1, 2025, requires retail and catering households earning VND1 billion or more to issue cash register e-invoices, according to VietnamPlus.
Why do phones dominate as embedded partner channels expand?
Based on distribution channel, the market is categorized into mobile applications, web platforms, merchant and POS integrations, agent-assisted networks and embedded partner channels. Mobile Applications led with 66.0% of 2025 value because mobile transaction volume rose 36.62% in 2025 while ATM volume fell 17.3%, according to State Bank figures reported by VnEconomy. Embedded Partner Channels grows fastest at 17.21% a year as retailers now host credit at checkout, with MWG PayLater launched June 30, 2025 and Lotte Finance credit inside ZaloPay, according to Vietstock.
Which income lines carry the market and which grow fastest?
Based on revenue model, the market is categorized into transaction fees, merchant service fees, subscription and SaaS fees, lending and origination fees and distribution commissions. Transaction Fees led with 34.0% of 2025 value because the State Bank counted more than 15 billion cashless transactions in the first half of 2026, up 34.28%, according to VnEconomy. Subscription and SaaS Fees grows fastest at 16.99% a year as cash registers must now run software that sends e-invoices automatically, and VNPAY already serves nearly 300,000 businesses, according to Vietstock in February 2026.
| Segment Group | Leading Sub-segment | Share, 2025 | Fastest-growing Sub-segment | CAGR, 2026–2035 |
|---|---|---|---|---|
| By Service Type | Digital Payments | 52.0% | Digital Lending and Financing | 16.63% |
| By Customer Segment | Retail Consumers | 58.0% | Micro and Small Businesses | 16.59% |
| By Distribution Channel | Mobile Applications | 66.0% | Embedded Partner Channels | 17.21% |
| By Revenue Model | Transaction Fees | 34.0% | Subscription and SaaS Fees | 16.99% |
Request a Free Sample
Fill in your details and we'll send you a free sample report.
- Sample data tables & charts
- Research methodology
Cashless volume and new rules lift platform income
Rapid deepening of cashless payment activity
Cashless habits now reach ordinary daily spending, and every additional transaction creates fee income for wallets, gateways and acquirers. State Bank of Vietnam figures for 2025 show non-cash payments equal to 28 times GDP, with volume up 42.21% and value up 22.65%. QR code demand rose 50.94% by volume over the same year, and QR value climbed 124.06%, which shows that larger purchases are moving to scanned payments. This momentum continued in 2026, because the State Bank reported more than 15 billion transactions in the first half, according to VnEconomy in August 2026. As a result, Digital Payments kept 52.0% of 2025 market value.
Large connected consumer and digital-commerce base
A broad connected population gives platforms a large addressable base at low acquisition cost, and online retail gives those users a regular reason to pay digitally. World Bank data put account ownership at 70.6% of people aged 15 and over in 2024, up from 56.3% in 2022. World Bank data also show internet use at 84.2% of the population in 2024. Online retail demand reached about USD 31 billion in 2025, up roughly 25%, according to Ministry of Industry and Trade data reported by Dtinews. The ministry targets about USD 37 billion for 2026, and everyday services such as online food delivery add further checkout volume.
Regulatory formalization and controlled innovation
Clearer rules let licensed providers launch products that previously sat in legal gray areas, which encourages investment and bank partnerships. Decree 94/2025/ND-CP, issued April 29, 2025, opened a sandbox of up to two years for credit scoring, open APIs and peer-to-peer lending. Under Decree 368/2025/ND-CP, the Government raised the Mobile Money monthly limit tenfold to VND100 million, according to Vietstock in January 2026. Circular 40/2024/TT-NHNN also set a VND100 million monthly wallet cap and required biometric checks, according to Vision & Associates. Together, these measures moved wallets, telecom services and alternative credit into supervised categories, and they give banks a firmer basis for partnering with newer providers.
Household tax reform pulls small merchants online
Tax reform gives small sellers a practical reason to adopt digital tools, because accurate sales records have become a compliance need rather than a choice. Decree 70/2025/ND-CP took effect June 1, 2025 and requires eligible households to use cash registers that send e-invoices to tax authorities, according to VietnamPlus. Lump-sum tax is also being replaced with declaration-based tax from 2026, as speakers explained at a Hanoi conference on Sept. 25, 2025. VNPAY already serves nearly 300,000 businesses, according to Vietstock in February 2026, and 9Pay told the same Hanoi conference that merchant tools must stay simple and affordable. Micro and Small Businesses therefore grows at 16.59% a year.
Cross-border QR and bank tie-ups open new revenue
Rise of cross-border QR corridors for visitors and travelers
National QR rails are extending abroad, which adds foreign exchange and merchant income on top of domestic transfers. The Vietnam and Singapore link launched July 2, 2026 through NAPAS, Liquid Group and VietinBank, and the State Bank said the network now covers six countries. Inbound QR demand has a growing base, because Vietnam received nearly 10.6 million international visitors in the first five months of 2026, up 15%, the State Bank said. NAPAS also said in June 2026 that outbound links for Vietnamese users in China and South Korea should finish by the end of 2026. Sacombank rolled out Alipay scans through VietQRGlobal, according to Vietstock in April 2026.
Shift toward partnerships between banks, switches and fintechs
Scale is shifting from stand-alone wallets toward alliances that combine bank licenses, national rails and consumer reach. VNPAY and NAPAS signed a broad cooperation agreement on Feb. 11, 2026 covering new payment technology and cross-border QR, according to Vietstock. Kredivo then agreed to buy Timo in March 2026 and planned USD 15 million of investment over three years, according to Vietnam Investment Review. Cake by VPBank reached 5 million users in 2024, according to the Vietnam Banks Association, showing how a bank-sponsored app can gain mass reach. In this setting, Digital Payments providers increasingly rely on bank partners for credit and card products.
Opening in cash-flow lending for small firms
Small business credit is the clearest opening for platforms that hold transaction records, since collateral remains the main barrier at banks. Credit demand stays unmet, as the VCCI private economic report for 2025 found 75.5% of businesses cannot secure loans without collateral, according to VietnamPlus in May 2026. The Finance Ministry also proposed a sandbox for lending based on data and cash flow, according to Vietstock in May 2026. Meanwhile, the national inclusion strategy targets at least 300,000 small firms with bank loans by 2030, against about 290,000 today, according to The Investor. Providers serving Micro and Small Businesses hold the transaction data that lenders now need.
Opening in wealth and insurance distribution through apps
Investing and protection products offer platforms an opportunity to earn commissions from users who already trust a payment app. Vietnam ended 2025 with nearly 11.9 million securities accounts after a record 2.5 million additions, according to Vietnam Securities Depository data reported by The Hanoi Times. Finhay claims more than 2.7 million users and holds a securities license through Vina Securities, according to Fintech News Vietnam. Insurance demand produced about USD 4.59 billion of premiums in the first half of 2025, up 5%, according to Vietnam Investment Review. ZhongAn's Yifan Liu said at InsurTech 2026 in Ho Chi Minh City that penetration remains one-fifth to one-tenth of developed markets, according to Index.vn, which leaves room for insurance technology models.
Fraud, data law and thin tickets test fintech margins
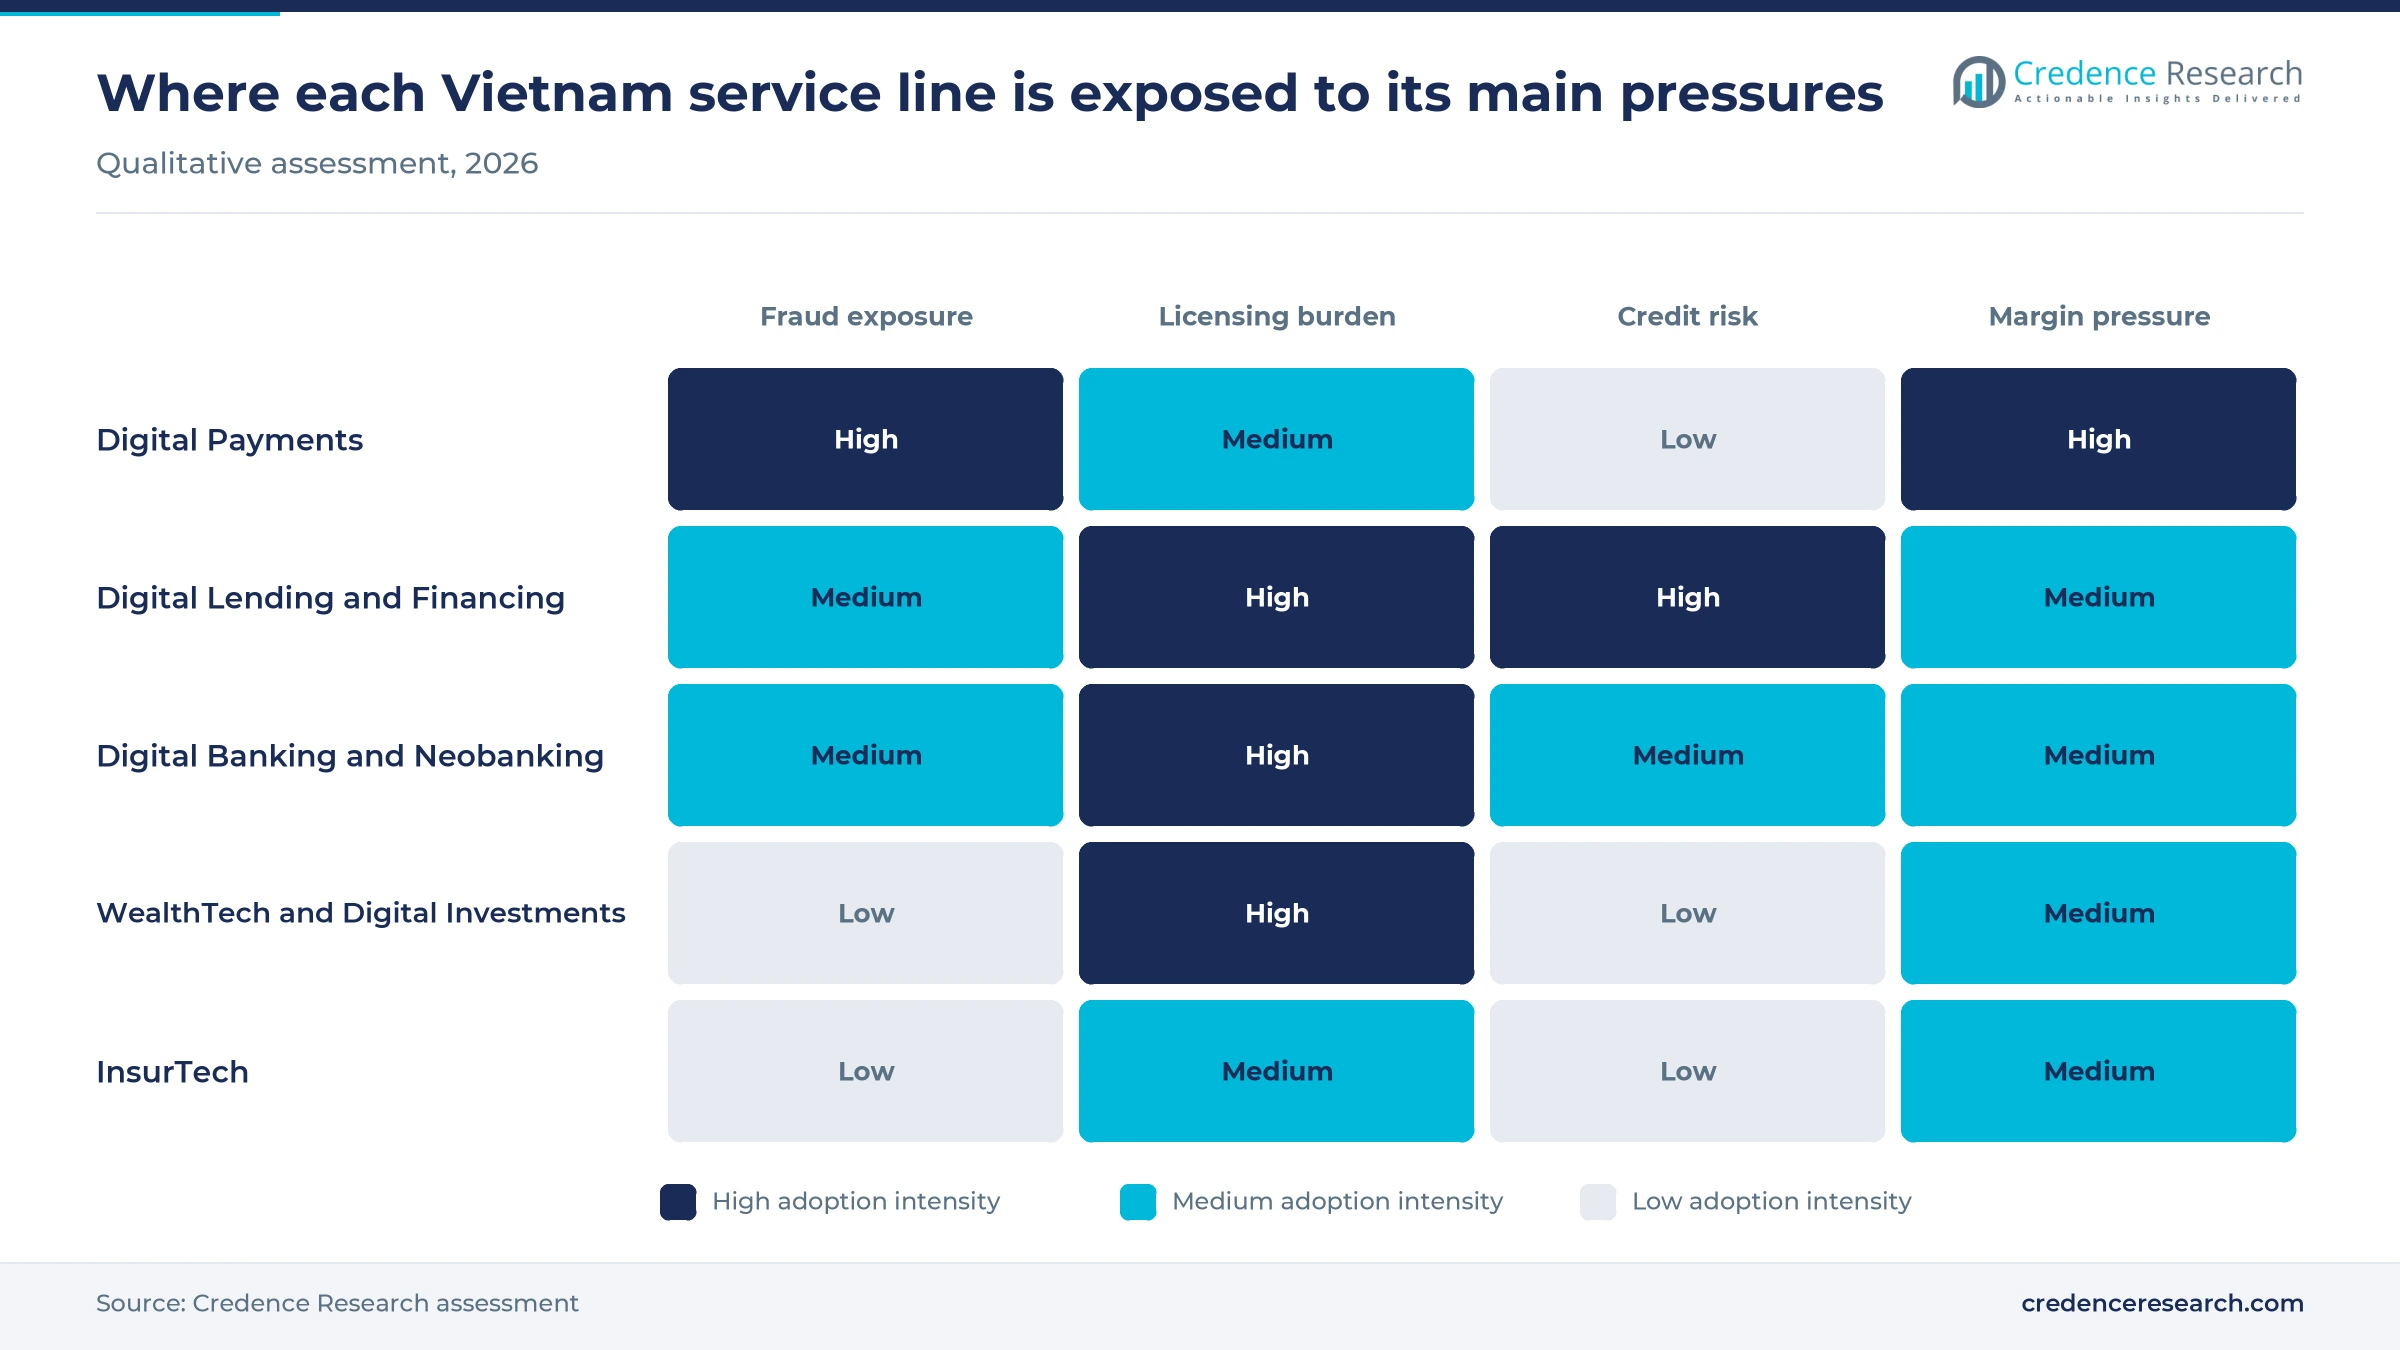
Payment fraud raises verification costs
Online fraud cost consumers VND18.9 trillion in 2024, according to National Cybersecurity Association figures cited by Asia Times. By Dec. 11, 2025, the State Bank had flagged 592,000 payment accounts and wallets, according to VietNamNet. Wallets and banks therefore carry heavier monitoring costs, and honest users face more interrupted transfers. Providers are answering with links to the SIMO fraud database. Smaller intermediaries still find this spending, including managed security services, harder to absorb than larger bank-backed rivals do.
Data law raises compliance exposure for scoring
The Personal Data Protection Law took effect Jan. 1, 2026 and allows fines of up to 5% of prior-year revenue for cross-border transfer violations, according to Chambers and Partners. Credit information firms must also obtain consent before using personal data for scoring. This affects lenders and wallets that rely on alternative data, since consent records and transfer assessments add legal cost. As a result, foreign-backed platforms must review regional data hubs, and many are likely to localize more processing and consent systems.
Weak borrower data limits safe credit growth
Lending growth is limited by poor borrower information, since only 20% to 25% of small firms obtain bank loans, according to speakers cited by Vietstock in April 2026. Thin records make underwriting difficult for online lending platforms that lack long repayment histories. PayLater competition adds pressure too, because active providers multiplied to 15 by 2024, according to Vietstock. Consequently, lenders risk adverse selection among first-time borrowers with short records. Many will respond by using merchant cash-flow records, smaller first loans and bank co-lending to limit early losses.
Thin tickets strain rural and wallet economics
Rural services struggle to earn enough per transaction, because Mobile Money handled more than 290 million transactions worth more than VND8.5 trillion by September 2025, according to State Bank figures reported by Vietstock. That implies an average near VND29,000, which leaves little fee income after agent and support costs. Telecom operators bear this pressure most directly, although rural demand is real, with 70% of the 10.89 million accounts in rural, remote or island areas. Higher limits under the new decree should help, provided bill payments and insurance raise average values.
Northern Vietnam leads and the central zone grows fastest
| Region | Value, 2025 (USD billion) | Share, 2025 | CAGR, 2026–2035 |
|---|---|---|---|
| Northern Vietnam | 1.62 | 43.2% | 15.16% |
| Southern Vietnam | 1.28 | 34.1% | 14.56% |
| Central Vietnam | 0.85 | 22.7% | 15.76% |
Northern Vietnam leads on Hanoi and delta output
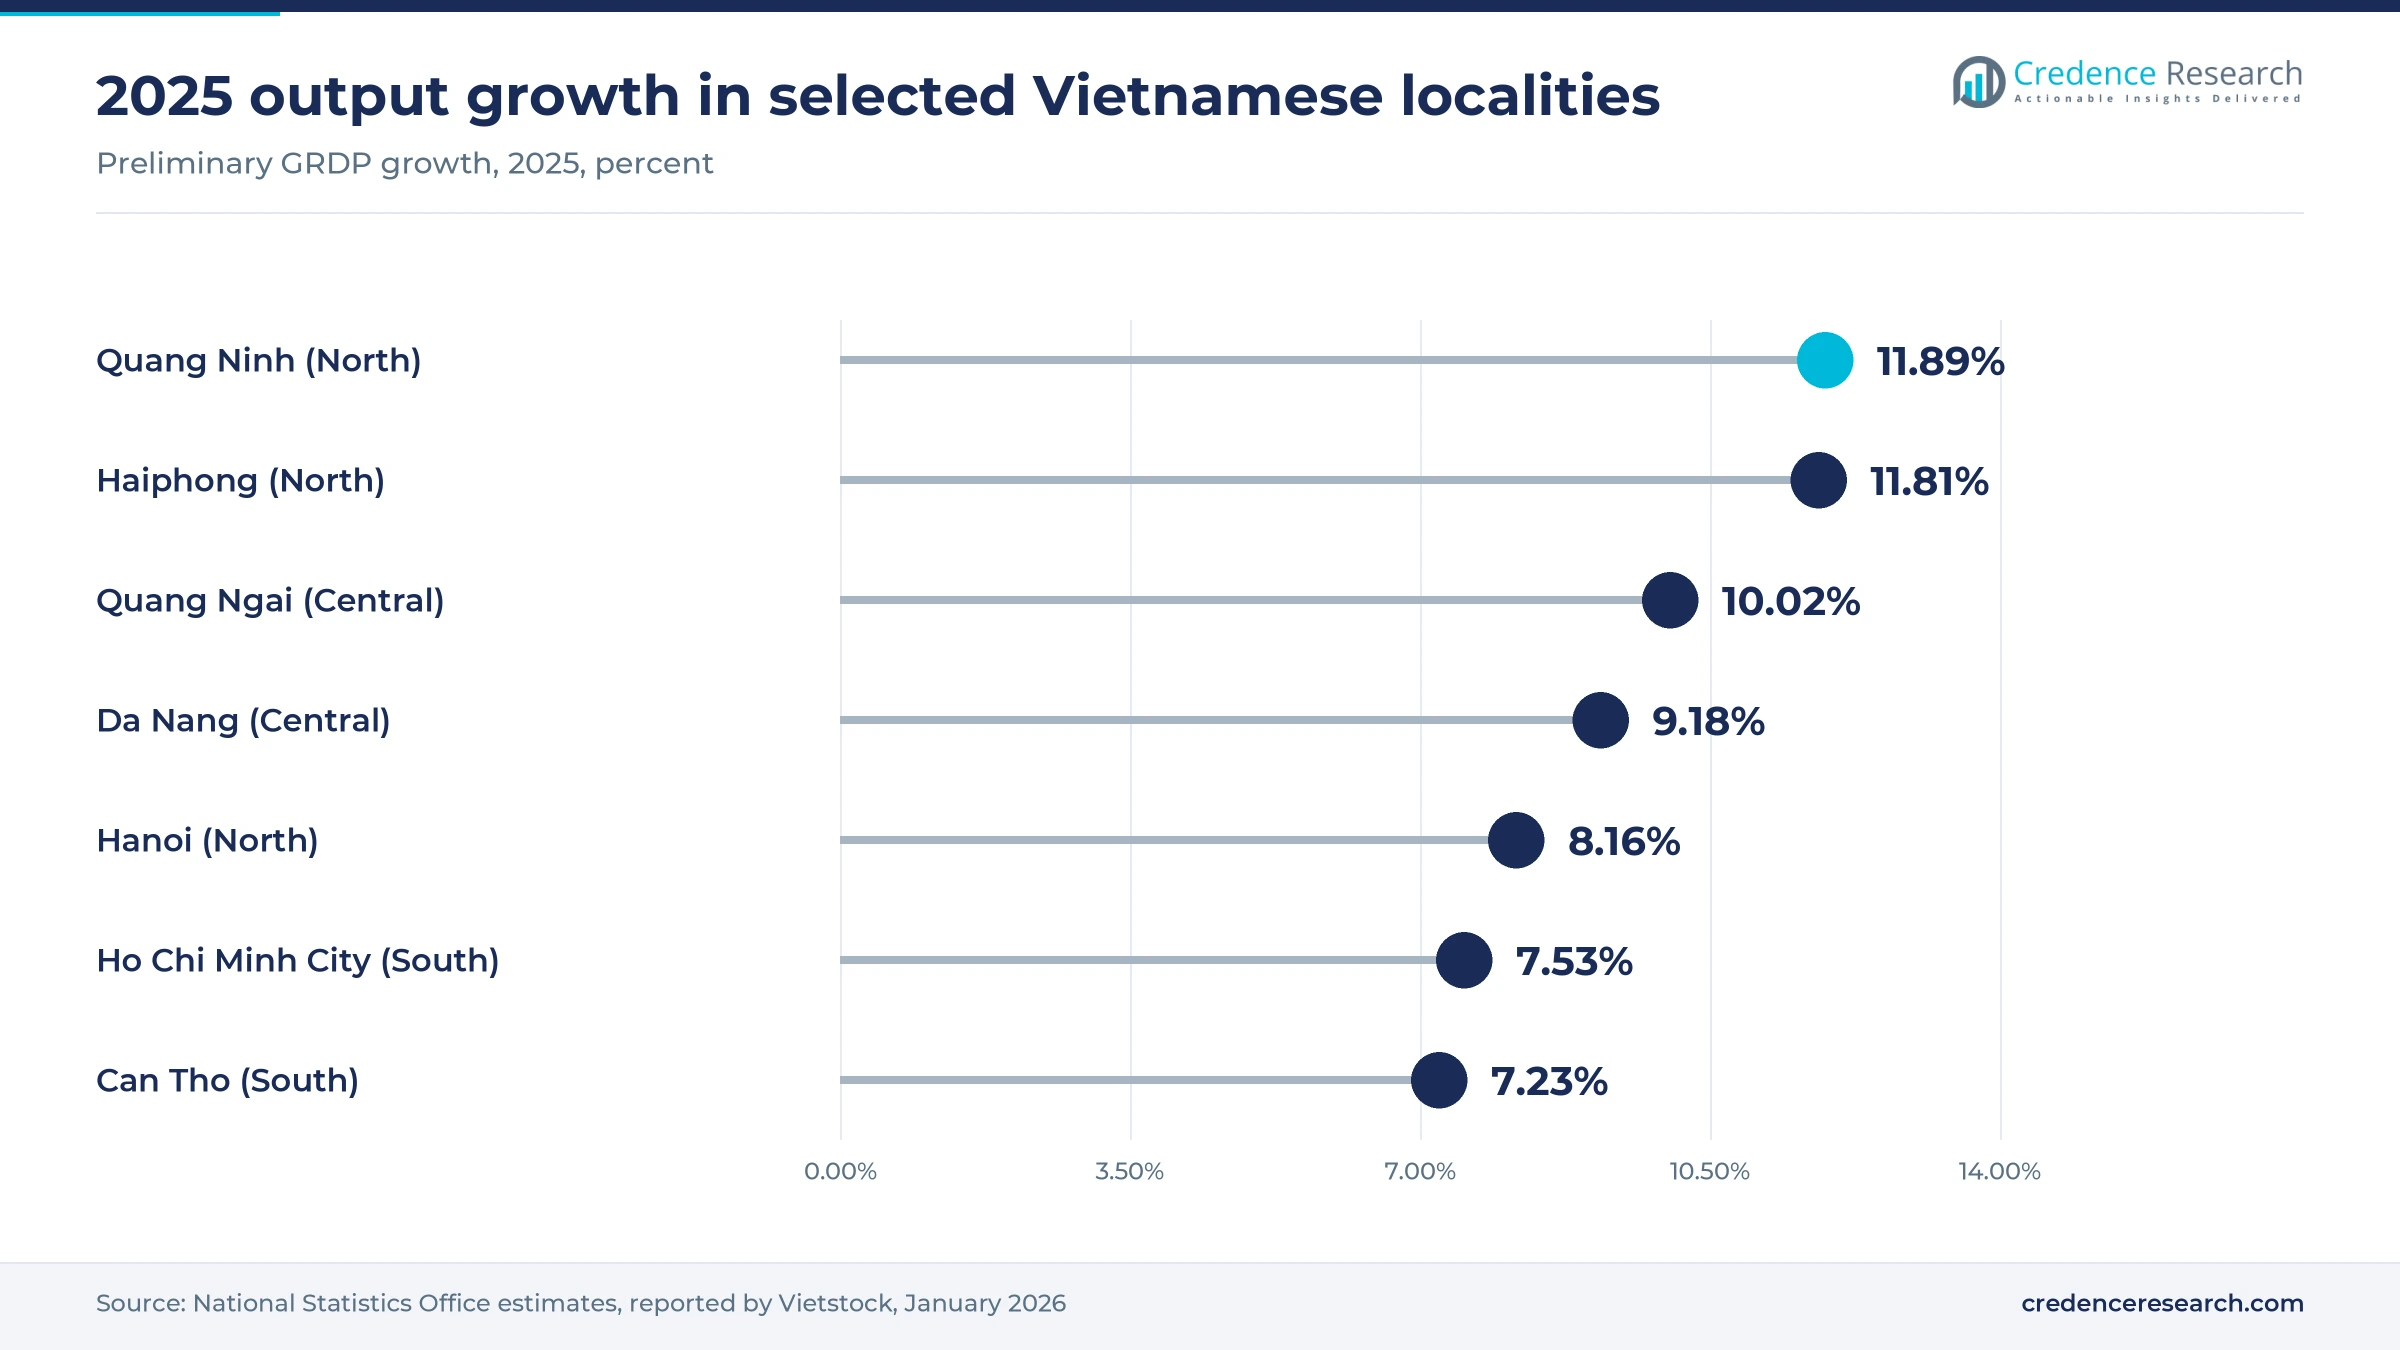
Northern Vietnam held 43.2% of 2025 value and grows at 15.16% a year, supported by government payment programs and a dense manufacturing base. National Statistics Office estimates cited by Vietstock show Red River Delta growth of 9.74% in 2025, the fastest of six regions, with 36.41% of national growth. Haiphong grew 11.81% and Quang Ninh 11.89%, while Hanoi grew 8.16%. Viettel Money also adds reach here, since it now serves as a payment channel on the National Public Service Portal, according to The Hanoi Times.
Southern Vietnam keeps depth in consumer platforms
Southern Vietnam held 34.1% of 2025 value and grows at 14.56% a year, the slowest pace of the three zones in the Credence Research model. Ho Chi Minh City grew 7.53% in 2025, below the Hanoi pace, and supplied 23.11% of national growth, according to VietNamNet. The city hosted Digital Finance Day on June 6 and 7, 2026, where NAPAS promoted cross-border QR, and InsurTech 2026 on March 27, 2026. These events show the role of the city as a meeting point for payment and insurance vendors.
Central Vietnam grows on Da Nang financial center
Central Vietnam held 22.7% of 2025 value and grows at 15.76% a year, the fastest pace of the three zones. The Da Nang international financial center opened Jan. 9, 2026 under Resolution 222/2025/QH15 and targets digital payments and supply chain finance, according to the Government News portal. Da Nang growth reached 9.18% in 2025 and Quang Ngai growth reached 10.02%, according to National Statistics Office estimates cited by Vietstock. Tourism adds card and QR acceptance needs across the coast, which lifts merchant fee potential.
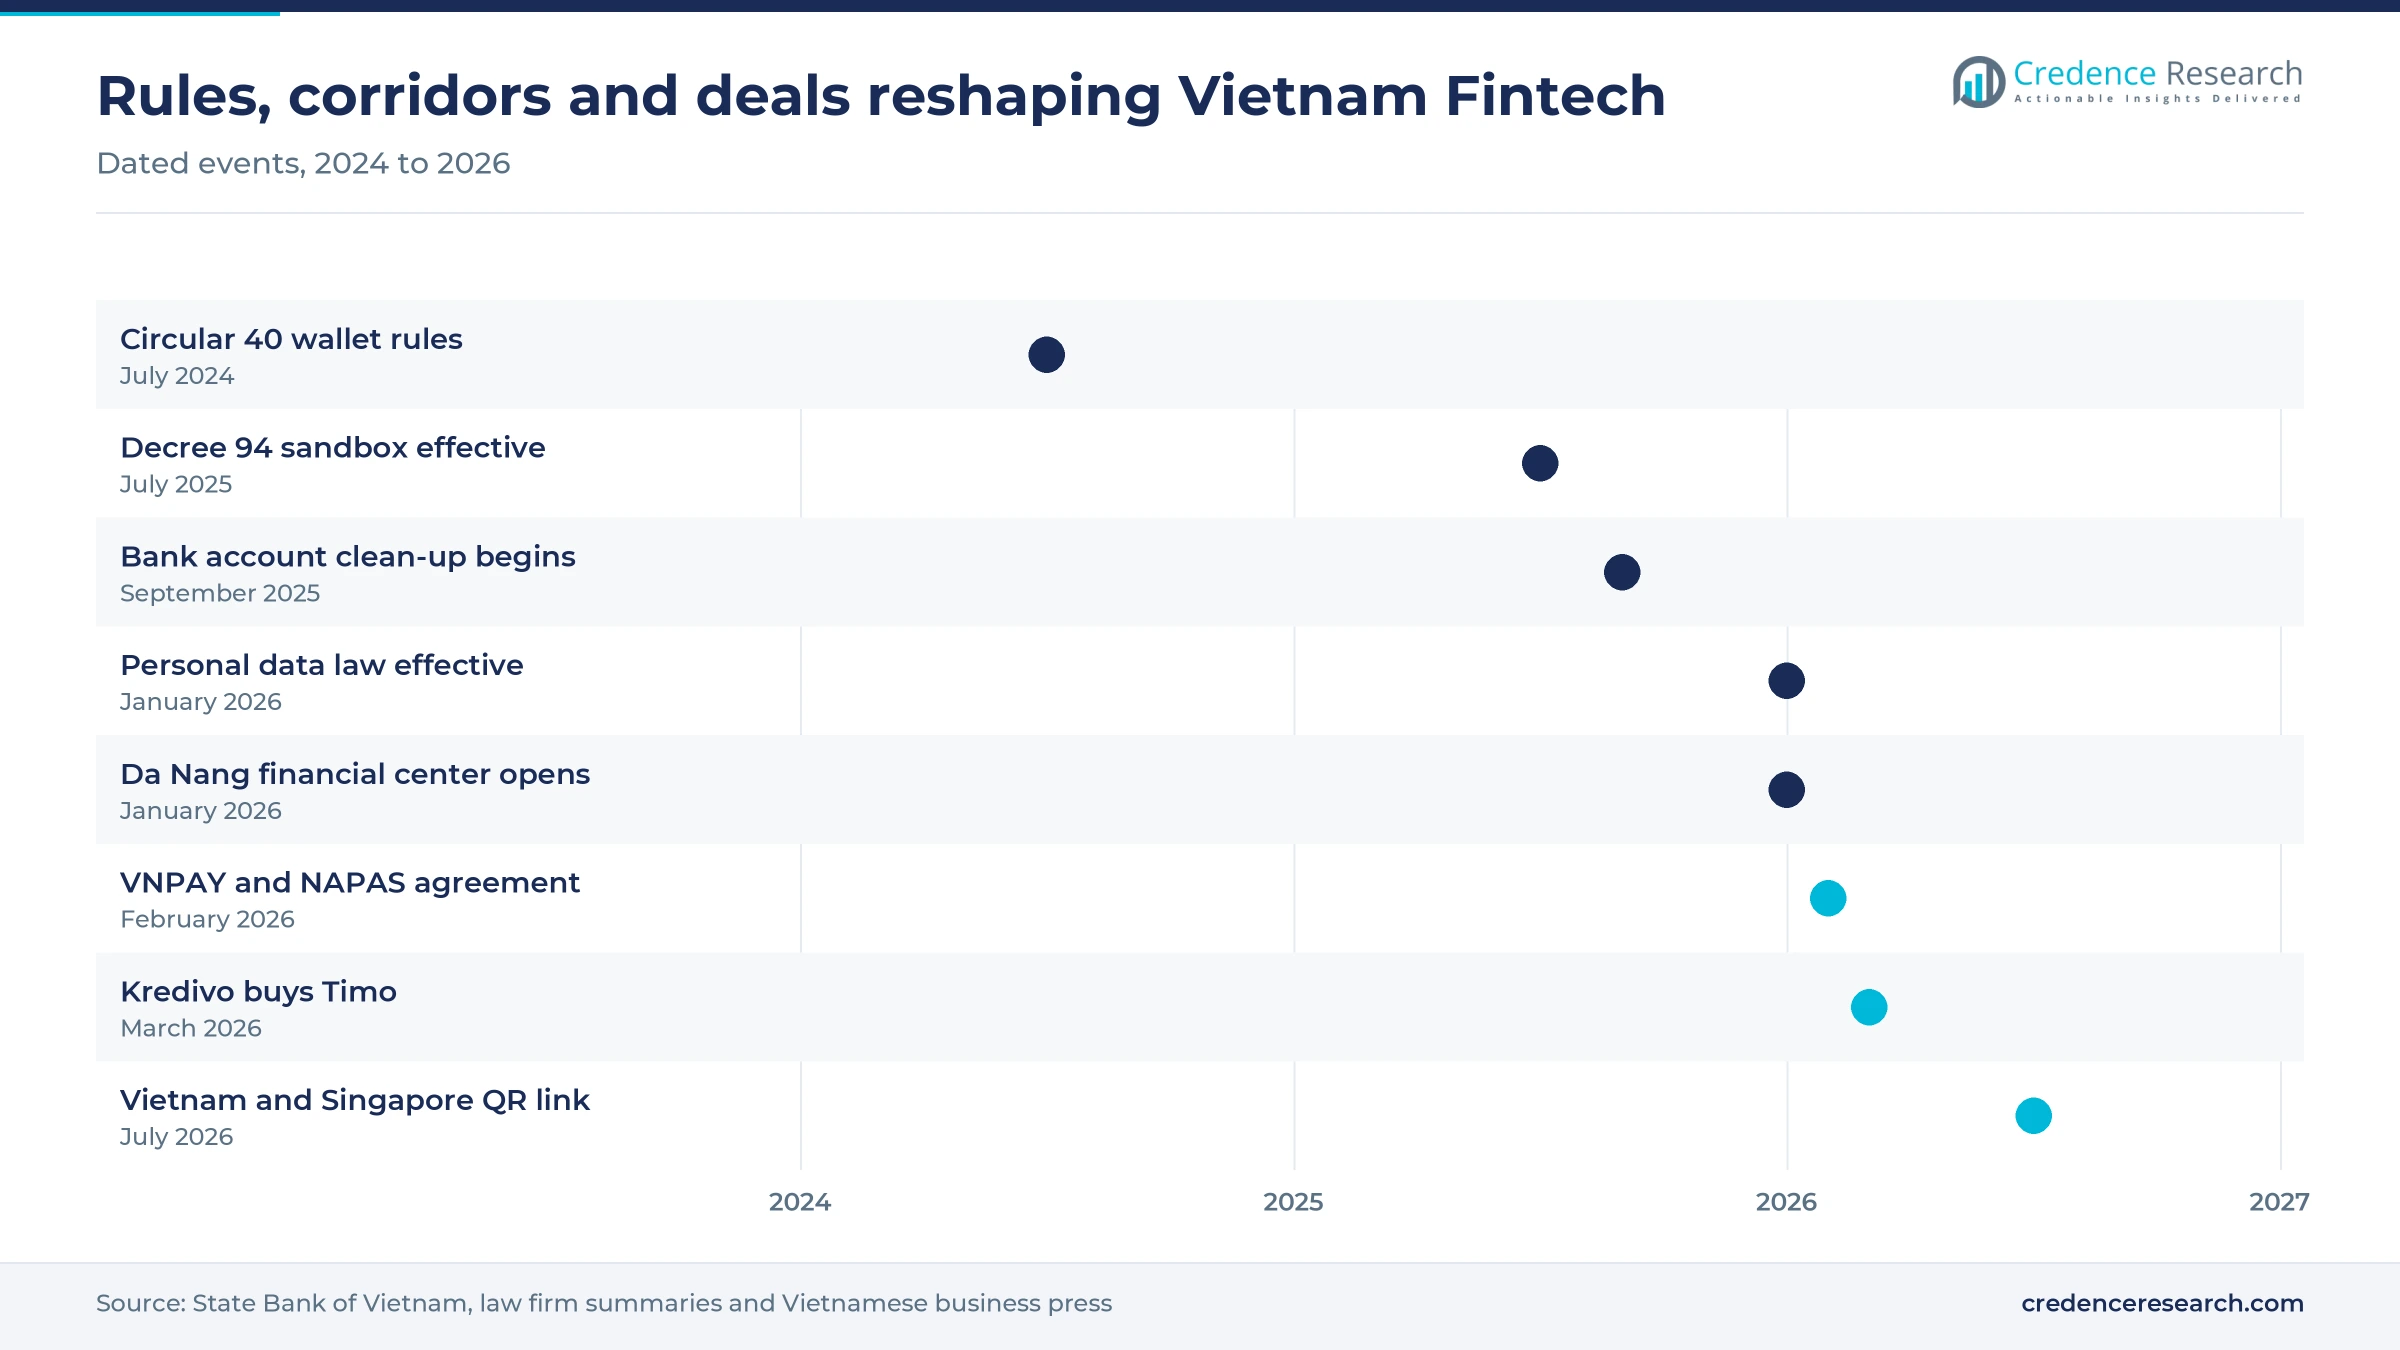
Licensing, QR corridors and deals shaped 2025 and 2026
| Development | Status and market relevance |
|---|---|
| In April 2025, the government issued Decree 94/2025/ND-CP, creating a banking sandbox for credit scoring, open APIs and peer-to-peer lending. | In effect since July 1, 2025 for periods of up to two years. |
| In September 2025, banks began removing more than 86 million dormant, duplicate or unverifiable accounts, according to Asia Times. | About 113 million personal accounts remained, improving identity data for digital onboarding. |
| In February 2026, VNPAY and NAPAS signed a cooperation agreement covering new payment technology and cross-border QR. | Signed Feb. 11, 2026, and tourists from Thailand, Laos and Cambodia can use home apps at VNPAY points. |
| In March 2026, Kredivo agreed to buy Timo and planned USD 15 million of investment over three years. | Paperwork was reported as signed, and Timo keeps its brand during a two-stage integration. |
| In July 2026, NAPAS, Liquid Group and VietinBank launched the Vietnam and Singapore QR service in Hanoi. | Live for Singapore visitors, and the network now covers six countries. |
Biometrics, instant rails and data sharing set the stack
- Biometric verification checks faces on online transfers above VND10 million and daily totals above VND20 million, according to Asia Times, which aims to reduce account fraud at some cost to convenience.
- VietQR and NAPAS rails connect banks and intermediaries for instant transfers, and NAPAS processed 9.56 billion account-to-account transactions in 2024, according to Fintech News Vietnam.
- SIMO fraud monitoring links 149 institutions and had sent 3.7 million warnings by mid-April 2026, according to Asia Times, which lets providers halt suspect transfers before they settle.
- Open API data sharing lets licensed participants exchange customer data with consent inside the Decree 94 sandbox, which supports alternative credit scoring for thin-file borrowers.
Need a Custom Version of This Report?
Tailor the scope, geography, or segments to your exact requirements.
- Custom geography or segment scope
- Direct access to our analyst team
Wallets, gateways and bank-backed apps compete on reach
Competition runs across consumer wallets, merchant gateways, telecom-led services and digital banks. MoMo relies on consumer reach, with more than 40 million active users reported in late 2025, while ZaloPay draws on its link with the Zalo messaging app and hosts Lotte Finance credit. VNPAY competes through merchant coverage of nearly 300,000 businesses and a February 2026 agreement with NAPAS. Viettel Money uses telecom distribution and public service payments, reaching nearly 30 million users by April 2025. Payoo works with retail chains and card schemes, including a promotion spanning more than 5,500 outlets from December 2025. Timo was reported sold to Kredivo in March 2026, and the buyer plans to add lending technology and card products. Shopee runs SPayLater with TPBank and VPBank inside its marketplace. Finhay focuses on online investing, and 9Pay targets small merchant tools. Pricing pressure is strongest in transfers, so providers increasingly seek credit, software and distribution income.
Companies profiled and their roles in this market
| Company | Type | Role in the market |
|---|---|---|
| MoMo | Consumer wallet | Mass-market payments, with over 40 million active users reported in late 2025 |
| VNPAY | Payment gateway and merchant platform | Serves nearly 300,000 businesses and has a February 2026 NAPAS agreement |
| ZaloPay | Wallet linked to messaging | Hosts Lotte Finance credit and launched an international QR service in China in September 2025 |
| Viettel Money | Telecom-led platform | Official payment channel on the National Public Service Portal, with more than 350 services |
| ShopeePay Vietnam | Marketplace payment and credit | Shopee runs SPayLater with TPBank and VPBank inside its marketplace |
| Payoo | Payment platform | Joined NAPAS and Mastercard in a promotion across more than 5,500 outlets from December 2025 |
| Timo Digital Bank | Digital bank | Reported acquired by Kredivo in March 2026, with lending and card products planned |
| Finhay | Digital investment platform | Holds a securities license through Vina Securities and claims more than 2.7 million users |
| NextPay | Merchant payment provider | Formed from the merger of Vimo and mPOS, offering merchants POS acceptance |
| 9Pay | Payment intermediary | Focuses on simple, affordable tools for household businesses moving to declared tax |
Credit quality will decide the next stage of profit
Credence Research's view is that payments will keep the largest share, but profit will depend on what providers build on top of payment records. Transfer fees face constant pressure from free bank apps and national QR rails, so wallets need credit, software and distribution income. The State Bank target of non-cash payments at 30 times GDP by 2030 suggests volume is not the constraint. The harder test is underwriting, because a newly formal lending sector will face its first full credit cycle with thin borrower histories and stricter consent duties.
Model totals, State Bank data and decrees set the estimate
The report uses 2025 as the base year and 2035 as the forecast year. Market values come from the Credence Research model, and segment and regional splits are Credence Research estimates. Those estimates draw on State Bank of Vietnam statistics, National Statistics Office releases, World Bank indicators, government decrees, law firm summaries, company announcements and Vietnamese business press. A cross-check compared the total with an income estimate derived from published payment transaction value. No primary interviews or surveys were conducted for this edition.
Lending and merchant software widen income to 2035
The market is forecast to reach USD 15.36 billion by 2035, and its income mix should become less dependent on transfer fees. Digital Lending and Financing is expected to gain share as sandbox results inform permanent lending rules. Cash register software and merchant tools should spread after the 2026 tax changes, while embedded credit at retailers widens access. Northern and Central Vietnam should gain modest share through public service payments and the Da Nang financial center. Southern Vietnam will remain a major consumer market through the forecast period. Fraud control and data compliance will likely favor licensed providers with strong bank partners.
Frequently Asked Questions
How big is the Vietnam fintech and digital payments market?
Which service type leads the market?
Which region of Vietnam holds the largest share?
What is the fintech sandbox in Vietnam?
How fast are cashless payments growing in Vietnam?
Why does Mobile Money matter for financial inclusion?
Who are the main companies in the market?
What are the main risks for fintech providers?
Table of Content
Chapter 1 Market Segmentation
- 1.1 Segmentation Framework
- 1.1.1 Product and Service Classification
- 1.1.2 Application and End-Use Classification
- 1.1.3 Technology and Solution Classification
- 1.1.4 Customer and Distribution Channel Classification
- 1.1.5 Geographic Segmentation
- 1.1.6 Market Segment Definitions and Boundaries
- 1.2 By Service Type
- 1.2.1 Digital Payments
- 1.2.2 Digital Lending and Financing
- 1.2.3 Digital Banking and Neobanking
- 1.2.4 WealthTech and Digital Investments
- 1.2.5 InsurTech
- 1.3 By Customer Segment
- 1.3.1 Retail Consumers
- 1.3.2 Micro and Small Businesses
- 1.3.3 Mid-Market and Large Enterprises
- 1.3.4 Underserved and Newly Banked Users
- 1.4 By Revenue Model
- 1.4.1 Transaction Fees
- 1.4.2 Merchant Service Fees
- 1.4.3 Subscription and SaaS Fees
- 1.4.4 Lending and Origination Fees
- 1.4.5 Distribution Commissions
Chapter 2 Introduction
- 2.1 Report Objectives and Scope
- 2.2 Product Definition and Industry Terminology
- 2.3 Market Inclusions and Exclusions
- 2.4 Research Process
- 2.4.1 Primary Research and Expert Interviews
- 2.4.2 Secondary Research and Source Review
- 2.4.3 Top-Down and Bottom-Up Estimation
- 2.4.4 Data Triangulation and Verification
- 2.5 Market Size Measurement Basis
- 2.5.1 2025: USD 3.74 billion → 2035: USD 15.36 billion
- 2.6 Historical and Forecast Reference Periods
- 2.6.1 Historical Period: 2018-2025
- 2.6.2 Base Year: 2025
- 2.6.3 Forecast Period: 2025-2035
- 2.7 Research Assumptions and Limitations
Chapter 3 Executive Summary
- 3.1 Market Snapshot and Key Findings
- 3.2 Base-Year Market Size, 2025
- 3.3 Forecast Market Size, 2035
- 3.4 Revenue and Volume Growth Outlook
- 3.5 Key Demand and Supply Indicators
- 3.6 Leading Market Segments
- 3.7 Fastest-Growing Market Opportunities
- 3.8 Regional Performance Highlights
- 3.9 Technology and Industry Transformation
- 3.10 Competitive Landscape Summary
- 3.11 Analyst View and Strategic Implications
Chapter 4 Vietnam Fintech and Digital Payments Market Trends and Developments
- 4.1 Historical Industry Development, 2018-2025
- 4.2 Recent Market Trends and Developments
- 4.3 Demand and Customer Behavior Trends
- 4.4 Technology and Product Innovation
- 4.5 Artificial Intelligence, Automation and Digitalization
- 4.6 Local Manufacturing and Supply Chain Realignment
- 4.7 Industry Partnerships, Mergers and Acquisitions
- 4.8 Sustainability and Circular Economy Developments
- 4.9 Government and Private Sector Investment Trends
- 4.10 Emerging Business Models and Commercialization
- 4.11 Industry Developments and Announcements
Chapter 5 Vietnam Fintech and Digital Payments Market Supply and Demand Analysis
- 5.1 Demand Trend and Consumption Analysis, 2018-2025
- 5.2 Demand Forecast, 2025-2035
- 5.3 Supply Chain Structure and Procurement Trends
- 5.4 Supply-Demand Gap and Bottlenecks
- 5.5 Import Dependence and Sourcing Structure
- 5.6 Regional Supply and Demand Concentration
Chapter 6 Vietnam Fintech and Digital Payments Market Pricing Analysis
- 6.1 Pricing Structure and Measurement
- 6.2 Historical Pricing Trends, 2018-2025
- 6.3 Pricing Outlook, 2025-2035
- 6.4 Pricing by Product and Market Segment
- 6.5 Geographic Pricing Differences
- 6.6 Key Input, Energy, Labor and Logistics Costs
- 6.7 Contract Pricing and Purchasing Models
- 6.8 Pricing Sensitivity and Competitive Positioning
- 6.9 Price, Margin and Profitability Implications
Chapter 7 Vietnam Fintech and Digital Payments Market Dynamics
- 7.1 Market Growth Drivers
- 7.1.1 Demand-Side Drivers
- 7.1.2 Technology and Innovation Drivers
- 7.1.3 Infrastructure and Investment Drivers
- 7.1.4 Regulatory and Policy Drivers
- 7.2 Market Restraints
- 7.2.1 Cost and Affordability Constraints
- 7.2.2 Technology and Adoption Barriers
- 7.2.3 Supply Chain and Operational Constraints
- 7.3 Market Challenges
- 7.3.1 Competitive Pressure and Margin Erosion
- 7.3.2 Skills, Infrastructure and Implementation Gaps
- 7.4 Emerging Market Opportunities
- 7.5 Market Dynamics Impact and Time-Horizon Assessment
Chapter 8 Vietnam Fintech and Digital Payments Value Chain Analysis
- 8.1 Industry Value Chain Overview
- 8.2 Upstream Suppliers and Critical Inputs
- 8.3 Technology and Component Providers
- 8.4 Manufacturing or Service Delivery
- 8.5 Distribution, Channel Partners and Integrators
- 8.6 Downstream Applications and End Users
- 8.7 Value Addition and Profit Pools
- 8.8 Vertical Integration and Outsourcing
- 8.9 Supplier Concentration and Risk
- 8.10 Supply Chain Localization and Resilience
Chapter 9 Vietnam Fintech and Digital Payments Market Regulations and Policies
- 9.1 Relevant Laws, Standards and Compliance Frameworks
- 9.2 Product, Service, Safety and Quality Requirements
- 9.3 Government Policies, Incentives and Subsidies
- 9.4 Imports, Exports and Trade Barriers
- 9.5 Public Procurement and Local Content Requirements
- 9.6 Data Protection, AI and Cybersecurity Compliance
- 9.7 Upcoming Policy Changes and Market Implications
Chapter 10 Vietnam Fintech and Digital Payments Market Hotspots and Opportunities
- 10.1 Market Opportunity Mapping and Growth Hotspots
- 10.2 High-Growth Applications and Customer Groups
- 10.3 Underserved Markets and White-Space Opportunities
- 10.4 Emerging Technology and Product Opportunities
- 10.5 New Capacity and Investment Hotspots
- 10.6 Market Entry and Expansion Opportunities
- 10.7 Distribution and Partnership Opportunities
- 10.8 Near-Term and Long-Term Commercial Potential
- 10.9 Opportunity Attractiveness and Execution Risks
Chapter 11 Vietnam Fintech and Digital Payments Market Outlook, 2025-2035
- 11.1 Market Size and Analysis
- 11.1.1 Revenue (Market Measurement: 2025: USD 3.74 billion → 2035: USD 15.36 billion)
- 11.1.2 Historical Market Size, 2018-2025
- 11.1.3 Base-Year Market Size, 2025
- 11.2 Market Forecast, 2025-2035
- 11.2.1 Revenue Forecast to 2035
- 11.2.2 CAGR and Year-on-Year Growth
- 11.2.3 Incremental Revenue Opportunity
- 11.3 Forecast Assumptions and Scenario Analysis
- 11.3.1 Base-Case Forecast
- 11.3.2 Optimistic and Conservative Scenarios
- 11.3.3 Technology, Pricing and Policy Sensitivities
- 11.4 Market Attractiveness and Growth Outlook
Chapter 12 Vietnam Fintech and Digital Payments Market Segmentation and Outlook
- 12.1 Segmentation Summary and Market Shares, 2025
- 12.2 Largest and Fastest-Growing Segments
- 12.3 By Service Type - Market Size and Forecast, 2025-2035
- 12.3.1 Segment Definition and Scope
- 12.3.2 Historical Market Size, 2018-2025
- 12.3.3 Revenue Forecast, 2025-2035
- 12.3.4 Base-Year Market Share, 2025
- 12.3.5 Segment CAGR and Growth Drivers
- 12.3.6 Subsegment Market Size and Forecast
- 12.3.6.1 Digital Payments
- 12.3.6.2 Digital Lending and Financing
- 12.3.6.3 Digital Banking and Neobanking
- 12.3.6.4 WealthTech and Digital Investments
- 12.3.6.5 InsurTech
- 12.3.7 Subsegment Pricing and Adoption Trends
- 12.3.8 Leading Suppliers and Competition
- 12.3.9 Regional Demand and Opportunities
- 12.4 By Customer Segment - Market Size and Forecast, 2025-2035
- 12.4.1 Segment Definition and Scope
- 12.4.2 Historical Market Size, 2018-2025
- 12.4.3 Revenue Forecast, 2025-2035
- 12.4.4 Base-Year Market Share, 2025
- 12.4.5 Segment CAGR and Growth Drivers
- 12.4.6 Subsegment Market Size and Forecast
- 12.4.6.1 Retail Consumers
- 12.4.6.2 Micro and Small Businesses
- 12.4.6.3 Mid-Market and Large Enterprises
- 12.4.6.4 Underserved and Newly Banked Users
- 12.4.7 Subsegment Pricing and Adoption Trends
- 12.4.8 Leading Suppliers and Competition
- 12.4.9 Regional Demand and Opportunities
- 12.5 By Revenue Model - Market Size and Forecast, 2025-2035
- 12.5.1 Segment Definition and Scope
- 12.5.2 Historical Market Size, 2018-2025
- 12.5.3 Revenue Forecast, 2025-2035
- 12.5.4 Base-Year Market Share, 2025
- 12.5.5 Segment CAGR and Growth Drivers
- 12.5.6 Subsegment Market Size and Forecast
- 12.5.6.1 Transaction Fees
- 12.5.6.2 Merchant Service Fees
- 12.5.6.3 Subscription and SaaS Fees
- 12.5.6.4 Lending and Origination Fees
- 12.5.6.5 Distribution Commissions
- 12.5.7 Subsegment Pricing and Adoption Trends
- 12.5.8 Leading Suppliers and Competition
- 12.5.9 Regional Demand and Opportunities
- 12.6 Segment Growth Comparison
- 12.7 Segment Attractiveness and Priority Matrix
Chapter 13 Vietnam Fintech and Digital Payments End-Use and Application Market Outlook
- 13.1 End-Use Industry and Customer Demand Structure
- 13.2 Leading Applications and Customer Groups
- 13.3 End-Use Market Size, Share and Forecast
- 13.4 Major End-Use Industry Deep Dives
- 13.4.1 Customer Requirements and Use Cases
- 13.4.2 Demand and Replacement Cycles
- 13.4.3 Technical and Regulatory Considerations
- 13.4.4 Purchasing and Procurement Models
- 13.4.5 Leading Vendors and Distribution Channels
- 13.4.6 Forecast and Commercial Opportunities
- 13.5 Emerging Applications and Cross-Segment Demand
- 13.6 End-Use Industry Investment Priorities
Chapter 14 Vietnam Fintech and Digital Payments Geographic Market Outlook, 2025-2035
- 14.1 Domestic Market Distribution and Demand Clusters
- 14.2 State- or Province-Wise Market Size and Forecast, 2025-2035
- 14.3 City and Metropolitan Market Outlook
- 14.4 Industrial, Manufacturing and Commercial Clusters
- 14.5 Geographic Concentration of Key End Users
- 14.6 Local Pricing and Purchasing Differences
- 14.7 Domestic Production Facilities and Capacity Map
- 14.8 Local Infrastructure and Project Pipeline
- 14.9 State-Level Policy and Incentive Differences
- 14.10 Subnational Investment Hotspots and Opportunities
- 14.11 Distribution and Logistics Networks
- 14.12 Domestic Competitive Footprint
Chapter 15 Vietnam Fintech and Digital Payments Technology, Innovation and Sustainability Outlook
- 15.1 Technology Landscape and Maturity
- 15.2 Product, Process and Service Innovation
- 15.3 AI, Automation and Digital Tools in the Industry
- 15.4 Technology Adoption and Performance Benchmarking
- 15.5 Innovation Pipeline and R&D Investment
- 15.6 Energy Efficiency and Resource Management
- 15.7 Sustainability, Recycling and Circularity
- 15.8 Technology Roadmap, 2025-2035
- 15.9 Risks of Obsolescence and Technology Substitution
Chapter 16 Vietnam Fintech and Digital Payments Market Key Strategic Imperatives
- 16.1 Growth and Market Entry Priorities
- 16.2 High-Return Products and Segments
- 16.3 Pricing, Profitability and Cost Optimization
- 16.4 Technology Investment and Product Differentiation
- 16.5 Supply Chain Localization and Resilience
- 16.6 Distribution and Customer Acquisition
- 16.7 Partnership, Acquisition and Capacity Strategy
- 16.8 Regional Expansion Priorities
- 16.9 Short-, Medium- and Long-Term Actions
Chapter 17 Competition Outlook
- 17.1 Industry Competition Characteristics
- 17.2 Market Structure and Concentration
- 17.3 Market Share and Competitive Positioning, 2025
- 17.4 Company-Wise Revenue and Product Benchmarking
- 17.5 Production and Service Capacity Benchmarking
- 17.6 Technology, Pricing and Differentiation
- 17.7 Regional Footprint and Distribution Strength
- 17.8 Mergers, Acquisitions and Strategic Alliances
- 17.9 New Entrants and Competitive Threats
- 17.10 Porter's Five Forces and Industry Attractiveness
- 17.11 Competitive Outlook, 2025-2035
Chapter 18 Company Profiles
- 18.1 Company Coverage and Selection Criteria
- 18.2 MoMo
- 18.2.1 Business Description
- 18.2.2 Company Ownership and Geographic Presence
- 18.2.3 Product and Service Portfolio
- 18.2.4 Manufacturing and Operating Footprint
- 18.2.5 Financial Performance and Investment
- 18.2.6 Market Share and Competitive Position
- 18.2.7 Technology and Innovation Capabilities
- 18.2.8 Strategic Alliances or Partnerships
- 18.2.9 Recent Developments
- 18.2.10 Growth Strategy and Outlook
- 18.3 VNPAY
- 18.4 ZaloPay
- 18.5 Viettel Money
- 18.6 ShopeePay Vietnam
- 18.7 Payoo
- 18.8 Timo Digital Bank
- 18.9 Finhay
- 18.10 NextPay
- 18.11 9Pay
- 18.12 Other Relevant Market Participants
Note: Every listed company is profiled on the structure shown under the first company. The company list is preliminary and may change based on research findings, market developments, data availability and client requirements.
Chapter 19 Disclaimer
- 19.1 Research and Forecast Disclaimer
- 19.2 Data Source and Estimation Limitations
Note: The depth of individual sections depends on data availability for this market. Volume, capacity, trade and other unit-based metrics are included where applicable.