
Market Overview
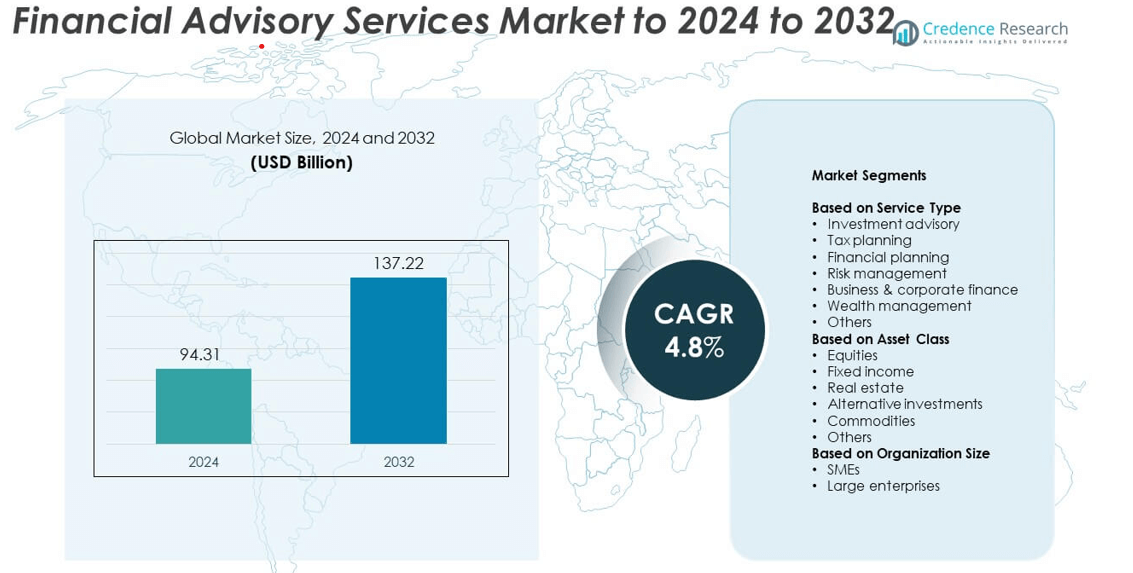
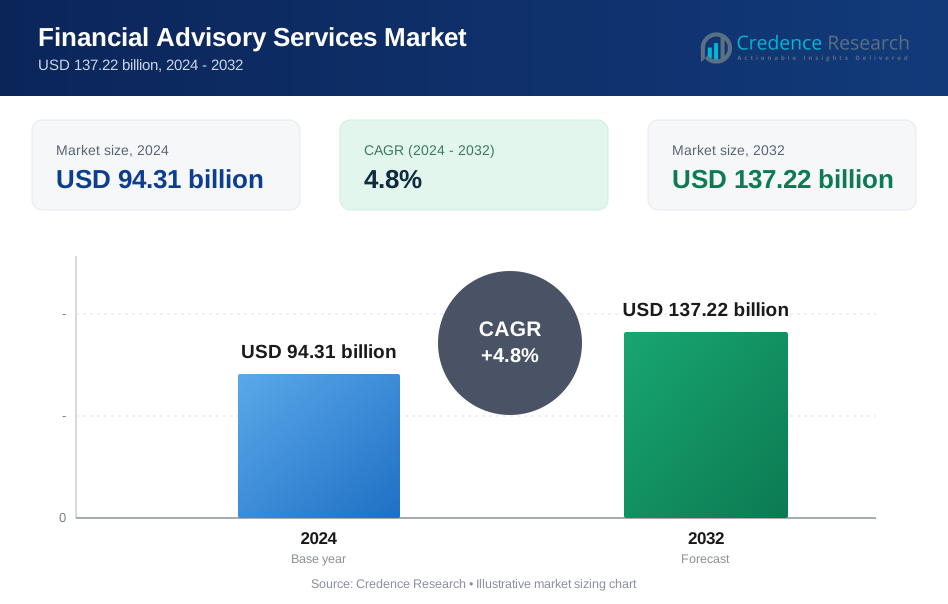
The Financial Advisory Services market size was valued at USD 94.31 billion in 2024 and is anticipated to reach USD 137.22 billion by 2032, growing at a CAGR of 4.8% during the forecast period.
| REPORT ATTRIBUTE | DETAILS |
|---|---|
| Historical Period | 2020-2023 |
| Base Year | 2024 |
| Forecast Period | 2025-2032 |
| Financial Advisory Services Market Size 2024 | USD 94.31 billion |
| Financial Advisory Services Market , CAGR | 4.8% |
| Financial Advisory Services Market Size 2032 | USD 137.22 billion |
The financial advisory services market is driven by leading firms such as Deloitte, UBS Group AG, JPMorgan Chase & Co., Citigroup Inc., Goldman Sachs, Ameriprise Financial, Charles Schwab, BlackRock, Bank of America Merrill Lynch, Wells Fargo Advisors, Morgan Stanley, and Unchained. These companies dominate through diversified service portfolios, technological innovation, and strong global client bases. They emphasize digital transformation, ESG-focused investments, and hybrid advisory models to enhance client engagement. Geographically, North America leads the market with a 38% share, supported by robust institutional investments and widespread adoption of digital advisory platforms, followed by Europe and Asia Pacific showing steady expansion.
Market Insights
- The financial advisory services market was valued at USD 94.31 billion in 2024 and is projected to reach USD 137.22 billion by 2032, growing at a CAGR of 4.8%.
- Rising demand for personalized financial planning, wealth management, and retirement solutions is fueling market expansion, supported by increasing digital adoption across advisory services.
- Key trends include the integration of AI-driven analytics, ESG-focused investment strategies, and hybrid advisory models combining technology with human expertise.
- The market is moderately consolidated, with major players such as Deloitte, Goldman Sachs, and JPMorgan Chase focusing on innovation, sustainable finance, and global expansion to strengthen competitiveness.
- North America leads with a 38% share, followed by Europe at 27% and Asia Pacific at 23%, while the investment advisory segment dominates with 31% of total market share due to strong demand for structured portfolio management and risk optimization.
Market Segmentation Analysis:
By Service Type
The investment advisory segment held the largest market share of 31% in 2024. Its dominance stems from the increasing demand for professional portfolio management and data-driven investment solutions. Rising adoption of digital advisory platforms and AI-based analytics enhances decision-making for both retail and institutional clients. Financial institutions are focusing on customized strategies to improve client returns and risk-adjusted performance. The growing participation of millennials in investment markets further strengthens this segment’s position in the financial advisory services landscape.
- For instance, Vanguard serves 50,000,000+ investors globally.
By Asset Class
The equities segment accounted for the highest share of 37% in 2024. This leadership is driven by growing investor preference for high-return instruments and expanding stock market participation. Global economic recovery and corporate earnings growth have strengthened equity investments. Advisory firms are leveraging algorithmic trading, ESG integration, and real-time analytics to enhance performance. Continuous innovation in equity research tools and risk modeling supports the segment’s sustained growth across institutional and retail portfolios.
- For instance, BlackRock’s iShares offers 1,400+ ETFs worldwide.
By Organization Size
Large enterprises dominated the market with a 64% share in 2024. Their extensive financial operations, global investments, and compliance requirements drive the need for comprehensive advisory services. These enterprises increasingly rely on integrated financial solutions for mergers, acquisitions, and capital structure optimization. Advanced analytics, digital reporting, and cross-border tax planning enhance efficiency and transparency. However, the small and medium-sized enterprise segment is expanding rapidly due to rising awareness of structured financial management and cost optimization needs.
Key Growth Drivers
Rising Demand for Personalized Financial Solutions
The growing focus on customized financial strategies drives market expansion. Clients increasingly seek tailored investment, tax, and risk management plans aligned with their long-term goals. Financial advisory firms are using advanced analytics, AI, and behavioral insights to enhance personalization. This trend improves client satisfaction and retention while supporting diversified service offerings. The shift from one-size-fits-all approaches to individualized strategies strengthens the competitiveness of advisory providers globally.
- For instance, Edward Jones lists 20,288 financial advisors in Q1 2025.
Integration of Digital and Automated Advisory Platforms
The adoption of digital platforms and robo-advisory tools is transforming service delivery. Automation reduces operational costs and enables real-time portfolio monitoring. Financial advisors use AI algorithms to recommend investment strategies and rebalance portfolios efficiently. These digital solutions appeal to younger investors and mass-affluent clients seeking convenience and transparency. The integration of digital tools supports scalability, accuracy, and accessibility, contributing to the steady growth of advisory services worldwide.
- For instance, Fidelity supports 24,400,000 401(k) participants across 25,300 plans.
Rising Awareness of Wealth and Retirement Planning
Growing awareness of retirement savings and wealth preservation is fueling advisory demand. Individuals and families increasingly prioritize financial security amid economic uncertainty and inflation. Advisors provide structured wealth planning, estate management, and pension optimization services to meet these evolving needs. The expansion of middle-class populations and higher disposable incomes in emerging economies further amplify this demand. This driver underlines the importance of professional guidance in achieving long-term financial stability.
Key Trends and Opportunities
Growing Adoption of ESG and Sustainable Investment Strategies
Environmental, social, and governance principles are shaping investment advisory practices. Investors favor sustainable portfolios that align with ethical and regulatory standards. Advisors integrate ESG data analytics to guide investment decisions and ensure compliance with sustainability benchmarks. This shift creates new advisory opportunities across corporate and retail clients. Firms adopting ESG-focused models attract a broader investor base while enhancing their market reputation and long-term growth potential.
- For instance, BlackRock's Aladdin Climate tool mapped approximately 3.4 million securities as of mid-2023, with data covering over 12,000 issuers.
Emergence of Hybrid Advisory Models
Hybrid advisory models that combine digital tools with human expertise are gaining momentum. These solutions balance automation efficiency with personalized client interaction. Advisors use AI-driven insights to support human judgment in portfolio management and financial planning. The hybrid approach appeals to both tech-savvy and traditional clients. It enhances trust, engagement, and scalability, positioning advisory firms to meet diverse customer expectations in a competitive environment.
- For instance, In September 2025, Charles Schwab announced plans to open 16 new branch locations across the U.S. and 25 expansions.
Key Challenges
Regulatory Compliance and Data Security Risks
Complex and evolving financial regulations pose challenges to advisory firms. Compliance with anti-money laundering, data protection, and fiduciary standards requires significant investment. Cybersecurity threats further increase operational risks as firms handle sensitive client information. Maintaining regulatory alignment while adopting new technologies demands continuous monitoring and system upgrades. Failure to manage compliance effectively can result in reputational and financial penalties for market participants.
High Competition and Fee Compression
The entry of digital platforms and low-cost advisors intensifies market competition. Clients increasingly compare advisory fees and demand transparent pricing structures. Traditional firms face pressure to justify premium charges while maintaining service quality. Fee compression limits profitability and forces firms to innovate or diversify their offerings. To remain competitive, financial advisors are focusing on value-added services, long-term client relationships, and performance-based models.
Regional Analysis
North America
North America led the financial advisory services market with a 38% share in 2024. The region’s dominance is driven by strong institutional investment activity, growing wealth management demand, and the presence of leading financial advisory firms. High digital adoption in financial services, combined with advanced risk management and tax planning expertise, strengthens market growth. The United States remains the key contributor, supported by corporate expansion and growing high-net-worth client segments. Increasing interest in ESG-based investments and hybrid advisory platforms continues to reshape the regional market dynamics.
Europe
Europe accounted for a 27% share of the financial advisory services market in 2024. The region benefits from rising demand for sustainable finance, stringent regulatory compliance, and expanding cross-border investment activities. Countries such as the United Kingdom, Germany, and Switzerland are major hubs for wealth and corporate financial advisory. Advisors in Europe are increasingly focusing on green investment portfolios and retirement planning services. The adoption of digital advisory tools and enhanced transparency in financial regulations support continued market expansion across both corporate and retail clients.
Asia Pacific
Asia Pacific captured a 23% share in 2024, emerging as the fastest-growing regional market. Economic growth, expanding middle-class populations, and rising disposable incomes are fueling demand for financial planning and wealth management services. Markets such as China, Japan, and India are key contributors, driven by rapid digitalization and investment diversification. Financial literacy programs and growing interest in equity and alternative investments further boost market activity. Global advisory firms are expanding operations in the region, capitalizing on increased investor awareness and government-backed financial inclusion initiatives.
Latin America
Latin America held an 8% share of the global financial advisory services market in 2024. The region’s growth is supported by rising demand for risk management, tax advisory, and business restructuring services. Brazil and Mexico lead the market, benefiting from expanding corporate investments and regulatory modernization. The adoption of fintech platforms has enhanced access to financial advisory services, especially among small and medium enterprises. Despite economic volatility, steady reforms in banking and taxation systems continue to create opportunities for advisory service providers across the region.
Middle East and Africa
The Middle East and Africa accounted for a 4% share in 2024, showing steady development in financial advisory adoption. The market benefits from increased focus on wealth management, family offices, and corporate finance consulting. The Gulf Cooperation Council countries dominate due to diversification strategies under initiatives such as Vision 2030. Financial institutions are expanding digital advisory offerings and sustainable finance consulting. In Africa, growing investor confidence and policy reforms are improving access to structured advisory services, driving gradual but consistent regional growth.
Market Segmentations:
By Service Type
- Investment advisory
- Tax planning
- Financial planning
- Risk management
- Business & corporate finance
- Wealth management
- Others
By Asset Class
- Equities
- Fixed income
- Real estate
- Alternative investments
- Commodities
- Others
By Organization Size
- SMEs
- Large enterprises
By Geography
- North America
- U.S.
- Canada
- Mexico
- Europe
- Germany
- France
- U.K.
- Italy
- Spain
- Rest of Europe
- Asia Pacific
- China
- Japan
- India
- South Korea
- South-east Asia
- Rest of Asia Pacific
- Latin America
- Brazil
- Argentina
- Rest of Latin America
- Middle East & Africa
- GCC Countries
- South Africa
- Rest of the Middle East and Africa
Competitive Landscape
The financial advisory services market is highly competitive, with major players such as Deloitte, UBS Group AG, JPMorgan Chase & Co., Citigroup Inc., Goldman Sachs, Ameriprise Financial, Charles Schwab, BlackRock, Bank of America Merrill Lynch, Wells Fargo Advisors, Morgan Stanley, and Unchained shaping the global landscape. These firms compete through diversified service portfolios, digital advisory innovations, and strong global client networks. The market is witnessing a rapid shift toward technology-enabled solutions, including AI-driven investment models, data analytics, and hybrid advisory platforms. Firms are investing in sustainable finance, ESG-focused strategies, and personalized client engagement tools to strengthen brand positioning. Expanding into emerging markets, enhancing regulatory compliance, and forming strategic partnerships are key approaches driving growth. Competitive intensity remains high as both traditional and digital-native advisors target similar investor segments. Continuous innovation and client-centric service models are expected to determine long-term leadership in this evolving market.
Key Player Analysis
- Deloitte
- UBS Group AG
- JPMorgan Chase & Co.
- Citigroup Inc.
- Goldman Sachs
- Ameriprise Financial
- Charles Schwab
- BlackRock
- Bank of America Merrill Lynch
- Wells Fargo Advisors
- Morgan Stanley
- Unchained
Recent Developments
- In 2025, Morgan Stanley introduced the Founders Specialist designation for financial advisors working with founders and employees of private companies
- In 2024, Deloitte helped financial firms adapt to market changes and client needs by integrating advanced analytics platforms like FinservDEEP and deploying generative AI (GenAI) technologies
- In 2024, J.P. Morgan Asset Management experienced record-breaking net inflows into its Exchange-Traded Funds (ETFs), as the ETF market experienced significant growth.
- In 2023, Unchained, a Bitcoin financial service provider, launched the service, Sound Advisory
Report Coverage
The research report offers an in-depth analysis based on Service Type, Asset Class, Organization Size and Geography. It details leading market players, providing an overview of their business, product offerings, investments, revenue streams, and key applications. Additionally, the report includes insights into the competitive environment, SWOT analysis, current market trends, as well as the primary drivers and constraints. Furthermore, it discusses various factors that have driven market expansion in recent years. The report also explores market dynamics, regulatory scenarios, and technological advancements that are shaping the industry. It assesses the impact of external factors and global economic changes on market growth. Lastly, it provides strategic recommendations for new entrants and established companies to navigate the complexities of the market.
Future Outlook
- Digital transformation will enhance automation and client engagement across advisory platforms.
- AI-driven analytics will improve investment decision-making and portfolio optimization.
- Sustainable and ESG-focused advisory services will gain stronger client preference.
- Hybrid advisory models will balance automation with personalized human expertise.
- Demand for retirement and wealth preservation planning will continue to rise globally.
- Cybersecurity and data protection will remain central to client trust and compliance.
- Advisory firms will expand services to small and medium-sized enterprises.
- Globalization of investment portfolios will boost cross-border financial consulting.
- Fee-based and performance-linked advisory models will replace traditional commission systems.
- Collaboration between fintech firms and traditional advisors will drive market innovation.
Request a Free Sample
Fill in your details and we'll send you a free sample report.
- Sample data tables & charts
- Research methodology
Need a Custom Version of This Report?
Tailor the scope, geography, or segments to your exact requirements.
- Custom geography or segment scope
- Direct access to our analyst team
Frequently Asked Questions
What is the current market size for Financial Advisory Services Market, and what is its projected size in 2032?
At what Compound Annual Growth Rate is the Financial Advisory Services Market projected to grow between 2025 and 2032?
Which Financial Advisory Services Market segment held the largest share in 2024?
What are the primary factors fueling the growth of the Financial Advisory Services Market?
Who are the leading companies in the Financial Advisory Services Market?
Table of Content
Chapter 1. Report Introduction
- 1.1 Report Description & Purpose
- 1.1.1 Report Title & Market Definition
- 1.1.2 Unique Selling Propositions (USP) & Key Differentiators
- 1.1.3 Value Proposition for Stakeholders
- 1.2 Research Objectives
- 1.2.1 Market Sizing Objectives (Volume & Revenue)
- 1.2.2 Segmentation Objectives
- 1.2.3 Competitive Intelligence Objectives
- 1.2.4 Forecast & Scenario Objectives
- 1.3 Report Scope
- 1.3.1 Financial Advisory Services Scope – Types & Subtypes Covered
- 1.3.2 Geographic Scope – Regions & Countries Covered
- 1.3.3 Historical Period, Base Year & Forecast Period (2024; forecast to 2032)
- 1.3.4 Inclusions & Exclusions
- 1.4 HS Code & Classification Framework
- 1.5 Currency, Units & Pricing Basis
- 1.6 Target Stakeholders
- 1.7 Limitations & Assumptions
Chapter 2. Executive Summary
- 2.1 Global Financial Advisory Services Market Snapshot
- 2.1.1 Market Size – Historical (2024) & Forecast (2024-2032) (2024: USD 94.31 billion → 2032: USD 137.22 billion)
- 2.1.2 Volume & Revenue – Global Totals
- 2.1.3 Key Market Highlights – Top Five Facts
- 2.2 Financial Advisory Services Market Segmentation Snapshot
- 2.2.1 Market Split by Region – 2024 vs. 2032
- 2.3 Competitive Snapshot
- 2.3.1 Top 10 Players by Revenue Share – 2024
- 2.3.2 Top 10 Players by Volume Share – 2024
- 2.3.3 Recent Strategic Developments (18-Month Summary)
- 2.4 Key Investment Highlights & Strategic Conclusions
Chapter 3. Financial Advisory Services Market Dynamics & Industry Analysis
- 3.1 Market Overview & Context
- 3.1.1 Financial Advisory Services Market Position in the Broader Automotive Value Chain
- 3.1.2 OEM vs. Replacement Market Dynamics
- 3.1.3 Market Maturity & Development Stage by Region
- 3.2 Financial Advisory Services Market Drivers
- 3.3 Financial Advisory Services Market Restraints & Challenges
- 3.4 Financial Advisory Services Market Opportunities
- 3.5 Porter's Five Forces Analysis
- 3.5.1 Threat of New Entrants
- 3.5.2 Bargaining Power of Suppliers
- 3.5.3 Bargaining Power of Buyers
- 3.5.4 Threat of Substitutes
- 3.5.5 Competitive Rivalry – Intensity Assessment
- 3.6 Financial Advisory Services Value Chain Analysis
- 3.6.1 Upstream – Raw Material/Input Suppliers
- 3.6.1.1 Raw Material/Input 1
- 3.6.1.2 Raw Material/Input 2
- 3.6.1.3 Raw Material/Input 3
- 3.6.2 Midstream – Production/Manufacturing/Service Delivery
- 3.6.2.1 Production/Process Overview
- 3.6.2.2 Key Facility Locations & Capacity by Manufacturer
- 3.6.3 Downstream – Distribution & End Consumer
- 3.6.3.1 Primary Channel – B2B/OEM
- 3.6.3.2 Secondary Channels – Dealer, Retail, Online, Direct
- 3.6.4 Value Chain Profitability Analysis
- 3.6.1 Upstream – Raw Material/Input Suppliers
- 3.7 PESTEL Analysis
- 3.7.1 Political Factors
- 3.7.2 Economic Factors
- 3.7.3 Social Factors
- 3.7.4 Technological Factors
- 3.7.5 Environmental Factors
- 3.7.6 Legal Factors
- 3.8 Financial Advisory Services Supply Chain Analysis
- 3.8.1 Raw Material/Input Supply Risk Assessment
- 3.8.2 Manufacturing Concentration Risk (Geographic Exposure)
- 3.8.3 Trade Disruption Impact Analysis
- 3.9 Regulatory & Policy Landscape
Note: The regulatory and policy landscape section covers regulations based on their applicability to the market, Financial Advisory Services category, geography, and scope of the study. Only regulatory frameworks with a material impact on operations, compliance, trade, sustainability, or market access are analyzed in detail.
Chapter 4. Key Investment Pockets & Opportunity Analysis
- 4.1 Financial Advisory Services Market Attractiveness Analysis
- 4.1.1 By Region – Investment Attractiveness Matrix (Volume × CAGR)
- 4.2 Absolute Revenue Growth Opportunity
- 4.2.1 By Region – Absolute USD Growth Through 2032
- 4.3 Incremental Volume Opportunity
- 4.3.1 By Region – Incremental Volume Through 2032
- 4.3.2 Segment – Incremental Volume
- 4.4 Emerging Submarket Opportunity Deep Dive (Subject to Applicability)
- 4.5 Emerging Market Opportunity Scorecards
- 4.5.1 United States
- 4.5.2 Europe
- 4.5.3 Asia
- 4.5.4 Middle East & Africa
Note: Emerging Market Opportunity Scorecards will be included based on relevance and strategic importance. Regions listed are indicative and may vary depending on data availability and market dynamics.
Chapter 5. Financial Advisory Services Import-Export Analysis & Trade Flows
- 5.1 Global Trade Overview
- 5.1.1 Global Export Value by Country (2024)
- 5.1.2 Global Export Volume by Country (2024)
- 5.1.3 Global Import Value by Country (2024)
- 5.1.4 Global Import Volume by Country (2024)
- 5.1.5 Net Trade Balance by Country (2024)
- 5.2 Export Analysis – Segment
- 5.2.1 Type 1 (HS Code)
- 5.2.2 Type 2 (HS Code)
- 5.2.3 Type 3 (HS Code)
- 5.2.4 Type 4 (HS Code)
- 5.2.5 Type 5 (HS Code)
- 5.3 Import Analysis – Segment
- 5.3.1 Type 1 (HS Code)
- 5.3.2 Type 2 (HS Code)
- 5.3.3 Type 3 (HS Code)
- 5.3.4 Type 4 (HS Code)
- 5.3.5 Type 5 (HS Code)
- 5.4 Average Unit Trade Prices
- 5.4.1 Average Export Price – Segment & Country
- 5.4.2 Average Import Price – Segment & Source Country
- 5.4.3 Price Trends (2024)
- 5.5 Key Trade Route Analysis
- 5.5.1 Trade Route 1
- 5.5.2 Trade Route 2
- 5.5.3 Trade Route 3
- 5.5.4 Trade Route 4
- 5.5.5 Trade Route 5
- 5.6 Trade Policy Impact Assessment
- 5.6.1 US Anti-Dumping & Section 301 Tariffs
- 5.6.2 EU Customs Union Impact
- 5.6.3 Major Free Trade Agreements
- 5.6.4 USMCA Rules of Origin
Note: Trade policy analysis will be included only where relevant to the Financial Advisory Services market.
Chapter 6. Competitive Landscape & Company Benchmarking
- 6.1 Financial Advisory Services Market Concentration & Structure
- 6.1.1 Herfindahl-Hirschman Index (HHI) – vs. 2024
- 6.1.2 Tier 1, Tier 2 & Tier 3 Market Structure
- 6.1.3 Global, Regional & Local Player Dynamics
- 6.2 Financial Advisory Services Market Share Analysis – 2024
- 6.2.1 Global Revenue Share by Company
- 6.2.2 Global Volume Share by Company
- 6.2.3 Regional Revenue Share
- 6.2.4 Market Share Evolution ( vs. 2024)
- 6.2.5 OEM Segment Share by Company
- 6.2.6 Replacement Segment Share by Company
- 6.3 Production/Delivery Capacity & Facility Analysis
- 6.3.1 Global Installed Capacity
- 6.3.2 Capacity Utilization Rates
- 6.3.3 Production/Output Volume
- 6.3.4 Facility Locations & Capacity Map
- 6.3.5 Planned Capacity Additions
- 6.4 Financial Advisory Services Competitive Benchmarking Matrix
- 6.4.1 Revenue, Volume, CAGR & Profitability Comparison
- 6.4.2 Channel Revenue Mix
- 6.4.3 Geographic Revenue Exposure
- 6.4.4 R&D Intensity
- 6.4.5 Sustainability Maturity
- 6.5 Strategic Developments in Financial Advisory Services (Last 24 Months)
- 6.5.1 Mergers, Acquisitions & Divestments
- 6.5.2 New Financial Advisory Services Launches
- 6.5.3 Facility Expansions
- 6.5.4 Strategic Alliances, Joint Ventures & Partnerships
- 6.5.5 Distribution Expansion & Market Entry
- 6.5.6 Sustainability & ESG Initiatives
- 6.6 Competitive Strategy Mapping
- 6.6.1 Leader, Challenger, Follower & Niche Classification
- 6.6.2 Pricing Strategy Comparison
- 6.6.3 Channel Strategy Matrix
Note: Strategic developments are included based on their materiality and the availability of reliable information.
Chapter 7. Global Financial Advisory Services Market – By Distribution Channel
- 7.1 Segment Overview
- 7.1.1 Volume & Revenue Split by Channel (2024 & 2032)
- 7.1.2 Channel Mix Evolution (2024-2032)
Chapter 8. Regional Market Analysis – Global Overview
- 8.1 Global Regional Overview
- 8.1.1 Regional Volume Share
- 8.1.2 Regional Revenue Share
- 8.1.3 Regional Volume by Region
- 8.1.4 Regional Revenue by Region
- 8.1.5 Regional Forecast Through 2032
- 8.2 Cross-Regional Segment Analysis
- 8.2.1 By Distribution Channel
- 8.2.2 By Brand/Price Tier
Chapter 9. North America Financial Advisory Services Market
- 9.1 United States
- 9.2 Canada
- 9.3 Mexico
Chapter 10. Europe Financial Advisory Services Market
- 10.1 Germany
- 10.2 France
- 10.3 Italy
- 10.4 United Kingdom
- 10.5 Spain
- 10.6 Poland
- 10.7 Russia
- 10.8 Netherlands
- 10.9 Belgium
- 10.10 Sweden
- 10.11 Denmark
- 10.12 Norway
- 10.13 Rest of Europe
Chapter 11. Asia Pacific Financial Advisory Services Market
- 11.1 China
- 11.2 India
- 11.3 Japan
- 11.4 South Korea
- 11.5 Thailand
- 11.6 Indonesia
- 11.7 Vietnam
- 11.8 Malaysia
- 11.9 Australia
- 11.10 Rest of Asia Pacific
Chapter 12. Latin America Financial Advisory Services Market
- 12.1 Brazil
- 12.2 Argentina
- 12.3 Colombia
- 12.4 Chile
- 12.5 Rest of Latin America
Chapter 13. Middle East Financial Advisory Services Market
- 13.1 Saudi Arabia
- 13.2 United Arab Emirates
- 13.3 Turkey
- 13.4 Israel
- 13.5 Iran
- 13.6 Rest of the Middle East
Chapter 14. Africa Financial Advisory Services Market
- 14.1 South Africa
- 14.2 Egypt
- 14.3 Nigeria
- 14.4 Morocco
- 14.5 Rest of Africa
Chapter 15. Financial Advisory Services Company Profiles
- 15.1 [Company 01]
- 15.1.1 Company Overview
- 15.1.2 Key Management Personnel
- 15.1.3 Products & Services Portfolio
- 15.1.4 Financial Performance
- 15.1.5 Key Market Focus & Geographic Presence
- 15.1.6 Recent Developments & Strategic Initiatives
Note: The company profile list is preliminary and may change based on research findings, market developments, data availability, and client requirements.
Chapter 16. Appendices
- Appendix A – List of Abbreviations & Acronyms
- Appendix B – Industry Classification Code Reference – Full Series
- Appendix C – Production & Capacity Data Tables
- Appendix D – End-Use & Demand Base Tables
- Appendix E – Consumption & Replacement Rate Assumptions
- Appendix F – ASP Reference Tables
- Appendix G – Manufacturing & Facility Database
- Appendix H – Import-Export Data Tables
- Appendix I – Regulatory Summary Tables
- Appendix J – Primary Research Participant List (Anonymized)
- Appendix K – Primary Research Questionnaire Framework
- Appendix L – Data Sources & Bibliography
- Appendix M – Market Size Divergence & Source Comparison
Chapter 17. Research Methodology
- 17.1 Research Framework & Philosophy
- 17.2 Secondary Research – Sources, Hierarchy & Data Extraction
- 17.3 Data Modeling – Bottom-Up & Top-Down Market Sizing
- 17.4 Primary Research – Stakeholder Framework, LOI & Sample Sizes
- 17.5 Forecast Methodology – Regression, Scenario & Sensitivity Analysis
- 17.6 Quality Control – Four-Layer Validation Framework
- 17.7 Limitations & Standard Assumptions
- 17.8 Disclaimer
