Commission, spread and financing income define the pool
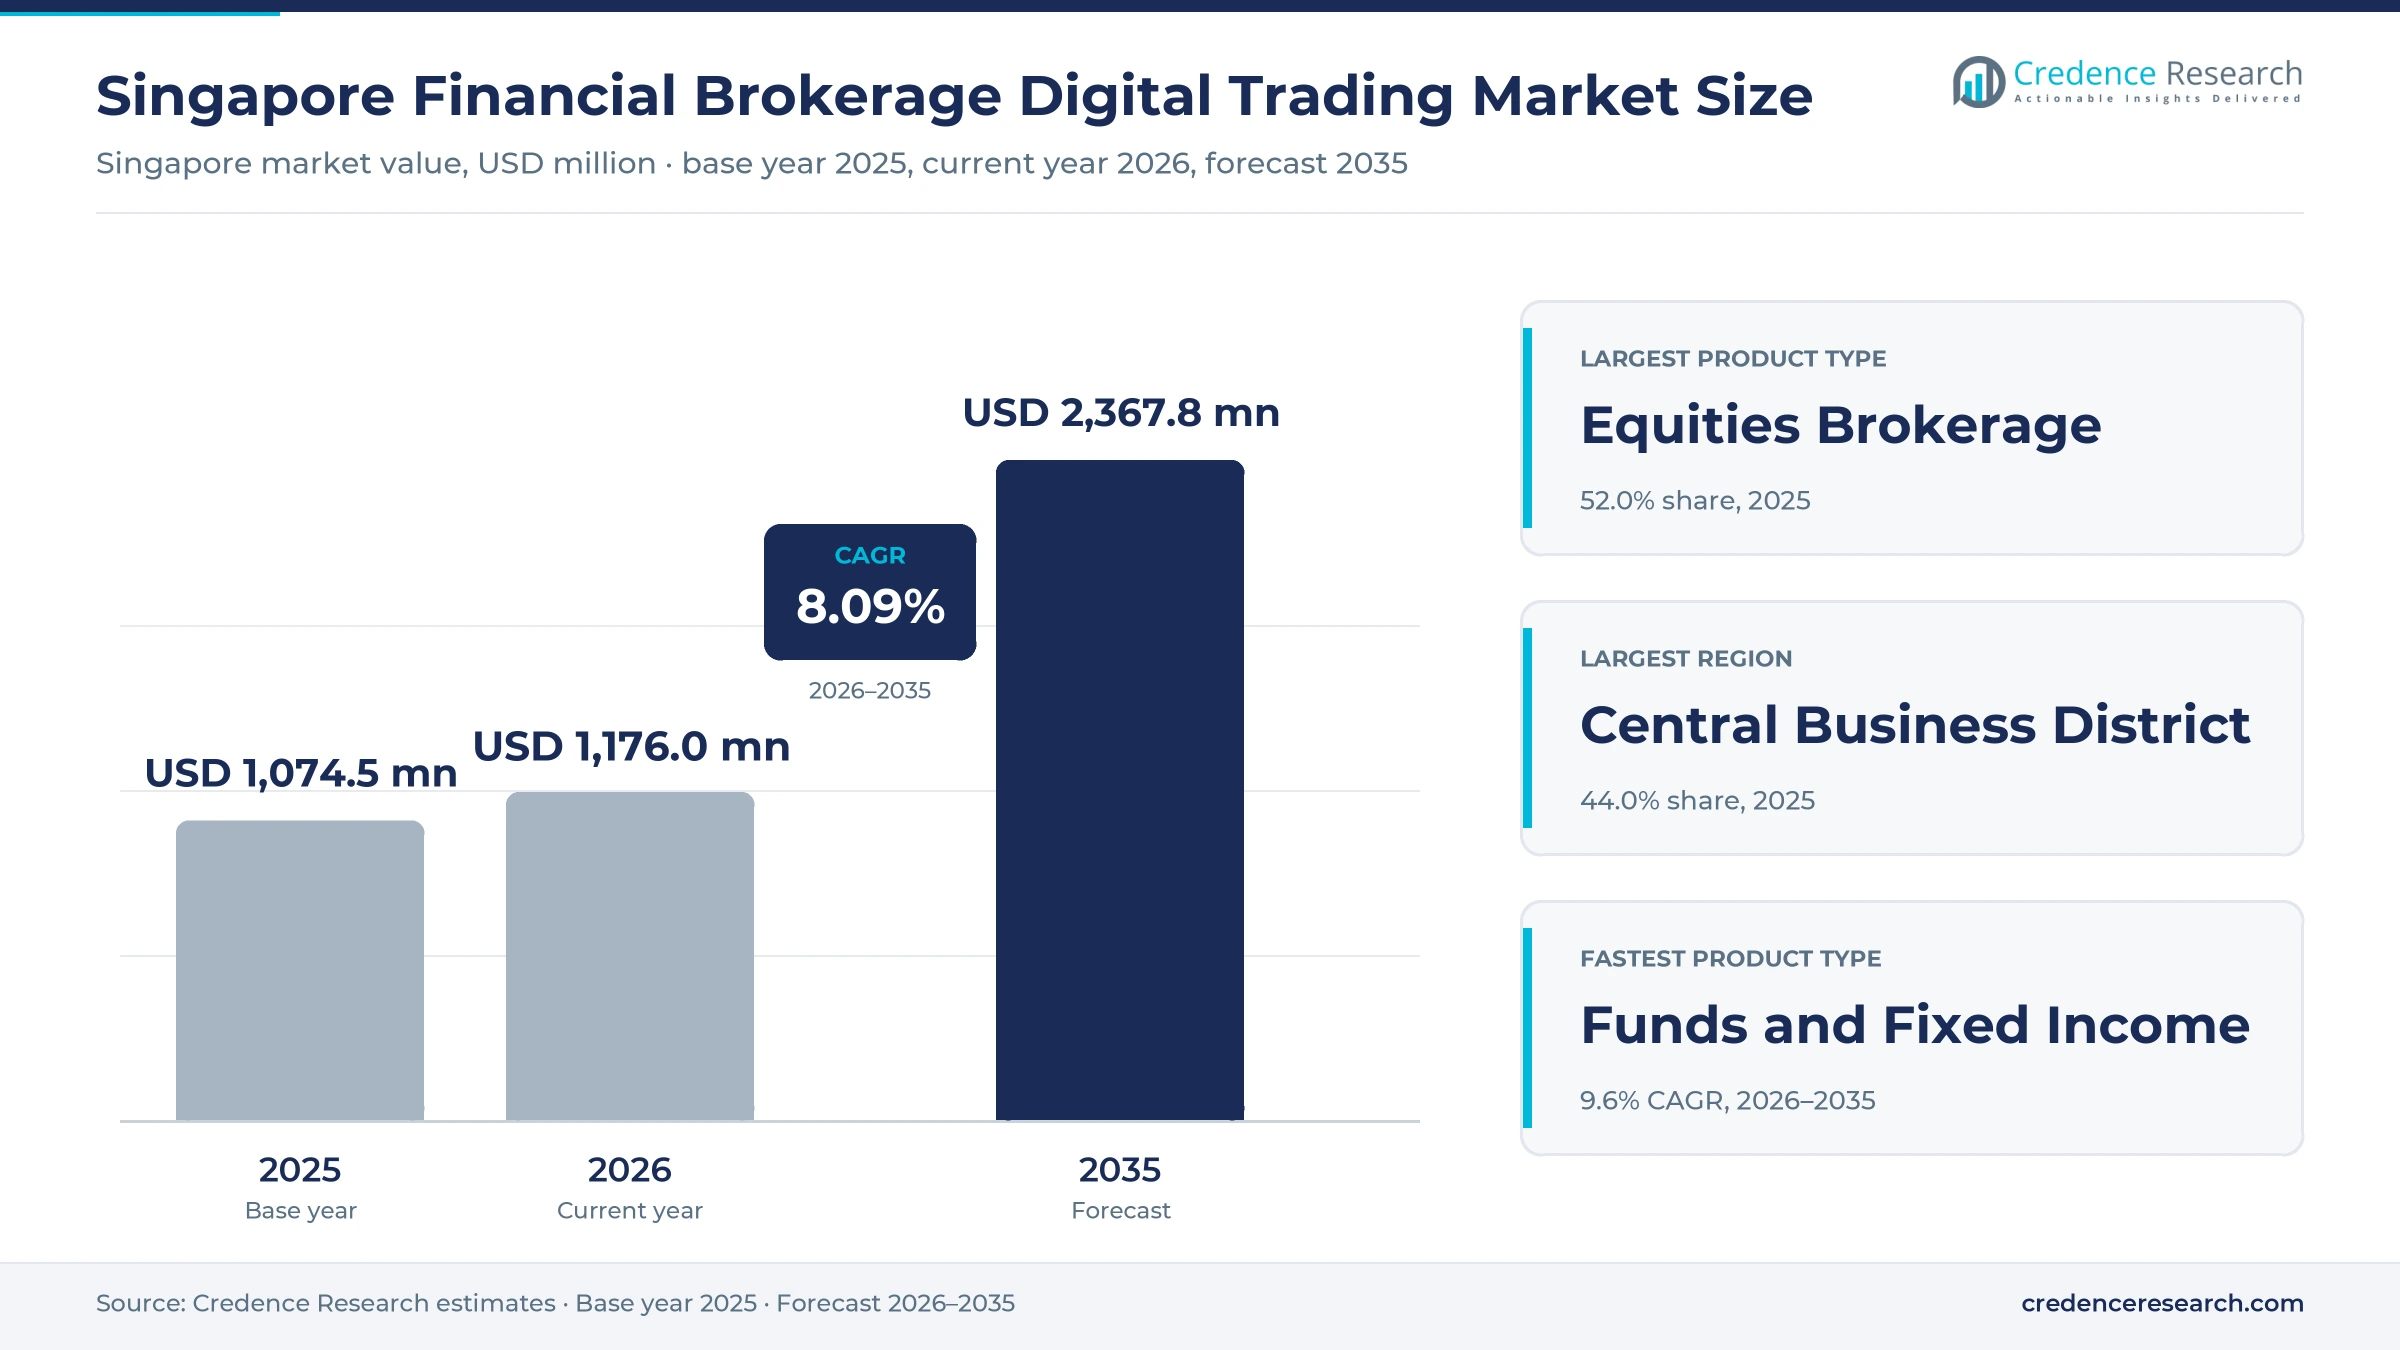
The Singapore financial brokerage digital trading market was valued at USD 1.07 billion in 2025 and is projected to increase from USD 1.18 billion in 2026 to USD 2.37 billion by 2035, registering a CAGR of 8.09% during 2026–2035. Demand comes from self-directed investors funding app accounts, a stronger Singapore Exchange and offshore equity access. The Central Business District held the largest regional share, 44.0% in 2025, because institutional desks and many licensed broker offices sit there. The North-East Region is the fastest-growing region at 8.90% a year as younger resident households open app accounts. Securities turnover on the exchange rose 35% to S$455.7 billion in the year to June 2026, with the daily average the highest in 18 years. In addition, the Monetary Authority of Singapore enlarged its equity market development program to S$6.5 billion in February 2026, and board lots for shares above S$10 fell on Oct. 5, 2026, which lowers the entry ticket for small accounts.
What does Singapore brokerage revenue actually count?
The market measures fee and financing income earned by licensed intermediaries serving clients in Singapore. That income includes commissions and transaction fees, margin and financing interest, spreads on foreign exchange and contracts for difference, platform and data fees, and custody and service charges. Clients reach these services through mobile apps, web platforms, dealers and direct market access.
The market excludes the value of securities traded, exchange fees kept by Singapore Exchange, investment banking fees, fund management fees and crypto-only venues. Value therefore moves with turnover and yield rather than with assets alone. Exchanges, clearing houses, brokers and custody agents form the value chain, and brokers keep only the client-facing margin.
Singapore Financial Brokerage Digital Trading Market Insights
- The market was valued at USD 1.07 billion in 2025 and is forecast to reach USD 2.37 billion by 2035, growing at 8.09% a year during 2026–2035.
- The Central Business District held 44.0% of 2025 value, while the North-East Region grows fastest at 8.90% a year as resident accounts spread beyond the city center.
- Equities Brokerage led with 52.0% of 2025 value, supported by exchange turnover of S$369.6 billion across calendar 2025.
- Board lots of 10 units or one unit took effect on Oct. 5, 2026, after omnibus broker custody became permitted on July 14, 2026.
- Interactive Brokers Singapore joined the SGX derivatives market as a trading and clearing member in April 2026, while Phillip Securities removed U.S. stock commissions in May 2026.
Equities lead while funds and digital brokers gain share
Why do equities still anchor broker income?
Based on product type, the market is categorized into equities brokerage, derivatives and options, forex and leveraged products, and funds and fixed income. Equities Brokerage led with 52.0% of 2025 value because Singapore Exchange recorded S$369.6 billion of securities turnover in calendar 2025, the largest commissionable base in the country. Funds and Fixed Income grows fastest at 9.60% a year as exchange-traded funds passed S$20.5 billion in assets by June 2026. Net inflows reached S$2.4 billion in the second half of fiscal 2026, according to Singapore Exchange, while Saxo opened $0 commission monthly ETF plans in January 2026.
Which clients produce the most income, and who is growing?
Based on customer segment, the market is categorized into self-directed retail investors, high-net-worth investors, institutional investors and corporate and treasury clients. Self-Directed Retail Investors led with 38.0% of 2025 value because retail daily turnover rose 52% in fiscal 2026 to a 12-year high, according to Singapore Exchange. High-Net-Worth Investors grow fastest at 8.80% a year as providers build dedicated service tiers around them. OCBC moved its securities arm into Global Markets on July 1, 2025, to pursue high-net-worth and institutional clients. Saxo followed in May 2026 with Elite, a relationship-managed service for accredited investors and active traders.
Why are apps ahead of dealers, and where is direct access heading?
Based on distribution channel, the market is categorized into mobile trading applications, web trading platforms, relationship and dealer channels, and API and direct market access. Mobile Trading Applications led with 41.0% of 2025 value because onboarding has become very short, with Maybank reporting that 90% of its clients open accounts in under three minutes through MyInfo. API and Direct Market Access grows fastest at 9.36% a year as active firms seek lower execution costs. Interactive Brokers Singapore gained direct SGX derivatives execution and clearing on April 23, 2026, removing a third-party intermediary for clients using algorithmic execution software and similar tools.
How do bank-backed houses compare with digital challengers?
Based on institution type, the market is categorized into bank-backed brokerages, independent full-service brokers, digital-native brokerages and global multi-asset brokers. Bank-Backed Brokerages led with 34.0% of 2025 value because they pair deposits with dealing, and OCBC says its securities unit ranked among the top three retail stockbrokers by trading volume over the past 10 years. Digital-Native Brokerages grow fastest at 9.71% a year as app-led firms take active accounts. Futu reported in May 2026 that moomoo ranked first in cumulative app downloads in Singapore and received a Fastest Growing Retail Broker award from SGX Group.
| Segment Group | Leading Sub-segment | Share, 2025 | Fastest-growing Sub-segment | CAGR, 2026–2035 |
|---|---|---|---|---|
| By Product Type | Equities Brokerage | 52.0% | Funds and Fixed Income | 9.60% |
| By Customer Segment | Self-Directed Retail Investors | 38.0% | High-Net-Worth Investors | 8.80% |
| By Distribution Channel | Mobile Trading Applications | 41.0% | API and Direct Market Access | 9.36% |
| By Institution Type | Bank-Backed Brokerages | 34.0% | Digital-Native Brokerages | 9.71% |
Request a Free Sample
Fill in your details and we'll send you a free sample report.
- Sample data tables & charts
- Research methodology
Funded accounts and SGX reform lift broker activity
Why are funded app accounts expanding so quickly?
Funded app accounts widen the paying client base, which lifts commission and financing income together. Retail daily turnover on Singapore Exchange rose 52% in fiscal 2026 and cumulative retail net inflows reached S$2.4 billion, according to the SGX Group release of July 2026. Moomoo ranked first in cumulative app downloads in Singapore in the first quarter of 2026, and parent Futu counted 3.59 million funded accounts worldwide by March 31, 2026. Tiger Brokers (Singapore) is also among only 10 firms on the Central Provident Fund list of SGX broking firms for retail clients, dated August 2025. As a result, Mobile Trading Applications held 41.0% of 2025 value, and new accounts usually arrive through a phone rather than a dealer.
How do domestic turnover and policy support lift brokers?
Commission income rises directly with exchange value, and state capital gives that activity a longer runway. Securities turnover rose 35% to S$455.7 billion in the year to June 2026, and the June 2026 daily average of S$2.1 billion was 72% above the prior year. The Monetary Authority of Singapore enlarged the Equity Market Development Program from S$5 billion to S$6.5 billion on Feb. 12, 2026. It had already placed S$2.85 billion with six managers on Nov. 19, 2025, widening asset management mandates focused on local shares. Because of this, small- and mid-cap daily turnover jumped 155% to S$310 million, which gives brokers a wider base beyond the three banks and the largest index names.
Why does multi-asset demand favor cross-border platforms?
Singapore clients increasingly want one account for foreign shares, futures and currencies, which rewards brokers with wide market access. Singapore Exchange handled 363.5 million derivatives contracts in fiscal 2026, up 15%, with foreign exchange futures up 31% to 96.3 million contracts. Interactive Brokers, whose group offers online share dealing worldwide across more than 170 markets, joined as a derivatives member in April 2026, when SGX counted 68 trading members and 34 clearing members. Trust Bank and Saxo opened U.S. fractional shares from US$10 in January 2026, and about 45% of 10,000 early customers made such trades. API and Direct Market Access consequently grows at 9.36% a year, the quickest rate among channels here.
How do ETF flows add steady fee income?
Exchange-traded funds give brokers recurring activity that depends less on share price swings, which steadies revenue through a cycle. ETF assets on Singapore Exchange passed S$20.5 billion at the end of June 2026, and STI ETF assets alone exceeded S$5 billion after 15 straight months of inflows. Second-half fiscal 2026 ETF net inflows reached S$2.4 billion, up 240% on the prior year, according to Singapore Exchange. Saxo launched AutoInvest in January 2026, offering more than 100 eligible ETFs with no minimum investment and $0 commission on those purchases. This flow lifts custody and platform income even when commissions fall, and it explains why Funds and Fixed Income grows at 9.60% a year.
Custody reform and smaller lots reshape retail access
Why is the shift to omnibus custody significant?
Client relationships and servicing costs are moving toward brokers, and that changes who earns custody income. Singapore Exchange said depository agents could hold SGX securities in omnibus broker custody accounts from July 14, 2026. Brokers and depository agents must also meet minimum service standards on shareholder rights, including corporate actions and meetings, by the end of 2026. Those standards add operating cost, so smaller houses may outsource the work. Cash equities made up 34% of SGX revenue in fiscal 2026, according to its results call, which shows how much rides on this plumbing. Bank-Backed Brokerages therefore keep an advantage, holding 34.0% of 2025 value, because custody operations already exist inside their parent groups.
How is the rise of smaller board lots changing tickets?
A local blue-chip purchase now needs far less cash, which could bring young investors back from foreign shares. From Oct. 5, 2026, Singapore Exchange cut the lot to 10 units for instruments priced above S$10 up to S$100, and to one unit above S$100. The first round covered 11 stocks, and the next quarterly review comes in January 2027, using closing prices from July through December 2026. A moomoo executive called the change a big catalyst for young investors, FXLeaders reported and Phillip Securities published a client guide in September 2026. Tickets will shrink, so a broker needs low-cost automation to earn money on them. Minimum commission schedules will consequently come under closer scrutiny from clients placing orders in single units.
Where is the opening in small- and mid-cap coverage?
Brokers with research teams can gain here, because smaller listed stocks now trade far more actively. Daily turnover in this group rose 155% to S$310 million in fiscal 2026, and institutional net buying reached S$606 million, about three times the fiscal 2025 total, according to Singapore Exchange. The Monetary Authority of Singapore also set aside S$50 million in July 2025 for local equity research and a listed product ecosystem. Maybank Securities Singapore, which reports coverage of 376 stocks by 46 analysts, shows the depth a serious house can offer. Firms with such coverage can sell research-led execution to funds and High-Net-Worth Investors at better margins than a discount app.
Which opening does the global listing board create?
Dual-listed growth companies could give Singapore brokers new products and placement work for active clients. SGX management said on its fiscal 2026 results call that the Nasdaq-linked board was live and operationally ready, though the timing of first listings remained uncertain. Companies listing there must raise capital in Singapore from day one, which creates fresh demand for placement and distribution. SGX also welcomed 21 new listings in fiscal 2026, and about 50 companies are preparing to list. Singapore Depository Receipts add a further shelf, with three recently launched and U.S.-listed names under study. Cash equities net revenue at SGX rose 28% in fiscal 2026, so brokers with distribution capacity have a growing pool to pursue.
Zero commission and scam risk squeeze broker margins
Will zero commission reduce yield across the market?
Pricing on foreign shares has fallen to nothing at several providers, which cuts income per order. Phillip Securities waived its commissions and platform fees on U.S. stocks and ETFs from May 13, 2026, according to Mothership, and Interactive Brokers rolled out a similar offer to Singapore residents in 2025, Finance Magnates reported. Full-service houses face the sharpest effect because dealers depend on commission payouts. Brokers respond by raising margin, foreign exchange and custody income, which makes revenue more dependent on rates.
How does scam risk raise onboarding costs?
Fraud raises compliance costs and erodes trust among new investors. Singapore authorities reported losses of S$456.4 million across 19,665 cases in the first half of 2025, and investment scams carried the highest average loss at S$53,915 per victim, Finance Magnates reported in September 2025. New account checks and client warnings therefore take more staff and time, especially at app brokers relying on very fast onboarding. Firms with weak controls also face MAS action, as One Heritage Capital Management found on Oct. 29, 2025, when it lost its license.
Why is the leveraged client pool so small?
Few active traders use margin products, which caps spread income for specialist providers. Finance Magnates reported 39,000 active contract-for-difference traders in November 2025, with a potential base of about 75,000, and the wider online community stood below 250,000 in 2024. The count of contract-for-difference and forex traders rose only 3% over the past year, the first growth since 2021, according to the same report. Providers therefore compete for the same active clients, and acquisition costs stay high.
How exposed are brokers to the volume cycle?
Broker income is highly exposed to turnover, and the fiscal 2026 surge may not repeat. Daily turnover in December 2025 was S$1.17 billion against S$2.1 billion in June 2026, according to SGX monthly statistics, a swing of about 79% within six months. The International Monetary Fund projects growth slowing from 5.0% in 2025 to 3.5% in 2026 and 2.7% in 2027. A weaker economy would therefore hit commissions and margin balances together. Brokers with fee-based custody and funds income can absorb that swing better than dealer-led firms.
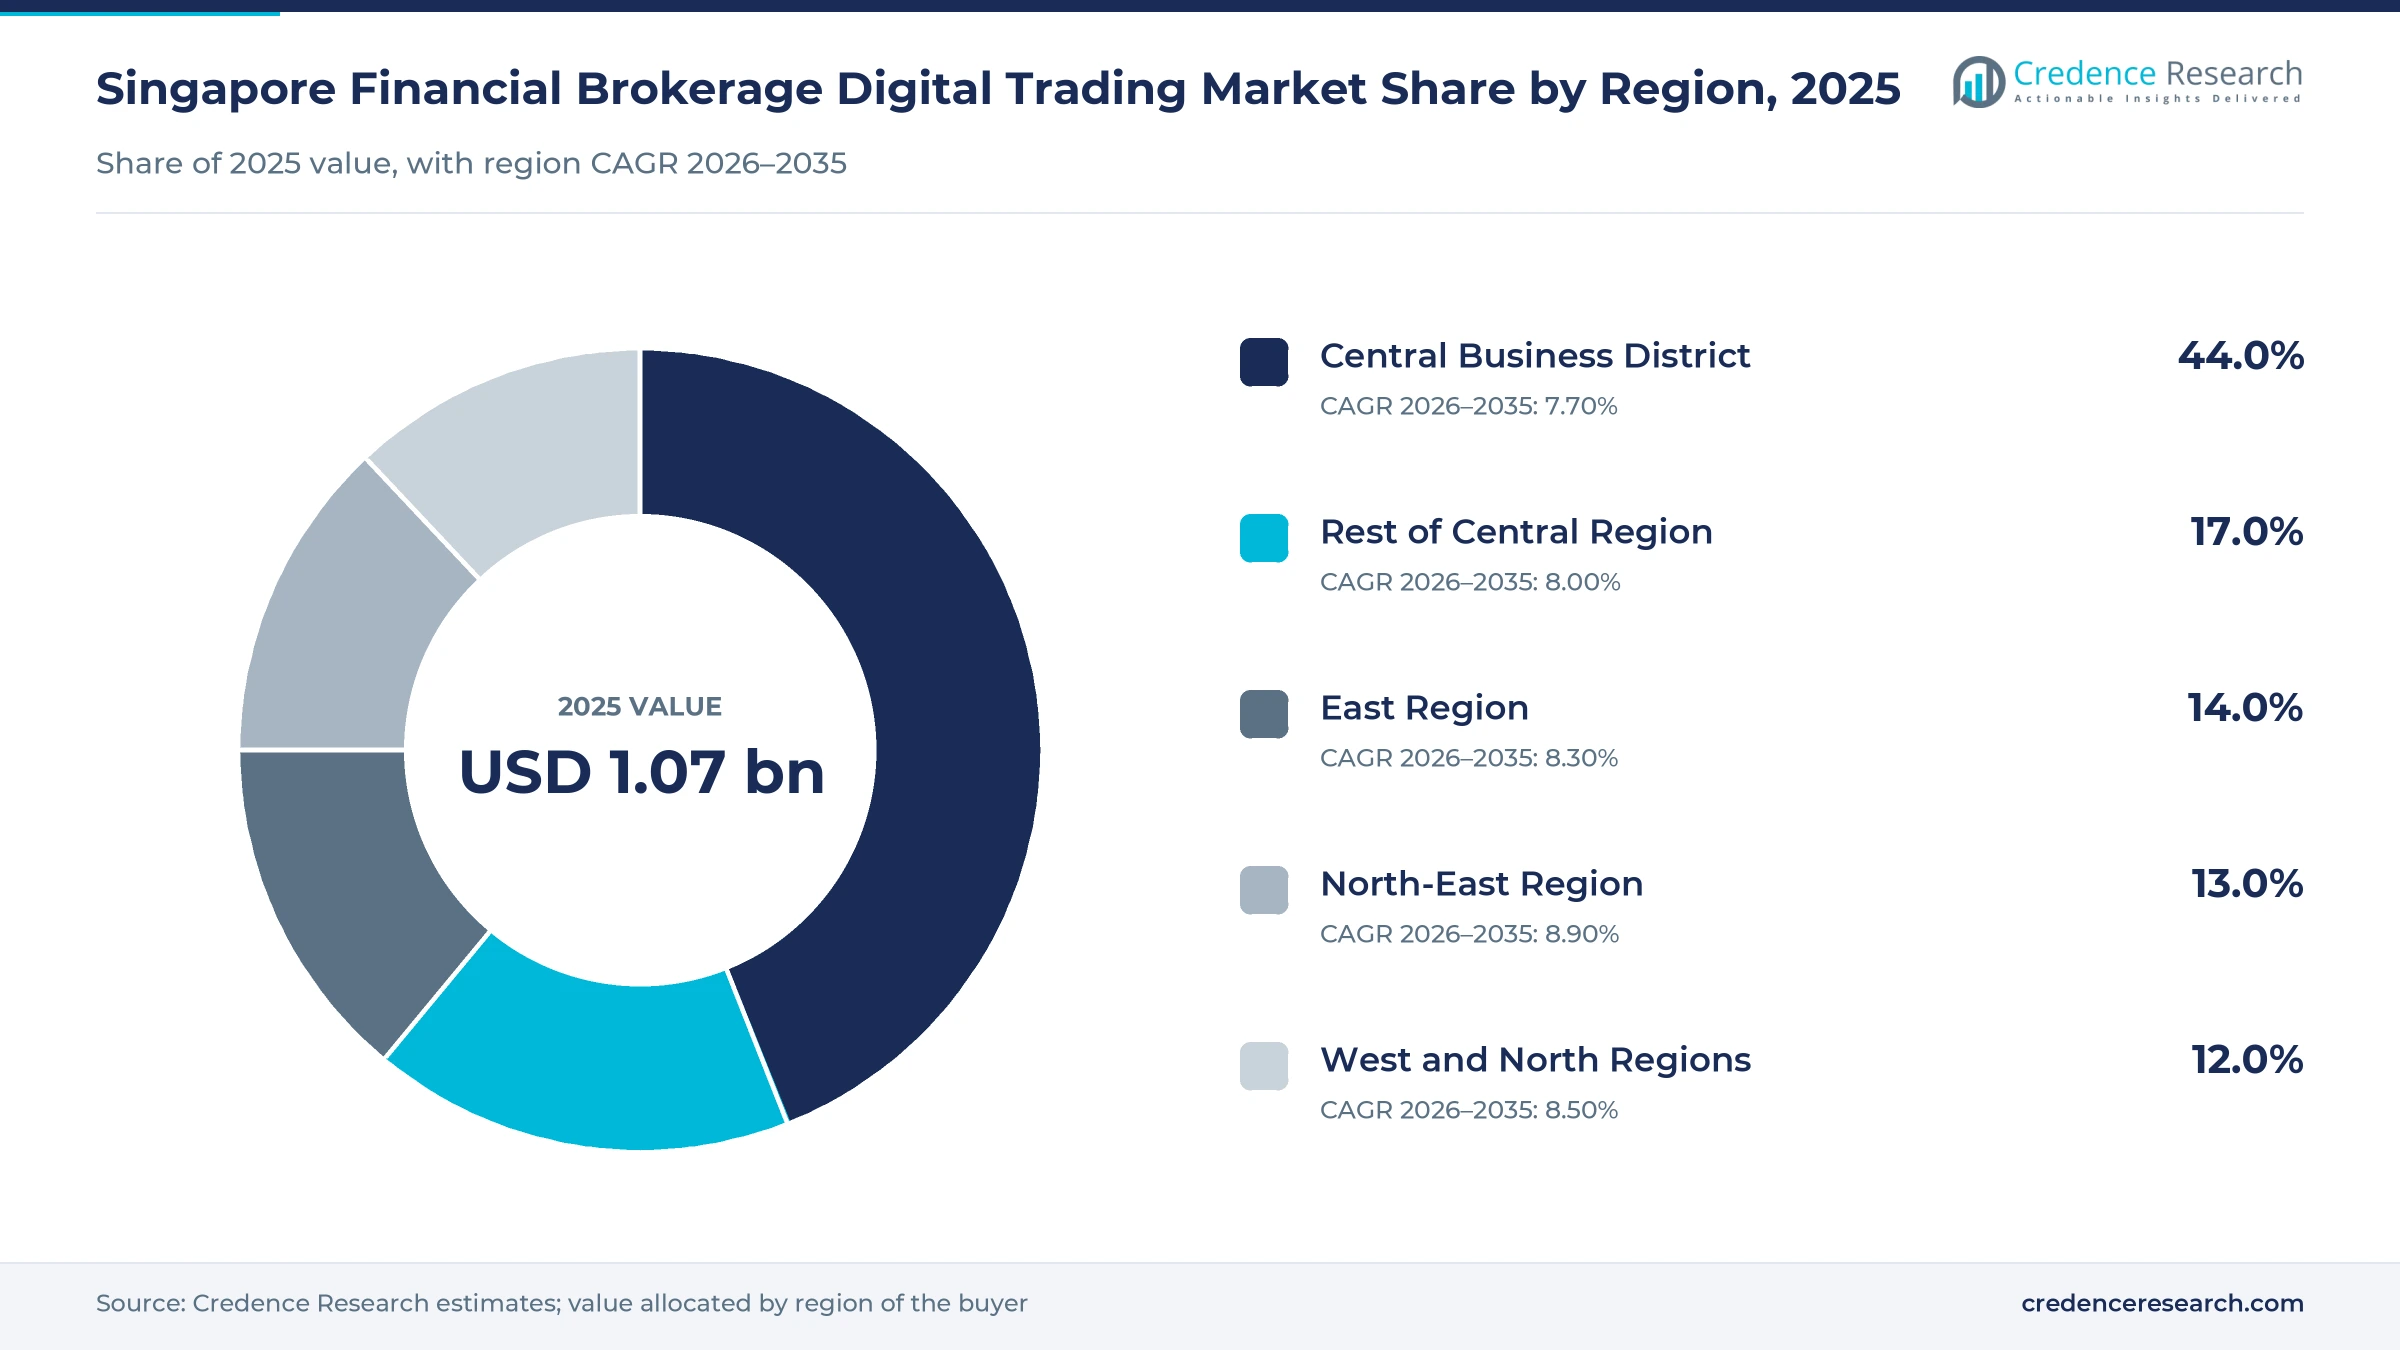
The CBD books most value as resident accounts spread out
| Region | Value, 2025 (USD billion) | Share, 2025 | CAGR, 2026–2035 |
|---|---|---|---|
| Central Business District | 0.47 | 44.0% | 7.70% |
| Rest of Central Region | 0.18 | 17.0% | 8.00% |
| East Region | 0.15 | 14.0% | 8.30% |
| North-East Region | 0.14 | 13.0% | 8.90% |
| West and North Regions | 0.13 | 12.0% | 8.50% |
Why do institutional desks dominate the core?
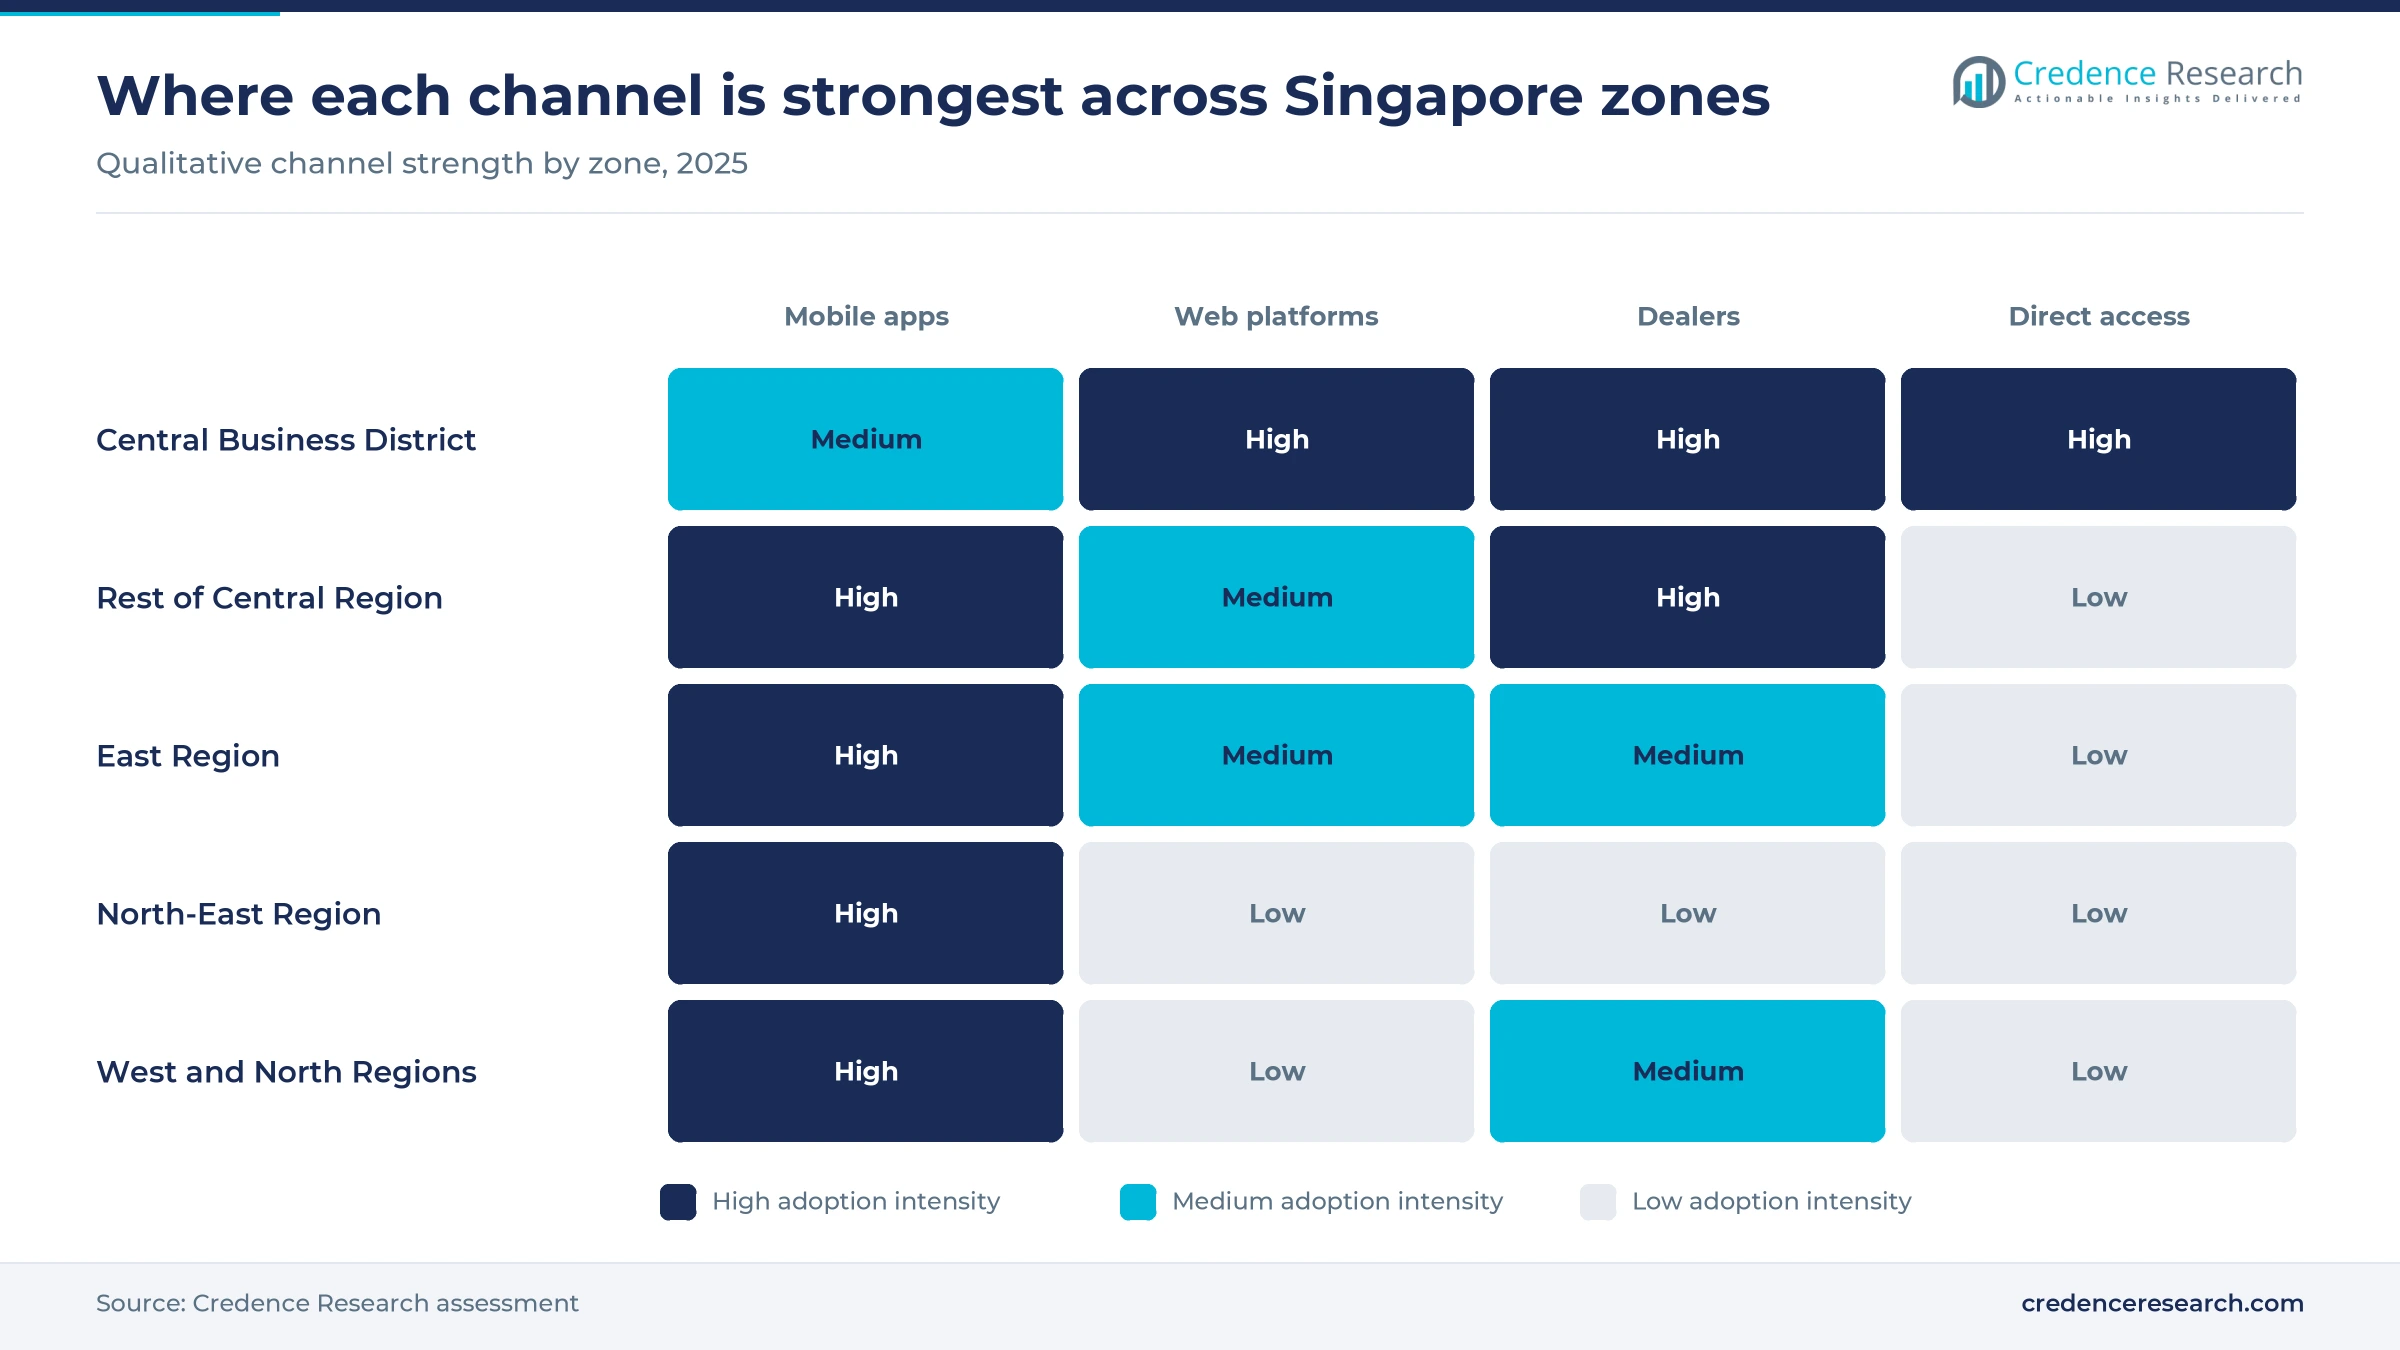
The Central Business District held 44.0% of 2025 value and grows at 7.70% a year, because institutional dealing and many broker offices cluster there. Moomoo Financial Singapore lists its office at 10 Marina Boulevard and Saxo at 88 Market Street in CapitaSpring, according to their own pages. Desks there serve funds, family offices and treasury clients that trade larger tickets than retail accounts do. Its growth lags resident zones because retail daily turnover rose faster than total securities turnover in fiscal 2026, according to Singapore Exchange.
What keeps affluent households with dealers?
The Rest of Central Region held 17.0% of 2025 value and grows at 8.00% a year, reflecting higher-income households outside the core business zone. Relationship service remains important here, and NextInsight reported in June 2026 that UOB Kay Hian, the largest retail broker by sales force, has a client base skewed toward affluent groups. The same report noted that the broker's trading app lags fintech peers, which suggests that dealer relationships still carry much of its service for these clients.
How much does the East Region add through resident accounts?
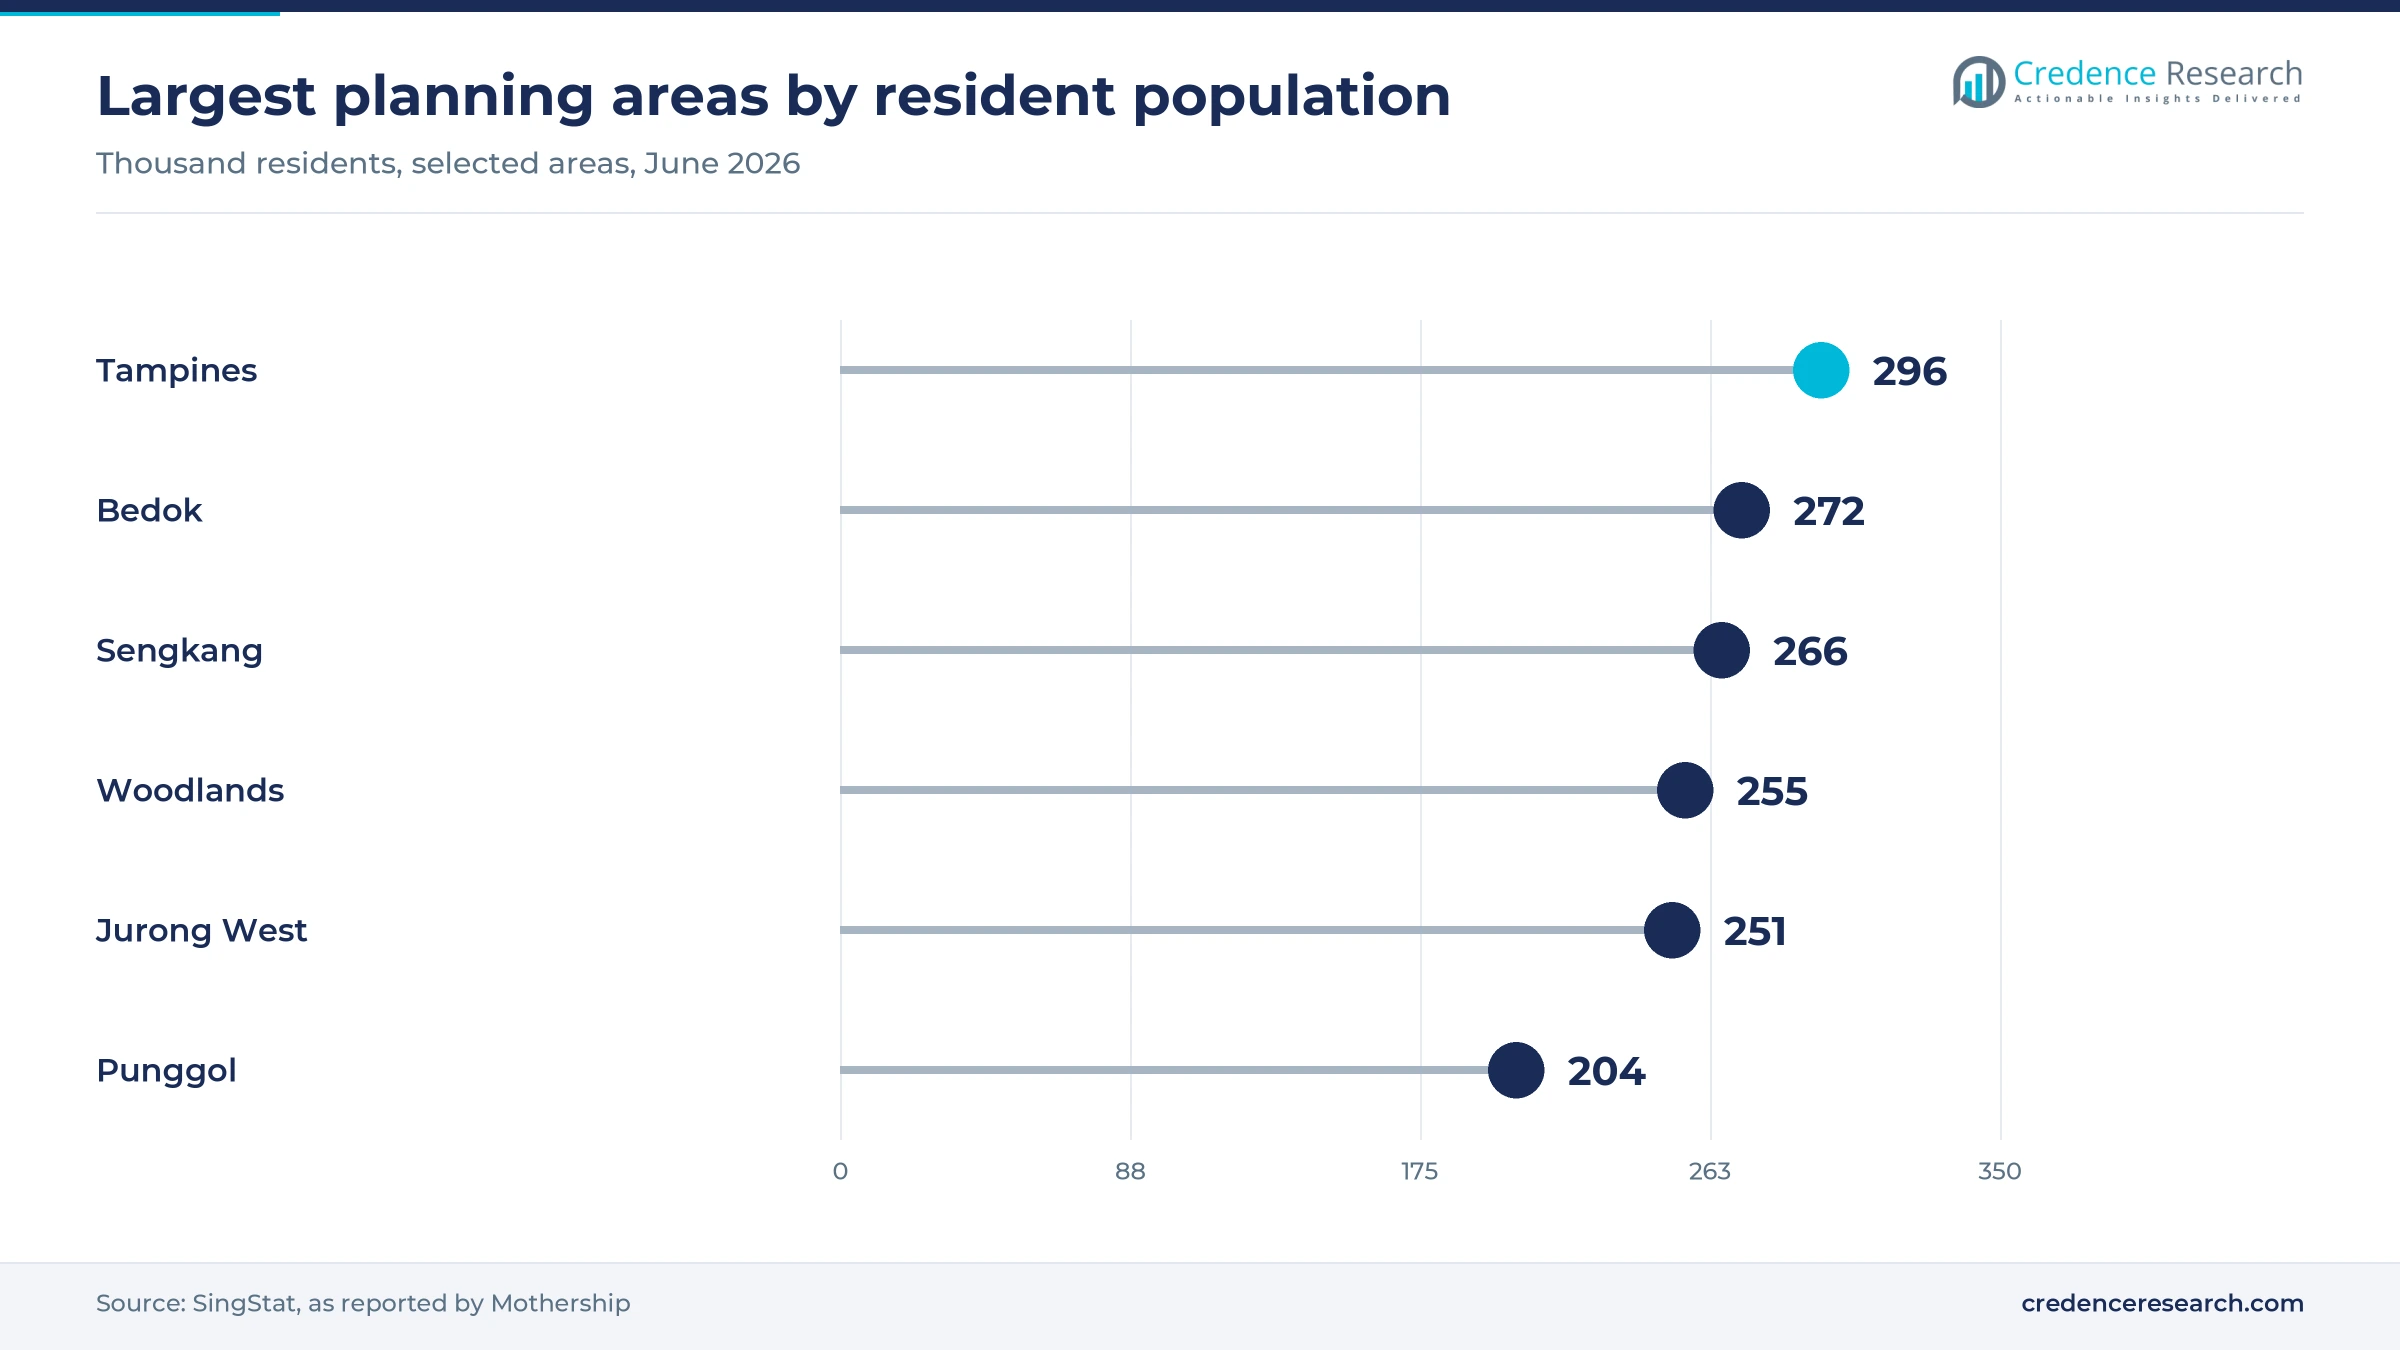
The East Region held 14.0% of 2025 value and grows at 8.30% a year, supported by two of the most populous planning areas in the country. SingStat counted 296,060 residents in Tampines and 272,120 in Bedok in 2026, according to the SingStat newsletter of October 2026, as reported by Mothership. Established households in these towns suit ETF plans and blue-chip purchases rather than frequent leveraged activity. Smaller board lots should help here, because tickets in local banks now need less cash.
Why do younger towns add value fastest?
The North-East Region held 13.0% of 2025 value and grows fastest at 8.90% a year, because younger towns feed app account openings. SingStat data reported by Mothership put Punggol at 204,490 residents in 2026, with Sengkang at about 266,000, up from 219,380 in 2016. Younger households in those towns are the natural audience for fractional shares from US$10, such as the Trust Bank and Saxo offer of January 2026. Income per account stays modest at first, so value builds gradually with deposits and activity.
What limits the two outer zones today?
The West and North Regions held 12.0% of 2025 value and grow at 8.50% a year, a smaller share than their population would suggest. SingStat counted 255,280 residents in Woodlands and 250,890 in Jurong West in 2026, according to Mothership. Fewer high-income households and fewer dealer relationships hold income per resident below the central zones. App brokers do not need branches to serve these towns, however, so remote account opening should narrow the gap steadily through 2035.
Dated moves by regulators, SGX and brokers since 2025
| Development | Status and market relevance |
|---|---|
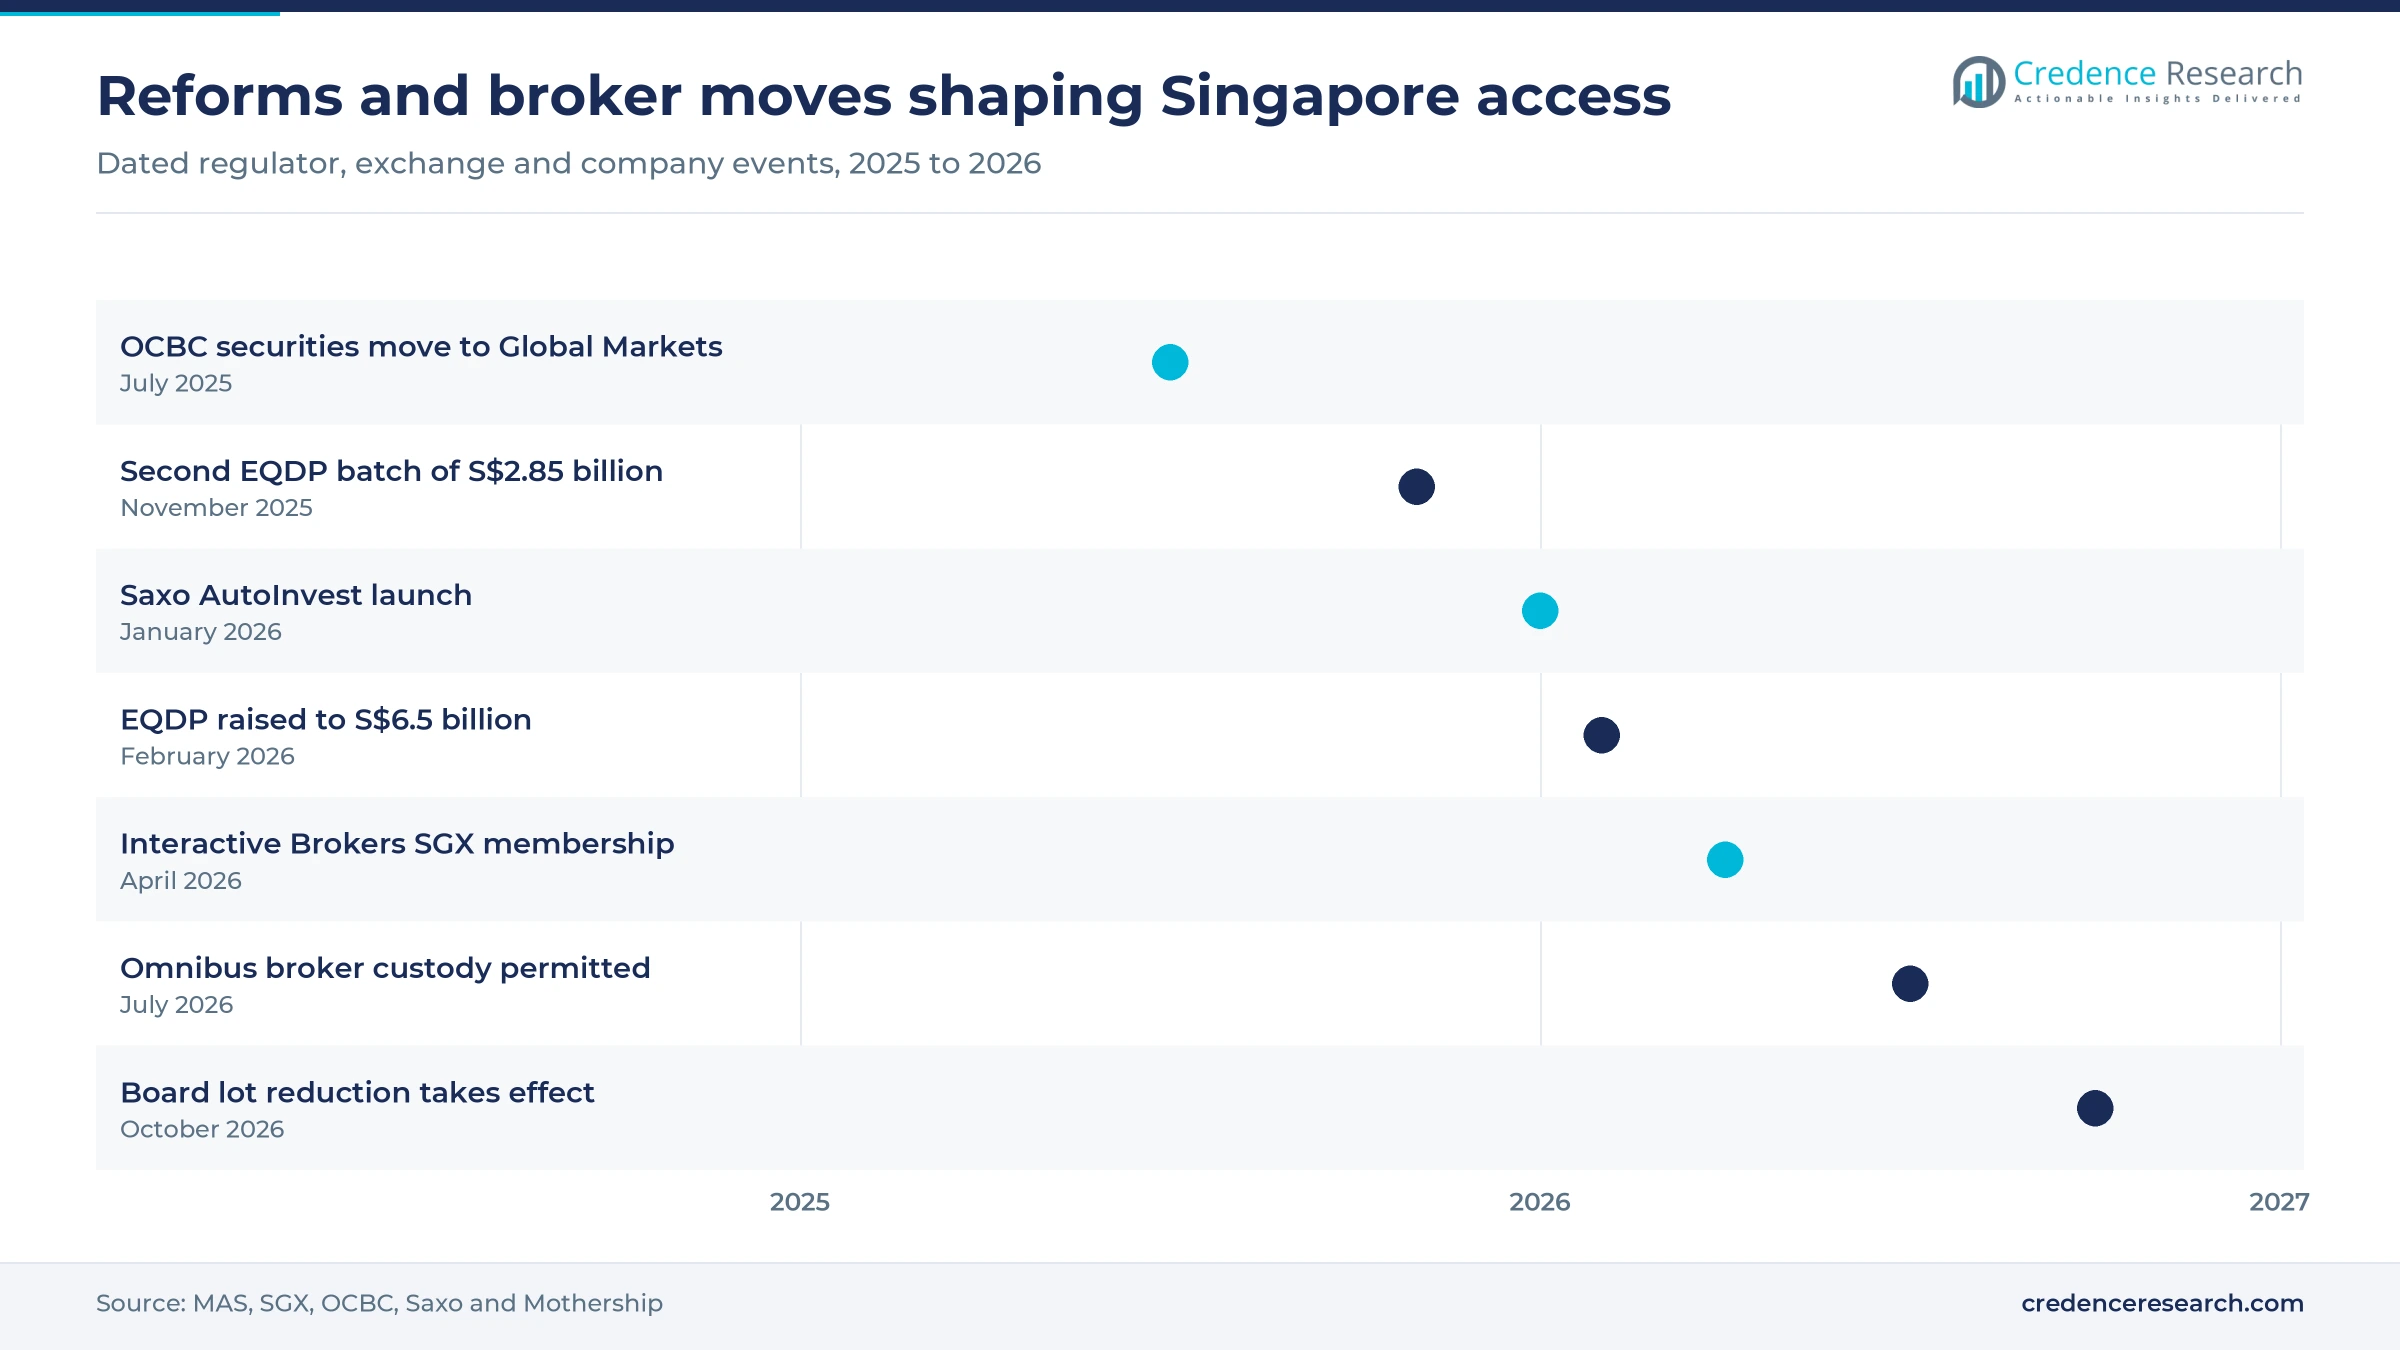
| In May 2025, OCBC announced that its securities units would move into its Global Markets division from July 1, 2025. | Completed; aligns the OCBC securities business with high-net-worth and institutional clients. |
| In January 2026, Saxo launched AutoInvest in Singapore with more than 100 eligible ETFs and $0 commission on plan purchases. | Live; adds recurring fund flows to a multi-asset platform. |
| In April 2026, Interactive Brokers Singapore became a trading and clearing member of the SGX derivatives market. | Live; removes a third-party intermediary on SGX futures and options. |
| In May 2026, Phillip Securities waived commissions and platform fees on U.S. stocks and ETFs through POEMS. | Live; raises pricing pressure on full-service competitors. |
| In October 2026, Singapore Exchange reduced board lots for 11 stocks priced above S$10. | In force; next quarterly review due in January 2027. |
Apps, AI copilots and direct access set the service gap
- Fast onboarding uses the national MyInfo identity service, and Maybank says 90% of its clients finish in under three minutes on its Maybank Trade SG app.
- AI copilots help investors question financial statements, as POEMSGPT has done inside Phillip Securities POEMS since its launch at the Singapore FinTech Festival in November 2025.
- Fractional execution splits costly foreign shares into small amounts, and the Trust App with Saxo accepts orders from US$10, supporting younger accounts.
- Direct market access sends institutional orders straight to the exchange, which Interactive Brokers Singapore can now execute and clear on SGX derivatives without an intermediary.
Need a Custom Version of This Report?
Tailor the scope, geography, or segments to your exact requirements.
- Custom geography or segment scope
- Direct access to our analyst team
Sales forces, apps and global platforms compete
Competition splits into four camps with clearly different cost and revenue economics. UOB Kay Hian holds the largest retail sales force in Singapore, according to NextInsight, although the same report notes that its app lags fintech peers. Phillip Securities combines POEMS with aggressive pricing, while OCBC Securities now sits inside Global Markets. DBS Vickers keeps its broking license for institutional business after DBS decided in 2019 to move retail equities into the bank, as finews reported. CGS International Securities Singapore and Maybank Securities Singapore compete through dealers and research, with Maybank adding prime services for hedge funds and family offices. Moomoo and Tiger Brokers fight for active digital trading accounts, while Saxo and Interactive Brokers sell global reach. OCBC also holds a license for Indonesian securities dealing through PT OCBC Sekuritas, which supports regional clients. Tools such as POEMSGPT increasingly resemble wealth management software, so providers now compete on guidance as much as on execution price.
Companies profiled and their roles in this market
| Company | Type | Role in the market |
|---|---|---|
| UOB Kay Hian | Independent full-service | Largest retail sales force in Singapore, affluent client base |
| Phillip Securities | Independent full-service | POEMS platform, POEMSGPT copilot, zero commission U.S. offer since May 2026 |
| DBS Vickers | Bank-backed | Institutional broking license, after the 2019 decision to move retail equities into DBS Bank |
| CGS International Securities Singapore | Full-service, China Galaxy-owned | Licensed for dealing, product financing and custody, named on the CPF list of retail SGX broking firms |
| OCBC Securities | Bank-backed | iOCBC platform, moved into OCBC Global Markets on July 1, 2025 |
| Maybank Securities Singapore | Bank-backed | Maybank Trade SG app, prime services and coverage of 376 stocks |
| Moomoo Singapore | Digital-native | First in cumulative app downloads in Singapore in early 2026, SIAS education partnership |
| Tiger Brokers Singapore | Digital-native | Capital markets license and listing among 10 CPF retail SGX broking firms |
| Saxo Capital Markets Singapore | Global multi-asset | AutoInvest launched January 2026, Elite service from May 2026, platform for Trust Bank |
| Interactive Brokers Singapore | Global multi-asset | SGX derivatives trading and clearing member since April 2026 |
Reform helps, but the volume cycle still rules
Credence Research's view is that buyers should separate reform effects from the volume cycle. Daily turnover of S$1.8 billion in fiscal 2026 was the highest in 18 years, and that record flatters current broker income. Reforms such as the S$6.5 billion program, smaller board lots and omnibus custody are real, but they mainly widen participation rather than lift the yield per trade. Zero commission on U.S. shares is moving the opposite way. The most durable value should therefore come from financing, custody and fund flows, and from research-led service for wealthy clients. Firms relying on commissions alone carry the most risk through a downturn in activity.
How the Credence Research estimate was built
The report uses 2025 as the base year, 2026 as the first forecast year and 2035 as the end of the forecast. Market values come from the Credence Research model and measure intermediary income from brokerage and digital trading, not the value of securities traded. The model was checked against Singapore Exchange turnover and derivatives statistics, using a range of blended commission yields, and against published broker disclosures. Segment and regional splits are Credence Research estimates, with no official breakdown available. Sources include regulator publications, exchange announcements, national statistics, IMF projections, company releases and named financial press. No interviews or surveys were conducted for this report or its underlying estimates.
Share shifts to funds, apps and direct access to 2035
The Singapore digital trading market should grow steadily through 2035, although annual results will vary with exchange turnover. Funds and fixed income should gain share as regular investing plans and ETF inflows mature, and direct access should expand among active firms. Local reform will continue through quarterly board lot reviews, and the January 2027 review will show how quickly more stocks qualify. Offshore pricing is likely to stay close to zero, so providers will lean on margin lending, currency conversion and custody. Larger houses with research, financing and strong apps should hold the best position by the end of the forecast.
Frequently Asked Questions
How big is the Singapore financial brokerage digital trading market?
Which product type leads Singapore broker income?
Which product type grows fastest?
Which region holds the largest share?
What changed for Singapore retail investors in October 2026?
Why are brokers cutting commissions on U.S. shares?
Who are the main companies in the market?
What is the biggest risk for brokers?
Table of Content
Chapter 1 Market Segmentation
- 1.1 Segmentation Framework
- 1.1.1 Product and Service Classification
- 1.1.2 Application and End-Use Classification
- 1.1.3 Technology and Solution Classification
- 1.1.4 Customer and Distribution Channel Classification
- 1.1.5 Geographic Segmentation
- 1.1.6 Market Segment Definitions and Boundaries
- 1.2 By Product Type
- 1.2.1 Equities Brokerage
- 1.2.2 Derivatives and Options
- 1.2.3 Forex and Leveraged Products
- 1.2.4 Funds and Fixed Income
- 1.3 By Customer Segment
- 1.3.1 Self-Directed Retail Investors
- 1.3.2 High-Net-Worth Investors
- 1.3.3 Institutional Investors
- 1.3.4 Corporate and Treasury Clients
- 1.4 By Institution Type
- 1.4.1 Bank-Backed Brokerages
- 1.4.2 Independent Full-Service Brokers
- 1.4.3 Digital-Native Brokerages
- 1.4.4 Global Multi-Asset Brokers
Chapter 2 Introduction
- 2.1 Report Objectives and Scope
- 2.2 Product Definition and Industry Terminology
- 2.3 Market Inclusions and Exclusions
- 2.4 Research Process
- 2.4.1 Primary Research and Expert Interviews
- 2.4.2 Secondary Research and Source Review
- 2.4.3 Top-Down and Bottom-Up Estimation
- 2.4.4 Data Triangulation and Verification
- 2.5 Market Size Measurement Basis
- 2.5.1 2025: USD 1.07 billion → 2035: USD 2.37 billion
- 2.6 Historical and Forecast Reference Periods
- 2.6.1 Historical Period: 2018-2025
- 2.6.2 Base Year: 2025
- 2.6.3 Forecast Period: 2025-2035
- 2.7 Research Assumptions and Limitations
Chapter 3 Executive Summary
- 3.1 Market Snapshot and Key Findings
- 3.2 Base-Year Market Size, 2025
- 3.3 Forecast Market Size, 2035
- 3.4 Revenue and Volume Growth Outlook
- 3.5 Key Demand and Supply Indicators
- 3.6 Leading Market Segments
- 3.7 Fastest-Growing Market Opportunities
- 3.8 Regional Performance Highlights
- 3.9 Technology and Industry Transformation
- 3.10 Competitive Landscape Summary
- 3.11 Analyst View and Strategic Implications
Chapter 4 Singapore Financial Brokerage Digital Trading Market Trends and Developments
- 4.1 Historical Industry Development, 2018-2025
- 4.2 Recent Market Trends and Developments
- 4.3 Demand and Customer Behavior Trends
- 4.4 Technology and Product Innovation
- 4.5 Artificial Intelligence, Automation and Digitalization
- 4.6 Local Manufacturing and Supply Chain Realignment
- 4.7 Industry Partnerships, Mergers and Acquisitions
- 4.8 Sustainability and Circular Economy Developments
- 4.9 Government and Private Sector Investment Trends
- 4.10 Emerging Business Models and Commercialization
- 4.11 Industry Developments and Announcements
Chapter 5 Singapore Financial Brokerage Digital Trading Market Supply and Demand Analysis
- 5.1 Demand Trend and Consumption Analysis, 2018-2025
- 5.2 Demand Forecast, 2025-2035
- 5.3 Supply Chain Structure and Procurement Trends
- 5.4 Supply-Demand Gap and Bottlenecks
- 5.5 Import Dependence and Sourcing Structure
- 5.6 Regional Supply and Demand Concentration
Chapter 6 Singapore Financial Brokerage Digital Trading Market Pricing Analysis
- 6.1 Pricing Structure and Measurement
- 6.2 Historical Pricing Trends, 2018-2025
- 6.3 Pricing Outlook, 2025-2035
- 6.4 Pricing by Product and Market Segment
- 6.5 Geographic Pricing Differences
- 6.6 Key Input, Energy, Labor and Logistics Costs
- 6.7 Contract Pricing and Purchasing Models
- 6.8 Pricing Sensitivity and Competitive Positioning
- 6.9 Price, Margin and Profitability Implications
Chapter 7 Singapore Financial Brokerage Digital Trading Market Dynamics
- 7.1 Market Growth Drivers
- 7.1.1 Demand-Side Drivers
- 7.1.2 Technology and Innovation Drivers
- 7.1.3 Infrastructure and Investment Drivers
- 7.1.4 Regulatory and Policy Drivers
- 7.2 Market Restraints
- 7.2.1 Cost and Affordability Constraints
- 7.2.2 Technology and Adoption Barriers
- 7.2.3 Supply Chain and Operational Constraints
- 7.3 Market Challenges
- 7.3.1 Competitive Pressure and Margin Erosion
- 7.3.2 Skills, Infrastructure and Implementation Gaps
- 7.4 Emerging Market Opportunities
- 7.5 Market Dynamics Impact and Time-Horizon Assessment
Chapter 8 Singapore Financial Brokerage Digital Trading Value Chain Analysis
- 8.1 Industry Value Chain Overview
- 8.2 Upstream Suppliers and Critical Inputs
- 8.3 Technology and Component Providers
- 8.4 Manufacturing or Service Delivery
- 8.5 Distribution, Channel Partners and Integrators
- 8.6 Downstream Applications and End Users
- 8.7 Value Addition and Profit Pools
- 8.8 Vertical Integration and Outsourcing
- 8.9 Supplier Concentration and Risk
- 8.10 Supply Chain Localization and Resilience
Chapter 9 Singapore Financial Brokerage Digital Trading Market Regulations and Policies
- 9.1 Relevant Laws, Standards and Compliance Frameworks
- 9.2 Product, Service, Safety and Quality Requirements
- 9.3 Government Policies, Incentives and Subsidies
- 9.4 Imports, Exports and Trade Barriers
- 9.5 Public Procurement and Local Content Requirements
- 9.6 Data Protection, AI and Cybersecurity Compliance
- 9.7 Upcoming Policy Changes and Market Implications
Chapter 10 Singapore Financial Brokerage Digital Trading Market Hotspots and Opportunities
- 10.1 Market Opportunity Mapping and Growth Hotspots
- 10.2 High-Growth Applications and Customer Groups
- 10.3 Underserved Markets and White-Space Opportunities
- 10.4 Emerging Technology and Product Opportunities
- 10.5 New Capacity and Investment Hotspots
- 10.6 Market Entry and Expansion Opportunities
- 10.7 Distribution and Partnership Opportunities
- 10.8 Near-Term and Long-Term Commercial Potential
- 10.9 Opportunity Attractiveness and Execution Risks
Chapter 11 Singapore Financial Brokerage Digital Trading Market Outlook, 2025-2035
- 11.1 Market Size and Analysis
- 11.1.1 Revenue (Market Measurement: 2025: USD 1.07 billion → 2035: USD 2.37 billion)
- 11.1.2 Historical Market Size, 2018-2025
- 11.1.3 Base-Year Market Size, 2025
- 11.2 Market Forecast, 2025-2035
- 11.2.1 Revenue Forecast to 2035
- 11.2.2 CAGR and Year-on-Year Growth
- 11.2.3 Incremental Revenue Opportunity
- 11.3 Forecast Assumptions and Scenario Analysis
- 11.3.1 Base-Case Forecast
- 11.3.2 Optimistic and Conservative Scenarios
- 11.3.3 Technology, Pricing and Policy Sensitivities
- 11.4 Market Attractiveness and Growth Outlook
Chapter 12 Singapore Financial Brokerage Digital Trading Market Segmentation and Outlook
- 12.1 Segmentation Summary and Market Shares, 2025
- 12.2 Largest and Fastest-Growing Segments
- 12.3 By Product Type - Market Size and Forecast, 2025-2035
- 12.3.1 Segment Definition and Scope
- 12.3.2 Historical Market Size, 2018-2025
- 12.3.3 Revenue Forecast, 2025-2035
- 12.3.4 Base-Year Market Share, 2025
- 12.3.5 Segment CAGR and Growth Drivers
- 12.3.6 Subsegment Market Size and Forecast
- 12.3.6.1 Equities Brokerage
- 12.3.6.2 Derivatives and Options
- 12.3.6.3 Forex and Leveraged Products
- 12.3.6.4 Funds and Fixed Income
- 12.3.7 Subsegment Pricing and Adoption Trends
- 12.3.8 Leading Suppliers and Competition
- 12.3.9 Regional Demand and Opportunities
- 12.4 By Customer Segment - Market Size and Forecast, 2025-2035
- 12.4.1 Segment Definition and Scope
- 12.4.2 Historical Market Size, 2018-2025
- 12.4.3 Revenue Forecast, 2025-2035
- 12.4.4 Base-Year Market Share, 2025
- 12.4.5 Segment CAGR and Growth Drivers
- 12.4.6 Subsegment Market Size and Forecast
- 12.4.6.1 Self-Directed Retail Investors
- 12.4.6.2 High-Net-Worth Investors
- 12.4.6.3 Institutional Investors
- 12.4.6.4 Corporate and Treasury Clients
- 12.4.7 Subsegment Pricing and Adoption Trends
- 12.4.8 Leading Suppliers and Competition
- 12.4.9 Regional Demand and Opportunities
- 12.5 By Institution Type - Market Size and Forecast, 2025-2035
- 12.5.1 Segment Definition and Scope
- 12.5.2 Historical Market Size, 2018-2025
- 12.5.3 Revenue Forecast, 2025-2035
- 12.5.4 Base-Year Market Share, 2025
- 12.5.5 Segment CAGR and Growth Drivers
- 12.5.6 Subsegment Market Size and Forecast
- 12.5.6.1 Bank-Backed Brokerages
- 12.5.6.2 Independent Full-Service Brokers
- 12.5.6.3 Digital-Native Brokerages
- 12.5.6.4 Global Multi-Asset Brokers
- 12.5.7 Subsegment Pricing and Adoption Trends
- 12.5.8 Leading Suppliers and Competition
- 12.5.9 Regional Demand and Opportunities
- 12.6 Segment Growth Comparison
- 12.7 Segment Attractiveness and Priority Matrix
Chapter 13 Singapore Financial Brokerage Digital Trading End-Use and Application Market Outlook
- 13.1 End-Use Industry and Customer Demand Structure
- 13.2 Leading Applications and Customer Groups
- 13.3 End-Use Market Size, Share and Forecast
- 13.4 Major End-Use Industry Deep Dives
- 13.4.1 Customer Requirements and Use Cases
- 13.4.2 Demand and Replacement Cycles
- 13.4.3 Technical and Regulatory Considerations
- 13.4.4 Purchasing and Procurement Models
- 13.4.5 Leading Vendors and Distribution Channels
- 13.4.6 Forecast and Commercial Opportunities
- 13.5 Emerging Applications and Cross-Segment Demand
- 13.6 End-Use Industry Investment Priorities
Chapter 14 Singapore Financial Brokerage Digital Trading Geographic Market Outlook, 2025-2035
- 14.1 Domestic Market Distribution and Demand Clusters
- 14.2 State- or Province-Wise Market Size and Forecast, 2025-2035
- 14.3 City and Metropolitan Market Outlook
- 14.4 Industrial, Manufacturing and Commercial Clusters
- 14.5 Geographic Concentration of Key End Users
- 14.6 Local Pricing and Purchasing Differences
- 14.7 Domestic Production Facilities and Capacity Map
- 14.8 Local Infrastructure and Project Pipeline
- 14.9 State-Level Policy and Incentive Differences
- 14.10 Subnational Investment Hotspots and Opportunities
- 14.11 Distribution and Logistics Networks
- 14.12 Domestic Competitive Footprint
Chapter 15 Singapore Financial Brokerage Digital Trading Technology, Innovation and Sustainability Outlook
- 15.1 Technology Landscape and Maturity
- 15.2 Product, Process and Service Innovation
- 15.3 AI, Automation and Digital Tools in the Industry
- 15.4 Technology Adoption and Performance Benchmarking
- 15.5 Innovation Pipeline and R&D Investment
- 15.6 Energy Efficiency and Resource Management
- 15.7 Sustainability, Recycling and Circularity
- 15.8 Technology Roadmap, 2025-2035
- 15.9 Risks of Obsolescence and Technology Substitution
Chapter 16 Singapore Financial Brokerage Digital Trading Market Key Strategic Imperatives
- 16.1 Growth and Market Entry Priorities
- 16.2 High-Return Products and Segments
- 16.3 Pricing, Profitability and Cost Optimization
- 16.4 Technology Investment and Product Differentiation
- 16.5 Supply Chain Localization and Resilience
- 16.6 Distribution and Customer Acquisition
- 16.7 Partnership, Acquisition and Capacity Strategy
- 16.8 Regional Expansion Priorities
- 16.9 Short-, Medium- and Long-Term Actions
Chapter 17 Competition Outlook
- 17.1 Industry Competition Characteristics
- 17.2 Market Structure and Concentration
- 17.3 Market Share and Competitive Positioning, 2025
- 17.4 Company-Wise Revenue and Product Benchmarking
- 17.5 Production and Service Capacity Benchmarking
- 17.6 Technology, Pricing and Differentiation
- 17.7 Regional Footprint and Distribution Strength
- 17.8 Mergers, Acquisitions and Strategic Alliances
- 17.9 New Entrants and Competitive Threats
- 17.10 Porter's Five Forces and Industry Attractiveness
- 17.11 Competitive Outlook, 2025-2035
Chapter 18 Company Profiles
- 18.1 Company Coverage and Selection Criteria
- 18.2 UOB Kay Hian
- 18.2.1 Business Description
- 18.2.2 Company Ownership and Geographic Presence
- 18.2.3 Product and Service Portfolio
- 18.2.4 Manufacturing and Operating Footprint
- 18.2.5 Financial Performance and Investment
- 18.2.6 Market Share and Competitive Position
- 18.2.7 Technology and Innovation Capabilities
- 18.2.8 Strategic Alliances or Partnerships
- 18.2.9 Recent Developments
- 18.2.10 Growth Strategy and Outlook
- 18.3 Phillip Securities
- 18.4 DBS Vickers
- 18.5 CGS International Securities Singapore
- 18.6 OCBC Securities
- 18.7 Moomoo Singapore
- 18.8 Tiger Brokers Singapore
- 18.9 Saxo Capital Markets Singapore
- 18.10 Interactive Brokers Singapore
- 18.11 Maybank Securities Singapore
- 18.12 Other Relevant Market Participants
Note: Every listed company is profiled on the structure shown under the first company. The company list is preliminary and may change based on research findings, market developments, data availability and client requirements.
Chapter 19 Disclaimer
- 19.1 Research and Forecast Disclaimer
- 19.2 Data Source and Estimation Limitations
Note: The depth of individual sections depends on data availability for this market. Volume, capacity, trade and other unit-based metrics are included where applicable.