Spatial data review moves from pilots into engineering work
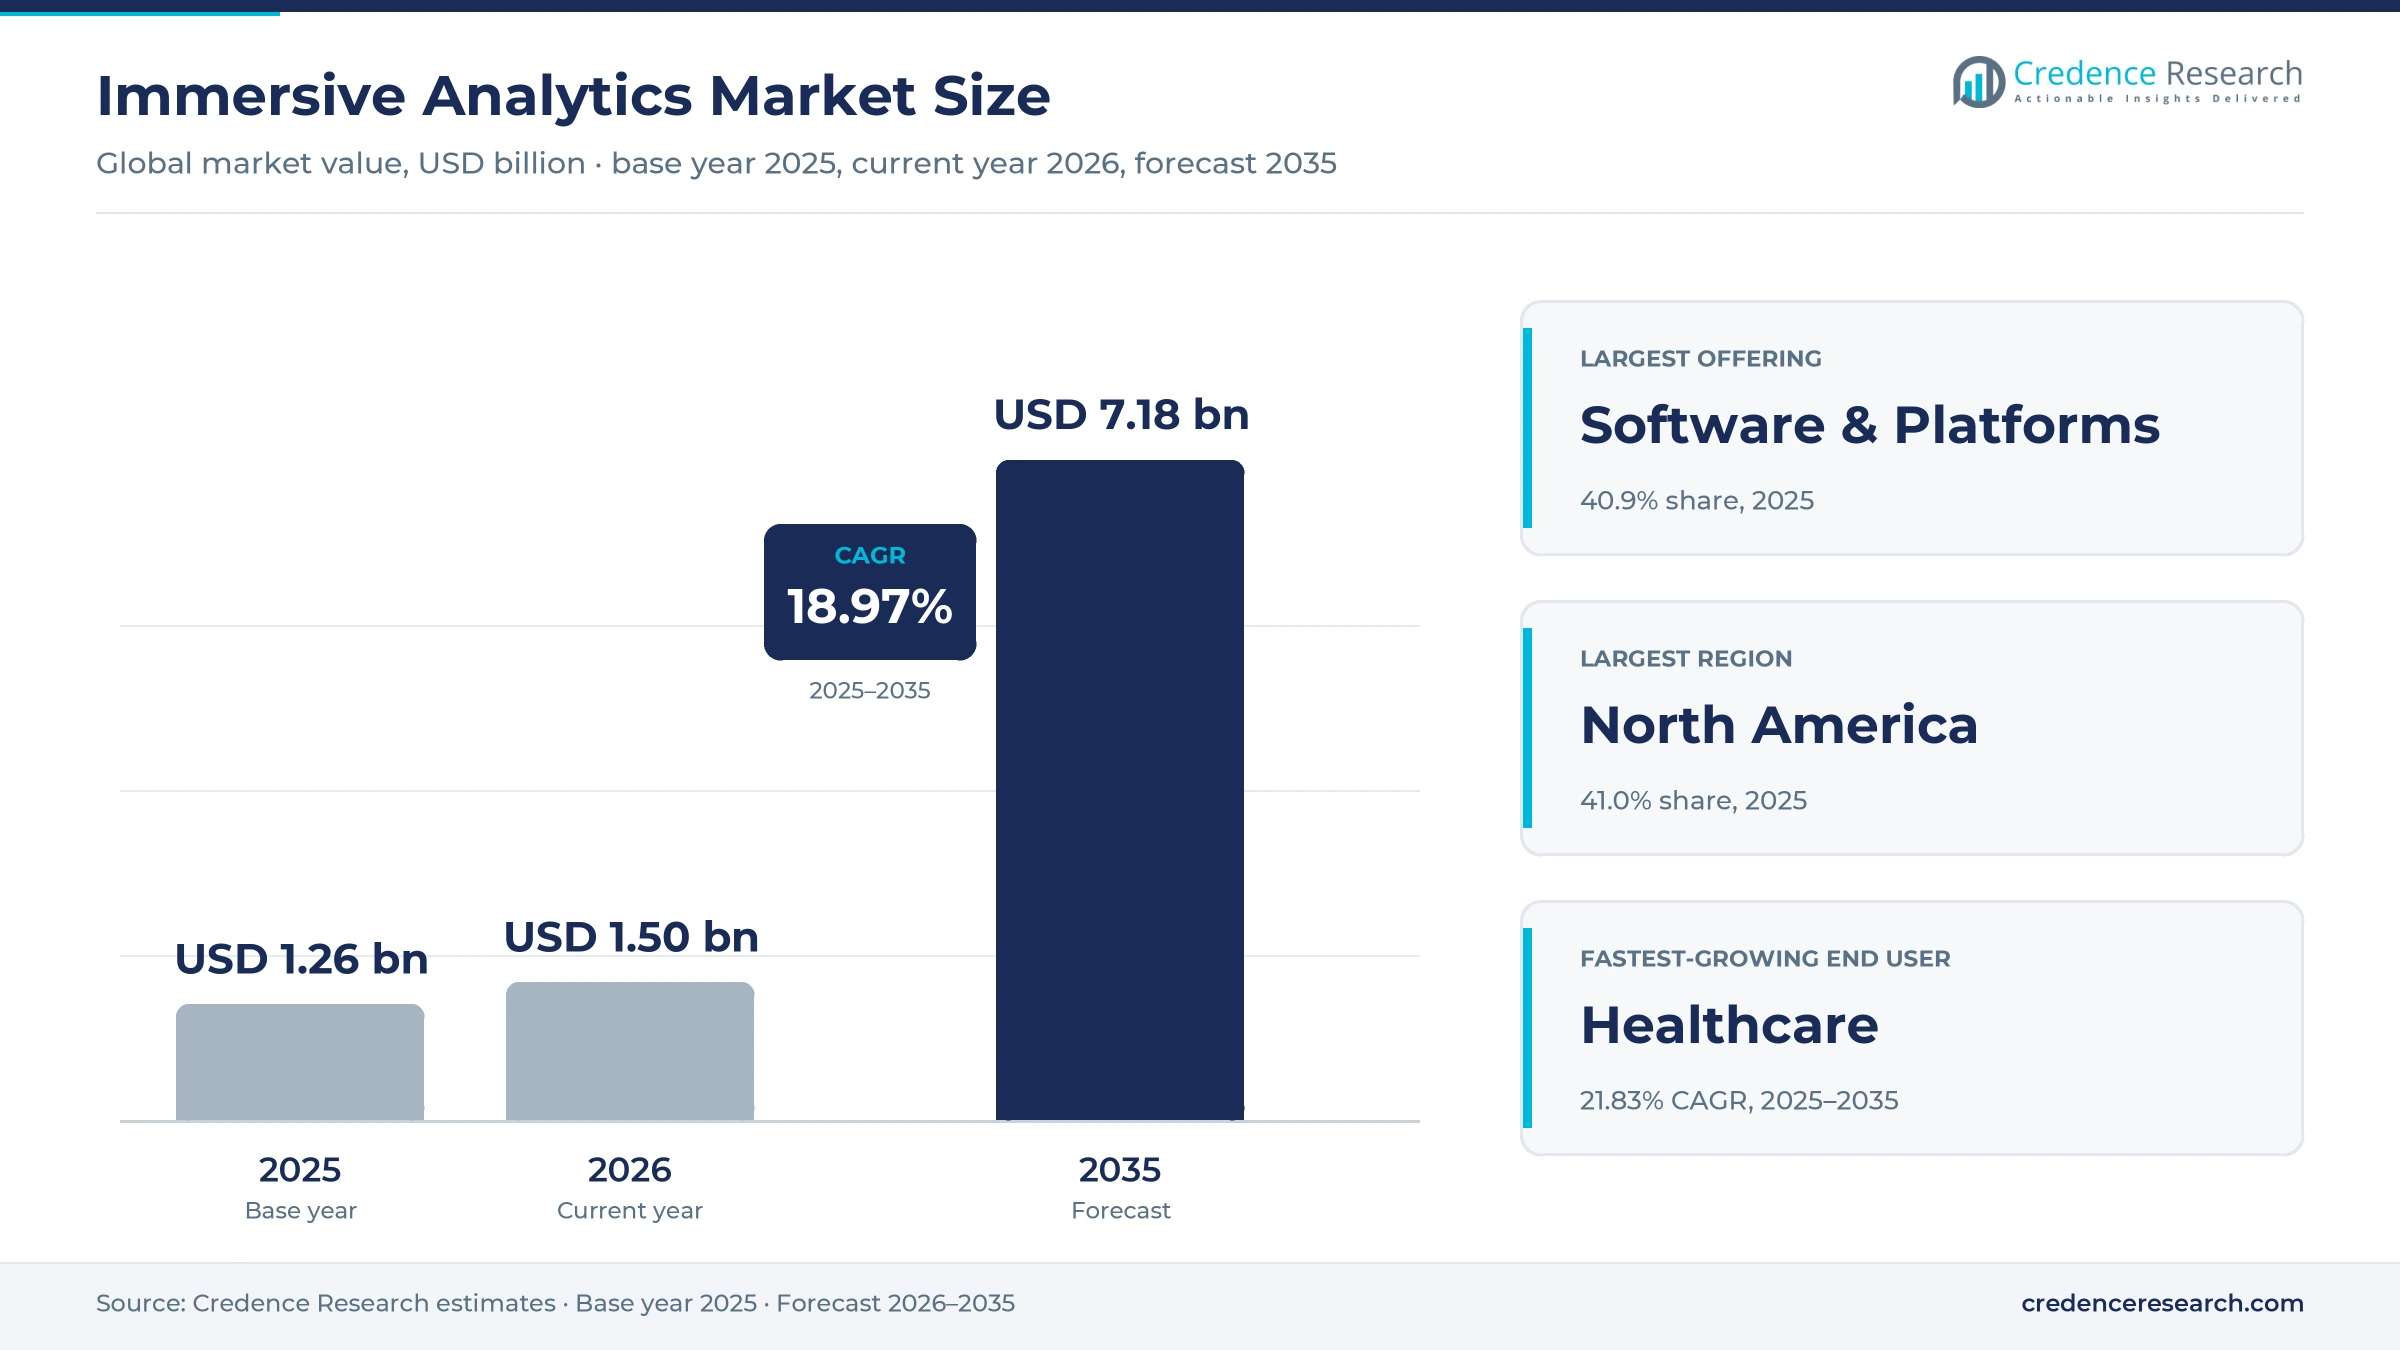
The immersive analytics market was valued at USD 1.26 billion in 2025 and is projected to increase from USD 1.50 billion in 2026 to USD 7.18 billion by 2035, registering a CAGR of 18.97% during 2025–2035. Spending concentrates in engineering design review, digital-twin visualization and clinical imaging, where a three-dimensional view settles a decision faster than a flat screen. North America held the largest regional share, 41.0% in 2025, led by aerospace, automotive and hospital buyers. The Middle East & Africa grows fastest at 23.72% a year from a small base. The main commercial change is device churn, as Microsoft ended HoloLens 2 production in 2024 and Meta stopped selling Quest headsets to businesses in 2026, while Apple, Samsung with Google and Sony now anchor enterprise-grade devices. In response, buyers favor software that runs on several headsets and streams models from remote GPUs.
What buyers pay for when data moves into a headset
Researchers named the field in a 2015 IEEE Big Data Visual Analytics paper, framing it as the use of new display and interaction technologies to support analytical reasoning and decision-making. Companies pay for it when a spatial view shortens a review, such as signing off a vehicle body, checking an assembly line layout or planning surgery around a scan. Spending covers head-mounted and large-format 3D displays, immersive viewers for CAD, PLM and twin data, spatial analytics software and the integration and data-pipeline services that connect them.
The market excludes consumer gaming and entertainment headsets, standard two-dimensional dashboards and XR training content that does not work with live or analytical data. Value is allocated to the region where the buyer deploys the system, and aerospace contractors are counted separately from government agencies so the two end-use groups never overlap.
Immersive Analytics Market Insights
- The immersive analytics market is projected to grow from USD 1.50 billion in 2026 to USD 7.18 billion by 2035, an 18.97% CAGR, as engineering and clinical teams standardize spatial review.
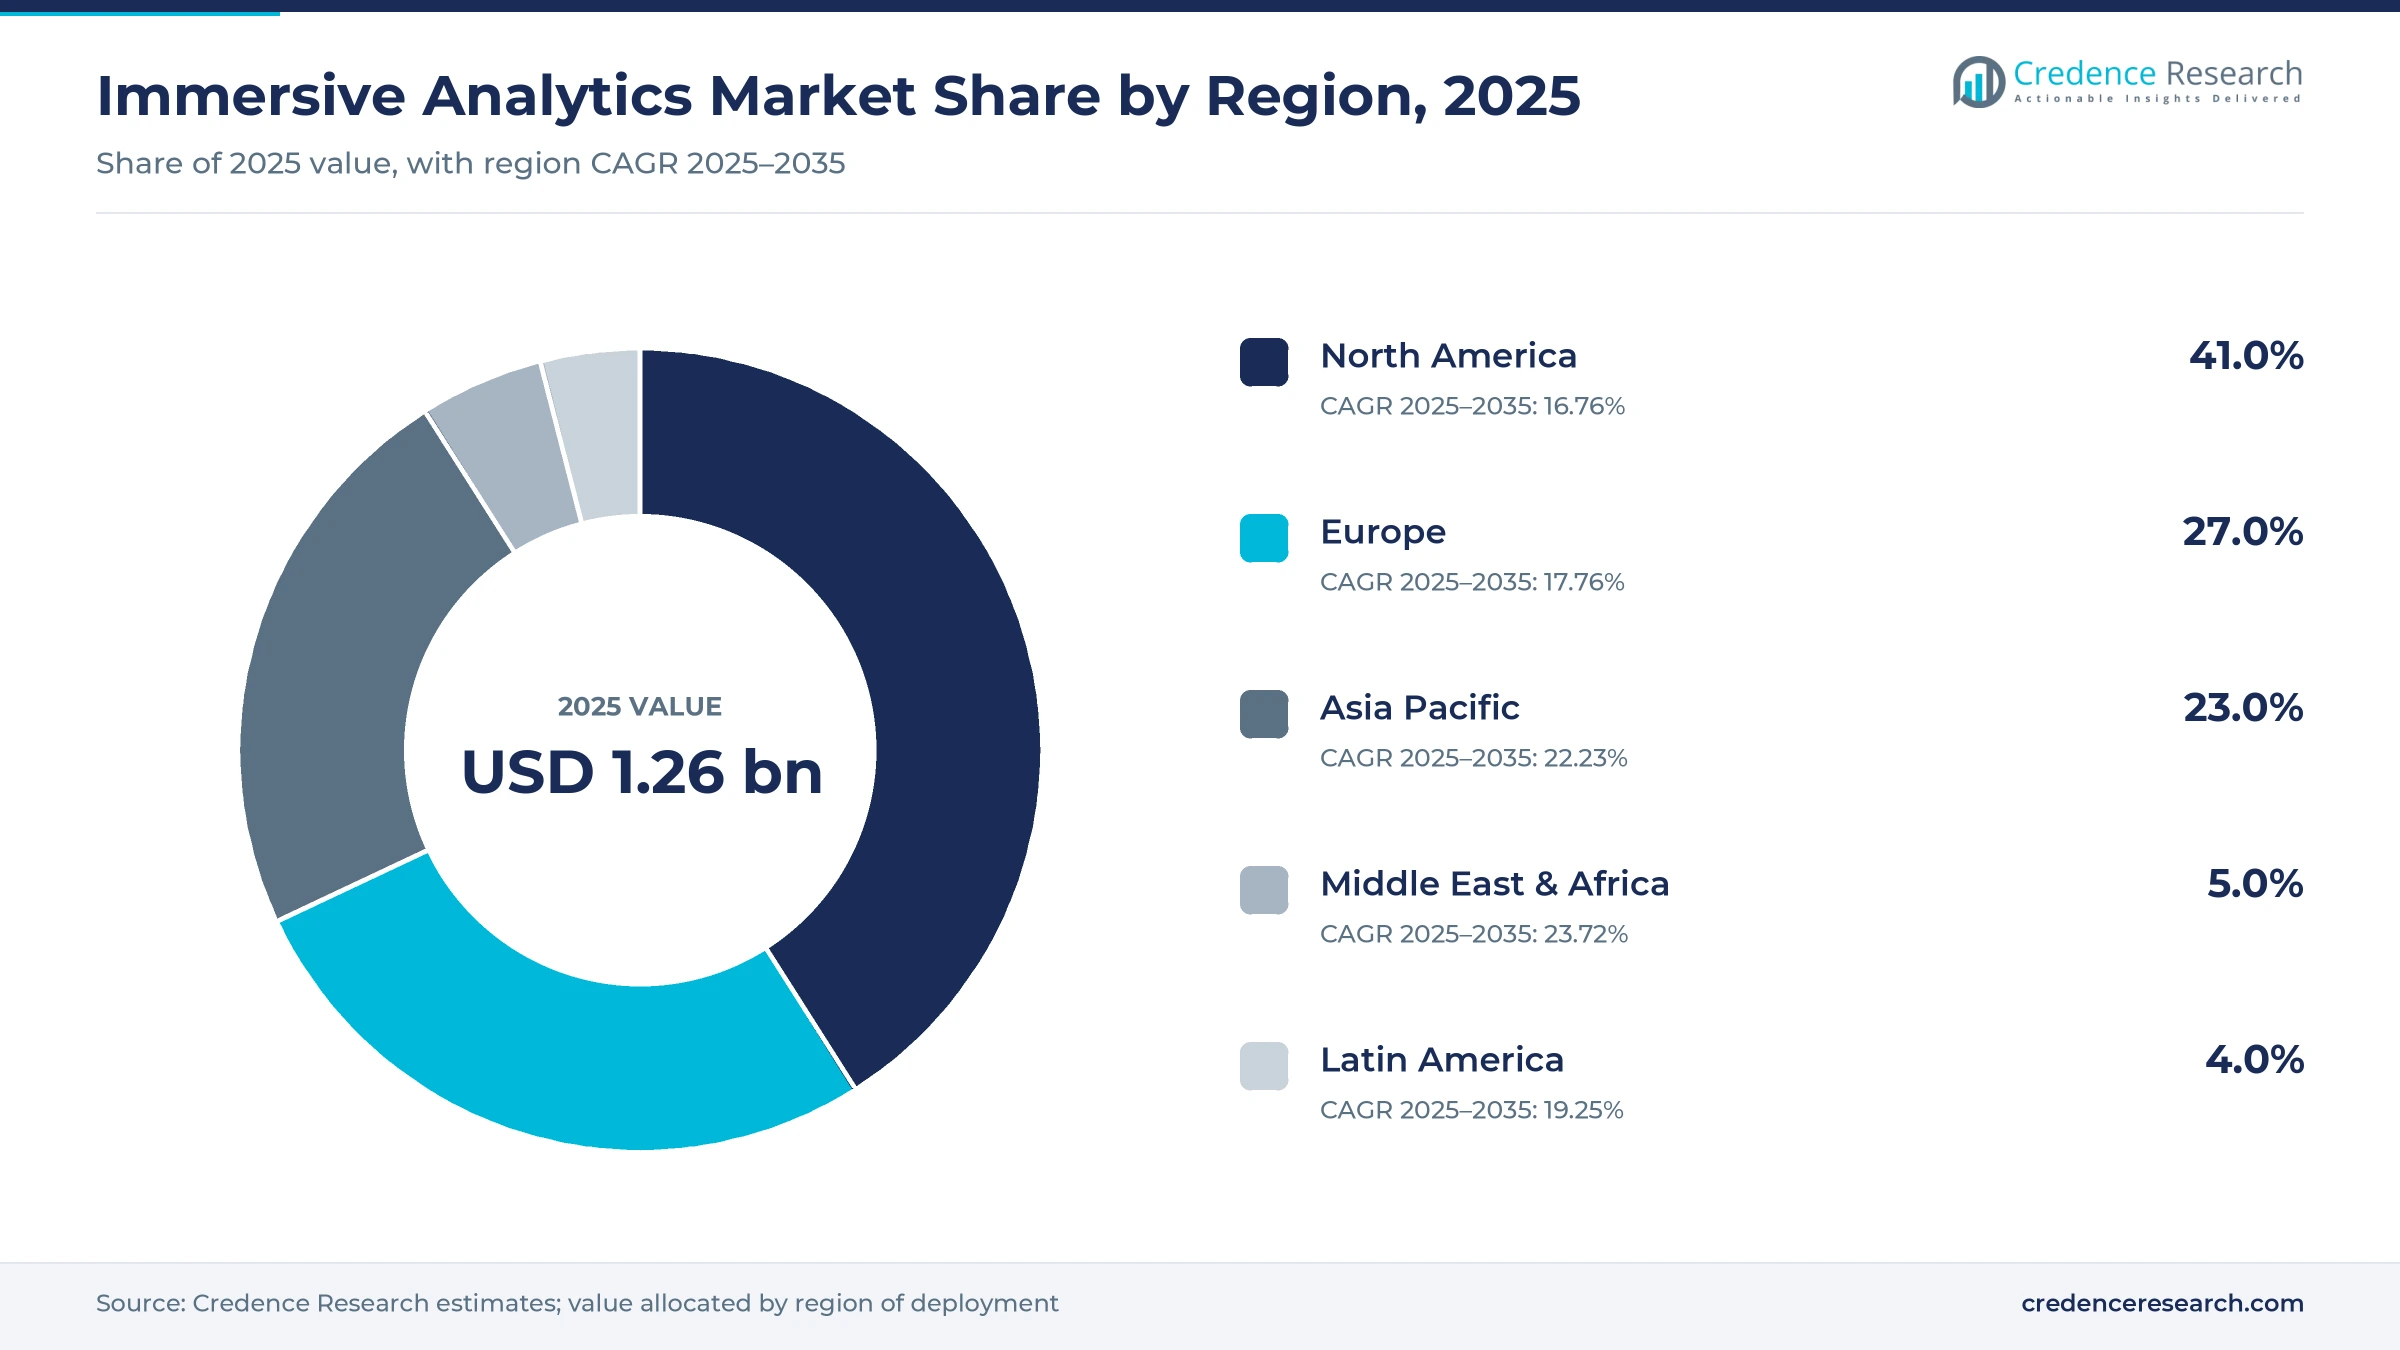
- North America accounted for 41.0% of 2025 value, the largest regional share, because aerospace, automotive and hospital buyers there adopted spatial review first.
- Solutions, meaning software and platforms, held 40.9% of 2025 value, the largest offering, because licenses scale with users and survive device changes.
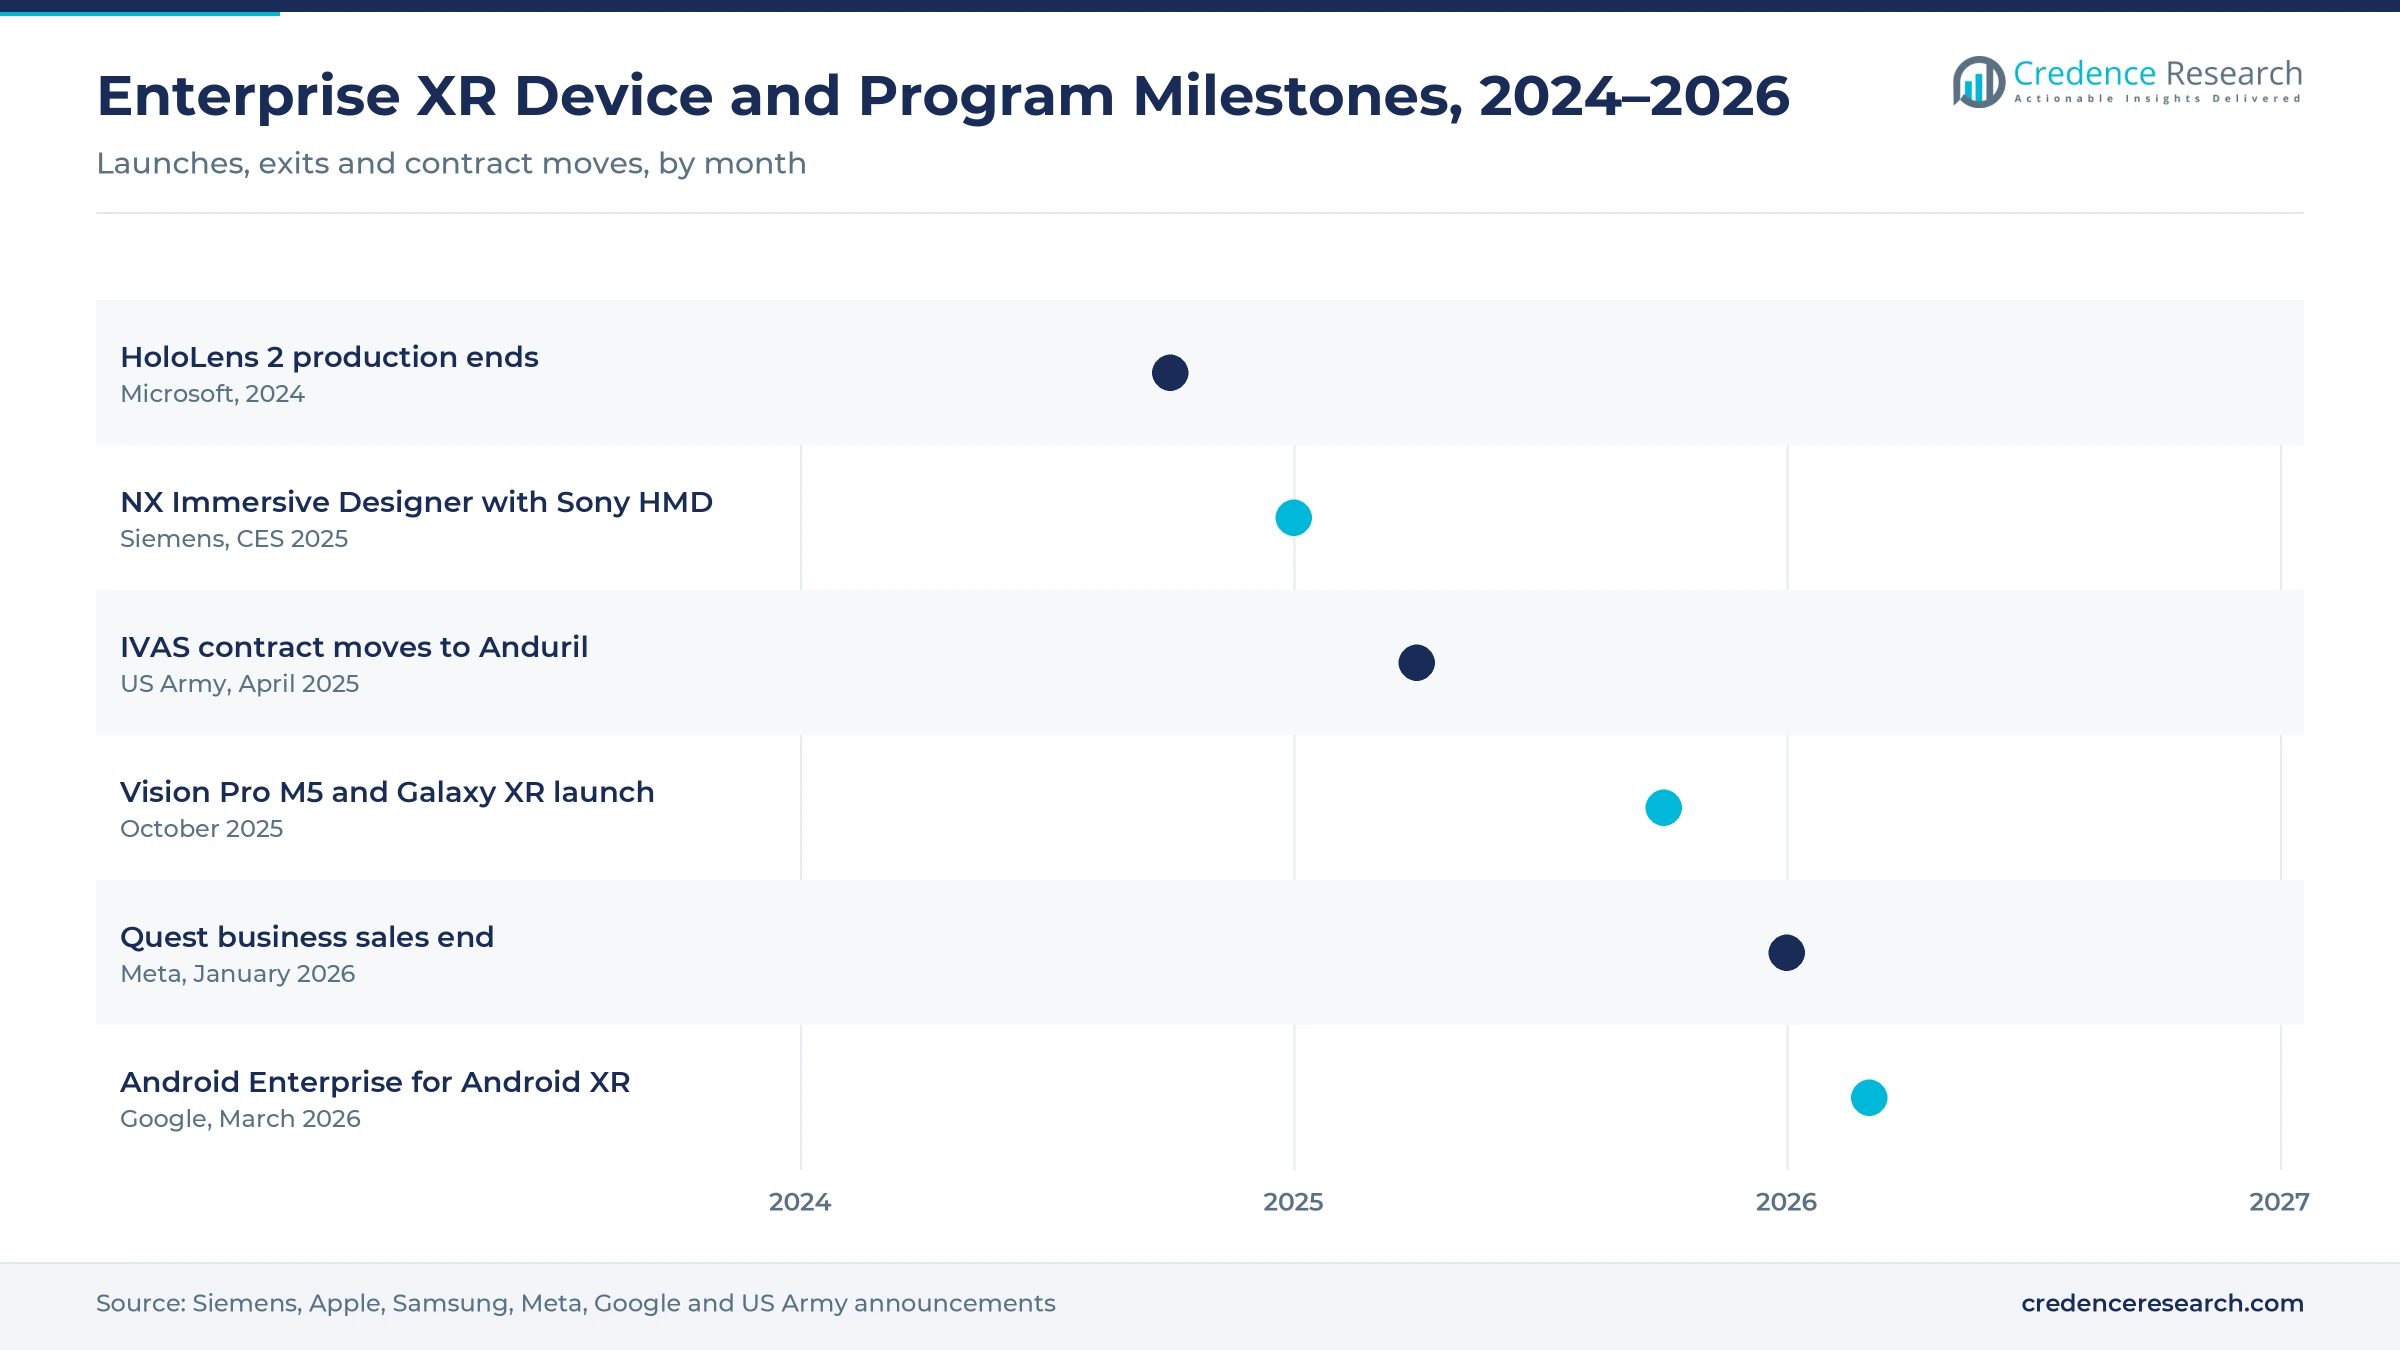
- Google brought Android Enterprise management to Android XR in March 2026, letting IT teams enroll and update headsets like phones and budget them as fleets.
- Healthcare is the fastest-growing end user at 21.83% a year, as hospitals review volumetric scans in 3D before planning procedures through 2035.
Software platforms and design review hold the largest slices
Software and platforms lead the offering mix and grow fastest as devices change hands
Based on offering, the market is categorized into hardware, solutions (software and platforms) and services. Solutions led with 40.9% of 2025 value and are also the fastest-growing offering at 22.50% a year, because licenses scale with users and data volumes and can be reused when a buyer switches headsets. Hardware grows more slowly as unit prices fall and fleet orders slip, while services track data preparation and integration work.
Design review leads the application mix while strategy planning grows fastest
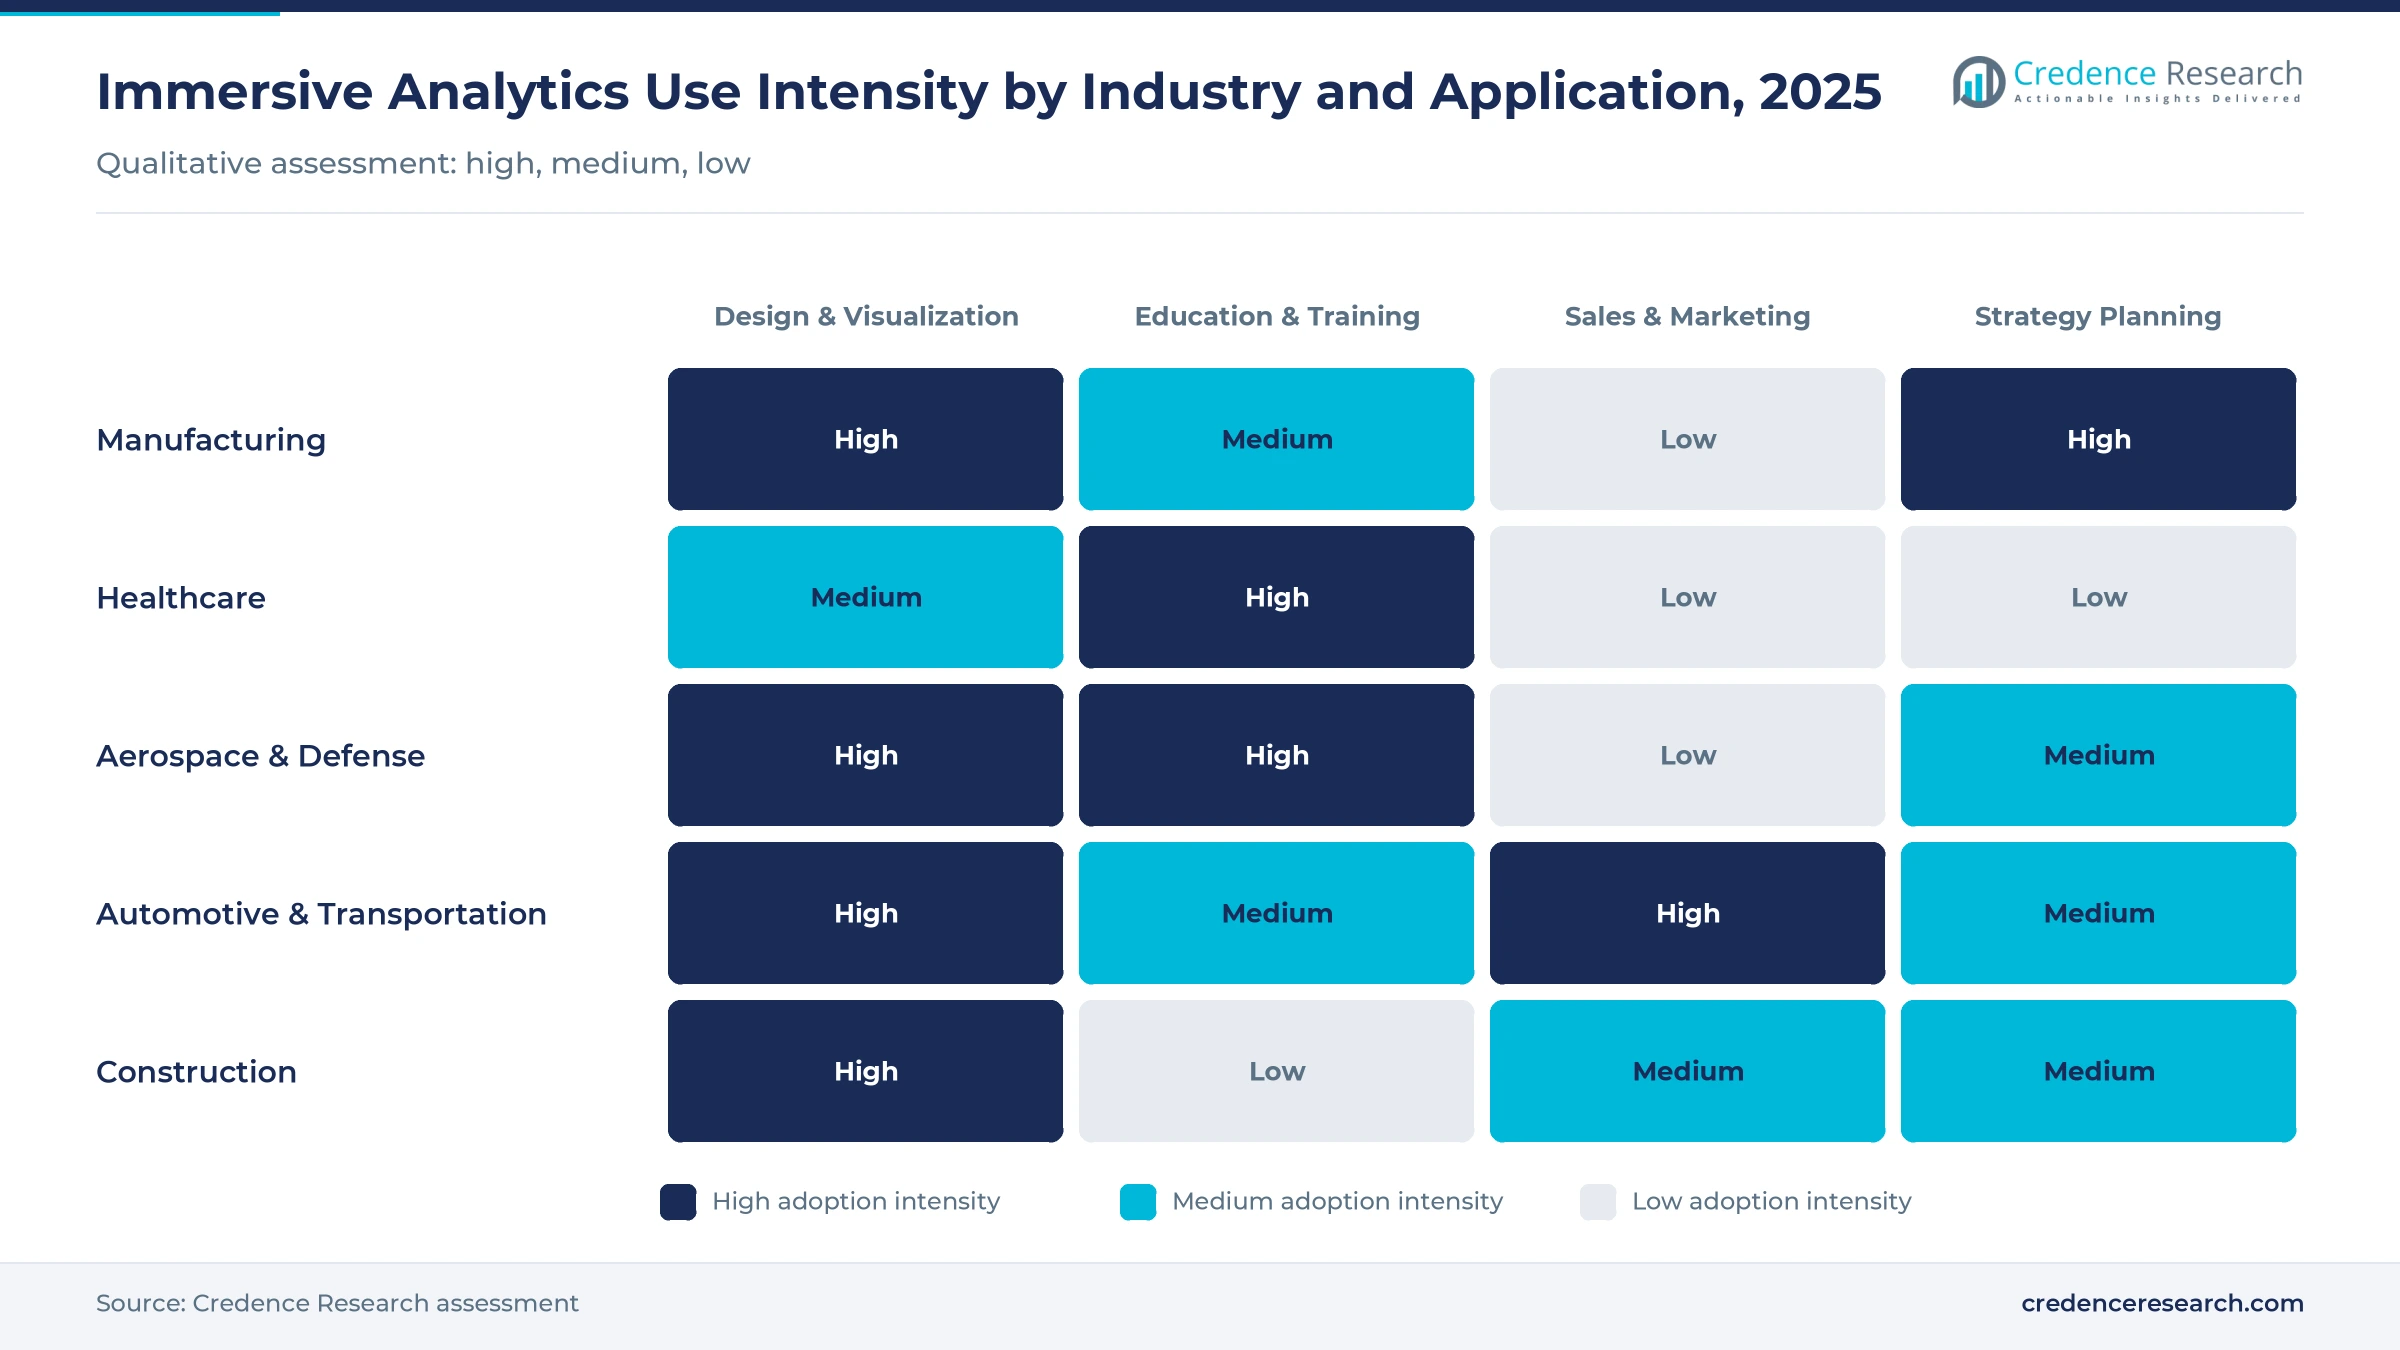
Based on application, the market is categorized into design and visualization, education and training, sales and marketing, strategy planning and others. Design and visualization led with 34.0% of 2025 value, because engineering review is where immersive views pay back fastest. Strategy planning grows fastest at 23.68% a year, as operations teams use twins to test plant, network and mission scenarios before committing capital.
Manufacturers spend most by end use while hospitals add spend fastest
Based on end-use industry, the market is categorized into manufacturing, healthcare, aerospace and defense, automotive and transportation, construction, government and defense, media and entertainment, retail and e-commerce, gaming and others. Manufacturing led with 21.0% of 2025 value, much of it tied to the industrial metaverse push in plant planning. Healthcare grows fastest at 21.83% a year as clinicians plan procedures from volumetric scans.
| Segment Group | Leading Sub-segment | Share, 2025 | Fastest-growing Sub-segment | CAGR, 2025–2035 |
|---|---|---|---|---|
| By Offering | Solutions (Software/Platforms) | 40.9% | Solutions (Software/Platforms) | 22.50% |
| By Application | Design & Visualization | 34.0% | Strategy Planning | 23.68% |
| By End-Use Industry | Manufacturing | 21.0% | Healthcare | 21.83% |
Request a Free Sample
Fill in your details and we'll send you a free sample report.
- Sample data tables & charts
- Research methodology
Twins, GPU streaming and hospital imaging pull XR into use
Engineering software vendors add immersive review to existing twin licenses
Product and plant teams already hold designs as data-rich 3D models, and reviewing them at human scale catches fit, reach and assembly problems before parts are cut. At CES 2025 in January, Siemens introduced NX Immersive Designer with Sony's head-mounted display and added NVIDIA Omniverse rendering to Teamcenter, according to the Siemens and Sony announcement. Immersive review becomes a module upgrade rather than a new project, which is why manufacturers lead spending by end use.
GPU streaming removes the headset rendering ceiling
Rendering a full engineering model on a headset is hard, so streaming it from a workstation or cloud GPU removes the ceiling. NVIDIA published its Omniverse spatial streaming workflow in January 2025, sending OpenUSD digital twins to Apple Vision Pro, and Accenture, Innoactive and Katana began building it into client projects. Streaming lets a buyer keep 1 data pipeline and swap devices, which lowers switching risk across North America and Europe. The main condition for wider use is network quality and GPU cost per session over the next 2 to three years.
Hospitals plan procedures from volumetric scans in 3D
Clinicians plan procedures from volumetric scans that flatten poorly on a monitor. When Apple upgraded Vision Pro with the M5 chip in October 2025, its M5 announcement cited Visage 3D medical imaging at UC San Diego Health. That is why healthcare is the fastest-growing end user, led by academic medical centers in the United States. Adoption depends on clinical validation and on IT teams approving devices on hospital networks, which stretches sales cycles to 12 months or more.
Fleet management moves headsets into standard device budgets
Enterprises buy headsets in fleets only when IT can enroll, update and lock them like phones. Google introduced Android Enterprise management for Android XR in March 2026, with zero-touch enrollment and managed app delivery for Samsung's Galaxy XR. Microsoft Intune, Omnissa Workspace ONE and SOTI are the 3 supported management partners at launch. That shifts headsets into existing device budgets, though the first release covers only corporate-owned, fully managed devices.
Remote rendering, AI queries and headset churn change buying
Rendering shifts off the headset and into remote GPUs
Hybrid rendering splits work between the device and a remote GPU, so the headset becomes a display and input device rather than a workstation. The shift moves value toward software and services, which explains why solutions outgrow hardware. It also favors suppliers that run OpenUSD and CAD pipelines in data centers, and it raises demand for low-latency networks inside plants, hospitals and design studios through 2030.
AI assistants begin answering questions about 3D data
Natural-language queries are now entering spatial analysis through on-device models. Apple's October 2025 announcement cited JigSpace using the on-device Foundation Models framework to let users query complex datasets and explore 3D models by asking questions. The practice remains emerging rather than standard, but it lowers the skill needed to use a twin, widening the user base beyond engineers to planners and executives in manufacturing and energy. As a result, strategy planning, the fastest-growing application, benefits most from this shift.
Buyers stranded by discontinued headsets offer a migration opportunity
Mid-sized manufacturers and contractors that built workflows on HoloLens 2 or Quest for Business need viewers that run on several headsets and in a browser. Meta said Horizon Workrooms would go offline on Feb. 16, 2026, and that it would support its managed services only until Jan. 4, 2030. Suppliers offering migration tools and multi-device licensing can win these accounts. However, the execution risk is support cost across many device types.
Clinical review and giga-project coordination open an opportunity
Hospitals with 3D imaging but no spatial review tools are a clear gap, and suppliers that bundle validated software with managed devices shorten the path to revenue. Giga-projects in the Gulf and Asia Pacific need coordination across thousands of BIM models, where immersive review sold as a project service, not a seat license, fits how contractors buy. Asia Pacific grows at 22.23% a year as builders and shipyards adopt twins.
Headset exits, prices and data prep keep rollouts small
Platform exits force buyers to restart device decisions
Buyers that standardized on HoloLens 2 or Quest for Business have had to choose new devices after Microsoft ended production in 2024 and Meta stopped business sales in 2026. Each exit delays fleet orders by 1 or 2 budget cycles and pushes manufacturers, contractors and defense users back toward pilots instead of rollouts. The commercial effect of these exits falls hardest on hardware revenue. Device-agnostic software and streaming pipelines are the main mitigation, because they let buyers change headsets without rebuilding content.
Headsets priced from USD 1,799 to USD 4,750 cap seat counts
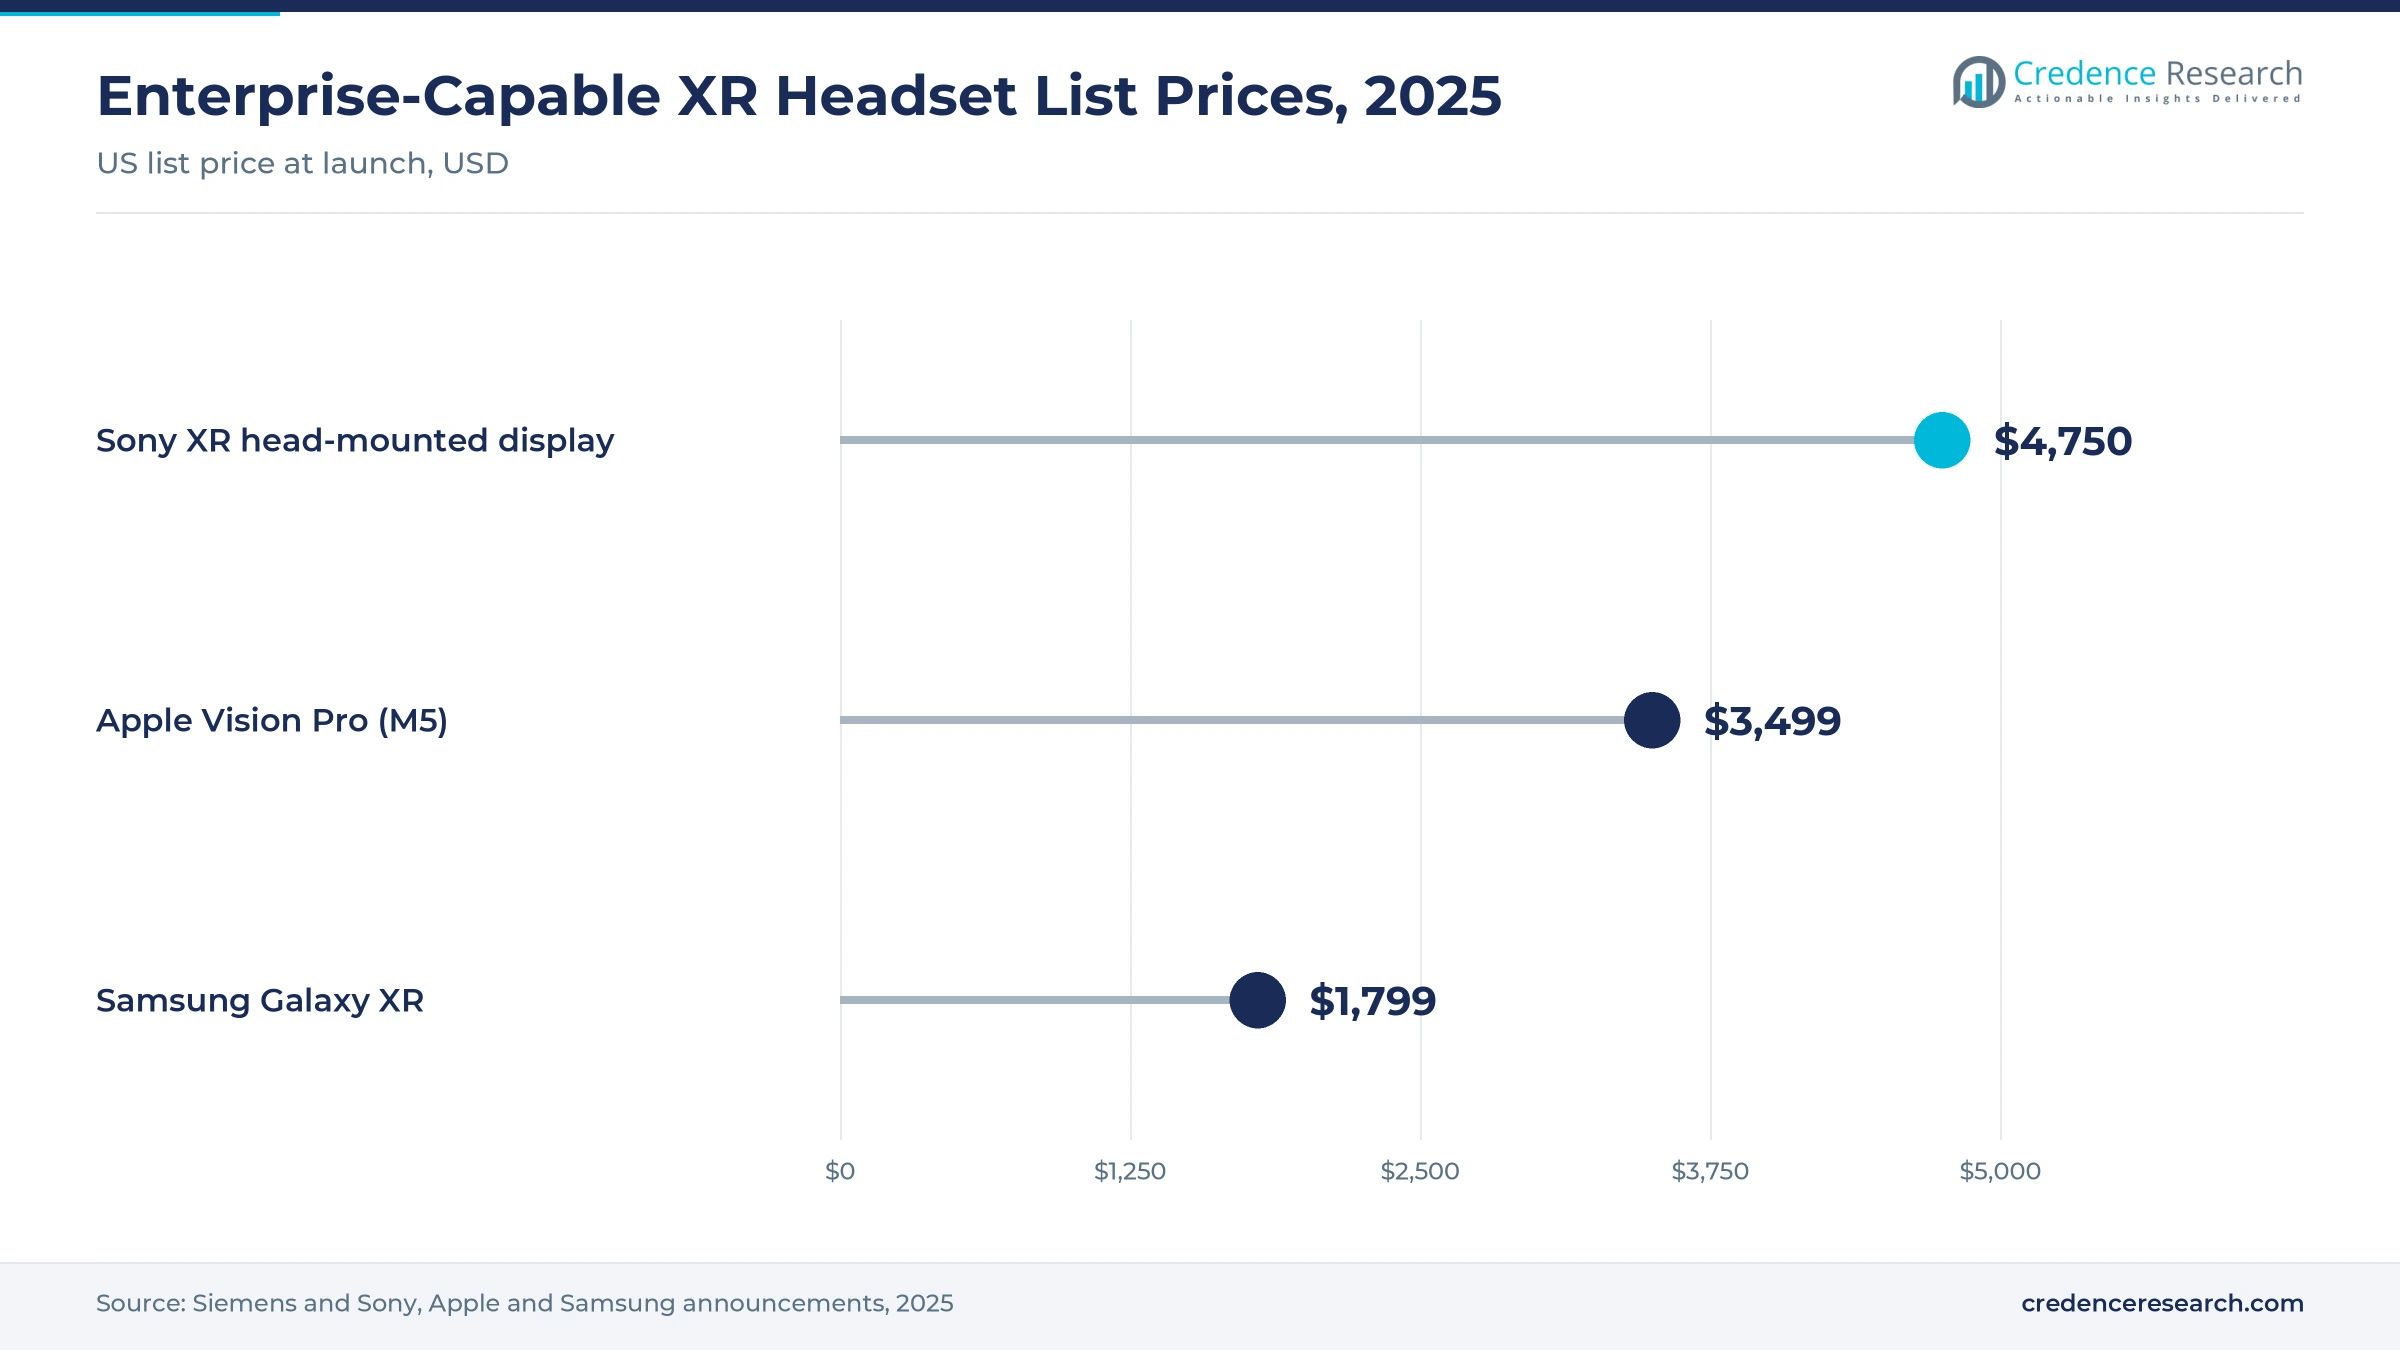
The Sony head-mounted display used with Siemens NX lists at USD 4,750, Apple Vision Pro at USD 3,499 in the United States and Samsung's Galaxy XR at USD 1,799. A design team can justify a few seats, but a plant-wide rollout across hundreds of workers cannot. The constraint slows hardware volume in price-sensitive regions such as Latin America. Lower-priced Android XR devices, shared-seat models and browser viewers for occasional users reduce the cost per participant.
Converting CAD, BIM and imaging data is the hidden cost
Immersive views are only as useful as the data feeding them. Converting CAD, BIM, imaging and sensor data into streamable 3D formats takes specialist skills that most firms lack in-house, and large assemblies still need cleanup before they run smoothly in a headset. The result is higher service spend and longer projects for engineering and construction buyers. Vendors respond with automated OpenUSD conversion and with immersive modes built directly into CAD and PLM tools.
Finance teams struggle to isolate the return on spatial review
Benefits such as fewer physical prototypes, faster design sign-off, fewer change orders and shorter surgical planning are real but hard to isolate in budgets. Finance teams therefore cap many deployments at pilot scale, which limits recurring software revenue across all five regions. Suppliers that measure review time, change orders and prototype counts before and after deployment give buyers the evidence needed to expand from a single team to a site-wide license.
North American buyers lead while Gulf projects grow fastest
| Region | Share, 2025 | CAGR, 2025–2035 |
|---|---|---|
| North America | 41.0% | 16.76% |
| Europe | 27.0% | 17.76% |
| Asia Pacific | 23.0% | 22.23% |
| Middle East & Africa | 5.0% | 23.72% |
| Latin America | 4.0% | 19.25% |
North America sets the pace with early aerospace, automotive and hospital buyers
North America held 41.0% of 2025 value and grows at 16.76% a year. Aerospace, automotive and hospital buyers there adopted spatial review first, and UC San Diego Health is among the clinical reference sites. Defense demand is shifting, as the U.S. Army approved moving its IVAS contract from Microsoft to Anduril in April 2025, and the follow-on Soldier Borne Mission Command effort is a multi-supplier prototyping program. Regional growth slows as the installed base of early adopters matures.
Europe relies on engineering software vendors and automakers to anchor demand
Europe held 27.0% of 2025 value and grows at 17.76% a year. German and French engineering software vendors, including Siemens and Dassault Systèmes, and the region's automakers anchor demand for immersive design review. Data-protection rules push buyers toward on-premises or sovereign-cloud streaming, which favors suppliers that can run rendering inside a customer's own data center. Siemens bundles Sony's head-mounted display with its NX immersive tools, giving engineering teams one supplier for software and device.
Asia Pacific shipbuilders and electronics makers invest in twins
Asia Pacific held 23.0% of 2025 value and grows at 22.23% a year. Korean, Japanese and Chinese manufacturers and shipbuilders invest in digital twins, and Samsung signed an agreement with Samsung Heavy Industries in October 2025 to build shipbuilding training on Galaxy XR. Large construction programs across the region add further BIM review demand. Local device supply from Samsung and Sony gives buyers in the region a shorter path to enterprise-grade hardware, and Sony also supplies the display used with Siemens NX.
Middle East and Africa and Latin America draw on giga-projects, mining and energy
The Middle East & Africa held 5.0% of 2025 value and is the fastest-growing region at 23.72% a year. Gulf giga-projects use immersive BIM review, while African demand centers on mining and energy in South Africa. Latin America held 4.0% of 2025 value and grows at 19.25% a year, led by mining, energy and automotive plants in Brazil and Mexico.
Android XR fleet tools and a Quest business exit, 2025–2026
| Development | Status and market relevance |
|---|---|
| In March 2026, Google made Android Enterprise management available for Android XR, starting with Samsung Galaxy XR. | Launched. Lets IT teams enroll and manage headsets like phones, supporting fleet purchases. |
| In January 2026, Meta announced it would stop selling Quest headsets to businesses and take Horizon Workrooms offline on Feb. 16, 2026. | Announced. Forces business buyers to pick new devices and favors device-agnostic software. |
| In October 2025, Samsung launched Galaxy XR, the first Android XR headset, and signed an agreement with Samsung Heavy Industries on shipbuilding training. | Launched. Adds a lower-priced enterprise-capable device. |
| In May 2025, Anduril and Meta announced a partnership to build EagleEye XR devices for the U.S. Army's Soldier Borne Mission Command program. | Announced. Opens defense demand to new hardware and software suppliers. |
| In April 2025, the U.S. Army approved the novation of Microsoft's IVAS contract to Anduril. | Completed. Moves the largest defense XR program to a new prime contractor. |
Split rendering, OpenUSD and AI queries set the roadmap
- Split rendering lets remote GPUs render heavy models and stream frames to the headset, so device choice no longer limits model size.
- OpenUSD pipelines use a common scene format that lets CAD, BIM and sensor data flow into twins and viewers without manual rebuilding.
- Natural-language queries through on-device language models let users ask questions of a 3D dataset instead of building dashboards.
- Fleet management with zero-touch enrollment and managed app delivery lets IT teams run headsets alongside phones and laptops.
Need a Custom Version of This Report?
Tailor the scope, geography, or segments to your exact requirements.
- Custom geography or segment scope
- Direct access to our analyst team
Headset makers, CAD vendors and integrators split the value
Three groups compete for this spending and earn money in different ways. Device owners Apple, Samsung Electronics with Google's Android XR, and Sony supply most enterprise-grade headsets and compete on display quality, comfort and fleet management, while Meta Platforms has stepped back from business sales. Engineering software vendors Siemens, Dassault Systèmes, Autodesk and PTC hold the customer's CAD, PLM and twin models and add immersive review modes to existing licenses. NVIDIA supplies rendering and streaming through Omniverse, and Unity Software provides an engine for custom viewers. Integrators such as Accenture connect data sources, streaming and devices, and their choices often set the software standard. Because business models differ across the three groups, no combined share ranking is given. Suppliers that own the data model hold the stronger position.
Device makers, engineering software vendors and integrators profiled
| Company | Type | Role in the market |
|---|---|---|
| Apple | Device maker | Vision Pro, upgraded with the M5 chip in October 2025 |
| Samsung Electronics | Device maker | Galaxy XR, the first Android XR headset, launched October 2025 |
| Platform owner | Android XR and Android Enterprise headset management | |
| Sony | Device maker | XR head-mounted display sold with Siemens NX |
| Meta Platforms | Device maker | Quest headsets; business sales ended in 2026; EagleEye work with Anduril |
| Siemens | Engineering software | NX Immersive Designer and Teamcenter with Omniverse rendering |
| NVIDIA | Rendering and streaming | Omniverse and spatial streaming of OpenUSD twins |
| Dassault Systèmes | Engineering software | CAD, PLM and twin software with immersive review |
| Autodesk | Engineering software | Design and BIM software with immersive review |
| PTC | Engineering software | CAD and PLM software with immersive review |
| Unity Software | Engine provider | Real-time 3D engine for custom viewers |
| Accenture | Integrator | Builds streamed twin and XR deployments for large clients |
Owning the 3D data model matters more than the headset
Credence Research's view is that the device is becoming interchangeable and the 3D data model is becoming the asset. The largest new revenue lies in software and streaming that run on several headsets, in strategy planning built on twins and in clinical review. Engineering software vendors that already hold the customer's models are best placed, followed by integrators that run the pipelines. The main risk is further device churn, so buyers and investors should watch headset prices, Android XR fleet adoption and defense prototyping awards.
Headset pools and visualization shares underpin the model
The report uses 2025 as the base year and forecasts to 2035, with CAGR calculated over 2025–2035. Market values come from Credence Research's market model, which sizes the enterprise headset pool from device makers' disclosures and announced prices, applies the share used for data, design and twin visualization, and adds the related software and services; segment and regional splits are Credence Research estimates. Supporting evidence comes from company announcements, U.S. government reports and academic literature.
Device-agnostic software captures most new value by 2035
Through 2035, spending will shift from headsets toward software and services that run on any device and stream from remote GPUs. Design review remains the core use, while strategy planning on twins and clinical review add the most new demand. Asia Pacific and the Middle East and Africa will gain share through industrial and construction programs, and North America remains the largest buyer. The pace depends on device stability, falling headset prices and how quickly IT teams treat headsets as standard managed devices.
Frequently Asked Questions
What was the size of the immersive analytics market in 2025?
What is the forecast value and CAGR of the immersive analytics market?
What does the immersive analytics market exclude?
Which region holds the largest share of the immersive analytics market?
Which offering and application lead the market?
How did headset exits affect immersive analytics buyers?
Who are the major companies in the immersive analytics market?
What challenges could slow the immersive analytics market?
Table of Content
Chapter 1 Market Segmentation
- 1.1 Segmentation Framework
- 1.1.1 Product and Service Classification
- 1.1.2 Application and End-Use Classification
- 1.1.3 Technology and Solution Classification
- 1.1.4 Customer and Distribution Channel Classification
- 1.1.5 Geographic Segmentation
- 1.1.6 Market Segment Definitions and Boundaries
- 1.2 By Offering
- 1.2.1 Hardware
- 1.2.2 Solutions (Software/Platforms)
- 1.2.3 Services
- 1.3 By Application
- 1.3.1 Design & Visualization
- 1.3.2 Education & Training
- 1.3.3 Sales & Marketing
- 1.3.4 Strategy Planning
- 1.3.5 Others
- 1.4 By End-Use Industry
- 1.4.1 Manufacturing
- 1.4.2 Healthcare
- 1.4.3 Aerospace & Defense
- 1.4.4 Automotive & Transportation
- 1.4.5 Construction
- 1.4.6 Government & Defense
- 1.4.7 Media & Entertainment
- 1.4.8 Retail & E-commerce
- 1.4.9 Gaming
- 1.4.10 Others
Chapter 2 Introduction
- 2.1 Report Objectives and Scope
- 2.2 Product Definition and Industry Terminology
- 2.3 Market Inclusions and Exclusions
- 2.4 Research Process
- 2.4.1 Primary Research and Expert Interviews
- 2.4.2 Secondary Research and Source Review
- 2.4.3 Top-Down and Bottom-Up Estimation
- 2.4.4 Data Triangulation and Verification
- 2.5 Market Size Measurement Basis
- 2.5.1 2025: USD 1.26 billion → 2035: USD 7.18 billion
- 2.6 Historical and Forecast Reference Periods
- 2.6.1 Historical Period: 2018-2025
- 2.6.2 Base Year: 2025
- 2.6.3 Forecast Period: 2025-2035
- 2.7 Research Assumptions and Limitations
Chapter 3 Executive Summary
- 3.1 Market Snapshot and Key Findings
- 3.2 Base-Year Market Size, 2025
- 3.3 Forecast Market Size, 2035
- 3.4 Revenue and Volume Growth Outlook
- 3.5 Key Demand and Supply Indicators
- 3.6 Leading Market Segments
- 3.7 Fastest-Growing Market Opportunities
- 3.8 Regional Performance Highlights
- 3.9 Technology and Industry Transformation
- 3.10 Competitive Landscape Summary
- 3.11 Analyst View and Strategic Implications
Chapter 4 Global Immersive Analytics Market Trends and Developments
- 4.1 Historical Industry Development, 2018-2025
- 4.2 Recent Market Trends and Developments
- 4.3 Demand and Customer Behavior Trends
- 4.4 Technology and Product Innovation
- 4.5 Artificial Intelligence, Automation and Digitalization
- 4.6 Local Manufacturing and Supply Chain Realignment
- 4.7 Industry Partnerships, Mergers and Acquisitions
- 4.8 Sustainability and Circular Economy Developments
- 4.9 Government and Private Sector Investment Trends
- 4.10 Emerging Business Models and Commercialization
- 4.11 Industry Developments and Announcements
Chapter 5 Global Immersive Analytics Market Supply and Demand Analysis
- 5.1 Demand Trend and Consumption Analysis, 2018-2025
- 5.2 Demand Forecast, 2025-2035
- 5.3 Supply Chain Structure and Procurement Trends
- 5.4 Supply-Demand Gap and Bottlenecks
- 5.5 Import Dependence and Sourcing Structure
- 5.6 Regional Supply and Demand Concentration
Chapter 6 Global Immersive Analytics Market Pricing Analysis
- 6.1 Pricing Structure and Measurement
- 6.2 Historical Pricing Trends, 2018-2025
- 6.3 Pricing Outlook, 2025-2035
- 6.4 Pricing by Product and Market Segment
- 6.5 Geographic Pricing Differences
- 6.6 Key Input, Energy, Labor and Logistics Costs
- 6.7 Contract Pricing and Purchasing Models
- 6.8 Pricing Sensitivity and Competitive Positioning
- 6.9 Price, Margin and Profitability Implications
Chapter 7 Global Immersive Analytics Market Dynamics
- 7.1 Market Growth Drivers
- 7.1.1 Demand-Side Drivers
- 7.1.2 Technology and Innovation Drivers
- 7.1.3 Infrastructure and Investment Drivers
- 7.1.4 Regulatory and Policy Drivers
- 7.2 Market Restraints
- 7.2.1 Cost and Affordability Constraints
- 7.2.2 Technology and Adoption Barriers
- 7.2.3 Supply Chain and Operational Constraints
- 7.3 Market Challenges
- 7.3.1 Competitive Pressure and Margin Erosion
- 7.3.2 Skills, Infrastructure and Implementation Gaps
- 7.4 Emerging Market Opportunities
- 7.5 Market Dynamics Impact and Time-Horizon Assessment
Chapter 8 Global Immersive Analytics Value Chain Analysis
- 8.1 Industry Value Chain Overview
- 8.2 Upstream Suppliers and Critical Inputs
- 8.3 Technology and Component Providers
- 8.4 Manufacturing or Service Delivery
- 8.5 Distribution, Channel Partners and Integrators
- 8.6 Downstream Applications and End Users
- 8.7 Value Addition and Profit Pools
- 8.8 Vertical Integration and Outsourcing
- 8.9 Supplier Concentration and Risk
- 8.10 Supply Chain Localization and Resilience
Chapter 9 Global Immersive Analytics Market Regulations and Policies
- 9.1 Relevant Laws, Standards and Compliance Frameworks
- 9.2 Product, Service, Safety and Quality Requirements
- 9.3 Government Policies, Incentives and Subsidies
- 9.4 Imports, Exports and Trade Barriers
- 9.5 Public Procurement and Local Content Requirements
- 9.6 Data Protection, AI and Cybersecurity Compliance
- 9.7 Upcoming Policy Changes and Market Implications
Chapter 10 Global Immersive Analytics Market Hotspots and Opportunities
- 10.1 Market Opportunity Mapping and Growth Hotspots
- 10.2 High-Growth Applications and Customer Groups
- 10.3 Underserved Markets and White-Space Opportunities
- 10.4 Emerging Technology and Product Opportunities
- 10.5 New Capacity and Investment Hotspots
- 10.6 Market Entry and Expansion Opportunities
- 10.7 Distribution and Partnership Opportunities
- 10.8 Near-Term and Long-Term Commercial Potential
- 10.9 Opportunity Attractiveness and Execution Risks
Chapter 11 Global Immersive Analytics Market Outlook, 2025-2035
- 11.1 Market Size and Analysis
- 11.1.1 Revenue (Market Measurement: 2025: USD 1.26 billion → 2035: USD 7.18 billion)
- 11.1.2 Historical Market Size, 2018-2025
- 11.1.3 Base-Year Market Size, 2025
- 11.2 Market Forecast, 2025-2035
- 11.2.1 Revenue Forecast to 2035
- 11.2.2 CAGR and Year-on-Year Growth
- 11.2.3 Incremental Revenue Opportunity
- 11.3 Forecast Assumptions and Scenario Analysis
- 11.3.1 Base-Case Forecast
- 11.3.2 Optimistic and Conservative Scenarios
- 11.3.3 Technology, Pricing and Policy Sensitivities
- 11.4 Market Attractiveness and Growth Outlook
Chapter 12 Global Immersive Analytics Market Segmentation and Outlook
- 12.1 Segmentation Summary and Market Shares, 2025
- 12.2 Largest and Fastest-Growing Segments
- 12.3 By Offering - Market Size and Forecast, 2025-2035
- 12.3.1 Segment Definition and Scope
- 12.3.2 Historical Market Size, 2018-2025
- 12.3.3 Revenue Forecast, 2025-2035
- 12.3.4 Base-Year Market Share, 2025
- 12.3.5 Segment CAGR and Growth Drivers
- 12.3.6 Subsegment Market Size and Forecast
- 12.3.6.1 Hardware
- 12.3.6.2 Solutions (Software/Platforms)
- 12.3.6.3 Services
- 12.3.7 Subsegment Pricing and Adoption Trends
- 12.3.8 Leading Suppliers and Competition
- 12.3.9 Regional Demand and Opportunities
- 12.4 By Application - Market Size and Forecast, 2025-2035
- 12.4.1 Segment Definition and Scope
- 12.4.2 Historical Market Size, 2018-2025
- 12.4.3 Revenue Forecast, 2025-2035
- 12.4.4 Base-Year Market Share, 2025
- 12.4.5 Segment CAGR and Growth Drivers
- 12.4.6 Subsegment Market Size and Forecast
- 12.4.6.1 Design & Visualization
- 12.4.6.2 Education & Training
- 12.4.6.3 Sales & Marketing
- 12.4.6.4 Strategy Planning
- 12.4.6.5 Others
- 12.4.7 Subsegment Pricing and Adoption Trends
- 12.4.8 Leading Suppliers and Competition
- 12.4.9 Regional Demand and Opportunities
- 12.5 By End-Use Industry - Market Size and Forecast, 2025-2035
- 12.5.1 Segment Definition and Scope
- 12.5.2 Historical Market Size, 2018-2025
- 12.5.3 Revenue Forecast, 2025-2035
- 12.5.4 Base-Year Market Share, 2025
- 12.5.5 Segment CAGR and Growth Drivers
- 12.5.6 Subsegment Market Size and Forecast
- 12.5.6.1 Manufacturing
- 12.5.6.2 Healthcare
- 12.5.6.3 Aerospace & Defense
- 12.5.6.4 Automotive & Transportation
- 12.5.6.5 Construction
- 12.5.6.6 Government & Defense
- 12.5.6.7 Media & Entertainment
- 12.5.6.8 Retail & E-commerce
- 12.5.6.9 Gaming
- 12.5.6.10 Others
- 12.5.7 Subsegment Pricing and Adoption Trends
- 12.5.8 Leading Suppliers and Competition
- 12.5.9 Regional Demand and Opportunities
- 12.6 Segment Growth Comparison
- 12.7 Segment Attractiveness and Priority Matrix
Chapter 13 Global Immersive Analytics End-Use and Application Market Outlook
- 13.1 End-Use Industry and Customer Demand Structure
- 13.2 Leading Applications and Customer Groups
- 13.3 End-Use Market Size, Share and Forecast
- 13.4 Major End-Use Industry Deep Dives
- 13.4.1 Customer Requirements and Use Cases
- 13.4.2 Demand and Replacement Cycles
- 13.4.3 Technical and Regulatory Considerations
- 13.4.4 Purchasing and Procurement Models
- 13.4.5 Leading Vendors and Distribution Channels
- 13.4.6 Forecast and Commercial Opportunities
- 13.5 Emerging Applications and Cross-Segment Demand
- 13.6 End-Use Industry Investment Priorities
Chapter 14 Global Immersive Analytics Geographic Market Outlook, 2025-2035
- 14.1 Regional Market Size and Share, 2025
- 14.2 Regional Market Forecast, 2025-2035
- 14.3 Regional Pricing, Production and Demand Differences
- 14.4 North America
- 14.4.1 United States
- 14.4.2 Canada
- 14.4.3 Mexico
- 14.5 Europe
- 14.5.1 Germany
- 14.5.2 France
- 14.5.3 Italy
- 14.5.4 United Kingdom
- 14.5.5 Spain
- 14.5.6 Poland
- 14.5.7 Russia
- 14.5.8 Netherlands
- 14.5.9 Belgium
- 14.5.10 Sweden
- 14.5.11 Denmark
- 14.5.12 Norway
- 14.5.13 Rest of Europe
- 14.6 Asia Pacific
- 14.6.1 China
- 14.6.2 India
- 14.6.3 Japan
- 14.6.4 South Korea
- 14.6.5 Thailand
- 14.6.6 Indonesia
- 14.6.7 Vietnam
- 14.6.8 Malaysia
- 14.6.9 Australia
- 14.6.10 Rest of Asia Pacific
- 14.7 Latin America
- 14.7.1 Brazil
- 14.7.2 Argentina
- 14.7.3 Colombia
- 14.7.4 Chile
- 14.7.5 Rest of Latin America
- 14.8 Middle East
- 14.8.1 Saudi Arabia
- 14.8.2 United Arab Emirates
- 14.8.3 Turkey
- 14.8.4 Israel
- 14.8.5 Iran
- 14.8.6 Rest of the Middle East
- 14.9 Africa
- 14.9.1 South Africa
- 14.9.2 Egypt
- 14.9.3 Nigeria
- 14.9.4 Morocco
- 14.9.5 Rest of Africa
- 14.10 Regional Investment, Policy and Supply Chain Differences
- 14.11 Regional Competitive Landscape
- 14.12 Geographic Growth Hotspots
Chapter 15 Global Immersive Analytics Technology, Innovation and Sustainability Outlook
- 15.1 Technology Landscape and Maturity
- 15.2 Product, Process and Service Innovation
- 15.3 AI, Automation and Digital Tools in the Industry
- 15.4 Technology Adoption and Performance Benchmarking
- 15.5 Innovation Pipeline and R&D Investment
- 15.6 Patent and Intellectual Property Trends
- 15.7 Energy Efficiency and Resource Management
- 15.8 Sustainability, Recycling and Circularity
- 15.9 Technology Roadmap, 2025-2035
- 15.10 Risks of Obsolescence and Technology Substitution
Chapter 16 Global Immersive Analytics Market Key Strategic Imperatives
- 16.1 Growth and Market Entry Priorities
- 16.2 High-Return Products and Segments
- 16.3 Pricing, Profitability and Cost Optimization
- 16.4 Technology Investment and Product Differentiation
- 16.5 Supply Chain Localization and Resilience
- 16.6 Distribution and Customer Acquisition
- 16.7 Partnership, Acquisition and Capacity Strategy
- 16.8 Regional Expansion Priorities
- 16.9 Short-, Medium- and Long-Term Actions
Chapter 17 Competition Outlook
- 17.1 Industry Competition Characteristics
- 17.2 Market Structure and Concentration
- 17.3 Market Share and Competitive Positioning, 2025
- 17.4 Company-Wise Revenue and Product Benchmarking
- 17.5 Production and Service Capacity Benchmarking
- 17.6 Technology, Pricing and Differentiation
- 17.7 Regional Footprint and Distribution Strength
- 17.8 Mergers, Acquisitions and Strategic Alliances
- 17.9 New Entrants and Competitive Threats
- 17.10 Porter's Five Forces and Industry Attractiveness
- 17.11 Competitive Outlook, 2025-2035
Chapter 18 Company Profiles
- 18.1 Company Coverage and Selection Criteria
- 18.2 Apple
- 18.2.1 Business Description
- 18.2.2 Company Ownership and Geographic Presence
- 18.2.3 Product and Service Portfolio
- 18.2.4 Manufacturing and Operating Footprint
- 18.2.5 Financial Performance and Investment
- 18.2.6 Market Share and Competitive Position
- 18.2.7 Technology and Innovation Capabilities
- 18.2.8 Strategic Alliances or Partnerships
- 18.2.9 Recent Developments
- 18.2.10 Growth Strategy and Outlook
- 18.3 Samsung Electronics
- 18.4 Google
- 18.5 Sony
- 18.6 Meta Platforms
- 18.7 Siemens
- 18.8 NVIDIA
- 18.9 Dassault Systèmes
- 18.10 Autodesk
- 18.11 PTC
- 18.12 Unity Software
- 18.13 Accenture
- 18.14 Other Relevant Market Participants
Note: Every listed company is profiled on the structure shown under the first company. The company list is preliminary and may change based on research findings, market developments, data availability and client requirements.
Chapter 19 Disclaimer
- 19.1 Research and Forecast Disclaimer
- 19.2 Data Source and Estimation Limitations
Note: The depth of individual sections depends on data availability for this market. Volume, capacity, trade and other unit-based metrics are included where applicable.