Smart Airports Market By Technology (Security System, Communication Systems, Air & Ground Traffic Control, Passenger, Other), By Terminal Side (Baggage Handling, Check-in Systems, Other Operations), By Landside (Advanced Vehicle Parking Solutions, Smart Marketing Techniques, Security), By Airside (Air Traffic Management, Aircraft Maintenance, Aircraft Parking), By Applications (Aeronautical Operations, Non-Aeronautical Operations) – Growth, Future Prospects And Competitive Analysis, 2019 – 2027

Price: $4699

Published: | Report ID: 10056 | Report Format : PDF

Rising Urbanization and Growing Number of Investments Has Increased the Demand for Smart Airports Market

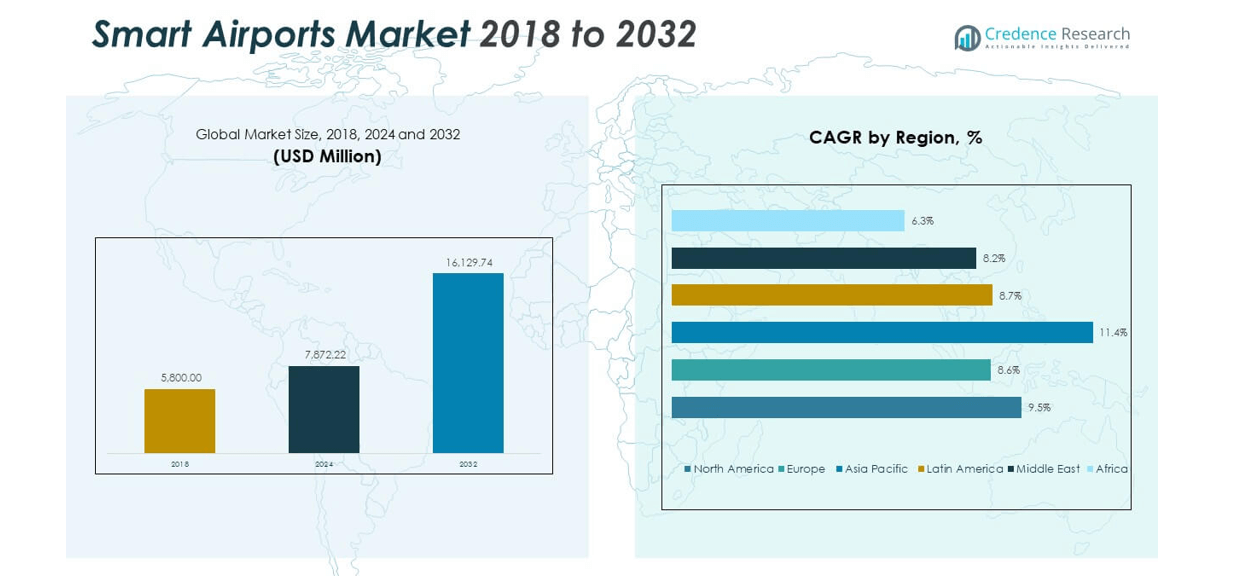
Globally, the smart airport market is expected to grow with a CAGR of 11.50% during the forecast period from 2019 to 2027 and has registered a market value of US$ 13.20 Bn by 2018. The intelligent airport gathers various technologies with the help of the Internet of Things (IoT), with the objective of tactically differentiating an airport while offering an improved traveler experience and providing various benefits with efficiencies and new revenue streams.

The rising urbanization and infrastructure development across the globe are major factors driving the market’s growth. Furthermore, an increasing number of modernized airports, the growing adoption of IoT, and artificial intelligence in airport management and security departments are driving the growth of the intelligent airports market. Additionally, the global government is investing heavily in developing smart airports to increase security and offer ease of service to passengers.

Design Element 2

Access crucial information at unmatched prices!

Request your free sample report today & start making informed decisions powered by Credence Research!

Download Free Sample

CTA Design Element 3

Market Synopsis

Smart Airports with Check-in Systems in its Terminal Side Segment Continue Dominating the Market

In 2018, the Check-in Systems segment led the overall smart airports market contributing to more than 35.0% of the total market revenue, and is expected to grow with a significant CAGR during the forecast period. Being one of the most prominent aspects of airport functioning, the segment is set to retain its dominance over the forecast period. Furthermore, this segment is gaining more popularity due to the increasing number of air travelers and a decrease in airfares, which has increased the number of check-ins.

North America Dominates the Market by Region

The global smart airport market was led by North America, with a market share of more than 30.0% in 2018. The region is one of the earliest adopters of the technology, and increasing investments made by the government and private enterprises in the market for security concerns, ease of management, reducing manual work, and others are among the factors driving the market growth in the region. The US accounts for the largest market share in the region due to the development of new technology and the increasing utilization of various IoT devices in airports for communication purposes.

Some prominent players operating in smart airports are Honeywell International Inc., Cisco Systems Inc., Amadeus IT Group, Siemens AG, T-Systems International GmbH, Thales SA, SITA, Collins Aerospace, NATS Limited, Sabre Corp., IBM Corporation, and L-3 Security & Detection Systems Inc.

Historical & Forecast Period

This research report presents the analysis of each segment from 2017 to 2027, considering 2018 as the base year for the research. In addition, compounded Annual Growth Rate (CAGR) for each respective segment was calculated for the forecast period from 2019 to 2027.

Shape Your Report to Specific Countries or Regions & Enjoy 30% Off!

Report Scope by Segments

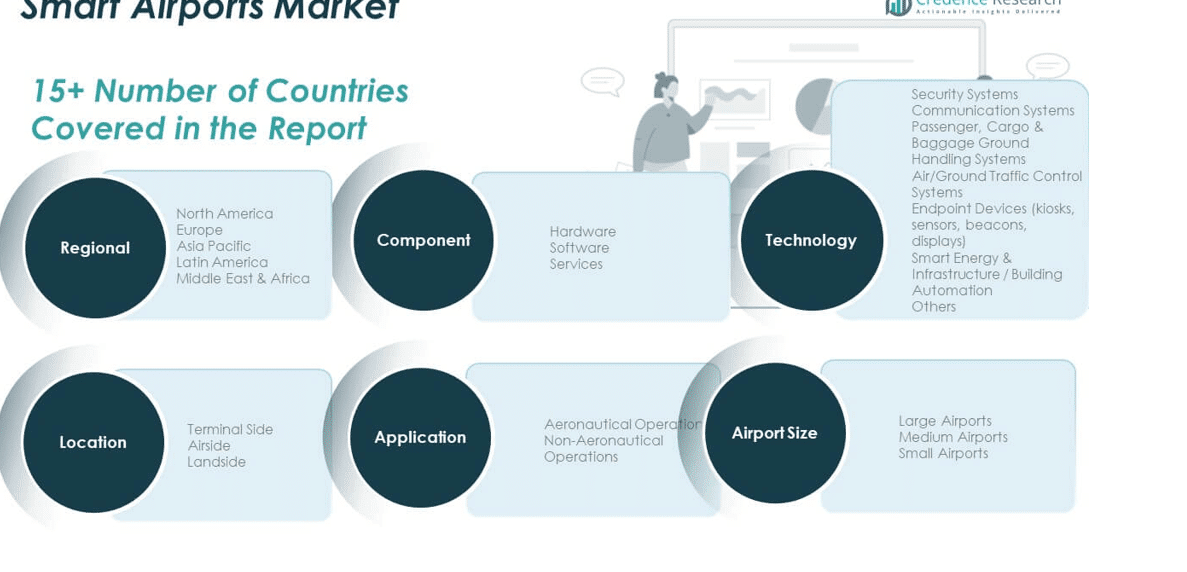
The intelligent airport market report provides market size and estimates based on market dynamics and key trends observed in the industry. In addition, the report provides a holistic view of the global smart airport market based on technology, landside, applications, airside, terminal sides, and geography.

Chapter 1 Preface
1.1 Report Description
1.1.1 Purpose of the Report
1.1.2 Target Audience
1.1.3 USP and Key Offerings
1.2 Research Scope
1.3 Market Segmentation
1.4 Research Methodology
1.4.1 Phase I – Secondary Research
1.4.2 Phase II – Primary Research
1.4.3 Phase III – Expert Panel Review
1.4.4 Assumptions
1.4.5 Approach Adopted

Chapter 2 Executive Summary
2.1 Market Snapshot: Global SA Market
2.2 Global SA Market, By Technology, 2018 (US$ Bn)
2.3 Global SA Market, By Landside, 2018 (US$ Bn)
2.4 Global SA Market, By Airside, 2018 (US$ Bn)
2.5 Global SA Market, By Terminal Side, 2018 (US$ Bn)
2.6 Global SA Market, By Applications, 2018 (US$ Bn)
2.7 Global SA Market, By Geography, 2018 (US$ Bn)

Chapter 3 Market Dynamics
3.1 Introduction
3.1.1 Global SA Market Value, 2017 – 2027, (US$ Bn)
3.2 Market Drivers
3.3 Market Growth Inhibitors
3.3.1 Impact Analysis of Drivers and Restraints
3.4 Key Market Trends
3.5 Attractive Investment Proposition, by Geography, 2018
3.6 Competitive Analysis
3.6.1 Market Positioning of Key SA Vendors, 2018
3.6.2 Key Strategies Adopted by the Leading Players

Chapter 4 Global Smart Airport (SA) Market Analysis, by Technology, 2017 – 2027 (US$ Bn)
4.1 Overview
4.2 Security System
4.3 Communication Systems
4.4 Air and Ground Traffic Control
4.5 Passenger, Cargo and Baggage, and Ground Handling

Chapter 5 Global Smart Airport (SA) Market Analysis, by Terminal Side, 2017 – 2027 (US$ Bn)
5.1 Overview
5.2 Baggage Handling
5.3 Check-in Systems
5.4 Other Operations

Chapter 6 Global Smart Airport (SA) Market Analysis, by Landside, 2017 – 2027 (US$ Bn)
6.1 Overview
6.2 Advanced Vehicle Parking Solutions
6.3 Smart Marketing Techniques
6.4 Security

Chapter 7 Global Smart Airport (SA) Market Analysis, by Airside, 2017 – 2027 (US$ Bn)
7.1 Overview
7.2 Air Traffic Management
7.3 Aircraft Maintenance
7.4 Aircraft Parking

Chapter 8 Global Smart Airport (SA) Market Analysis, by Applications, 2017 – 2027 (US$ Bn)
8.1 Overview
8.2 Aeronautical Operations
8.3 Non-aeronautical Operations

Chapter 9 North America Smart Airport (SA) Market Analysis, 2017 – 2027 (US$ Bn)
9.1 Overview
9.2 North America SA Market Analysis, By Technology, 2017 – 2027
9.2.1 Market Analysis
9.3 North America SA Market Analysis, By Landside, 2017 – 2027
9.3.1 Market Analysis
9.4 North America SA Market Analysis, By Airside, 2017 – 2027
9.4.1 Market Analysis
9.5 North America SA Market Analysis, By Terminal Side, 2017 – 2027
9.5.1 Market Analysis
9.6 North America SA Market Analysis, By Applications, 2017 – 2027
9.6.1 Market Analysis
9.7 North America SA Market Analysis, By Region/Country, 2017 – 2027
9.7.1 U.S.
9.7.1.1 U.S. SA Market Value, By Technology, 2017 – 2027 (US$ Bn)
9.7.1.2 U.S. SA Market Value, By Landside, 2017 – 2027 (US$ Bn)
9.7.1.3 U.S. SA Market Value, By Airside, 2017 – 2027 (US$ Bn)
9.7.1.4 U.S. SA Market Value, By Terminal Side, 2017 – 2027 (US$ Bn)
9.7.1.5 U.S. SA Market Value, By Applications, 2017 – 2027 (US$ Bn)
9.7.2 Rest of North America
9.7.2.1 Rest of North America SA Market Value, By Technology, 2017 – 2027 (US$ Bn)
9.7.2.2 Rest of North America SA Market Value, By Landside, 2017 – 2027 (US$ Bn)
9.7.2.3 Rest of North America SA Market Value, By Airside, 2017 – 2027 (US$ Bn)
9.7.2.4 Rest of North America SA Market Value, By Terminal Side, 2017 – 2027 (US$ Bn)
9.7.2.5 Rest of North America SA Market Value, By Applications, 2017 – 2027 (US$ Bn)

Chapter 10 Europe Smart Airport (SA) Market Analysis, 2017 – 2027 (US$ Bn)
10.1 Overview
10.2 Europe SA Market Analysis, By Technology, 2017 – 2027
10.2.1 Market Analysis
10.3 Europe SA Market Analysis, By Landside, 2017 – 2027
10.3.1 Market Analysis
10.4 Europe SA Market Analysis, By Airside, 2017 – 2027
10.4.1 Market Analysis
10.5 Europe SA Market Analysis, By Terminal Side, 2017 – 2027
10.5.1 Market Analysis
10.6 Europe SA Market Analysis, By Applications, 2017 – 2027
10.6.1 Market Analysis
10.7 Europe SA Market Analysis, By Region/Country, 2017 – 2027
10.7.1 U.K.
10.7.1.1 U.K. SA Market Value, By Technology, 2017 – 2027 (US$ Bn)
10.7.1.2 U.K.SA Market Value, By Landside, 2017 – 2027 (US$ Bn)
10.7.1.3 U.K.SA Market Value, By Airside, 2017 – 2027 (US$ Bn)
10.7.1.4 U.K.SA Market Value, By Terminal Side, 2017 – 2027 (US$ Bn)
10.7.1.5 U.K.SA Market Value, By Applications, 2017 – 2027 (US$ Bn)
10.7.2 Germany
10.7.2.1 Germany SA Market Value, By Technology, 2017 – 2027 (US$ Bn)
10.7.2.2 Germany SA Market Value, By Landside, 2017 – 2027 (US$ Bn)
10.7.2.3 Germany SA Market Value, By Airside, 2017 – 2027 (US$ Bn)
10.7.2.4 Germany SA Market Value, By Terminal Side, 2017 – 2027 (US$ Bn)
10.7.2.5 Germany SA Market Value, By Applications
10.7.3 France
10.7.3.1 France SA Market Value, By Applications, 2017 – 2027 (US$ Bn)
10.7.3.2 France SA Market Value, By Landside, 2017 – 2027 (US$ Bn)
10.7.3.3 France SA Market Value, By Airside, 2017 – 2027 (US$ Bn)
10.7.3.4 France SA Market Value, By Terminal Side, 2017 – 2027 (US$ Bn)
10.7.3.5 France SA Market Value, By Applications, 2017 – 2027 (US$ Bn)
10.7.4 Rest of Europe
10.7.4.1 Rest of Europe SA Market Value, By Technology, 2017 – 2027 (US$ Bn)
10.7.4.2 Rest of Europe SA Market Value, By Landside, 2017 – 2027 (US$ Bn)
10.7.4.3 Rest of Europe SA Market Value, By Airside, 2017 – 2027 (US$ Bn)
10.7.4.4 Rest of Europe SA Market Value, By Terminal Side, 2017 – 2027 (US$ Bn)
10.7.4.5 Rest of Europe SA Market Value, By Applications, 2017 – 2027 (US$ Bn)

Chapter 11 Asia Pacific Smart Airport (SA) Market Analysis, 2017 – 2027 (US$ Bn)
11.1 Overview
11.2 Asia Pacific SA Market Analysis, By Technology, 2017 – 2027
11.2.1 Market Analysis
11.3 Asia Pacific SA Market Analysis, By Landside, 2017 – 2027
11.3.1 Market Analysis
11.4 Asia Pacific SA Market Analysis, By Airside, 2017 – 2027
11.4.1 Market Analysis
11.5 Asia Pacific SA Market Analysis, By Terminal Side, 2017 – 2027
11.5.1 Market Analysis
11.6 Asia Pacific SA Market Analysis, By Applications, 2017 – 2027
11.6.1 Market Analysis
11.7 Asia Pacific SA Market Analysis, By Region/Country, 2017 – 2027
11.7.1 China
11.7.1.1 China SA Market Value, By Technology, 2017 – 2027 (US$ Bn)
11.7.1.2 China SA Market Value, By Landside, 2017 – 2027 (US$ Bn)
11.7.1.3 China SA Market Value, By Airside, 2017 – 2027 (US$ Bn)
11.7.1.4 China SA Market Value, By Terminal Side, 2017 – 2027 (US$ Bn)
11.7.1.5 China SA Market Value, By Applications, 2017 – 2027 (US$ Bn)
11.7.2 Japan
11.7.2.1 Japan SA Market Value, By Technology, 2017 – 2027 (US$ Bn)
11.7.2.2 Japan SA Market Value, By Landside, 2017 – 2027 (US$ Bn)
11.7.2.3 JapanSA Market Value, By Airside, 2017 – 2027 (US$ Bn)
11.7.2.4 Japan SA Market Value, By Terminal Side, 2017 – 2027 (US$ Bn)
11.7.2.5 Japan SA Market Value, By Applications, 2017 – 2027 (US$ Bn)
11.7.3 India
11.7.3.1 India SA Market Value, By Technology, 2017 – 2027 (US$ Bn)
11.7.3.2 India SA Market Value, By Landside, 2017 – 2027 (US$ Bn)
11.7.3.3 India SA Market Value, By Airside, 2017 – 2027 (US$ Bn)
11.7.3.4 India SA Market Value, By Terminal Side, 2017 – 2027 (US$ Bn)
11.7.3.5 India SA Market Value, By Applications, 2017 – 2027 (US$ Bn)
11.7.4 Rest of Asia Pacific
11.7.4.1 Rest of Asia Pacific SA Market Value, By Technology, 2017 – 2027 (US$ Bn)
11.7.4.2 Rest of Asia Pacific SA Market Value, By Landside, 2017 – 2027 (US$ Bn)
11.7.4.3 Rest of Asia Pacific SA Market Value, By Airside, 2017 – 2027 (US$ Bn)
11.7.4.4 Rest of Asia-Pacific SA Market Value, By Terminal Side, 2017 – 2027 (US$ Bn)
11.7.4.5 Rest of Asia-Pacific SA Market Value, By Applications, 2017 – 2027 (US$ Bn)

Chapter 12 Rest of the World (RoW) Smart Airport (SA) Market Analysis, 2017 – 2027 (US$ Bn)
12.1 Overview
12.2 RoW SA Market Analysis, By Technology, 2017 – 2027
12.2.1 Market Analysis
12.3 RoW SA Market Analysis, By Landside, 2017 – 2027
12.3.1 Market Analysis
12.4 RoW SA Market Analysis, By Airside, 2017 – 2027
12.4.1 Market Analysis
12.5 RoW SA Market Analysis, By Terminal Side, 2017 – 2027
12.5.1 Market Analysis
12.6 RoW SA Market Analysis, By Applications, 2017 – 2027
12.6.1 Market Analysis
12.7 RoW SA Market Analysis, By Region/Country, 2017 – 2027
12.7.1 Middle East & Africa (MEA)
12.7.1.1 MEA SA Market Value, By Technology, 2017 – 2027 (US$ Bn)
12.7.1.2 MEA SA Market Value, By Landside, 2017 – 2027 (US$ Bn)
12.7.1.3 MEA SA Market Value, By Airside, 2017 – 2027 (US$ Bn)
12.7.1.4 MEA SA Market Value, By Terminal Side, 2017 – 2027 (US$ Bn)
12.7.1.5 MEA SA Market Value, By Applications, 2017 – 2027 (US$ Bn)
12.7.2 Latin America
12.7.2.1 Latin America SA Market Value, By Technology, 2017 – 2027 (US$ Bn)
12.7.2.2 Latin America SA Market Value, By Landside, 2017 – 2027 (US$ Bn)
12.7.2.3 Latin America SA Market Value, By Airside, 2017 – 2027 (US$ Bn)
12.7.2.4 Latin America SA Market Value, By Terminal Side, 2017 – 2027 (US$ Bn)
12.7.2.5 Latin America SA Market Value, By Applications, 2017 – 2027 (US$ Bn)

Chapter 13 Company Profiles
13.1 Honeywell international Inc.
13.2 Cisco Systems Inc.
13.3 Amadeus IT Group
13.4 Siemens AG
13.5 T-Systems international GmbH
13.6 Thales SA
13.7 SITA
13.8 Collins Aerospace
13.9 NATS Limited
13.10 Sabre Corp.
13.11 IBM Corporation
13.12 L-3 Security & Detection Systems Inc.

List of Figures

FIG. 1 Global Smart Airport (SA): Market Segmentation
FIG. 2 Global SA Market: Research Methodology
FIG. 3 Top-Down and Bottom Up Approach
FIG. 4 Global SA Market, By Technology, 2018 (US$ Bn)
FIG. 5 Global SA Market, By Landside, 2018 (US$ Bn)
FIG. 6 Global SA Market, By Airside, 2018 (US$ Bn)
FIG. 7 Global SA Market, By Terminal Side, 2018 (US$ Bn)
FIG. 8 Global SA Market, By Applications, 2018 (US$ Bn)
FIG. 9 Global SA Market, By Geography, 2018 (US$ Bn)
FIG. 10 Global SA Market Value, 2017 – 2027, (US$ Bn)
FIG. 11 Attractive Investment Proposition, by Geography, 2018
FIG. 12 Market Positioning of Key SAVendors, 2018
FIG. 13 Global SA Market Value Contribution, By Technology, 2018 & 2027 (%)
FIG. 14 Global Security System, SA Market Value, 2017 – 2027, (US$ Bn)
FIG. 15 Global Communication Systems, SA Market Value, 2017 – 2027, (US$ Bn)
FIG. 16 Global Air and Ground Traffic Control, SA Market Value, 2017 – 2027, (US$ Bn)
FIG. 17 Global Passenger, Cargo and Baggage, and Ground Handling, SA Market Value, 2017 – 2027, (US$ Bn)
FIG. 18 Global SA Market Value Contribution, By Terminal Side, 2018 & 2027 (%)
FIG. 19 Global Baggage Handling SA Market Value, 2017 – 2027, (US$ Bn)
FIG. 20 Global Check-in Systems, SA Market Value, 2017 – 2027, (US$ Bn)
FIG. 21 Global Other Operations, SA Market Value, 2017 – 2027, (US$ Bn)
FIG. 22 Global SA Market Value Contribution, By Landside, 2018 & 2027 (%)
FIG. 23 Global Advanced Vehicle Parking Solutions, SA, Market Value, 2017 – 2027, (US$ Bn)
FIG. 24 Global Smart Marketing Techniques, SA Market Value, 2017 – 2027, (US$ Bn)
FIG. 25 Global Security, SA Market Value, 2017 – 2027, (US$ Bn)
FIG. 26 Global SA Market Value Contribution, By Airside, 2018 & 2027 (%)
FIG. 27 Global SA Market Value from Air Traffic Management, 2017 – 2027(US$ Bn)
FIG. 28 Global SA Market Value from Aircraft Maintenance, 2017 – 2027(US$ Bn)
FIG. 29 Global SA Market Value from Aircraft Parking, 2017 – 2027(US$ Bn)
FIG. 30 Global SA Market Value Contribution, By Applications, 2018 & 2027 (%)
FIG. 31 Global SA Market Value from Aeronautical Operations, 2017 – 2027(US$ Bn)
FIG. 32 Global SA Market Value from Non-aeronautical Operations, 2017 – 2027(US$ Bn)
FIG. 33 North America SA Market Value, 2017 – 2027, (US$ Bn)
FIG. 34 Europe SA Market Value, 2017 – 2027, (US$ Bn)
FIG. 35 Asia Pacific SA Market Value, 2017 – 2027, (US$ Bn)
FIG. 36 RoWSA Market Value, 2017 – 2027, (US$ Bn)

List of Tables

TABLE 1 Market Snapshot: Global Smart Airport (SA) Market
TABLE 2 Impact Indicators
TABLE 3 Impact Analysis of Drivers and Restraints
TABLE 4 North America SA Market Value, By Technology, 2017 – 2027(US$ Bn)
TABLE 5 North America SA Market Value, By Landside, 2017 – 2027(US$ Bn)
TABLE 6 North America SA Market Value, By Airside, 2017 – 2027(US$ Bn)
TABLE 7 North America SA Market Value, By Terminal Side, 2017 – 2027(US$ Bn)
TABLE 8 North America SA Market Value, By Applications, 2017 – 2027(US$ Bn)
TABLE 9 North America SA Market Value, By Region/Country, 2017 – 2027 (US$ Bn)
TABLE 10 U.S. SA Market Value, By Technology, 2017 – 2027 (US$ Bn)
TABLE 11 U.S. SA Market Value, By Landside, 2017 – 2027 (US$ Bn)
TABLE 12 U.S. SA Market Value, By Airside, 2017 – 2027 (US$ Bn)
TABLE 13 U.S. SA Market Value, By Terminal Side, 2017 – 2027 (US$ Bn)
TABLE 14 U.S. SA Market Value, By Applications, 2017 – 2027 (US$ Bn)
TABLE 15 Rest of North America SA Market Value, By Technology, 2017 – 2027 (US$ Bn)
TABLE 16 Rest of North America SA Market Value, By Landside, 2017 – 2027 (US$ Bn)
TABLE 17 Rest of North America SA Market Value, By Airside, 2017 – 2027 (US$ Bn)
TABLE 18 Rest of North America SA Market Value, By Terminal Side, 2017 – 2027 (US$ Bn)
TABLE 19 Rest of North America SA Market Value, By Applications, 2017 – 2027 (US$ Bn)
TABLE 20 Europe SA Market Value, By Technology, 2017 – 2027(US$ Bn)
TABLE 21 Europe SA Market Value, By Landside, 2017 – 2027(US$ Bn)
TABLE 22 Europe SA Market Value, By Airside, 2017 – 2027(US$ Bn)
TABLE 23 Europe SA Market Value, By Terminal Side, 2017 – 2027(US$ Bn)
TABLE 24 Europe SA Market Value, By Applications, 2017 – 2027(US$ Bn)
TABLE 25 Europe SA Market Value, By Region/Country, 2017 – 2027 (US$ Bn)
TABLE 26 U.K. SA Market Value, By Technology, 2017 – 2027 (US$ Bn)
TABLE 27 U.K. SA Market Value, By Landside, 2017 – 2027 (US$ Bn)
TABLE 28 U.K. SA Market Value, By Airside, 2017 – 2027 (US$ Bn)
TABLE 29 U.K. SA Market Value, By Terminal Side, 2017 – 2027 (US$ Bn)
TABLE 30 U.K. SA Market Value, By Applications, 2017 – 2027 (US$ Bn)
TABLE 31 Germany SA Market Value, By Technology, 2017 – 2027 (US$ Bn)
TABLE 32 Germany SA Market Value, By Landside, 2017 – 2027 (US$ Bn)
TABLE 33 Germany SA Market Value, By Airside, 2017 – 2027 (US$ Bn)
TABLE 34 Germany SA Market Value, By Terminal Side, 2017 – 2027 (US$ Bn)
TABLE 35 France SA Market Value, By Technology, 2017 – 2027 (US$ Bn)
TABLE 36 France SA Market Value, By Landside, 2017 – 2027 (US$ Bn)
TABLE 37 France SA Market Value, By Airside, 2017 – 2027 (US$ Bn)
TABLE 38 France SA Market Value, By Terminal Side, 2017 – 2027 (US$ Bn)
TABLE 39 France SA Market Value, By Applications, 2017 – 2027 (US$ Bn)
TABLE 40 Rest of Europe SA Market Value, By Technology, 2017 – 2027 (US$ Bn)
TABLE 41 Rest of Europe SA Market Value, By Landside, 2017 – 2027 (US$ Bn)
TABLE 42 Rest of Europe SA Market Value, By Airside, 2017 – 2027 (US$ Bn)
TABLE 43 Rest of Europe SA Market Value, By Terminal Side, 2017 – 2027 (US$ Bn)
TABLE 44 Rest of Europe SA Market Value, By Applications, 2017 – 2027 (US$ Bn)
TABLE 45 Asia Pacific SA Market Value, By Technology, 2017 – 2027(US$ Bn)
TABLE 46 Asia Pacific SA Market Value, By Landside, 2017 – 2027(US$ Bn)
TABLE 47 Asia Pacific SA Market Value, By Airside, 2017 – 2027(US$ Bn)
TABLE 48 Asia Pacific SA Market Value, By Terminal Side, 2017 – 2027(US$ Bn)
TABLE 49 Asia Pacific SA Market Value, By Applications, 2017 – 2027(US$ Bn)
TABLE 50 Asia Pacific SA Market Value, By Region/Country, 2017 – 2027 (US$ Bn)
TABLE 51 China SA Market Value, By Technology, 2017 – 2027 (US$ Bn)
TABLE 52 China SA Market Value, By Landside, 2017 – 2027 (US$ Bn)
TABLE 53 China SA Market Value, By Airside, 2017 – 2027 (US$ Bn)
TABLE 54 China SA Market Value, By Terminal Side, 2017 – 2027 (US$ Bn)
TABLE 55 China SA Market Value, By Applications, 2017 – 2027 (US$ Bn)
TABLE 56 Japan SA Market Value, By Technology, 2017 – 2027 (US$ Bn)
TABLE 57 Japan SA Market Value, By Landside, 2017 – 2027 (US$ Bn)
TABLE 58 Japan SA Market Value, By Airside, 2017 – 2027 (US$ Bn)
TABLE 59 Japan SA Market Value, By Terminal Side, 2017 – 2027 (US$ Bn)
TABLE 60 Japan SA Market Value, By Applications, 2017 – 2027 (US$ Bn)
TABLE 61 India SA Market Value, By Technology, 2017 – 2027 (US$ Bn)
TABLE 62 India SA Market Value, By Landside, 2017 – 2027 (US$ Bn)
TABLE 63 India SA Market Value, By Airside, 2017 – 2027 (US$ Bn)
TABLE 64 India SA Market Value, By Terminal Side, 2017 – 2027 (US$ Bn)
TABLE 65 India SA Market Value, By Applications, 2017 – 2027 (US$ Bn)
TABLE 66 Rest of Asia Pacific SA Market Value, By Technology, 2017 – 2027 (US$ Bn)
TABLE 67 Rest of Asia Pacific SA Market Value, By Landside, 2017 – 2027 (US$ Bn)
TABLE 68 Rest of Asia Pacific SA Market Value, By Airside, 2017 – 2027 (US$ Bn)
TABLE 69 Rest of Asia-Pacific SA Market Value, By Terminal Side, 2017 – 2027 (US$ Bn)
TABLE 70 Rest of Asia-Pacific SA Market Value, By Applications, 2017 – 2027 (US$ Bn)
TABLE 71 RoW SA Market Value, By Technology, 2017 – 2027(US$ Bn)
TABLE 72 RoW SA Market Value, By Landside, 2017 – 2027(US$ Bn)
TABLE 73 RoW SA Market Value, By Airside, 2017 – 2027(US$ Bn)
TABLE 74 RoW SA Market Value, By Terminal Side, 2017 – 2027(US$ Bn)
TABLE 75 RoW SA Market Value, By Applications, 2017 – 2027(US$ Bn)
TABLE 76 RoW SA Market Value, By Region/Country, 2017 – 2027 (US$ Bn)
TABLE 77 MEA SA Market Value, By Technology, 2017 – 2027 (US$ Bn)
TABLE 78 MEA SA Market Value, By Landside, 2017 – 2027 (US$ Bn)
TABLE 79 MEA SA Market Value, By Airside, 2017 – 2027 (US$ Bn)
TABLE 80 MEA SA Market Value, By Terminal Side, 2017 – 2027 (US$ Bn)
TABLE 81 MEA SA Market Value, By Applications, 2017 – 2027 (US$ Bn)
TABLE 82 Latin America SA Market Value, By Technology, 2017 – 2027 (US$ Bn)
TABLE 83 Latin America SA Market Value, By Landside, 2017 – 2027 (US$ Bn)
TABLE 84 Latin America SA Market Value, By Airside, 2017 – 2027 (US$ Bn)
TABLE 85 Latin America SA Market Value, By Terminal Side, 2017 – 2027 (US$ Bn)
TABLE 86 Latin America SA Market Value, By Applications, 2017 – 2027 (US$ Bn)
TABLE 87 Honeywell international Inc.: Company Snapshot (Company Details, Geographical Presence, Product Portfolio,Recent Developments)
TABLE 88 Cisco Systems Inc.: Company Snapshot (Company Details, Geographical Presence, Product Portfolio,Recent Developments)
TABLE 89 Amadeus IT Group: Company Snapshot (Company Details, Geographical Presence, Product Portfolio,Recent Developments)
TABLE 90 Siemens AG: Company Snapshot (Company Details, Geographical Presence, Product Portfolio,Recent Developments)
TABLE 91 T-Systems international GmbH: Company Snapshot (Company Details, Geographical Presence, Product Portfolio,Recent Developments)
TABLE 92 Thales SA: Company Snapshot (Company Details, Geographical Presence, Product Portfolio,Recent Developments)
TABLE 93 SITA: Company Snapshot (Company Details, Geographical Presence, Product Portfolio,Recent Developments)
TABLE 94 Collins Aerospace: Company Snapshot (Company Details, Geographical Presence, Product Portfolio,Recent Developments)
TABLE 95 NATS Limited: Company Snapshot (Company Details, Geographical Presence, Product Portfolio,Recent Developments)
TABLE 96 Sabre Corp.: Company Snapshot (Company Details, Geographical Presence, Product Portfolio,Recent Developments)
TABLE 97 IBM Corporation: Company Snapshot (Company Details, Geographical Presence, Product Portfolio,Recent Developments)
TABLE 98 L-3 Security & Detection Systems Inc.: Company Snapshot (Company Details, Geographical Presence, Product Portfolio,Recent Developments)

Frequently Asked Questions:

What is the size of Smart Airports Market?

The market for Smart Airports is expected to reach US$ XX by 2027.

What is the Smart Airports Market CAGR?

The Smart Airports market is expected to see significant CAGR growth over the coming years, at 11.50%.

What is the Forecast period considered for Smart Airports Market?

The report is forecasted from 2019-2027.

What is the base year considered for Smart Airports Market?

The base year of this report is 2018.

Who are the major players in this market?

Honeywell international Inc., Cisco Systems Inc., Amadeus IT Group, Siemens AG, T-Systems international GmbH, Thales SA, SITA, Collins Aerospace, NATS Limited, Sabre Corp. are some of the major players in the global market.

Non-Agriculture Smart Irrigation Controllers Market

Published:
Report ID: 63707

Voice Activated Smart Assistant Gadgets Devices Market

Published:
Report ID: 63193

Refurbished Smartphone Market

Published:
Report ID: 62000

Smart Sensors Market

Published:
Report ID: 10311

Public Transport Smart Cards Market

Published:
Report ID: 8306

Smart Speakers Market

Published:
Report ID: 10343

Smartphones Antenna Market

Published:
Report ID: 10402

Smart Baggage Handling System Market

Published:
Report ID: 10062

Smart Fabric Market

Published:
Report ID: 10130

Air Transport MRO Market

Published:
Report ID: 1191

Air Separation Plant Market

Published:
Report ID: 1279

Asset Tracking And Inventory Management Solutions Market

Published:
Report ID: 2327

Architectural Services Market

Published:
Report ID: 54588

Advanced Cinema Projector Market

Published:
Report ID: 1576

3D Radar Market

Published:
Report ID: 973

Next Generation Intrusion Prevention System (NGIPS) Market

Published:
Report ID: 63689

Video On-Demand Market

Published:
Report ID: 12034

Vibration Energy Harvesting Systems Market

Published:
Report ID: 11950

ID Card Printers Market

Published:
Report ID: 63500

Hydrological and Meteorological Equipment Market

Published:
Report ID: 63497

Water Testing Equipment Market

Published:
Report ID: 11710

Purchase Options

The report comes as a view-only PDF document, optimized for individual clients. This version is recommended for personal digital use and does not allow printing.
$4699

To meet the needs of modern corporate teams, our report comes in two formats: a printable PDF and a data-rich Excel sheet. This package is optimized for internal analysis and multi-location access, making it an excellent choice for organizations with distributed workforce.
$5699

The report will be delivered in printable PDF format along with the report’s data Excel sheet. This license offers 100 Free Analyst hours where the client can utilize Credence Research Inc.’s research team. It is highly recommended for organizations seeking to execute short, customized research projects related to the scope of the purchased report.
$7699

Smallform of Sample request

Have a question?

User Profile

Don’t settle for less – trust Mitul to help you find the best solution.

Report delivery within 24 to 48 hours

– Other Info –

What people say?-

User Review

I am very impressed with the information in this report. The author clearly did their research when they came up with this product and it has already given me a lot of ideas.

Jana Schmidt
CEDAR CX Technologies

– Connect with us –

Phone

+91 6232 49 3207


support

24/7 Research Support


sales@credenceresearch.com

– Research Methodology –

Going beyond the basics: advanced techniques in research methodology

– Trusted By –

Pepshi, LG, Nestle
Motorola, Honeywell, Johnson and johnson
LG Chem, SIEMENS, Pfizer
Unilever, Samsonite, QIAGEN