
India casino tourism market rests on Goa and Sikkim
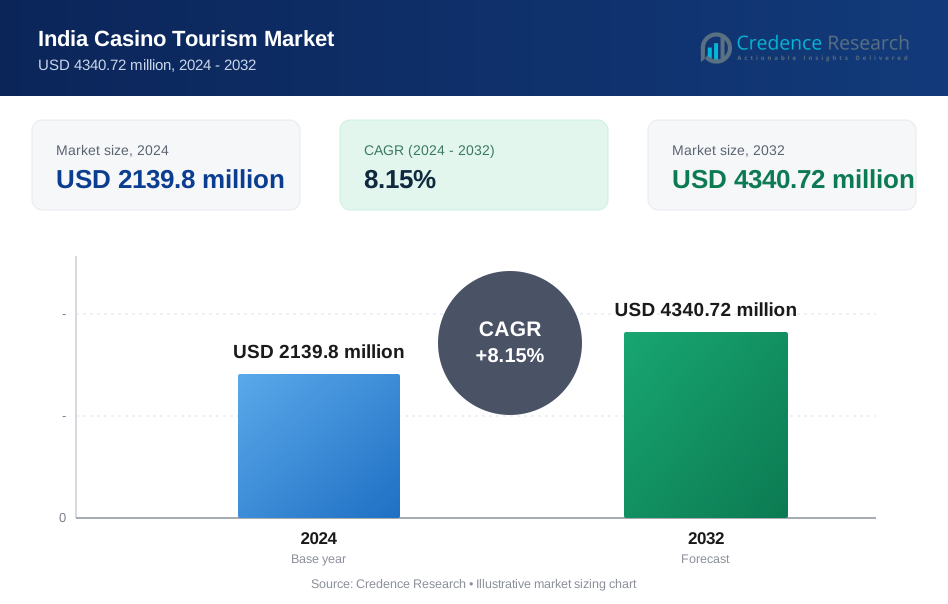
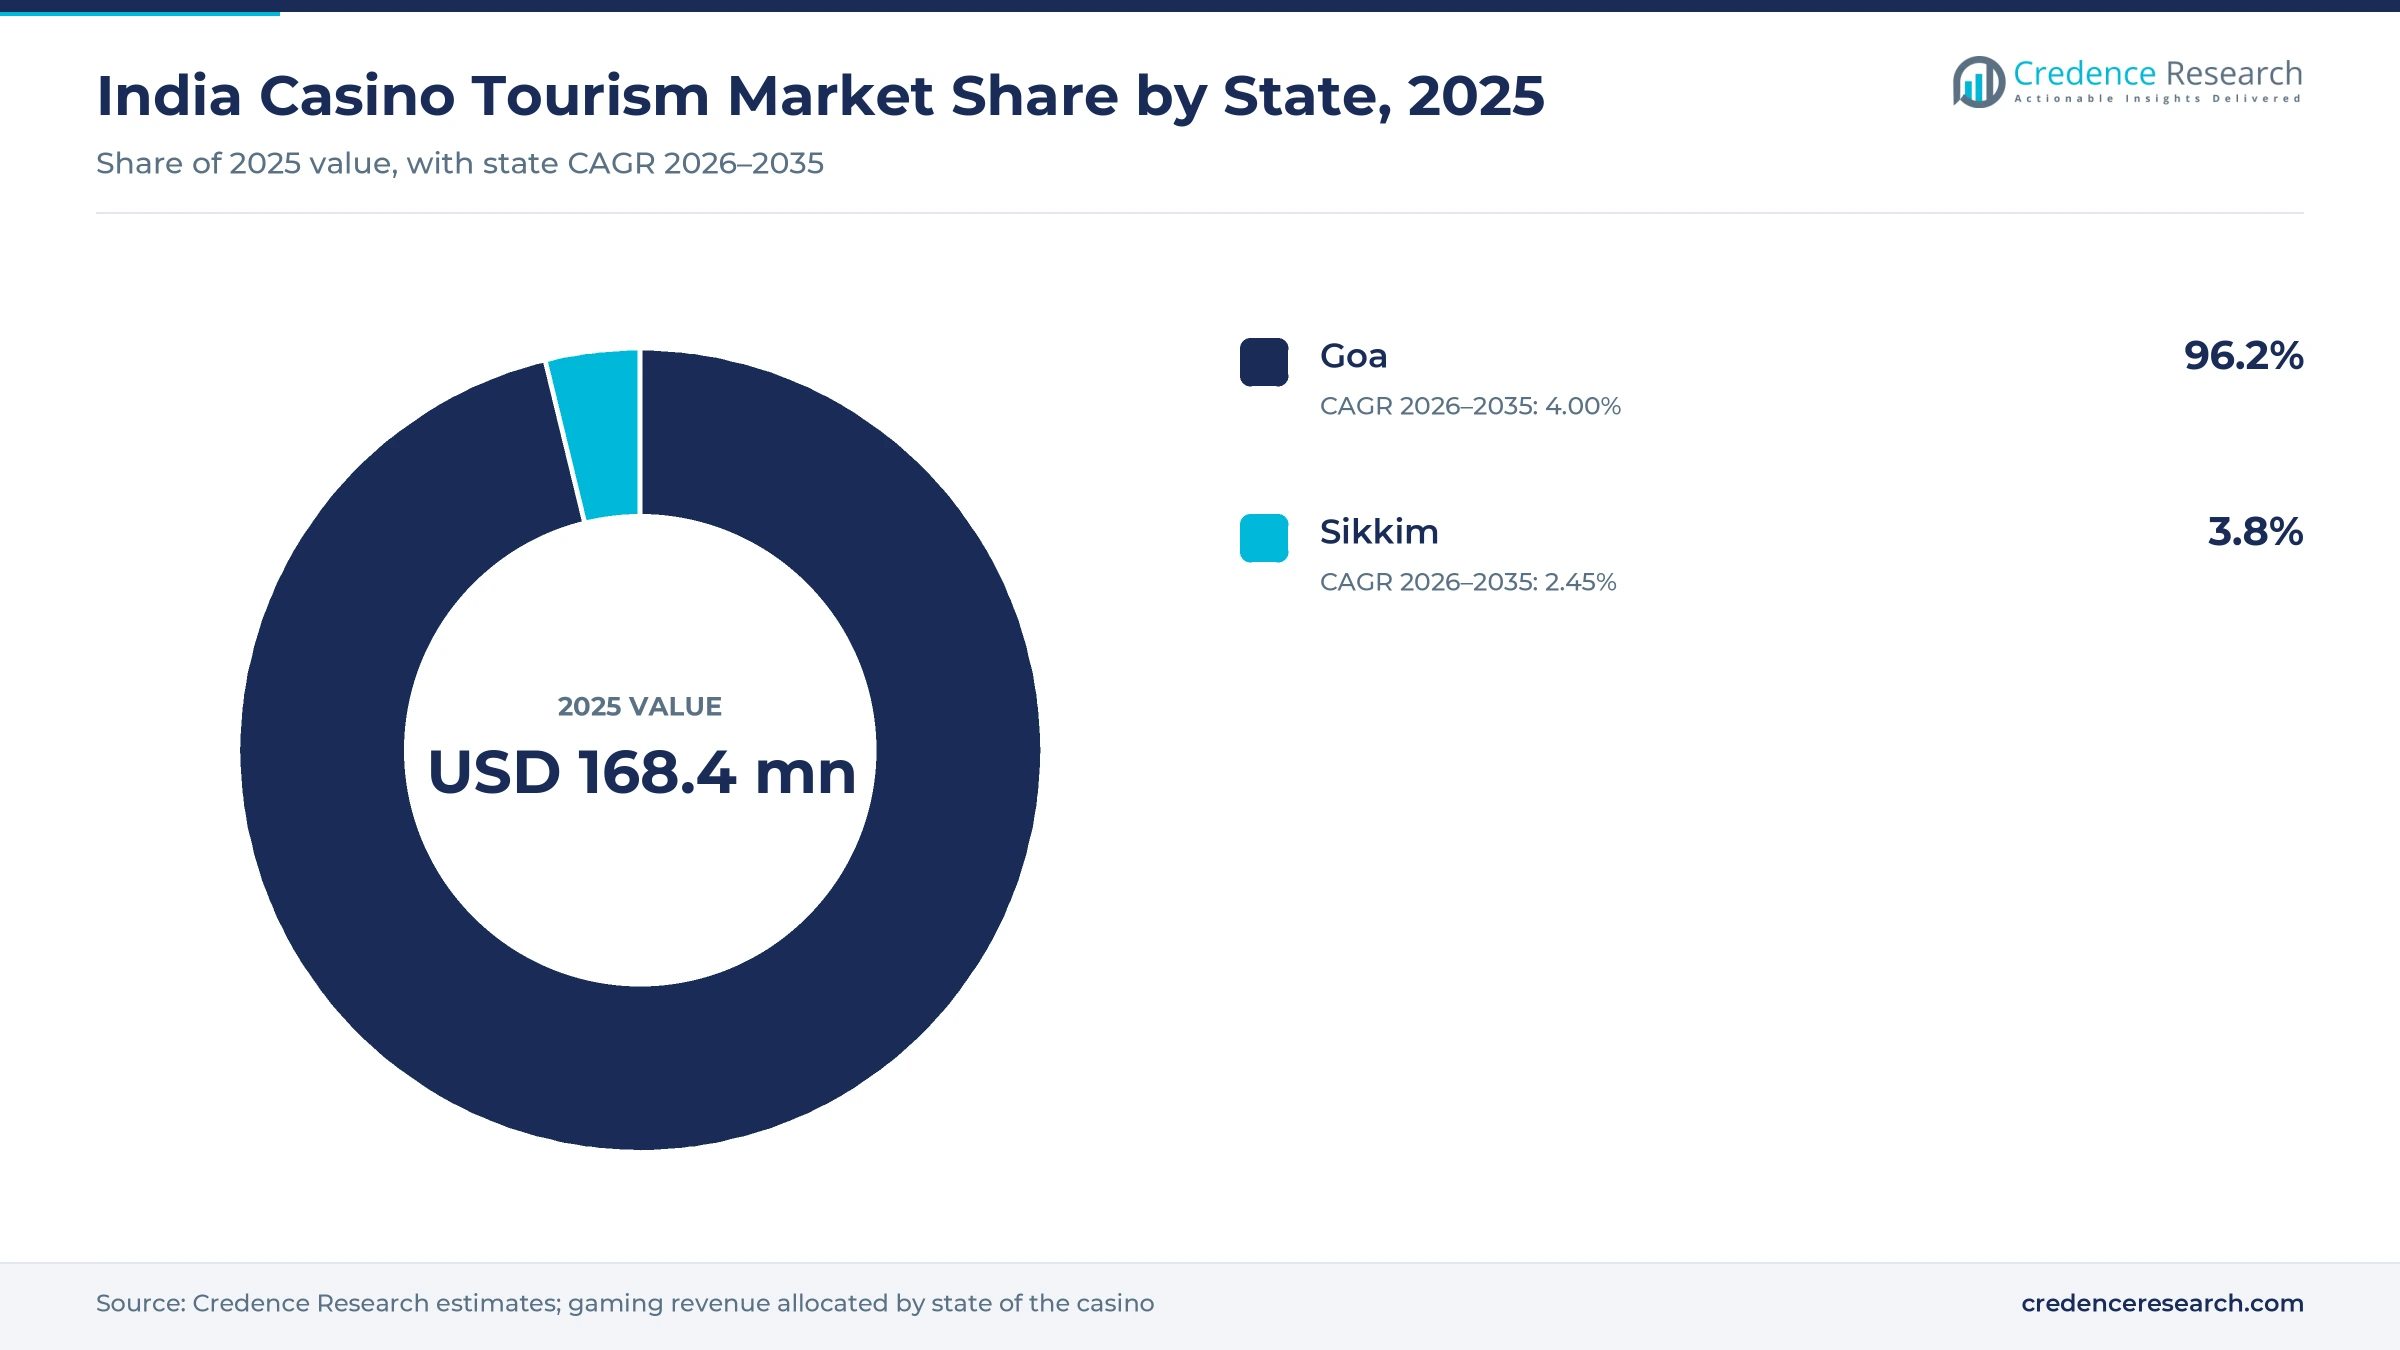
The India casino tourism market was valued at USD 168.4 million in 2025 and is projected to increase from USD 168.4 million in 2026 to USD 238.4 million by 2035, registering a CAGR of 3.94% during 2026–2035. Demand comes mainly from domestic leisure travelers who play live tables on offshore vessels and in hotel casinos during short Goa trips. Goa held 96.2% of 2025 value and is also the fastest-growing state at 4.00% a year, because six licensed vessels on the Mandovi River carry most of the gaming capacity. Sikkim accounts for the rest, and no casino operates in Daman after the Bombay High Court rejected a slot license plea in April 2026. Revenue stays flat in 2026 because GST on chips and entry fees rose from 28% to 40% on 22 September 2025. As a result, growth after 2026 depends on new hotel casinos, the future of the Mandovi vessels and steady tourist arrivals.
What counts as casino gaming revenue in India?
The estimate measures gross gaming revenue, the house win that licensed land-based casinos keep after paying out player winnings and before GST. It covers offshore casinos on vessels moored on the Mandovi River in Goa and onshore casinos inside five-star hotels in Goa and Sikkim. Values are stated in USD million at current prices, converted from Indian rupees at the 2025 average exchange rate.
The estimate excludes online and real-money gaming, state lotteries and horse racing, which follow separate laws. It also excludes the amount wagered, chips sold and entry fees that form the GST base, along with hotel, food, drink and wider tourism spending around each visit. The value chain runs from state licensing and port permits through casino operators to tour packagers and hotels that route guests to the gaming floors.
India Casino Tourism Market Insights
- The market was valued at USD 168.4 million in 2025 and is projected to reach USD 238.4 million by 2035, registering a CAGR of 3.94% during 2026–2035.
- Goa held 96.2% of India casino gaming revenue in 2025, because six offshore vessels and several hotel casinos there carry nearly all licensed capacity.
- Offshore casinos led with 80.6% of 2025 value, as the Mandovi vessels offer the largest live gaming floors in the country.
- GST on casino chips and entry fees rose from 28% to 40% on 22 September 2025, which holds 2026 gaming revenue flat at USD 168.4 million.
- Credence Research estimates that Delta Corp earned about 45% of Indian offline casino gaming revenue in 2025 and holds three of Goa's six offshore licenses.
Offshore tables earn most of the house win
Why do offshore vessels earn most of the gaming revenue?
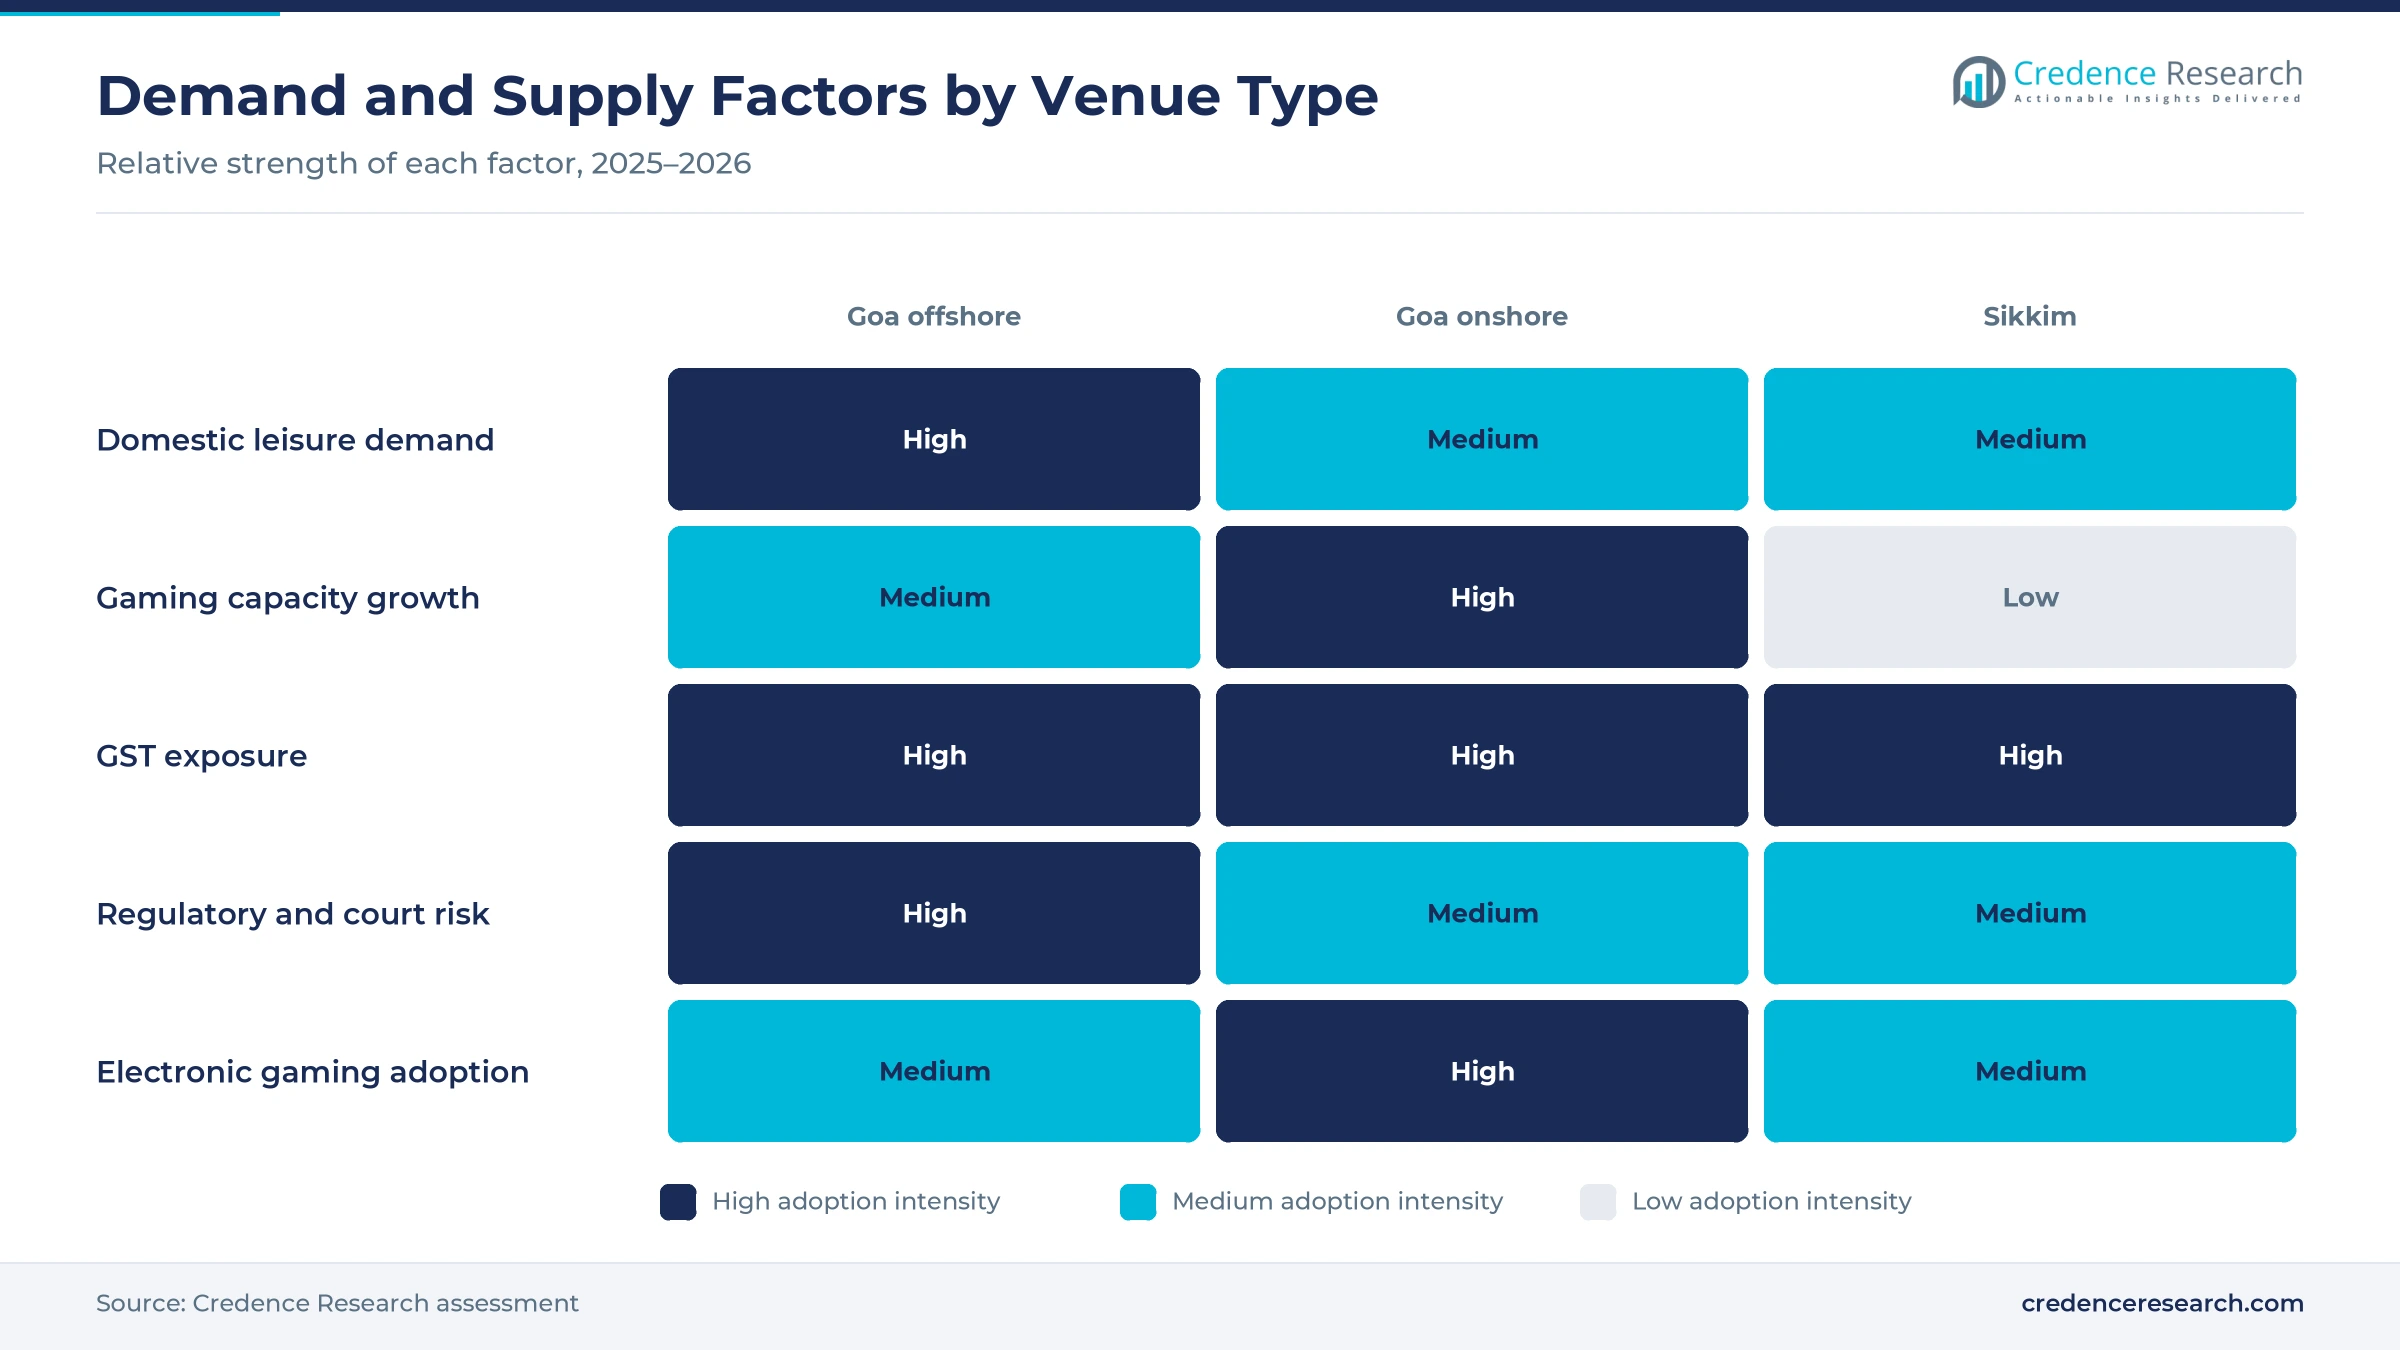
Based on casino type, the market is categorized into offshore casinos and onshore casinos. Offshore led with 80.6% of 2025 value, because the six Mandovi vessels hold the largest live gaming floors in the country. Onshore casinos grow faster at 4.62% a year, because the offshore fleet is capped at six and the March 2026 state budget bars new offshore casinos, so added capacity must come from hotel casinos such as Delta Corp's planned Panaji property.
Which games generate most of the house win?
Based on game type, the market is categorized into table games, slots and electronic gaming machines, and others such as tournament poker. Table Games led with 78.0% of 2025 value, because roulette, blackjack, baccarat, teen patti, andar bahar and poker fill most vessel decks. Slots and Electronic Gaming Machines grow fastest at 5.16% a year, as onshore hotel casinos rely on electronic formats that need fewer dealers under a higher tax burden.
How large is the international visitor segment?
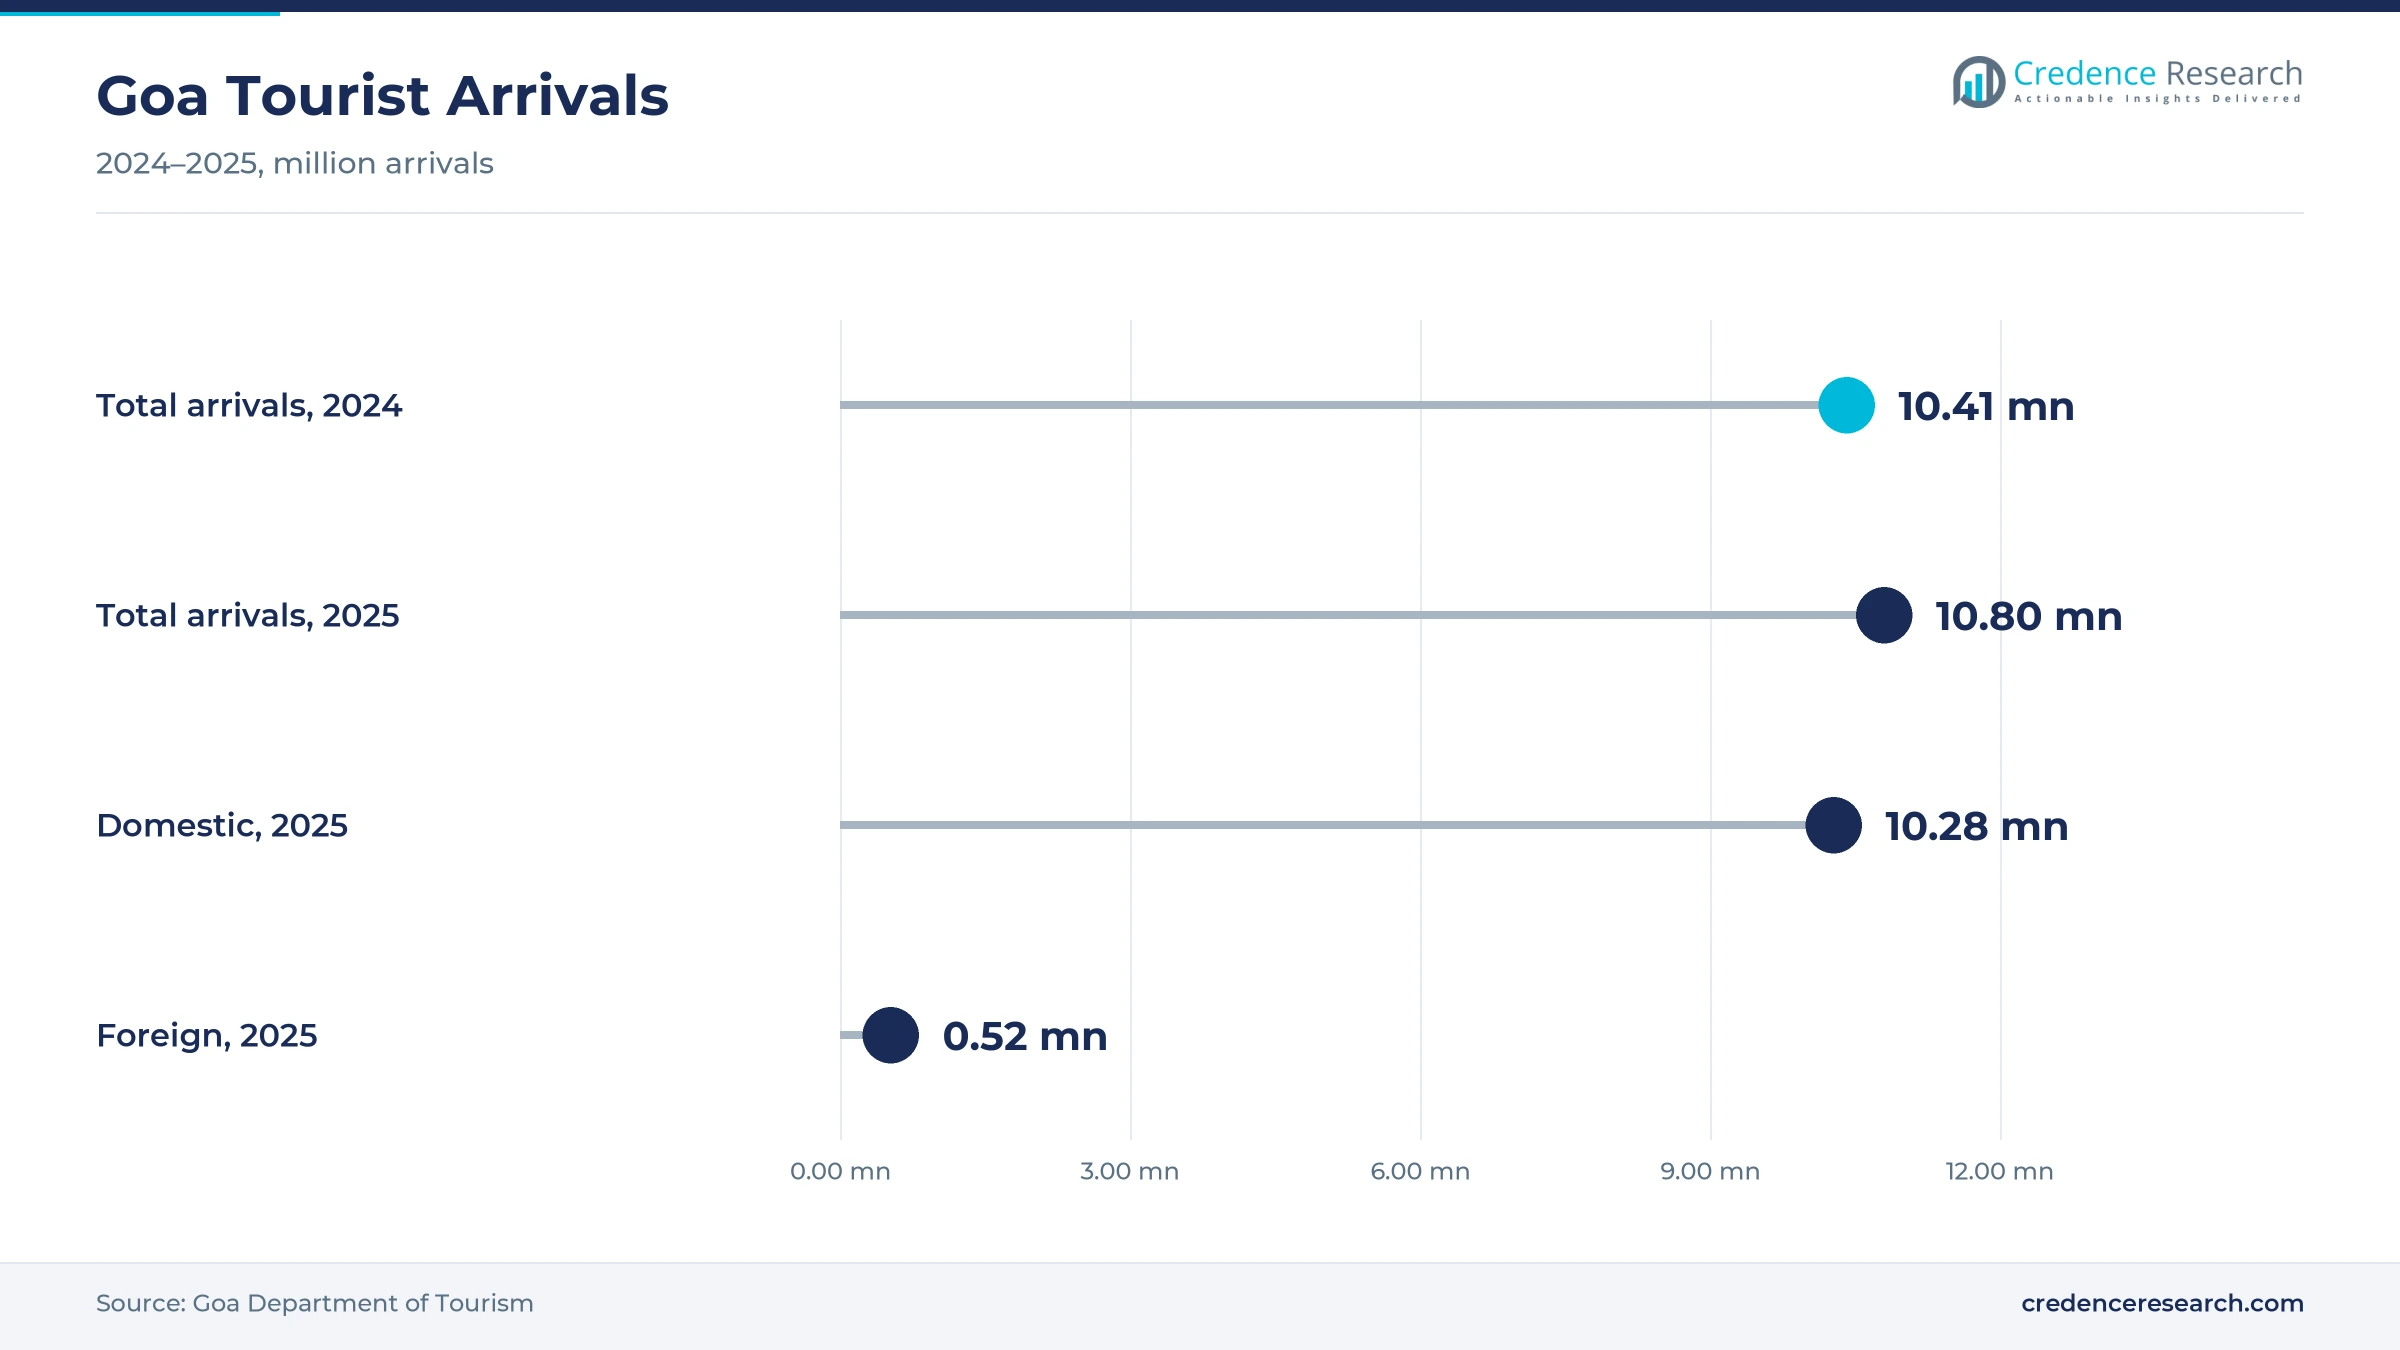
Based on visitor type, the market is categorized into domestic visitors and international visitors. Domestic led with 95.6% of 2025 value, since 95.2% of Goa's 10.80 million tourist arrivals in 2025 were domestic. International grow fastest at 5.13% a year from a small base, helped by rising foreign arrivals and by event groups that bring overseas players to Goa.
| Segment Group | Leading Sub-segment | Share, 2025 | Fastest-growing Sub-segment | CAGR, 2026–2035 |
|---|---|---|---|---|
| By Casino Type | Offshore | 80.6% | Onshore | 4.62% |
| By Game Type | Table Games | 78.0% | Slots and Electronic Gaming Machines | 5.16% |
| By Visitor Type | Domestic | 95.6% | International | 5.13% |
Request a Free Sample
Fill in your details and we'll send you a free sample report.
- Sample data tables & charts
- Research methodology
Domestic leisure trips and bigger vessels lift demand
Why do domestic leisure trips drive casino demand?
Domestic leisure travel is the main demand engine, because Indian visitors make up nearly all casino guests in Goa and Sikkim. Goa recorded 10.80 million tourist arrivals in 2025, up from 10.41 million in 2024, according to the state Department of Tourism. As a result, weekend and festival trips from Mumbai, Pune, Bengaluru and Delhi fill the Panaji vessels. Operators price entry packages from about INR 2,000 to INR 4,400 to capture these short stays, which keeps demand broad across income groups.
How do rising incomes widen the paying audience?
Rising household incomes widen the pool of visitors who can afford a premium night out, which supports play per visit. India's GDP per capita reached about US$2,702 in 2025, according to World Bank data, compared with about US$2,240 in 2021. In turn, more salaried travelers from tier 2 and tier 3 cities now treat a casino evening as part of a Goa holiday, which steadies demand outside the December peak and supports growth through 2035.
Will larger vessels add gaming capacity?
Vessel capacity still matters for demand, even though Goa caps offshore licenses at six. Delta Corp says its proposed vessel would carry about 2,000 gaming positions and more than 250 live tables, nearly doubling its gaming capacity, according to its 2025-26 annual report. However, the vessel still needs a survey certificate and court approval, and the Mandovi fleet may have to move by March 2027, so this report phases its revenue in slowly. Offshore casinos held 80.6% of 2025 value, so vessel decisions still move national demand as growth shifts onshore.
Why do integrated hotel casinos lengthen gaming sessions?
Integrated hotel and casino properties lengthen gaming sessions, because guests who sleep on site return to the tables over several nights. Delta Corp is building a hotel of about 375 rooms with a casino in Panaji, which it expects to open in the first quarter of fiscal 2027-28. This reflects a wider move toward luxury hotels that bundle rooms, events and gaming under one roof. Onshore casinos held a small share of 2025 demand, but new hotel casino openings make them the faster-growing casino type through 2035.
Tax resets and relocation shift the operating model
Why is the tax base shifting from bets to chips?
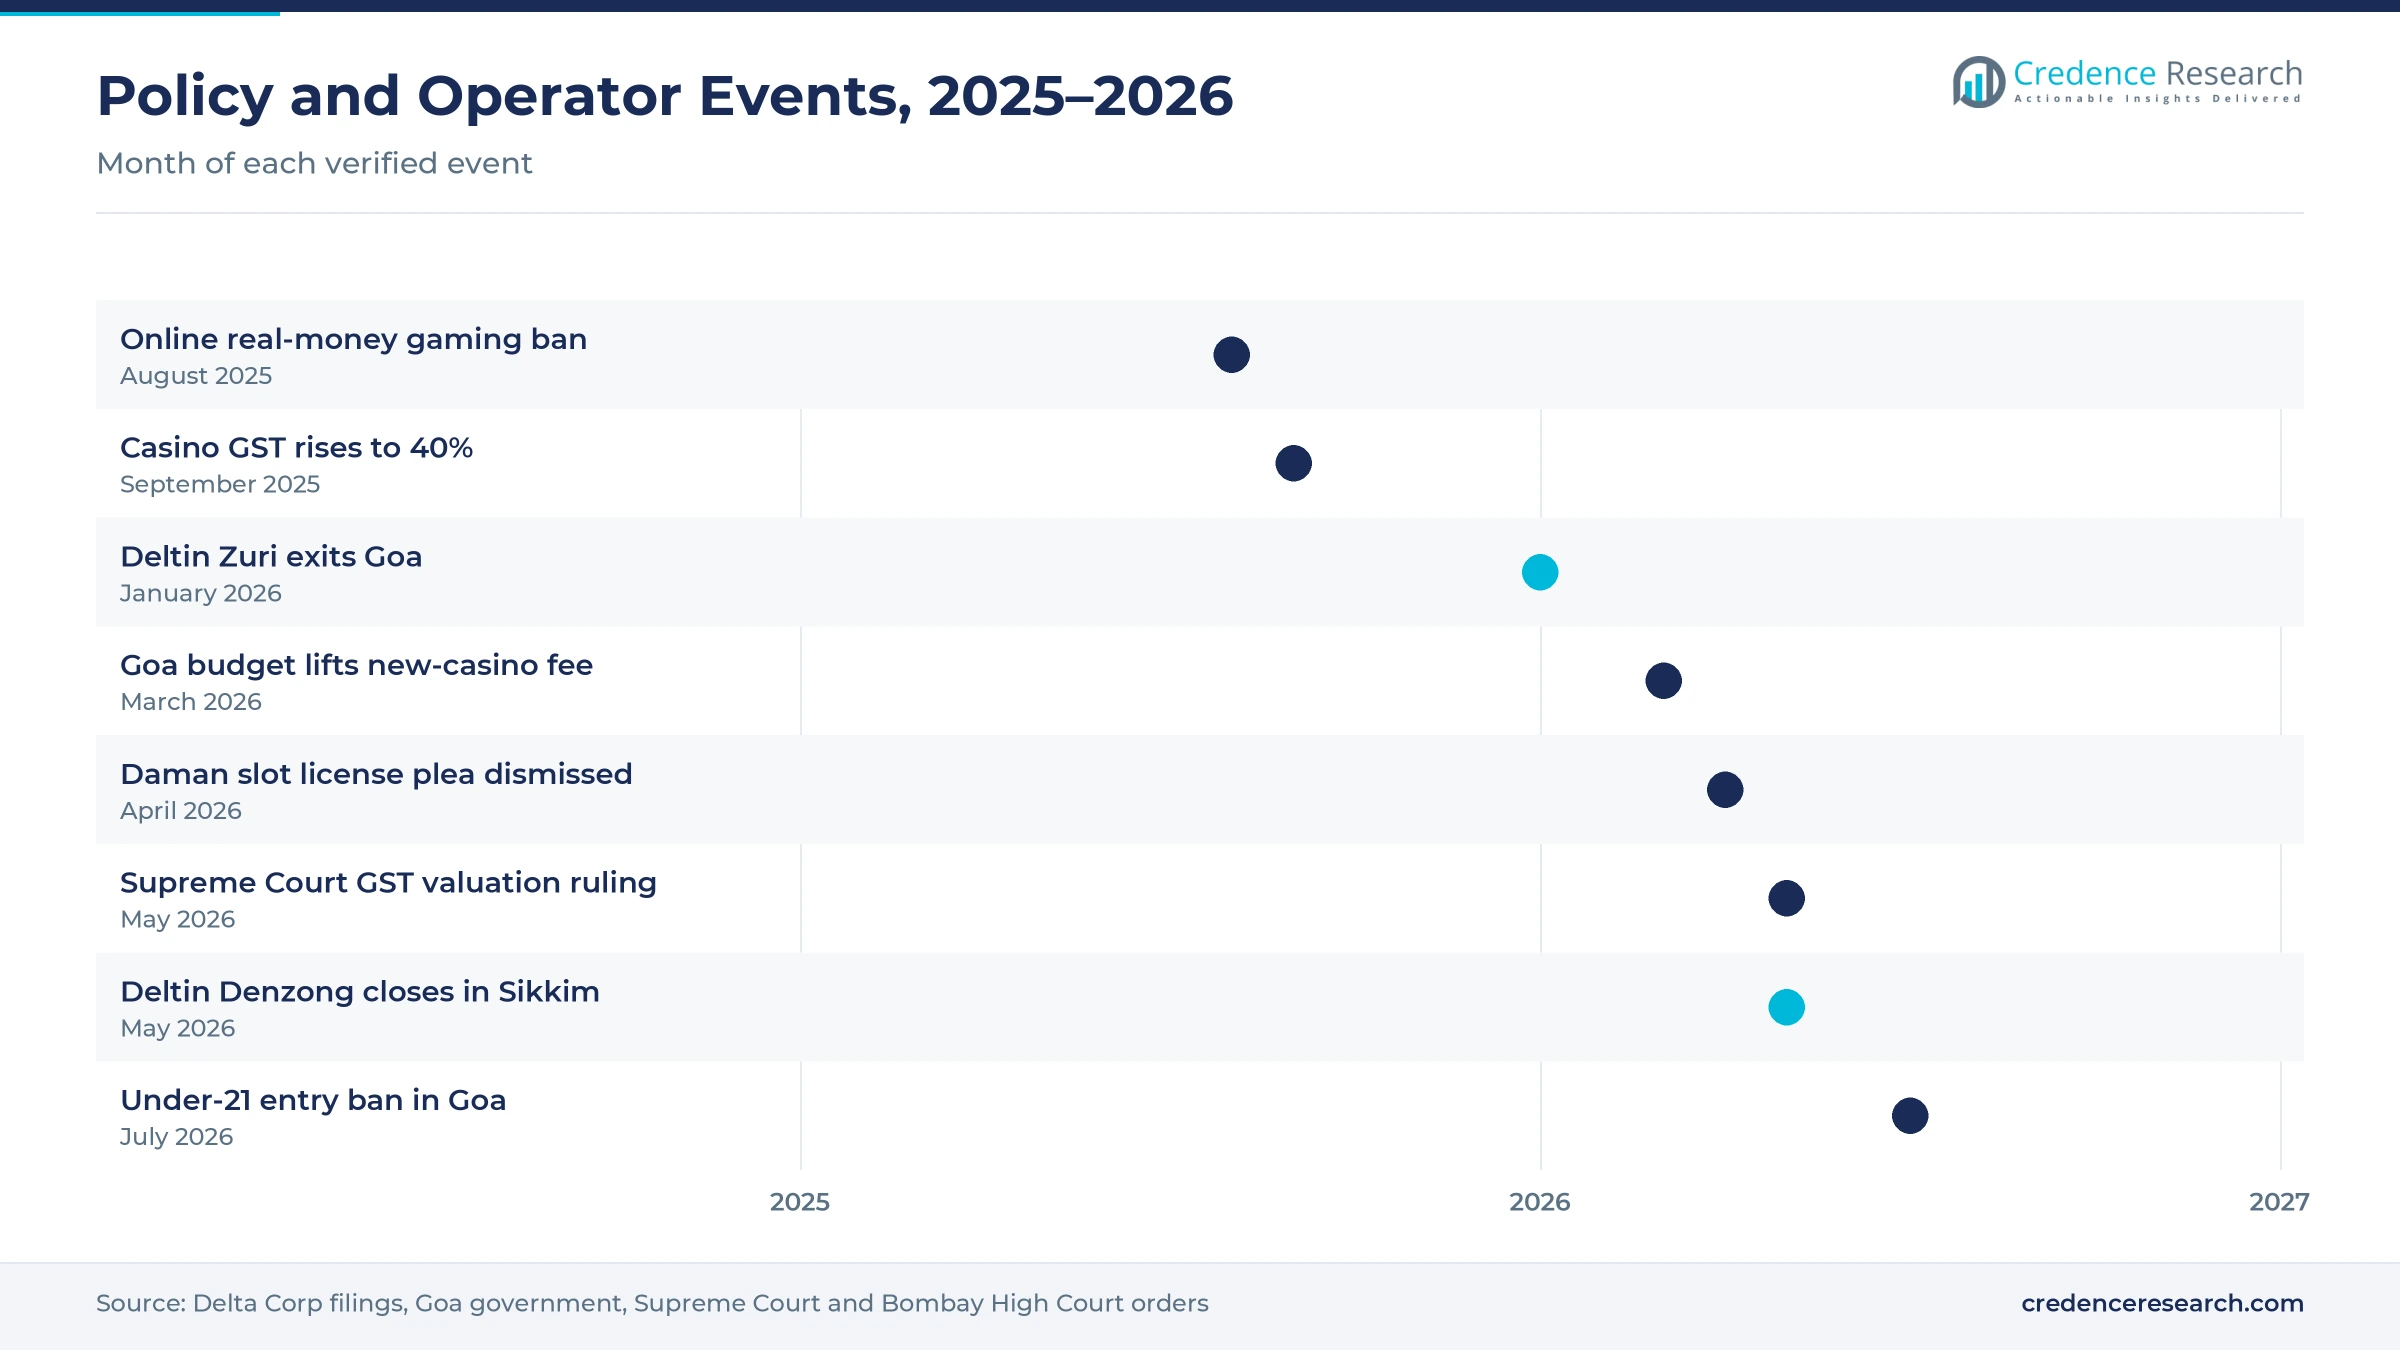
The tax base has shifted from the face value of every bet to the value of chips sold, which changes operator economics. The Supreme Court ruled on 27 May 2026 that this chip-based valuation also applies to July 2017 to September 2023, according to Delta Corp's stock exchange filings. As a result, the industry avoided demands calculated on gross bets, but it still pays GST at 40% on chips, and Delta Corp booked a provision for past periods in the June 2026 quarter.
How is the shift toward fewer, larger venues playing out?
Operators are shifting capacity toward fewer and larger venues, because the higher tax rate makes small gaming floors unprofitable. Delta Corp exited Deltin Zuri in Goa in January 2026 and closed Deltin Denzong in Sikkim in May 2026, citing commercial viability under the revised tax framework. In turn, gaming revenue concentrated on the Mandovi vessels during 2026, although planned hotel casinos are expected to rebuild the onshore base after 2027 because new offshore licenses are barred.
Can app-based loyalty programs open a new sales channel?
Digital loyalty tools offer an opening, because most casino guests book entry online and many return several times a year. Delta Corp launched DeltinOne, a mobile app that combines travel bookings, lifestyle privileges and personal dashboards, as described in its 2025-26 annual report. This lets operators reward repeat visits and fill weekday tables directly, without offering the online gambling and betting that the 2025 national law prohibits.
Is there room to grow international visitors and events?
International visitors and corporate events are a second opening, because they play at higher stakes and fill midweek nights. Goa received 517,802 foreign tourist arrivals in 2025, a small base that operators rarely target with dedicated products today. Therefore, offers tied to conferences, weddings and charter flights could lift the international share, which this report expects to grow faster than domestic play through 2035 as air links to Goa improve.
Higher GST and capped licenses squeeze operators
How much does the higher GST rate cost operators?
The higher GST rate is the largest constraint, because it applies to the full value of chips and entry fees rather than to the house win. Delta Corp reported lower casino gaming revenue in fiscal 2025-26 and attributed the decline mainly to the higher rate, which applied for most of that year. As a result, smaller operators face pressure on pricing and staffing, and the industry continues to lobby for tax on gross gaming revenue instead of chips.
Will relocation of the Mandovi vessels disrupt supply?
Relocation risk hangs over the offshore segment, because the Goa cabinet granted in December 2024 what it called the final extension for vessels to stay in the Mandovi until March 2027. No alternative site has been finalized, and earlier proposals in the Zuari and Chapora rivers were dropped after public objections. Therefore, any forced move could interrupt operations for weeks and raise mooring and transfer costs for operators and guests.
Why do court cases and permits slow new capacity?
Court cases and permits slow every capacity addition, because public interest petitions and port rules govern each vessel. In May 2026, the Bombay High Court at Goa barred Delta's new vessel from entering Panaji port without a survey certificate and the court's prior approval. In turn, King Casino stayed shut during July to September 2026 while its replacement vessel awaited clearances, which removed capacity during the tax-driven slowdown.
How do entry rules and fees limit the visitor pool?
Entry rules and license fees also limit the visitor pool and the number of venues that can open. Goa barred people under 21 from casino gaming areas and added an 18% penalty on late license fees, according to All India Radio in July 2026. Meanwhile, the 2026-27 state budget proposed a 200% higher fee for new land-based casinos and kept the offshore fleet at six, which discourages new entrants and keeps supply concentrated.
Goa holds nearly all gaming revenue while Sikkim shrinks
| State | Value, 2025 (USD million) | Share, 2025 | CAGR, 2026–2035 |
|---|---|---|---|
| Goa | 162.0 | 96.2% | 4.00% |
| Sikkim | 6.4 | 3.8% | 2.45% |
Why does Goa account for nearly all gaming revenue?
Goa held 96.2% of 2025 value and grows at 4.00% a year, because it hosts six offshore vessels on the Mandovi and 17 onshore casino licenses, according to state data tabled in March 2026. Panaji's vessels draw weekend crowds from western and southern India, while hotel casinos in North and South Goa serve resort guests. This concentration also means that tax changes and relocation decisions in Goa move the whole national figure.
Where does Sikkim fit after the Denzong closure?
Sikkim held 3.8% of 2025 value and grows at 2.45% a year, because only a few hotel casinos in Gangtok operate under the Sikkim Casino Games (Control and Tax) Act, 2002. Mayfair Spa Resort and Casino in Gangtok remains the best-known venue after Delta Corp closed Deltin Denzong in May 2026. Therefore, Sikkim depends on summer and autumn tourist seasons and on travelers from West Bengal and the Northeast.
Does Daman have an operating casino?
Daman has no operating casino, even though the Goa, Daman and Diu Public Gambling Act, 1976, allows licenses for slot machines in five-star hotels. The Bombay High Court dismissed Delta Corp's petition for such a license at The Deltin hotel in Daman on 29 April 2026, and the company has appealed to the Supreme Court. As a result, this report assigns no value to Daman and treats the property as a hotel only.
Could other states open licensed casinos?
Other states remain closed to casinos, because public gambling laws prohibit them and recent experiments were reversed. Meghalaya repealed its 2021 gaming law through the Meghalaya Regulation of Gaming (Repeal) Act, 2023, and Nagaland's 2016 law prohibits gambling while licensing online games of skill. This keeps many high-value Indian players traveling to Asia Pacific gaming destinations such as Sri Lanka, Nepal and Singapore.
Court rulings and closures reshaped 2025 and 2026
| Development | Status and market relevance |
|---|---|
| In September 2025, a 40% GST rate on chips and entry fees took effect on 22 September, replacing the 28% rate introduced in October 2023. | Cut operator margins and led to the closure of smaller casinos in Goa and Sikkim |
| In January 2026, Delta Corp announced that a new casino vessel was in advanced stages of completion for induction into the Mandovi River. | Pending survey certification and court approval; about 2,000 gaming positions planned |
| In May 2026, the Supreme Court ruled that GST on casinos is valued on chips sold, applying the basis used since October 2023 to earlier periods. | Removed demands based on gross bet value; Delta Corp announced the outcome on 28 May 2026 |
| In May 2026, Delta Corp closed Deltin Denzong in Gangtok, after exiting Deltin Zuri in Goa in January 2026. | Leaves Goa vessels and one Goa hotel casino as the operating base of the largest operator |
| In July 2026, Goa barred people under 21 from casino gaming areas and introduced an 18% penalty on late license fees. | Narrows the eligible visitor pool and tightens fee discipline for all license holders |
Larger vessels, apps and electronic tables ahead
- Larger vessels with escalators, open decks and about 2,000 positions are designed to move more guests per evening and cut queues at the Panaji jetties.
- Electronic table games let onshore hotel casinos offer roulette and baccarat formats under licenses that cover electronic amusement and slot machines.
- Gaming management systems such as floor management software track chip sales, table play and tax at the point of entry, which matters now that GST is charged on chips sold.
- Mobile loyalty apps such as DeltinOne combine bookings, offers and personal dashboards, which helps operators target repeat domestic visitors.
Need a Custom Version of This Report?
Tailor the scope, geography, or segments to your exact requirements.
- Custom geography or segment scope
- Direct access to our analyst team
Delta Corp leads a field of family-run operators
Competition is concentrated, because Goa caps offshore licenses at six and Delta Corp holds three of them plus one land-based casino. Credence Research estimates that Delta Corp, through its Deltin brand, earns about 45% of Indian offline casino gaming revenue from more than 1,500 gaming positions. The other three vessels are run by Pride Group with Casino Pride, Majestic Group with Majestic Pride and the operator of Big Daddy Casino, which opened in 2019 with 110 tables. Onshore, Majestic Paradise and independent hotel casinos such as Chances Resort and Casino compete on price and convenience for resort guests. In Sikkim, Mayfair Spa Resort and Casino anchors the Gangtok market. Rivals compete on entry price, play credit, live entertainment and VIP rooms, while tax compliance and court approvals increasingly decide who can add capacity.
Companies profiled and their roles in this market
| Company | Type | Role in the market |
|---|---|---|
| Delta Corp Ltd (Deltin) | Listed operator | Runs Deltin Royale, Deltin JAQK and King Casino on the Mandovi and the Deltin Suites casino, and is building a larger vessel and a Panaji hotel casino |
| Pride Group | Private operator | Owns and operates Casino Pride, an offshore vessel on the Mandovi River |
| Majestic Group | Private operator | Runs the Majestic Pride vessel and the Majestic Paradise casino at the Neo Majestic hotel, Porvorim |
| Big Daddy Casino | Private operator | Three-deck offshore vessel moored at Panaji, operated by Golden Globe Hotels Pvt Ltd |
| Chances Resort and Casino | Hotel casino | Runs a land-based casino inside its five-star boutique resort in Vainguinim Valley, Goa |
| Mayfair Hotels and Resorts | Hotel group | Operates Mayfair Spa Resort and Casino in Gangtok, Sikkim |
Credence Research view on capacity versus tax
Credence Research's view is that India's casino gaming revenue will hold steady through the 2026 tax shock, but growth will track capacity rather than tourist numbers. Goa already caps offshore licenses at six, so the large new vessel and the Panaji hotel casino matter more than any rise in arrivals. If the vessel clears court and port approvals in 2027, offshore floors could lift revenue faster than this base case. However, a forced relocation from the Mandovi or a further tax change would delay recovery, which is why the forecast stays well below nominal income growth.
How the gaming revenue estimate was built
The report uses 2025 as the base year on a calendar basis, with gross gaming revenue converted at INR 87.16 per U.S. dollar, the 2025 average of monthly rates in the Reserve Bank of India handbook. Market values come from the Credence Research model, which divides the largest operator's reported casino revenue by its estimated 45% share of Indian offline gaming revenue, within a tested range of 30% to 55%. Goa license fee collections and operator table counts serve as cross-checks on that share. Segment and state splits are Credence Research estimates built from these inputs. Sources used are company filings, state assembly data, tourism statistics, court orders, state laws and operator websites, and no interviews or surveys were used.
Slow recovery to 2035 depends on vessels and tax
Gaming revenue is expected to reach USD 238.4 million by 2035, a 3.94% CAGR during 2026–2035, as the market recovers slowly from the higher tax rate. Growth should stay modest in 2027 and 2028 while the industry absorbs GST at the chip level and settles the Mandovi relocation question. After that, annual gains should settle in the mid-single digits from 2030 as larger vessels and hotel casinos operate and domestic travel keeps rising. A move to tax gross gaming revenue instead of chips would lift this outlook, while relocation delays would lower it.
Frequently Asked Questions
How big is the India casino tourism market?
What does the India casino tourism market measure?
Which state leads casino gaming revenue in India?
Does Daman have a casino?
How did GST changes affect casino revenue?
Which casino type dominates the market?
Who are the main casino operators in India?
What could change the forecast?
Table of Content
Chapter 1 Market Segmentation
- 1.1 Segmentation Framework
- 1.1.1 Product and Service Classification
- 1.1.2 Application and End-Use Classification
- 1.1.3 Technology and Solution Classification
- 1.1.4 Customer and Distribution Channel Classification
- 1.1.5 Geographic Segmentation
- 1.1.6 Market Segment Definitions and Boundaries
- 1.2 By Casino Type
- 1.2.1 Offshore
- 1.2.2 Onshore
- 1.3 By Game Type
- 1.3.1 Table Games
- 1.3.2 Slots and Electronic Gaming Machines
- 1.3.3 Others
- 1.4 By Visitor Type
- 1.4.1 Domestic
- 1.4.2 International
- 1.5 By State
- 1.5.1 Goa
- 1.5.2 Sikkim
Chapter 2 Introduction
- 2.1 Report Objectives and Scope
- 2.2 Product Definition and Industry Terminology
- 2.3 Market Inclusions and Exclusions
- 2.4 Research Process
- 2.4.1 Primary Research and Expert Interviews
- 2.4.2 Secondary Research and Source Review
- 2.4.3 Top-Down and Bottom-Up Estimation
- 2.4.4 Data Triangulation and Verification
- 2.5 Market Size Measurement Basis
- 2.5.1 2025: USD 168.4 million → 2035: USD 238.4 million
- 2.6 Historical and Forecast Reference Periods
- 2.6.1 Historical Period: 2018-2025
- 2.6.2 Base Year: 2025
- 2.6.3 Forecast Period: 2025-2035
- 2.7 Research Assumptions and Limitations
Chapter 3 Executive Summary
- 3.1 Market Snapshot and Key Findings
- 3.2 Base-Year Market Size, 2025
- 3.3 Forecast Market Size, 2035
- 3.4 Revenue and Volume Growth Outlook
- 3.5 Key Demand and Supply Indicators
- 3.6 Leading Market Segments
- 3.7 Fastest-Growing Market Opportunities
- 3.8 Regional Performance Highlights
- 3.9 Technology and Industry Transformation
- 3.10 Competitive Landscape Summary
- 3.11 Analyst View and Strategic Implications
Chapter 4 India Casino Tourism Market Trends and Developments
- 4.1 Historical Industry Development, 2018-2025
- 4.2 Recent Market Trends and Developments
- 4.3 Demand and Customer Behavior Trends
- 4.4 Technology and Product Innovation
- 4.5 Artificial Intelligence, Automation and Digitalization
- 4.6 Local Manufacturing and Supply Chain Realignment
- 4.7 Industry Partnerships, Mergers and Acquisitions
- 4.8 Sustainability and Circular Economy Developments
- 4.9 Government and Private Sector Investment Trends
- 4.10 Emerging Business Models and Commercialization
- 4.11 Industry Developments and Announcements
Chapter 5 India Casino Tourism Market Supply and Demand Analysis
- 5.1 Demand Trend and Consumption Analysis, 2018-2025
- 5.2 Demand Forecast, 2025-2035
- 5.3 Supply Chain Structure and Procurement Trends
- 5.4 Supply-Demand Gap and Bottlenecks
- 5.5 Import Dependence and Sourcing Structure
- 5.6 Regional Supply and Demand Concentration
Chapter 6 India Casino Tourism Market Pricing Analysis
- 6.1 Pricing Structure and Measurement
- 6.2 Historical Pricing Trends, 2018-2025
- 6.3 Pricing Outlook, 2025-2035
- 6.4 Pricing by Product and Market Segment
- 6.5 Geographic Pricing Differences
- 6.6 Key Input, Energy, Labor and Logistics Costs
- 6.7 Contract Pricing and Purchasing Models
- 6.8 Pricing Sensitivity and Competitive Positioning
- 6.9 Price, Margin and Profitability Implications
Chapter 7 India Casino Tourism Market Dynamics
- 7.1 Market Growth Drivers
- 7.1.1 Demand-Side Drivers
- 7.1.2 Technology and Innovation Drivers
- 7.1.3 Infrastructure and Investment Drivers
- 7.1.4 Regulatory and Policy Drivers
- 7.2 Market Restraints
- 7.2.1 Cost and Affordability Constraints
- 7.2.2 Technology and Adoption Barriers
- 7.2.3 Supply Chain and Operational Constraints
- 7.3 Market Challenges
- 7.3.1 Competitive Pressure and Margin Erosion
- 7.3.2 Skills, Infrastructure and Implementation Gaps
- 7.4 Emerging Market Opportunities
- 7.5 Market Dynamics Impact and Time-Horizon Assessment
Chapter 8 India Casino Tourism Value Chain Analysis
- 8.1 Industry Value Chain Overview
- 8.2 Upstream Suppliers and Critical Inputs
- 8.3 Technology and Component Providers
- 8.4 Manufacturing or Service Delivery
- 8.5 Distribution, Channel Partners and Integrators
- 8.6 Downstream Applications and End Users
- 8.7 Value Addition and Profit Pools
- 8.8 Vertical Integration and Outsourcing
- 8.9 Supplier Concentration and Risk
- 8.10 Supply Chain Localization and Resilience
Chapter 9 India Casino Tourism Market Regulations and Policies
- 9.1 Relevant Laws, Standards and Compliance Frameworks
- 9.2 Product, Service, Safety and Quality Requirements
- 9.3 Government Policies, Incentives and Subsidies
- 9.4 Imports, Exports and Trade Barriers
- 9.5 Public Procurement and Local Content Requirements
- 9.6 Data Protection, AI and Cybersecurity Compliance
- 9.7 Upcoming Policy Changes and Market Implications
Chapter 10 India Casino Tourism Market Hotspots and Opportunities
- 10.1 Market Opportunity Mapping and Growth Hotspots
- 10.2 High-Growth Applications and Customer Groups
- 10.3 Underserved Markets and White-Space Opportunities
- 10.4 Emerging Technology and Product Opportunities
- 10.5 New Capacity and Investment Hotspots
- 10.6 Market Entry and Expansion Opportunities
- 10.7 Distribution and Partnership Opportunities
- 10.8 Near-Term and Long-Term Commercial Potential
- 10.9 Opportunity Attractiveness and Execution Risks
Chapter 11 India Casino Tourism Market Outlook, 2025-2035
- 11.1 Market Size and Analysis
- 11.1.1 Revenue (Market Measurement: 2025: USD 168.4 million → 2035: USD 238.4 million)
- 11.1.2 Historical Market Size, 2018-2025
- 11.1.3 Base-Year Market Size, 2025
- 11.2 Market Forecast, 2025-2035
- 11.2.1 Revenue Forecast to 2035
- 11.2.2 CAGR and Year-on-Year Growth
- 11.2.3 Incremental Revenue Opportunity
- 11.3 Forecast Assumptions and Scenario Analysis
- 11.3.1 Base-Case Forecast
- 11.3.2 Optimistic and Conservative Scenarios
- 11.3.3 Technology, Pricing and Policy Sensitivities
- 11.4 Market Attractiveness and Growth Outlook
Chapter 12 India Casino Tourism Market Segmentation and Outlook
- 12.1 Segmentation Summary and Market Shares, 2025
- 12.2 Largest and Fastest-Growing Segments
- 12.3 By Casino Type - Market Size and Forecast, 2025-2035
- 12.3.1 Segment Definition and Scope
- 12.3.2 Historical Market Size, 2018-2025
- 12.3.3 Revenue Forecast, 2025-2035
- 12.3.4 Base-Year Market Share, 2025
- 12.3.5 Segment CAGR and Growth Drivers
- 12.3.6 Subsegment Market Size and Forecast
- 12.3.6.1 Offshore
- 12.3.6.2 Onshore
- 12.3.7 Subsegment Pricing and Adoption Trends
- 12.3.8 Leading Suppliers and Competition
- 12.3.9 Regional Demand and Opportunities
- 12.4 By Game Type - Market Size and Forecast, 2025-2035
- 12.4.1 Segment Definition and Scope
- 12.4.2 Historical Market Size, 2018-2025
- 12.4.3 Revenue Forecast, 2025-2035
- 12.4.4 Base-Year Market Share, 2025
- 12.4.5 Segment CAGR and Growth Drivers
- 12.4.6 Subsegment Market Size and Forecast
- 12.4.6.1 Table Games
- 12.4.6.2 Slots and Electronic Gaming Machines
- 12.4.6.3 Others
- 12.4.7 Subsegment Pricing and Adoption Trends
- 12.4.8 Leading Suppliers and Competition
- 12.4.9 Regional Demand and Opportunities
- 12.5 By Visitor Type - Market Size and Forecast, 2025-2035
- 12.5.1 Segment Definition and Scope
- 12.5.2 Historical Market Size, 2018-2025
- 12.5.3 Revenue Forecast, 2025-2035
- 12.5.4 Base-Year Market Share, 2025
- 12.5.5 Segment CAGR and Growth Drivers
- 12.5.6 Subsegment Market Size and Forecast
- 12.5.6.1 Domestic
- 12.5.6.2 International
- 12.5.7 Subsegment Pricing and Adoption Trends
- 12.5.8 Leading Suppliers and Competition
- 12.5.9 Regional Demand and Opportunities
- 12.6 By State - Market Size and Forecast, 2025-2035
- 12.6.1 Segment Definition and Scope
- 12.6.2 Historical Market Size, 2018-2025
- 12.6.3 Revenue Forecast, 2025-2035
- 12.6.4 Base-Year Market Share, 2025
- 12.6.5 Segment CAGR and Growth Drivers
- 12.6.6 Subsegment Market Size and Forecast
- 12.6.6.1 Goa
- 12.6.6.2 Sikkim
- 12.6.7 Subsegment Pricing and Adoption Trends
- 12.6.8 Leading Suppliers and Competition
- 12.6.9 Regional Demand and Opportunities
- 12.7 Segment Growth Comparison
- 12.8 Segment Attractiveness and Priority Matrix
Chapter 13 India Casino Tourism Geographic Market Outlook, 2025-2035
- 13.1 Domestic Market Distribution and Demand Clusters
- 13.2 State- or Province-Wise Market Size and Forecast, 2025-2035
- 13.3 City and Metropolitan Market Outlook
- 13.4 Industrial, Manufacturing and Commercial Clusters
- 13.5 Geographic Concentration of Key End Users
- 13.6 Local Pricing and Purchasing Differences
- 13.7 Domestic Production Facilities and Capacity Map
- 13.8 Local Infrastructure and Project Pipeline
- 13.9 State-Level Policy and Incentive Differences
- 13.10 Subnational Investment Hotspots and Opportunities
- 13.11 Distribution and Logistics Networks
- 13.12 Domestic Competitive Footprint
Chapter 14 India Casino Tourism Technology, Innovation and Sustainability Outlook
- 14.1 Technology Landscape and Maturity
- 14.2 Product, Process and Service Innovation
- 14.3 AI, Automation and Digital Tools in the Industry
- 14.4 Technology Adoption and Performance Benchmarking
- 14.5 Innovation Pipeline and R&D Investment
- 14.6 Energy Efficiency and Resource Management
- 14.7 Sustainability, Recycling and Circularity
- 14.8 Technology Roadmap, 2025-2035
- 14.9 Risks of Obsolescence and Technology Substitution
Chapter 15 India Casino Tourism Market Key Strategic Imperatives
- 15.1 Growth and Market Entry Priorities
- 15.2 High-Return Products and Segments
- 15.3 Pricing, Profitability and Cost Optimization
- 15.4 Technology Investment and Product Differentiation
- 15.5 Supply Chain Localization and Resilience
- 15.6 Distribution and Customer Acquisition
- 15.7 Partnership, Acquisition and Capacity Strategy
- 15.8 Regional Expansion Priorities
- 15.9 Short-, Medium- and Long-Term Actions
Chapter 16 Competition Outlook
- 16.1 Industry Competition Characteristics
- 16.2 Market Structure and Concentration
- 16.3 Market Share and Competitive Positioning, 2025
- 16.4 Company-Wise Revenue and Product Benchmarking
- 16.5 Production and Service Capacity Benchmarking
- 16.6 Technology, Pricing and Differentiation
- 16.7 Regional Footprint and Distribution Strength
- 16.8 Mergers, Acquisitions and Strategic Alliances
- 16.9 New Entrants and Competitive Threats
- 16.10 Porter's Five Forces and Industry Attractiveness
- 16.11 Competitive Outlook, 2025-2035
Chapter 17 Company Profiles
- 17.1 Company Coverage and Selection Criteria
- 17.2 Delta Corp Ltd (Deltin)
- 17.2.1 Business Description
- 17.2.2 Company Ownership and Geographic Presence
- 17.2.3 Product and Service Portfolio
- 17.2.4 Manufacturing and Operating Footprint
- 17.2.5 Financial Performance and Investment
- 17.2.6 Market Share and Competitive Position
- 17.2.7 Technology and Innovation Capabilities
- 17.2.8 Strategic Alliances or Partnerships
- 17.2.9 Recent Developments
- 17.2.10 Growth Strategy and Outlook
- 17.3 Pride Group (Casino Pride)
- 17.4 Majestic Group (Majestic Pride, Majestic Paradise)
- 17.5 Big Daddy Casino (Golden Globe Hotels Pvt Ltd)
- 17.6 Chances Resort and Casino
- 17.7 Mayfair Hotels and Resorts
- 17.8 Other Relevant Market Participants
Note: Every listed company is profiled on the structure shown under the first company. The company list is preliminary and may change based on research findings, market developments, data availability and client requirements.
Chapter 18 Disclaimer
- 18.1 Research and Forecast Disclaimer
- 18.2 Data Source and Estimation Limitations
Note: The depth of individual sections depends on data availability for this market. Volume, capacity, trade and other unit-based metrics are included where applicable.

