Market Overview
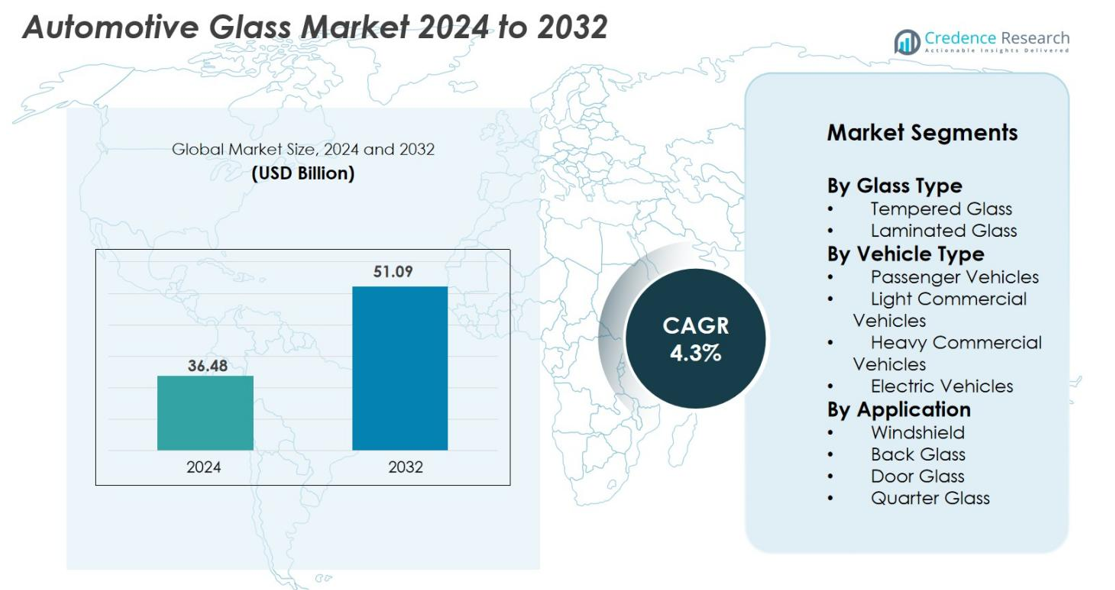
The Automotive Glass Market size was valued at USD 36.48 Billion in 2024 and is anticipated to reach USD 51.09 Billion by 2032, at a CAGR of 4.3% during the forecast period.
| REPORT ATTRIBUTE |
DETAILS |
| Historical Period |
2020-2023 |
| Base Year |
2024 |
| Forecast Period |
2025-2032 |
| Automotive Glass Market Size 2024 |
USD 36.48 Billion |
| Automotive Glass Market, CAGR |
4.3% |
| Automotive Glass Market Size 2032 |
USD 51.09 Billion |
The Automotive Glass Market is driven by major players such as AGC Inc., Saint-Gobain Sekurit, Fuyao Glass Industry Group, Nippon Sheet Glass Co. Ltd., Xinyi Glass Holdings Limited, Pilkington (NSG Group), Asahi Glass Company, Guardian Industries, Vitro Automotive, and Shatterpruuf, all of which focus on advanced laminated, tempered, and smart glazing solutions. These companies strengthen their positions through OEM partnerships, technological innovation, and expanded production capacity. Asia-Pacific leads the market with over 38% share, supported by high automotive production and rapid EV adoption. North America and Europe follow with strong demand for ADAS-enabled windshields, safety-enhanced glass, and panoramic sunroof applications.
Market Insights
- The Automotive Glass Market was valued at USD 36.48 Billion in 2024 and is projected to reach USD 51.09 Billion by 2032, expanding at a CAGR of 4.3%.
- Market growth is driven by rising vehicle production, increasing adoption of laminated safety glass, and rapid integration of ADAS-compatible windshields across passenger and commercial vehicles.
- Key trends include the surge in panoramic sunroofs, smart glass technologies, solar-control coatings, and larger glazing surfaces, especially in electric vehicles.
- Leading players such as AGC Inc., Saint-Gobain Sekurit, Fuyao Glass, NSG Group, and Xinyi Glass strengthen the landscape through OEM collaborations and expansion in high-growth markets.
- Asia-Pacific holds the largest regional share at over 38%, followed by North America at 28% and Europe at 25%, while tempered glass leads by type with 58% share and passenger vehicles dominate by vehicle type with 67% share.
Access crucial information at unmatched prices!
Request your sample report today & start making informed decisions powered by Credence Research Inc.!
Download Sample
Market Segmentation Analysis
By Glass Type
The Automotive Glass Market by glass type is primarily driven by safety regulations, rising vehicle ownership, and the demand for enhanced impact resistance. Tempered glass dominates the segment with 58% market share in 2024, supported by its cost-effectiveness, rapid manufacturing cycles, and high shatter-resistance, making it the preferred choice for side and rear windows. Laminated glass continues to gain traction as OEMs adopt advanced windshield technologies such as HUDs and acoustic interlayers. Increasing adoption of ADAS, sensor-integrated windshields, and premium vehicle production further accelerates laminated glass usage during the forecast period.
- For instance, AGC Glass Brazil’s complex in Guaratinguetá operates float glass furnaces with a combined output of 1,450 tons of flat glass per day, supplying an integrated automotive glass plant that cuts and tempers glazing for regional OEM programs
By Vehicle Type
In the Automotive Glass Market by vehicle type, growth is fueled by expanding automotive production, rising EV penetration, and increased usage of high-performance glazing materials. Passenger vehicles lead the segment with 67% market share, supported by their large global production volume and high adoption of advanced laminated windshields and panoramic sunroofs. Light commercial vehicles continue to expand due to rising e-commerce logistics demand, while heavy commercial vehicles depend on durability-focused glass. Electric vehicles present the fastest growth, driven by aerodynamic designs and larger glass surfaces integrated for energy efficiency and structural rigidity.
- For instance, BMW equips the iX with a panoramic electrochromic glass roof measuring 1,058 mm × 1,130 mm, manufactured using a polymer-dispersed liquid crystal structure.
By Application
The Automotive Glass Market by application is shaped by rising safety standards, demand for improved cabin comfort, and the integration of smart glass technologies. Windshields dominate the application segment with 45% market share, owing to mandatory laminated glass usage, ADAS sensor placement, and increasing adoption of UV-blocking and noise-reducing interlayers. Back glass and door glass exhibit steady growth driven by vehicle production, while quarter glass benefits from premium vehicle styling. Advancements in panoramic glazing, solar-control coatings, and lightweight glass solutions further enhance demand across all application categories.
Key Growth Drivers
Rising Vehicle Production and Increasing Demand for Safety-Enhanced Glass
The Automotive Glass Market benefits significantly from the steady rise in global vehicle production, supported by urbanization, growing middle-class income, and expanding automotive manufacturing facilities across Asia-Pacific, Europe, and North America. The increasing preference for safety-enhanced glass has further strengthened market adoption, particularly with stricter safety standards mandating laminated windshields and tempered side and rear windows. OEMs are actively integrating impact-resistant, UV-protective, and noise-reducing glass to improve occupant safety and driving comfort. Additionally, the surge in passenger vehicle sales including SUVs and crossovers has boosted demand for large panoramic windshields and rear glass components. Advanced glass coatings, better heat insulation, and improved visibility features are also driving OEM investments. As consumers prioritize vehicle safety and comfort, the demand for laminated and multi-layered glazing systems continues to rise, reinforcing this driver’s importance during the forecast period.
- For instance, Hyundai’s Ulsan manufacturing complex, the world’s largest single automobile plant, has an annual production capacity of approximately 1.4 million vehicles (down from a past peak of 1.5 million or more). The facility produces various models, including the Palisade, which features an available large sunroof made of tempered glass to enhance cabin light ingress
Growing Integration of ADAS, HUDs, and Smart Windshield Technologies
Automotive glass is becoming a functional component rather than merely a structural accessory, driven by the rapid adoption of ADAS, Heads-Up Displays (HUDs), and sensor-integrated smart windshields. High-end windshield designs are increasingly incorporating cameras, lidar sensors, rain sensors, lane detection modules, and augmented reality projection systems to support advanced driving assistance. This technological shift demands laminated glass with high optical clarity, thermal stability, and smooth surface quality for accurate sensor performance. The rise of premium vehicles and EVs has amplified demand for intelligent glazing, including electrochromic and solar-control glass. OEMs and suppliers are collaborating on next-generation windshield technologies that deliver better visibility, improved safety, and enhanced digital integration. With the shift toward autonomous and connected vehicles accelerating, the role of smart windshields as an integral interface for sensors and projected displays continues to strengthen this growth driver.
- For instance, AGC’s lidar-compatible glazing (known as WAVEATTO™) uses a specialized infrared-transmitting layer or glass composition enabling near-infrared wavelengths (such as those around 905 nanometers) to pass through with nearly 100% light transmission, a significant improvement over standard automotive glass.
Expansion of Electric Vehicles and Increasing Use of Lightweight Panoramic Glazing
The rapid global adoption of electric vehicles has created a strong demand for lightweight, aerodynamic, and energy-efficient automotive glass. EV manufacturers increasingly rely on panoramic windshields, full-glass roofs, and larger glazing surfaces to enhance cabin openness and reduce vehicle weight, directly contributing to improved battery efficiency. Lightweight laminated glass and advanced composite glazing deliver structural rigidity while supporting the sleek, aerodynamic designs favored in modern EVs. Additionally, solar-control and heat-reflective coatings help minimize cabin heat buildup, reducing air-conditioning load and extending EV driving range. Many EV brands now use expansive glass roofs as a core design feature, further boosting market growth. As global EV sales continue accelerating, supported by government incentives and emissions regulations, glass suppliers are innovating to deliver high-strength, lightweight glazing systems optimized for electric platforms, making EV growth a major catalyst for the automotive glass industry.
Key Trends & Opportunities
Growing Adoption of Panoramic Sunroofs and Large-Format Glazing
A major trend shaping the Automotive Glass Market is the growing consumer preference for panoramic sunroofs and large-format glazing, driven by demand for enhanced aesthetics, improved cabin ambience, and premium vehicle styling. Automakers across all segments—from compact cars to luxury SUVs—are incorporating large glass roofs to differentiate their models and cater to lifestyle-focused consumers. This shift fuels demand for high-strength, UV-resistant, and heat-insulating glass capable of handling larger surface areas. The trend also opens opportunities for electrochromic smart roofs, providing adjustable light control and improved thermal comfort. As panoramic sunroofs transition from a luxury feature to mainstream adoption, glass manufacturers are innovating lightweight, multi-layered, and laminated roofing solutions. With large-glass designs supporting vehicle aerodynamics and visual appeal, panoramic glazing represents one of the most lucrative opportunities for suppliers over the forecast period.
- For instance, BMW’s iX features an electrochromic roof using polymer-dispersed liquid crystal (PDLC) technology capable of switching between transparent and opaque states in under 1 second across a viewing area of approximately 1 square meter.
Rising Innovation in Smart Glass, Electrochromic Glazing, and Solar-Control Technologies
Technological innovation presents significant growth opportunities, particularly in smart glass, electrochromic glazing, and solar-control technologies. Smart glass allows drivers to electronically adjust transparency, reduce glare, and improve cabin temperature regulation without mechanical shades. Electrochromic windshields and side windows enhance comfort and energy efficiency—especially in electric vehicles—by reducing reliance on air-conditioning systems. Solar-control coatings and infrared-reflective layers further advance passenger comfort by minimizing heat penetration, supporting sustainable mobility trends. With autonomous and connected vehicles demanding advanced visibility and digital integration, smart glazing featuring HUD compatibility and sensor-optimized surfaces is gaining momentum. These innovations align with regulatory pushes for energy efficiency and consumer demand for enhanced driving experience, making advanced glass technologies a key opportunity segment over the next decade.
- For instance, Research Frontiers’ SPD-SmartGlass technology enables variable tint control with switching speeds of approximately 1–3 seconds on automotive roof panels measuring up to 1,800 mm in length.
Key Challenges
High Manufacturing Costs and Complex Production Processes
One of the most significant challenges in the Automotive Glass Market is the high cost associated with the production of laminated, coated, and sensor-integrated glass. Advanced glazing systems require sophisticated technologies, including multi-layer lamination, precision coatings, and optical clarity enhancement, all of which increase manufacturing expenses. The integration of ADAS sensors into windshields adds further complexity, often requiring specialized calibration processes and costly replacements. High raw material costs—especially for specialty interlayers and coatings—compound the issue. Smaller suppliers struggle to match the technological and financial capabilities of larger players, creating industry-wide pressure. As OEMs push for lightweight, durable, and technology-enabled glass, production complexity continues to rise, posing a barrier to mass adoption in cost-sensitive markets.
Vulnerability to Breakage, Replacements Costs, and Infrastructure Limitations
Automotive glass remains vulnerable to breakage from impacts, extreme weather, temperature fluctuations, and road debris, leading to high replacement costs—especially for ADAS-enabled windshields that require recalibration. The complexity of smart and laminated glass increases repair times and often necessitates specialized technicians, creating service barriers in emerging markets. Additionally, large-format panoramic roofs and full-glass designs, while visually appealing, are more exposed to damage and stress. In many regions, the lack of widespread calibration infrastructure for ADAS-equipped windshields limits efficient replacements, affecting consumer adoption. These operational challenges create friction for both OEMs and vehicle owners, making durability and long-term performance key focus areas for the industry.
Regional Analysis
North America
North America holds a strong position in the Automotive Glass Market with 28% market share in 2024, driven by high vehicle ownership, strong demand for SUVs and pickup trucks, and rapid adoption of ADAS-enabled windshields. The presence of major OEMs in the U.S. and Canada supports continuous demand for laminated and tempered glazing solutions. Growth is further fueled by increasing sales of electric vehicles, which require larger, lightweight, and aerodynamic glass surfaces. Advancements in smart glass, heated windshields, and solar-control coatings also enhance market penetration. Replacement demand from aftermarket channels contributes significantly to steady regional growth.
Europe
Europe accounts for 25% market share of the Automotive Glass Market, supported by strong regulatory standards for vehicle safety and rising adoption of laminated glass across passenger and commercial vehicles. Germany, France, and the U.K. lead production, driven by their strong automotive manufacturing ecosystems and premium vehicle demand. The region is witnessing increasing integration of panoramic roofs, acoustic glass, and thermal-insulated glazing, driven by consumer preference for comfort and efficiency. Stringent environmental regulations and electrification trends further elevate the use of lightweight glass technologies. Continuous R&D investments by major European glass manufacturers strengthen the region’s competitive edge.
Asia-Pacific
Asia-Pacific dominates the Automotive Glass Market with over 38% market share in 2024, making it the largest and fastest-growing region. China, India, Japan, and South Korea drive demand due to high vehicle production volumes, expanding EV manufacturing, and rising disposable income. The region benefits from cost-effective manufacturing, large-scale OEM capacity, and growing adoption of premium features such as panoramic sunroofs and solar-control glass. Rapid urbanization and increasing car ownership support market expansion. Asia-Pacific’s strong supply chain, robust aftermarket demand, and government support for electric mobility continue to propel the adoption of laminated, tempered, and smart glazing technologies.
Latin America
Latin America captures 5% market share, driven by rising vehicle production in Brazil, Mexico, and Argentina and increasing consumer preference for affordable passenger cars. The region’s demand for tempered and laminated glass is influenced by extreme climate conditions, prompting adoption of UV-protected and solar-control glazing. Growing investments from international OEMs and aftermarket expansion further support market growth. While economic fluctuations limit premium adoption, EV introduction in select countries is expected to generate new opportunities for advanced glazing systems. Strengthening automotive manufacturing ecosystems in Mexico and Brazil continues to anchor the region’s demand for automotive glass solutions.
Middle East & Africa
The Middle East & Africa region holds close to 4% market share, supported by rising automobile imports, increasing demand for SUVs, and growing adoption of heat-resistant and solar-control automotive glass due to extreme temperatures. The UAE, Saudi Arabia, and South Africa are the key contributors. Infrastructure development, tourism-driven mobility demand, and the expansion of vehicle service networks support aftermarket consumption. Although manufacturing presence is limited, international OEMs and glass suppliers are focusing on regional partnerships. As EV adoption picks up gradually, demand for lightweight and high-insulation glazing solutions is expected to rise across premium and commercial vehicle categories.
Market Segmentations
By Glass Type
- Tempered Glass
- Laminated Glass
By Vehicle Type
- Passenger Vehicles
- Light Commercial Vehicles
- Heavy Commercial Vehicles
- Electric Vehicles
By Application
- Windshield
- Back Glass
- Door Glass
- Quarter Glass
By Geography
- North America
- Europe
- Germany
- France
- U.K.
- Italy
- Spain
- Rest of Europe
- Asia Pacific
- China
- Japan
- India
- South Korea
- South-east Asia
- Rest of Asia Pacific
- Latin America
- Brazil
- Argentina
- Rest of Latin America
- Middle East & Africa
- GCC Countries
- South Africa
- Rest of the Middle East and Africa
Competitive Landscape
The Automotive Glass Market features a well-established competitive landscape characterized by strong global players, continuous technological innovation, and expanding OEM partnerships. Leading companies such as AGC Inc., Saint-Gobain Sekurit, Fuyao Glass Industry Group, Nippon Sheet Glass Co. Ltd., Xinyi Glass Holdings Limited, Asahi Glass Company, Pilkington (NSG Group), Guardian Industries, Vitro Automotive, and Shatterpruuf dominate the market through extensive manufacturing capabilities and diversified product portfolios. These players focus on developing advanced laminated, tempered, acoustic, and solar-control glazing solutions to meet rising safety and comfort requirements. Strategic investments in ADAS-compatible windshields, electrochromic glazing, and panoramic roof technologies strengthen their market presence. Many companies are expanding production facilities in Asia-Pacific to leverage cost advantages and rising vehicle demand. Long-term supply contracts with major automakers, strong aftermarket distribution networks, and continuous R&D in lightweight glass materials further shape the industry’s competitive dynamics, reinforcing leadership among top global manufacturers.
Shape Your Report to Specific Countries or Regions & Enjoy 30% Off!
Key Player Analysis
Recent Developments
- In 2025, PGW Auto Glass acquired Dakotaland Autoglass, marking an expansion of its automotive-glass business.
- In July 2025, Gauzy launched the automotive industry’s first prefabricated smart‐glass stack for scalable manufacturing and high-volume vehicle adoption.
- In March 2024, PGW Auto Glass acquired AutoglassCRM, a provider of VIN-decoding services and point-of-sale software, to strengthen its digital installer services.
Report Coverage
The research report offers an in-depth analysis based on Glass Type, Vehicle Type, Application and Geography. It details leading market players, providing an overview of their business, product offerings, investments, revenue streams, and key applications. Additionally, the report includes insights into the competitive environment, SWOT analysis, current market trends, as well as the primary drivers and constraints. Furthermore, it discusses various factors that have driven market expansion in recent years. The report also explores market dynamics, regulatory scenarios, and technological advancements that are shaping the industry. It assesses the impact of external factors and global economic changes on market growth. Lastly, it provides strategic recommendations for new entrants and established companies to navigate the complexities of the market.
Future Outlook
- The market will increasingly shift toward laminated and advanced glazing solutions to support rising safety and comfort requirements.
- ADAS-integrated windshields and sensor-compatible glass will gain rapid adoption across all vehicle categories.
- Smart glass technologies, including electrochromic and solar-control glazing, will become mainstream in premium and electric vehicles.
- Demand for larger panoramic roofs and expansive glazing surfaces will continue to rise due to consumer preference for premium aesthetics.
- Lightweight glass materials will gain importance as automakers focus on improving fuel efficiency and EV range.
- EV growth will accelerate the use of aerodynamic, heat-insulating, and noise-reducing glass systems.
- OEM–supplier collaborations will strengthen to support advanced windshield calibration and integration needs.
- Aftermarket demand for replacement windshields, especially ADAS-enabled ones, will experience steady expansion.
- Asia-Pacific will remain the fastest-growing region, driven by vehicle production and EV manufacturing.
- Continuous R&D investments will drive innovations in durability, optical clarity, and energy-efficient glazing solutions.


