
Home care and wearables anchor connected monitoring
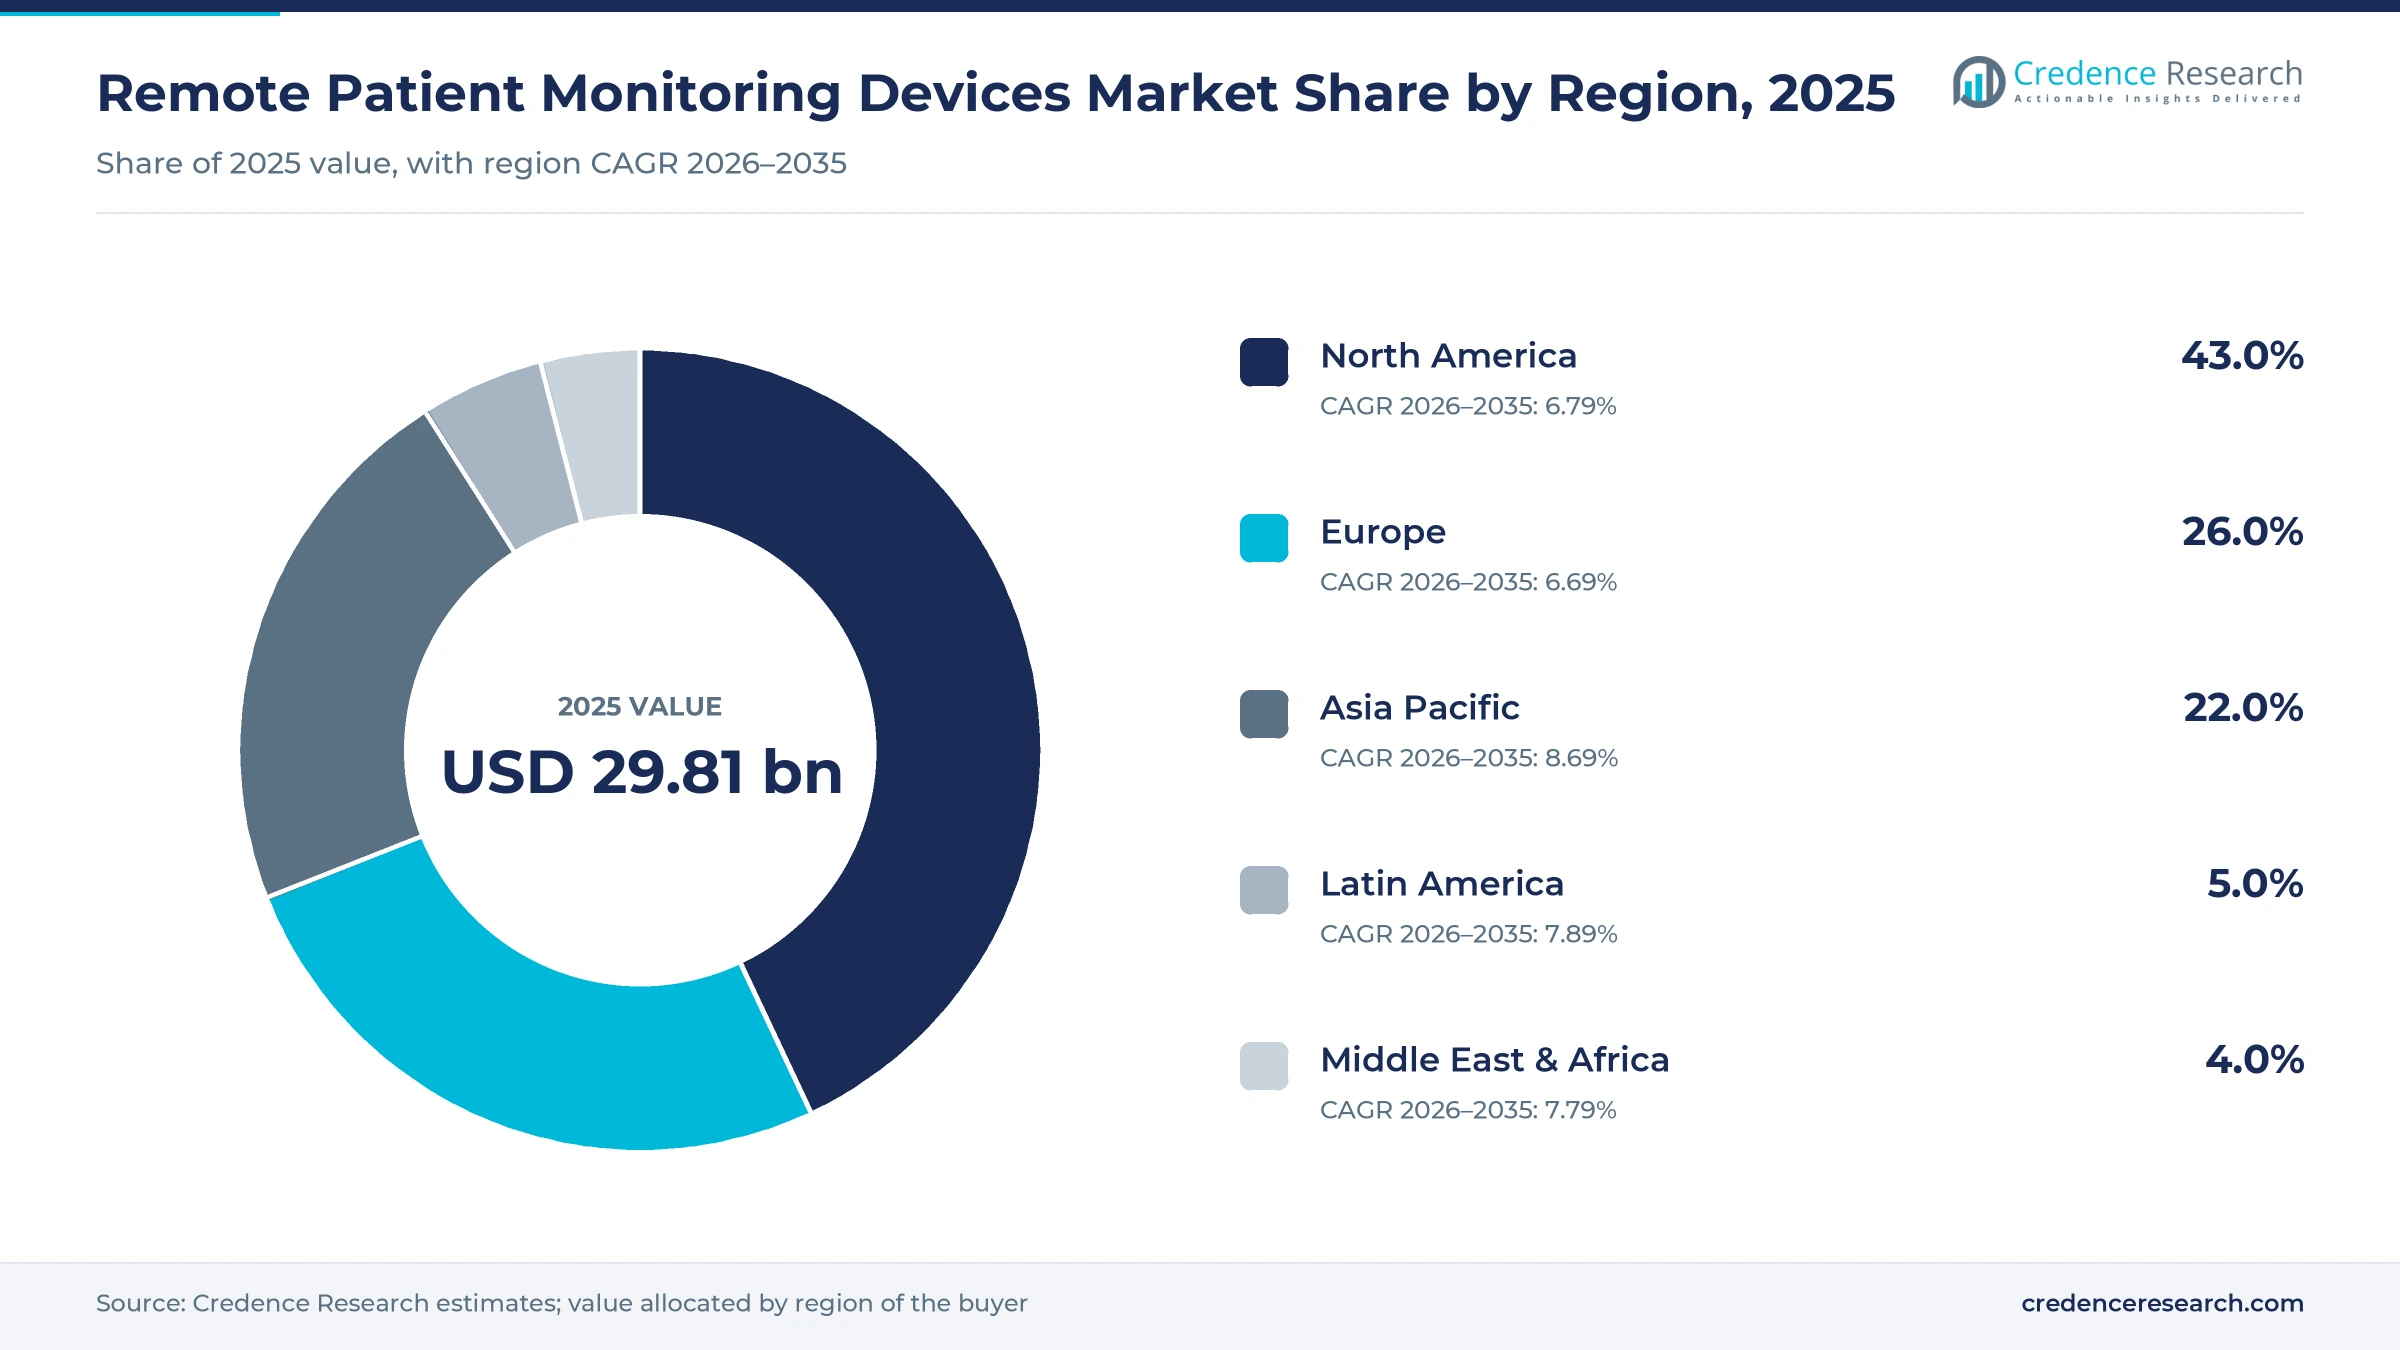
The global remote patient monitoring devices market was valued at USD 29.81 billion in 2025 and is projected to increase from USD 31.99 billion in 2026 to USD 60.30 billion by 2035, registering a CAGR of 7.30% during 2026–2035. Demand comes from people with high blood pressure, diabetes, heart rhythm disorders and lung disease whose physicians want daily readings between clinic visits, and from health systems that discharge patients earlier to home care. North America held the largest regional share, 43.0% in 2025, because Medicare and private insurers in the United States pay for device supply and monthly management. Asia Pacific is the fastest-growing region at 8.69% a year, as China, Japan and India expand connected care for aging populations. The commercial picture shifted in 2024, when U.S. regulators cleared the first over-the-counter glucose biosensors, and again in January 2026, when Medicare began paying for shorter monitoring periods. As a result, growth now depends on consumer sensors as much as clinical programs.
Which connected monitors does this analysis count?
The analysis counts vital sign monitors, blood glucose monitors, cardiac rhythm monitors, respiratory monitors, fetal heart monitors, prothrombin monitors and related hardware that transmit readings to clinicians from outside the hospital room. Wearable patches, watches and sensors, implanted cardiac monitors and handheld meters are included when they send data to a care team or patient app.
Software platforms sold without hardware, care management services, telehealth visits and inpatient bedside monitors that never leave the ward sit outside the value counted here. The value chain runs from sensor and device makers through distributors, health systems, home care agencies and pharmacies to payers and patients.
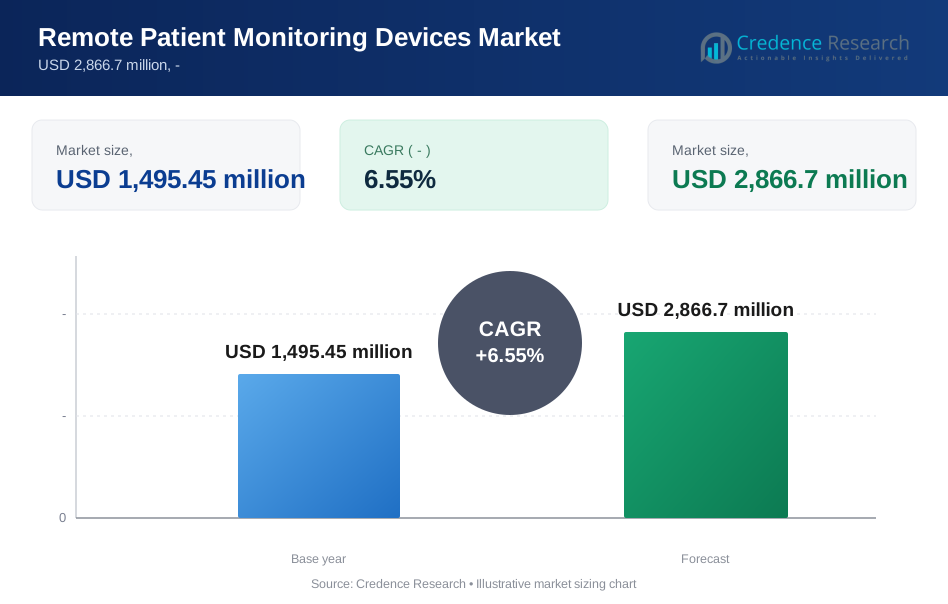
Remote Patient Monitoring Devices Market Insights
- The remote patient monitoring devices market grows from USD 29.81 billion in 2025 to USD 60.30 billion by 2035, a 7.30% CAGR as home-based care expands.
- North America held 43.0% of global value in 2025, because U.S. payers reimburse device supply and monthly review.
- Vital sign monitors led products with 27.0% of 2025 value, while home care settings led end users with 44.0% of value in 2025.
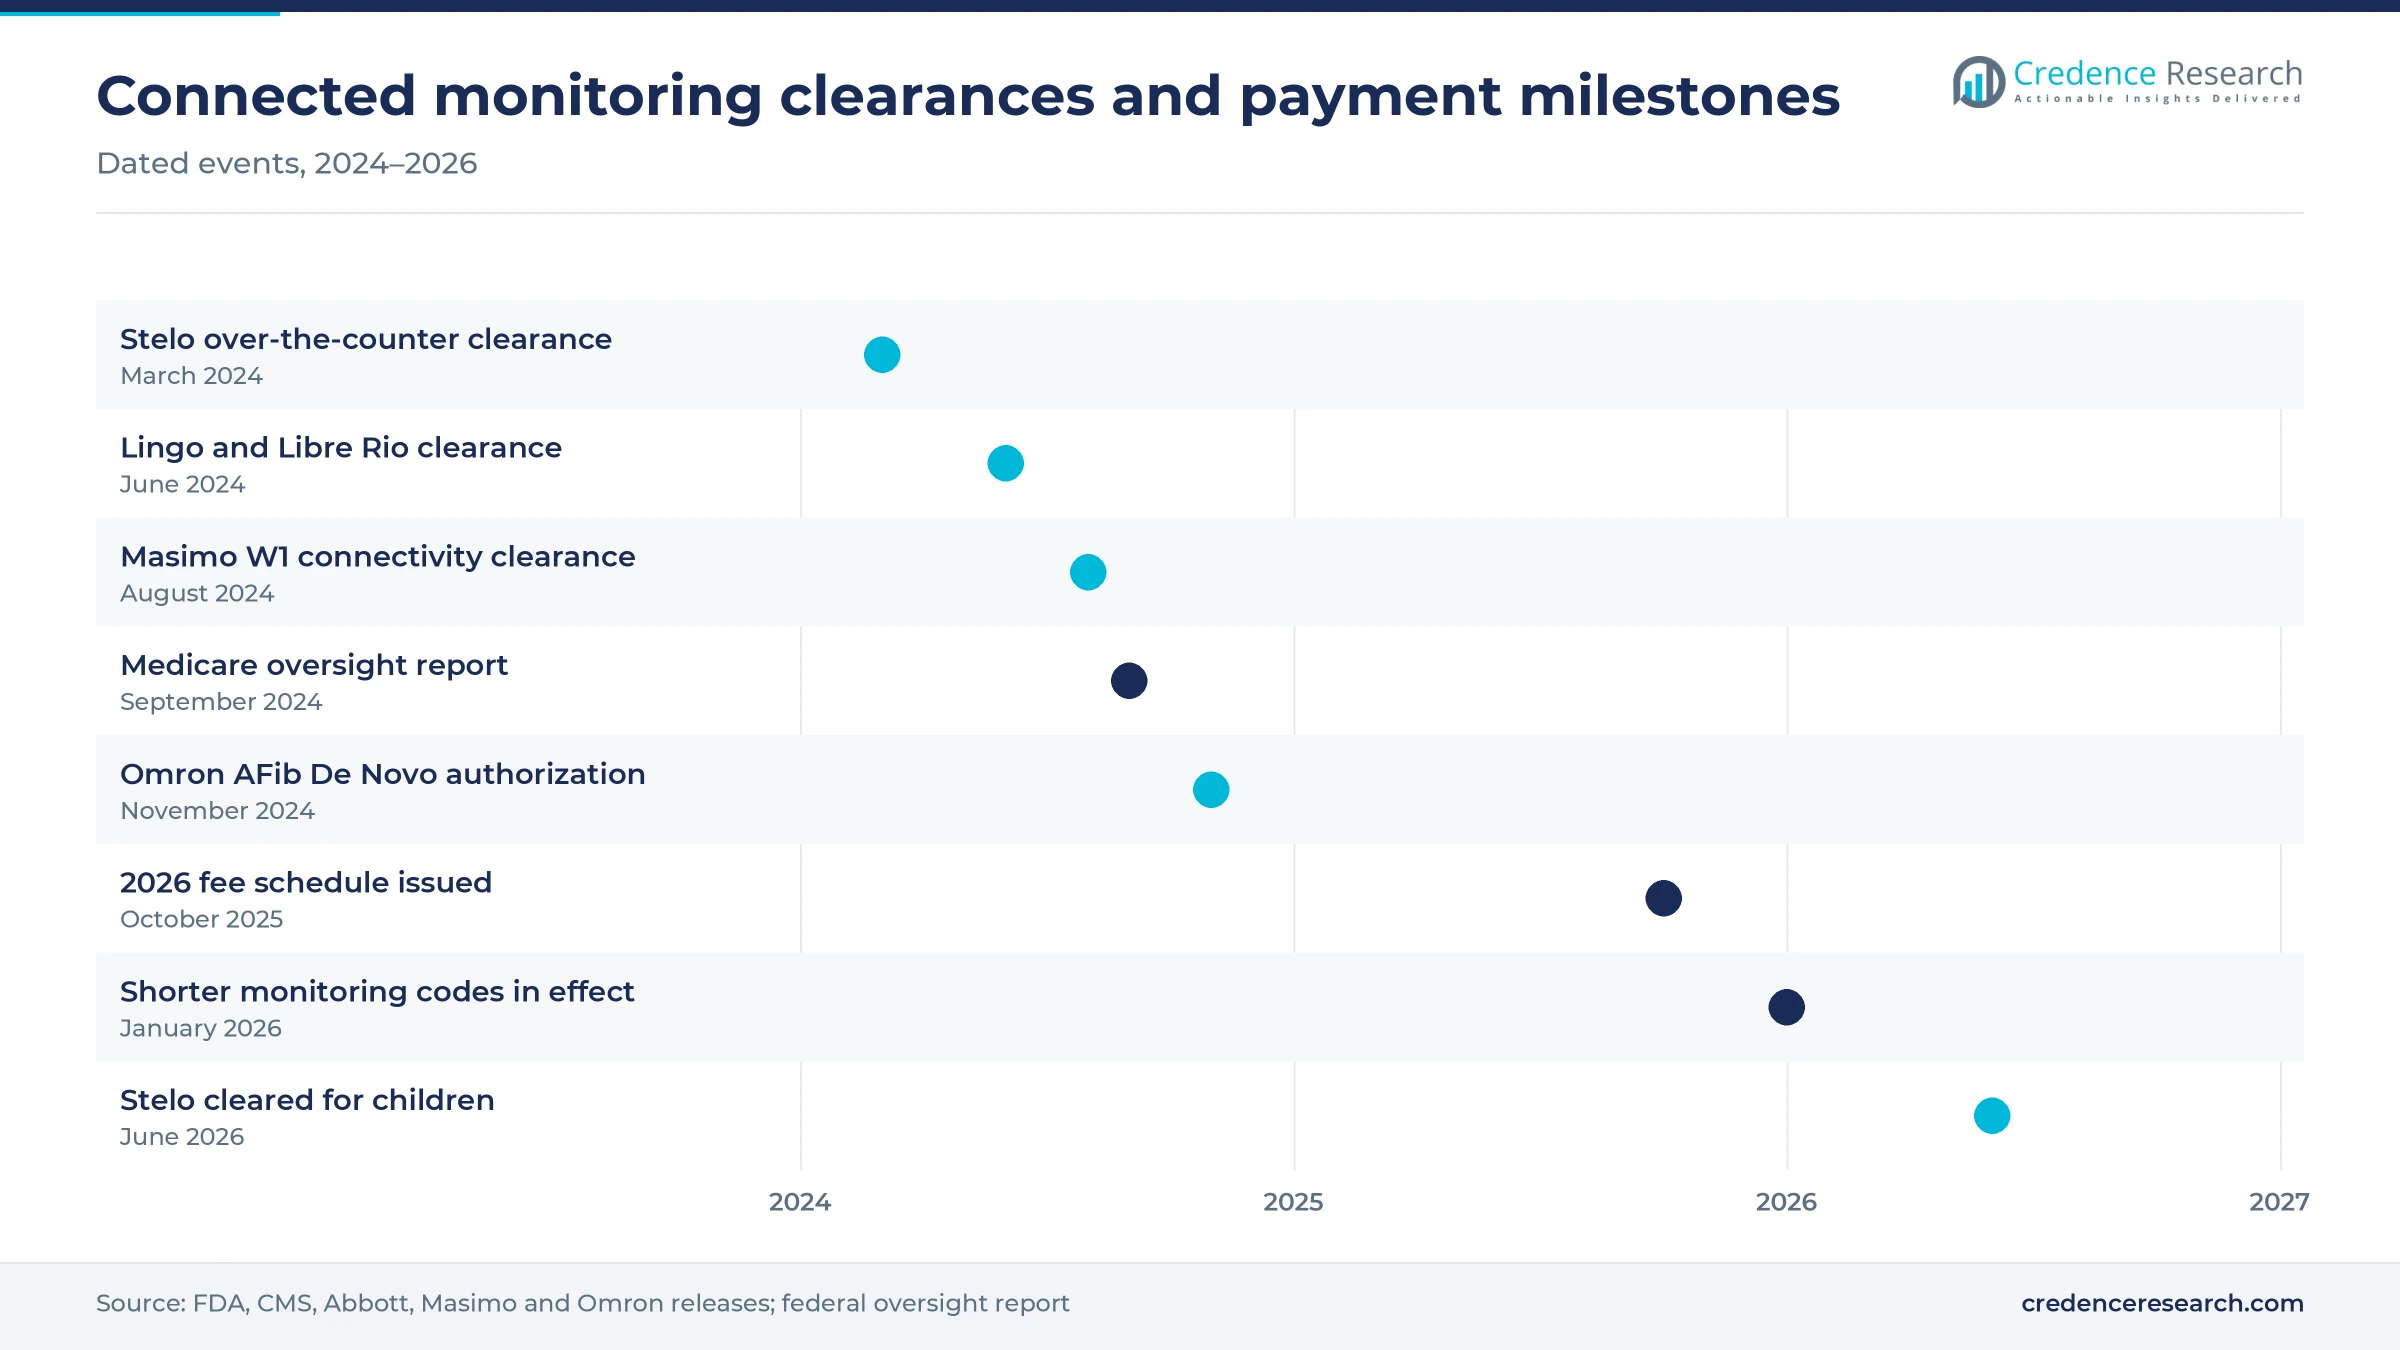
- In March 2024, the FDA cleared the first over-the-counter continuous glucose monitor, opening sensor sales to adults who do not use insulin.
- Medicare enrollees receiving remote monitoring rose from 55,000 in 2019 to 570,000 in 2022, which shows how quickly clinical programs scaled.
Vital sign monitors and wearables lead spending
Why do vital sign monitors lead product types?
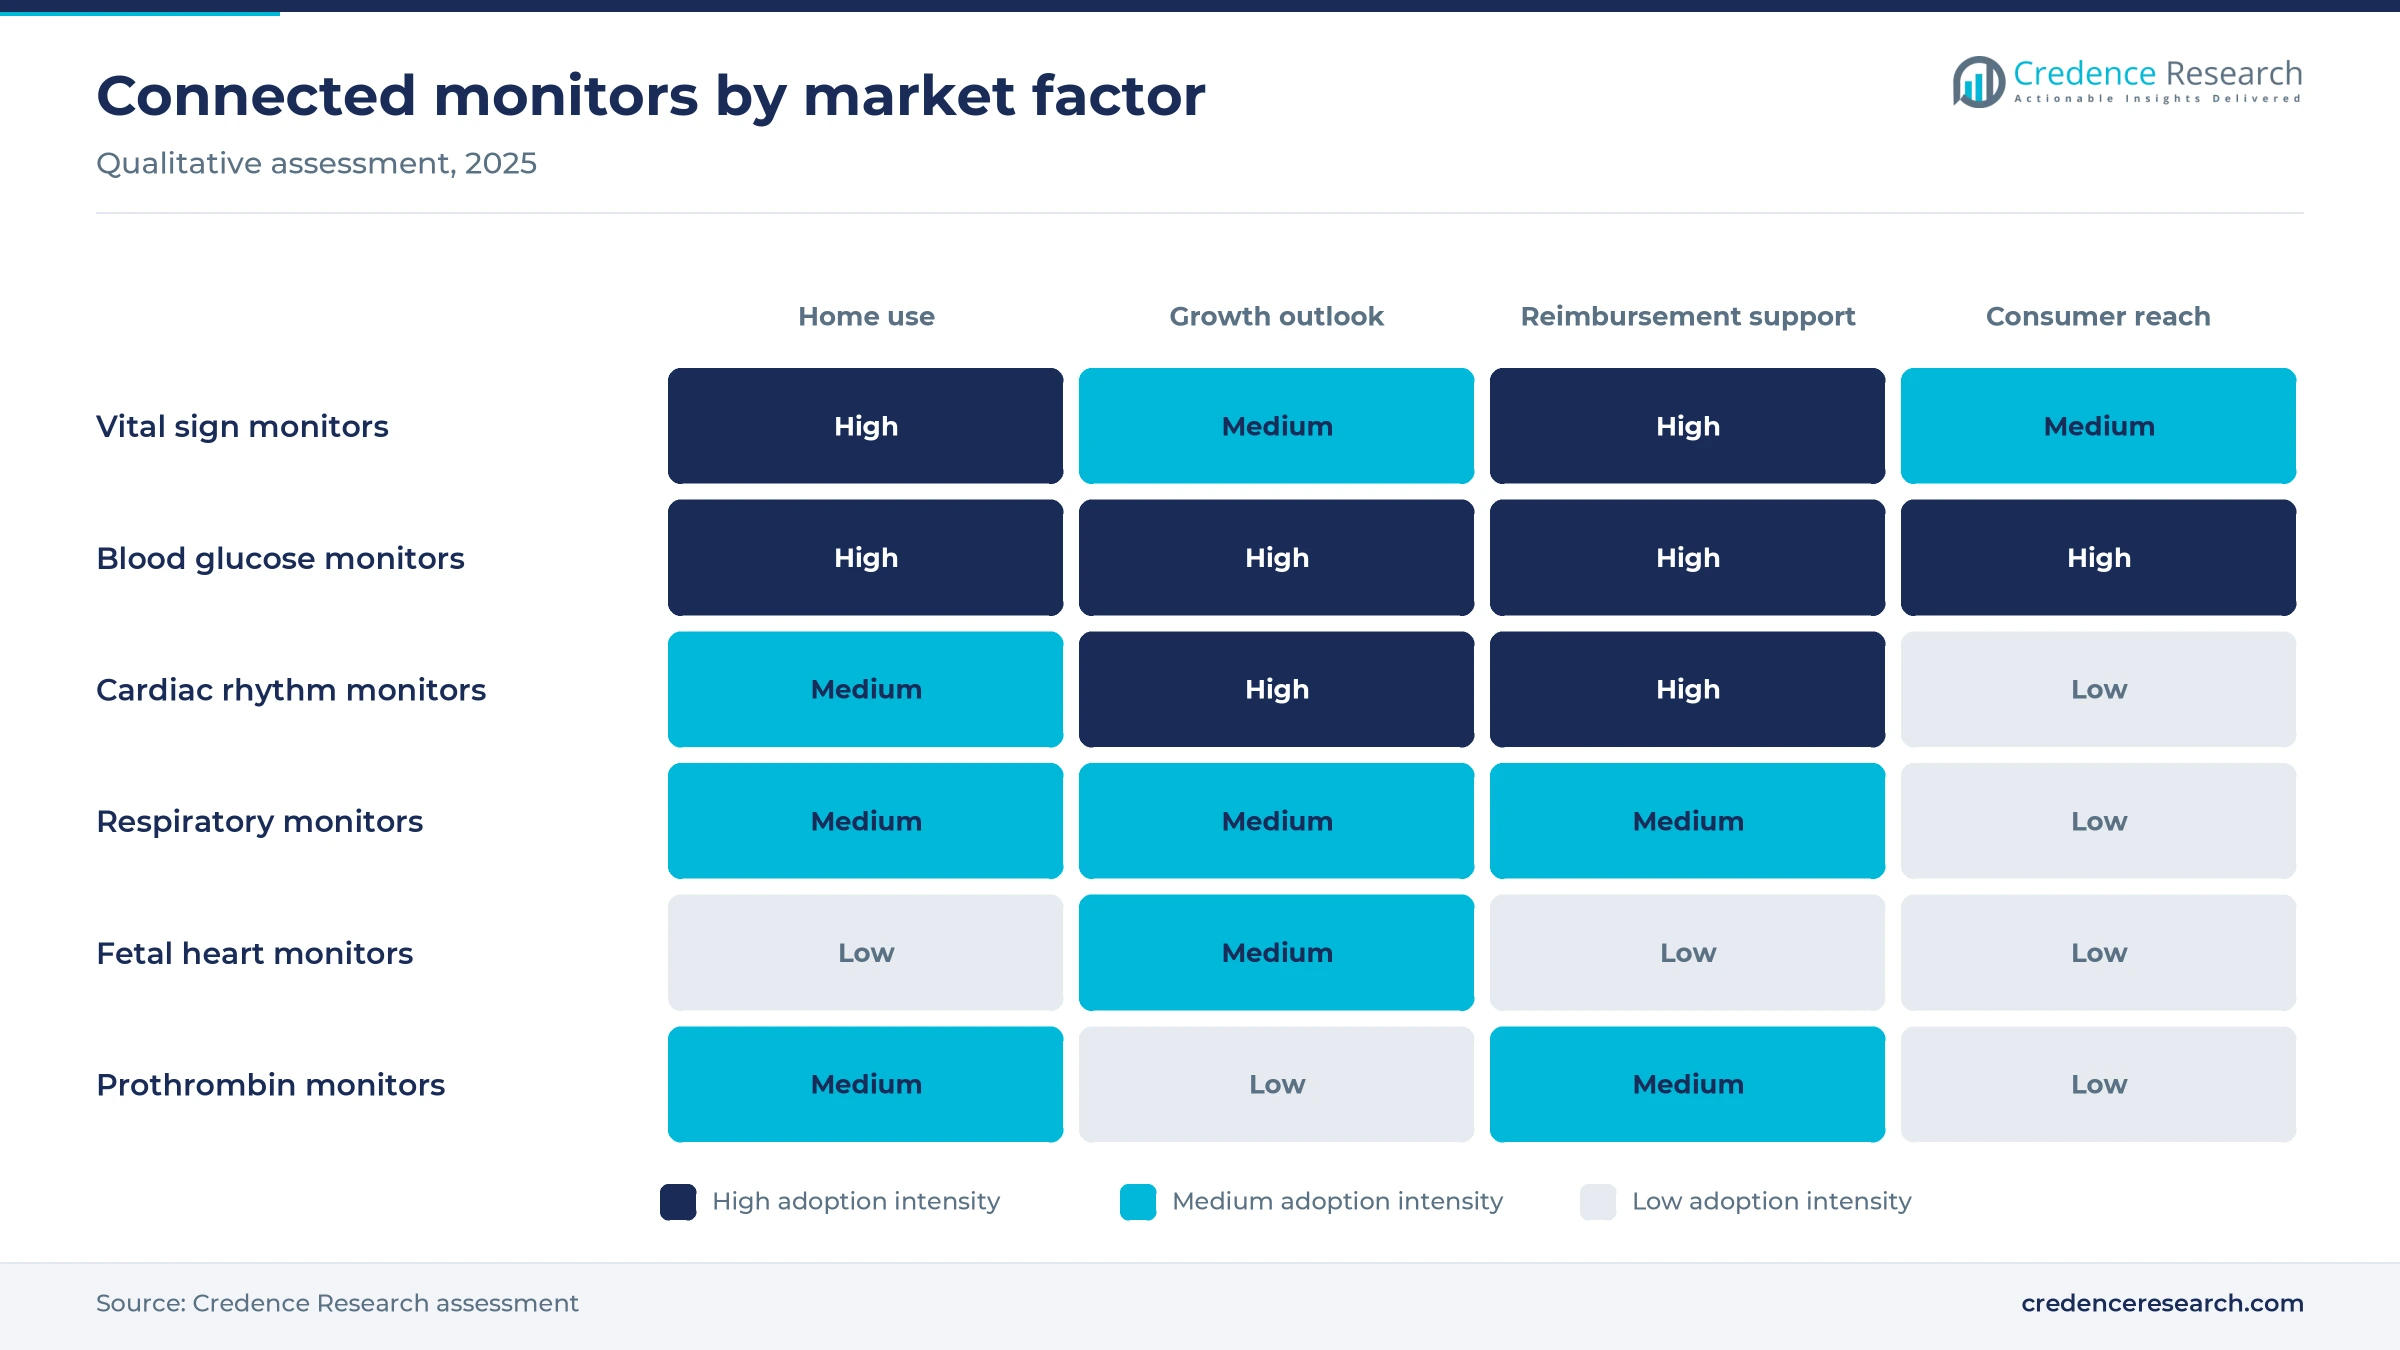
Based on product, the market is categorized into vital sign monitors, blood glucose monitors, cardiac rhythm monitors, respiratory monitors, fetal heart monitors, prothrombin monitors and others. Vital Sign Monitors led with a 27.0% share of 2025 value, because blood pressure, pulse and oxygen readings anchor most home programs. Blood Glucose Monitors grow fastest at 8.43% a year, as over-the-counter biosensors reach adults who do not use insulin.
How far ahead are wearable monitors?
Based on modality, the market is categorized into wearable, implants and handheld products. Wearable products led with a 55.0% share of 2025 value, because patches, watches and arm sensors collect readings without patient effort. This modality also grows fastest at 8.00% a year, as sensor wear time lengthens. Handheld meters grow more slowly, because continuous sensors replace many fingerstick and spot-check readings.
Which conditions account for the most monitoring?
Based on application, the market is categorized into cancer, cardiovascular diseases, diabetes, weight management and fitness monitoring and others. Cardiovascular Diseases led with a 36.0% share of 2025 value, because high blood pressure and rhythm disorders affect very large populations. Weight Management and Fitness Monitoring grows fastest at 8.27% a year, as consumer glucose biosensors and connected scales reach people without a diagnosis.
Why do home care settings lead end users?
Based on end user, the market is categorized into hospitals, ambulatory surgical centers, specialty clinics, home care settings and others. Home Care Settings led with a 44.0% share of 2025 value, because most connected devices are used at home between visits. This end user also grows fastest at 8.16% a year, as health systems shorten hospital stays and move follow-up care into homes.
| Segment Group | Leading Sub-segment | Share, 2025 | Fastest-growing Sub-segment | CAGR, 2026–2035 |
|---|---|---|---|---|
| By Product | Vital Sign Monitors | 27.0% | Blood Glucose Monitors | 8.43% |
| By Modality | Wearable | 55.0% | Wearable | 8.00% |
| By Application | Cardiovascular Diseases | 36.0% | Weight Management and Fitness Monitoring | 8.27% |
| By End User | Home Care Settings | 44.0% | Home Care Settings | 8.16% |
Request a Free Sample
Fill in your details and we'll send you a free sample report.
- Sample data tables & charts
- Research methodology
Chronic disease and Medicare payment lift demand
How does chronic disease prevalence sustain demand?
Chronic disease prevalence is the largest demand driver, because high blood pressure and diabetes need readings every day rather than once a quarter. The World Health Organization reports that about 1.4 billion people had hypertension in 2024 and that just over one in five had it under control. The WHO also counts about 830 million people with diabetes in 2022, and 59% of adults aged 30 and older with diabetes were not taking medication for it. In addition, 99 of 195 countries and territories report national hypertension control rates below 20%. As a result, physicians use home blood pressure cuffs and glucose sensors to find patients whose treatment needs adjusting.
Why has Medicare payment expanded clinical programs?
Medicare payment has expanded clinical programs, because separate codes pay for device supply and monthly review by care teams. A September 2024 federal oversight report, covered by the American Hospital Association, found that about 570,000 Medicare enrollees received remote monitoring in 2022. That figure was up from 55,000 in 2019, a more than tenfold increase in three years. The same report found that about 43% of enrollees did not receive all three components of the service, which points to room for fuller use. In turn, the United States remains the largest single country for paid monitoring programs, with physician practices and health systems both billing for the service.
How do shorter monitoring periods widen eligibility?
Shorter monitoring periods widen eligibility, because many patients do not need readings on 16 or more days each month. The Centers for Medicare & Medicaid Services now states that data must be collected for 2 to 15 or 16 or more days out of 30, depending on the code descriptor. The calendar year 2026 fee schedule, issued Oct. 31, 2025, took effect for services on or after Jan. 1, 2026. Coding guidance describes a new device supply code for 2 to 15 days and a management code for 10 to 19 minutes per month. Because of this, post-surgery and short-term cardiac patients now qualify for paid programs in home care settings.
Why does population aging lift long-term demand?
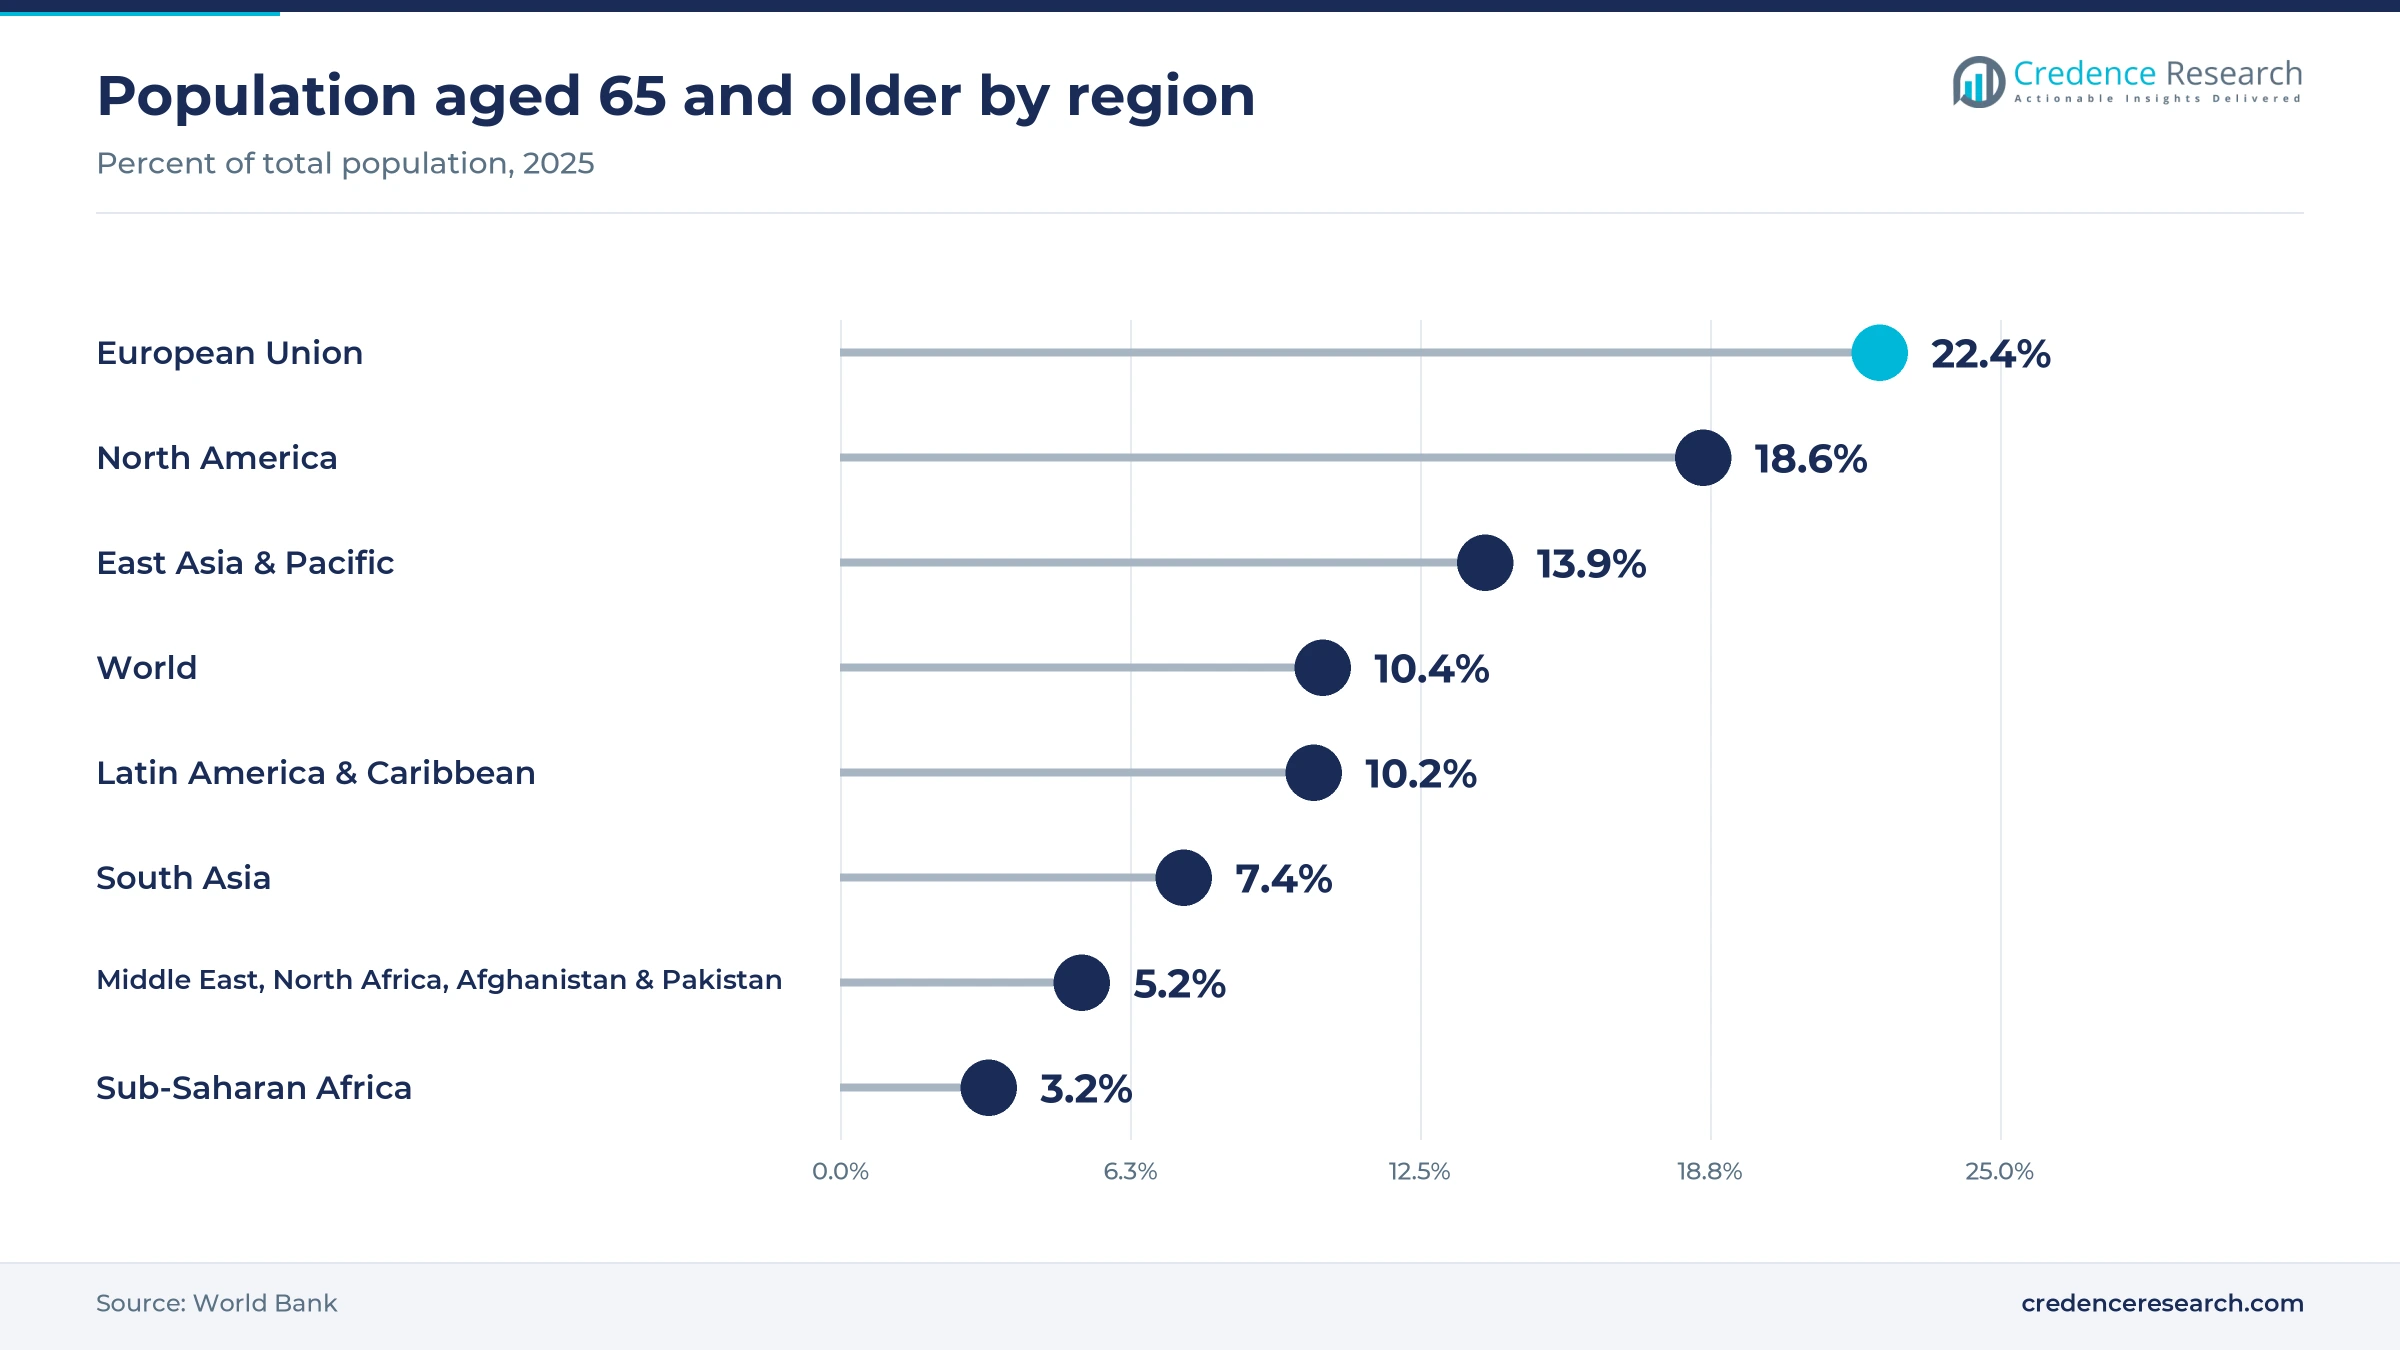
Population aging lifts long-term demand, because older adults live with more chronic conditions and leave the hospital sooner than in the past. World Bank data show that people aged 65 and older made up 22.4% of the European Union population in 2025. The same share was 18.6% in North America and 13.9% in East Asia and Pacific. Worldwide, the share reached 10.4% in 2025, which means a growing pool of patients with heart failure, lung disease and diabetes. As a result, home healthcare agencies and hospital discharge teams add connected scales, pulse oximeters and blood pressure cuffs for elderly patients.
Over-the-counter sensors and AI features reshape use
How is the rise of over-the-counter glucose sensors changing use?
A rise in over-the-counter glucose sensors is changing use, because adults can now buy continuous monitors without a prescription. On March 5, 2024, the FDA cleared the Dexcom Stelo biosensor as the first over-the-counter continuous glucose monitor for adults who do not use insulin. In June 2024, Abbott announced FDA clearance for Lingo and Libre Rio, two more over-the-counter systems based on its FreeStyle Libre sensors. Abbott says this technology is used by about 6 million people across more than 60 countries. In June 2026, the FDA extended Stelo to people aged 2 and older who do not use insulin. In turn, blood glucose monitors grow at 8.43% a year, the fastest product pace.
Is the shift to AI features in home monitors widening use?
The shift to AI features in home monitors is widening use, because one reading can now screen for more than one condition. In November 2024, Omron received FDA De Novo authorization for home blood pressure monitors with AI-based atrial fibrillation detection, and it announced plans to launch the monitors in the United States in early 2025. A study cited by Omron reported 95% sensitivity and 98% specificity for the feature. Omron also notes that about 40% of people with atrial fibrillation have no symptoms, so screening at home can find missed cases. Because blood pressure is measured daily, the feature adds rhythm screening at little extra cost. As a result, implantable cardiac monitors gain referrals once home readings flag irregular rhythms.
Where can consumer wellness sensors open new revenue?
Consumer wellness sensors open a clear opportunity, because people without a diagnosis now buy clinical-grade sensors at pharmacies and online. Abbott designed Lingo for adults aged 18 and older who do not use insulin and want to improve their overall health. In an Abbott study, 77.1% of Lingo biosensors lasted the full 14-day wear period. Stelo also serves people without diabetes who want to see how diet and exercise affect glucose levels. Because these buyers pay out of pocket, weight management and fitness monitoring grows at 8.27% a year, the fastest application. In turn, makers can sell subscriptions and apps alongside each sensor.
Can watches with clinical clearance link into hospital programs?
Watches with clinical clearance create a growth opening, because they combine consumer comfort with data that clinicians can use. In August 2024, Masimo announced FDA 510(k) clearance for its W1 medical watch to connect with the Masimo SafetyNet telemonitoring system. The watch reports blood oxygen saturation, pulse rate, perfusion index and heart rate derived from ECG. Its earlier clearance covers over-the-counter and prescription use at home and in hospitals. Wearable products already led modalities with 55.0% of 2025 value. As a result, telehealth programs can add wrist readings without separate bedside equipment, which lowers the cost of following each patient at home.
Billing oversight and data gaps slow adoption
How does billing oversight slow program growth?
Billing oversight slows program growth, because federal auditors now question how monitoring services are ordered and billed. The September 2024 oversight report recommended that Medicare require an order for monitoring and collect data on the equipment used and vitals measured. Providers that cannot document each step of the service face repayment risk. As a result, some practices delay new programs until billing rules and audit practices become clearer.
Why do incomplete programs reduce clinical value?
Incomplete programs reduce clinical value, because devices help only when someone reviews the readings and acts on them. About 43% of Medicare enrollees receiving monitoring in 2022 did not receive all three parts of the service. Patients may stop using a cuff or sensor after a few weeks when no one calls about results. However, shorter monitoring codes and automated alerts can keep more patients engaged.
Do connectivity gaps limit use in lower-income regions?
Connectivity gaps limit use in lower-income regions, because most devices need a phone, cellular link or home internet to send data. Many rural patients in Africa, South Asia and Latin America lack reliable coverage or cannot afford data plans. Device makers also face separate approval and data protection rules in each country. In turn, clinical programs there remain small and depend on grants or pilot funding.
Can accuracy limits weaken clinical trust?
Accuracy limits can weaken clinical trust, because consumer sensors are not designed for every patient group. The FDA notes that Stelo is not for people with problematic hypoglycemia, because it does not alert users to low blood sugar. Physicians must therefore match each device to the patient and confirm unusual readings. However, wider validation studies and clearer labeling can support broader use over time.
Medicare coverage keeps North America ahead
| Region | Value, 2025 (USD billion) | Share, 2025 | CAGR, 2026–2035 |
|---|---|---|---|
| North America | 12.82 | 43.0% | 6.79% |
| Europe | 7.75 | 26.0% | 6.69% |
| Asia Pacific | 6.56 | 22.0% | 8.69% |
| Latin America | 1.49 | 5.0% | 7.89% |
| Middle East & Africa | 1.19 | 4.0% | 7.79% |
How does Medicare coverage keep North America ahead?
North America held a 43.0% share of 2025 value and grows at 6.79% a year through 2035. Medicare pays for device supply and monthly management, and enrollees using monitoring reached about 570,000 in 2022. The FDA has also cleared over-the-counter glucose sensors from Dexcom and Abbott since 2024. However, tighter billing oversight may slow growth for providers that run large programs without full documentation.
What makes Asia Pacific the fastest-growing region?
Asia Pacific held a 22.0% share of 2025 value and is the fastest-growing region at 8.69% a year. Japan has one of the oldest populations in the world, and Omron and Nihon Kohden supply home and clinical monitors from the country. Mindray serves Chinese hospitals and exports monitors to many regions. Because East Asia and Pacific already had 13.9% of its population aged 65 and older in 2025, demand for home readings rises quickly.
Why does Europe grow at a steadier pace?
Europe held a 26.0% share of 2025 value and grows at 6.69% a year, the slowest pace of the five regions. The European Union has the oldest population of any region in the World Bank data, at 22.4% aged 65 and older in 2025. However, national health systems pay for home monitoring through separate local programs, which slows uniform adoption. Philips, Dräger and Biotronik supply monitors and implanted devices from European bases.
How are Latin American health systems adopting connected care?
Latin America held a 5.0% share of 2025 value and grows at 7.89% a year through 2035. Private hospitals in Brazil and Mexico run home follow-up programs for cardiac and diabetic patients. As a result, wearable sensors and connected blood pressure cuffs spread first among insured urban patients.
Where do the Middle East and Africa stand on home monitoring?
The Middle East and Africa held a 4.0% share of 2025 value and grows at 7.79% a year through 2035. Gulf health systems invest in virtual hospitals and connected care, while much of Africa still lacks the connectivity and reimbursement needed for large programs.
Clearances and launches since 2024
| Development | Status and market relevance |
|---|---|
| In March 2024, the FDA cleared the Dexcom Stelo biosensor as the first over-the-counter continuous glucose monitor. | Cleared; for adults aged 18 and older who do not use insulin |
| In June 2024, Abbott received FDA clearance for Lingo and Libre Rio over-the-counter continuous glucose systems. | Cleared; Lingo targets general wellness and Libre Rio targets type 2 diabetes without insulin |
| In November 2024, Omron received FDA De Novo authorization for home blood pressure monitors with AI-based atrial fibrillation detection. | Authorized; U.S. launch planned for early 2025 |
| In October 2025, CMS issued the calendar year 2026 physician fee schedule, effective for services on or after Jan. 1, 2026. | Final; Medicare monitoring data can now cover 2 to 15 days out of 30 |
| In June 2026, the FDA cleared Stelo as the first over-the-counter continuous glucose monitor for children aged 2 and older. | Cleared; for children who do not use insulin under adult supervision |
Sensing and connectivity tools to watch
- Continuous glucose biosensors sit on the upper arm for up to 15 days and send readings to a phone app without fingersticks.
- Pulse wave rhythm algorithms analyze the pressure signal from a standard cuff reading, as Omron does with more than 300 mathematical indices.
- Medical-grade smartwatches combine optical sensors and ECG electrodes to report oxygen saturation and pulse to clinicians in remote settings.
- Cellular and Bluetooth gateways move readings from scales, cuffs and patches to care teams, so patients need no home computer or setup.
Need a Custom Version of This Report?
Tailor the scope, geography, or segments to your exact requirements.
- Custom geography or segment scope
- Direct access to our analyst team
Device makers compete on accuracy and integration
Rivalry in connected monitoring turns on sensor accuracy, wear time, data integration and reimbursement support, because health systems buy complete programs rather than single devices. Abbott, Roche and Johnson & Johnson compete in glucose and blood testing, while Medtronic, Boston Scientific and Biotronik supply implanted cardiac monitors and remote follow-up. Philips, GE Healthcare, Mindray, Nihon Kohden, Dräger and OSI Systems sell vital sign and clinical monitors that link to hospital records. Omron and Welch Allyn focus on blood pressure and spot-check devices, and Masimo adds medical-grade watches. Honeywell, Smiths Medical, LifeWatch, American Telecare, Vitls and CareValidate serve home care, telehealth and patch-based monitoring niches. Each company now competes on how easily clinicians can review readings inside existing record systems.
Companies profiled and their roles in this market
| Company | Type | Role in the market |
|---|---|---|
| Abbott | Device maker | FreeStyle Libre, Lingo and Libre Rio glucose biosensors |
| Medtronic | Device maker | Insertable cardiac monitors and glucose systems |
| Koninklijke Philips N.V. | Device maker | Patient monitors and connected care platforms |
| GE Healthcare | Device maker | Wireless vital sign monitoring for hospitals |
| Omron Corporation | Device maker | Home blood pressure monitors with atrial fibrillation detection |
| Masimo | Device maker | W1 medical watch and pulse oximetry |
| Boston Scientific Corporation | Device maker | Implanted cardiac rhythm monitoring |
| Biotronik | Device maker | Implanted cardiac devices with remote follow-up |
| F. Hoffmann-La Roche Ltd | Diagnostics maker | Blood glucose and coagulation self-testing |
| Johnson & Johnson | Diversified health company | Medical technology and connected care products |
| Shenzhen Mindray Bio-Medical Electronics Co., Ltd | Device maker | Patient monitors for hospitals and clinics |
| Nihon Kohden Corporation | Device maker | Clinical monitors and telemetry |
| Dräger Medical | Device maker | Patient monitoring and respiratory equipment |
| OSI Systems, Inc. | Device maker | Patient monitoring systems |
| Welch Allyn | Device maker | Spot-check vital sign and blood pressure devices |
| Smiths Medical | Device maker | Vital sign and respiratory monitoring products |
| Honeywell | Technology company | Home telehealth and monitoring hardware |
| LifeWatch | Service and device provider | Ambulatory cardiac monitoring |
| American Telecare | Telehealth provider | Home telehealth monitoring systems |
| Vitls Inc. | Wearable developer | Wearable vital sign patches |
| CareValidate | Digital health company | Connected care and monitoring platforms |
Home use and payment rules set the pace to 2035
Credence Research expects home use and payment rules, rather than device innovation alone, to set the pace of growth through 2035. The market advances at 7.30% a year, as wearable sensors and home care programs add most new users. Over-the-counter glucose biosensors and AI-enabled blood pressure cuffs bring consumer buyers into a market once led by clinics. Makers that integrate readings into health records and support billing documentation should defend share, while sellers of standalone handheld meters face slower growth as continuous sensors replace spot checks.
How Credence Research sized connected monitor spending
The base year is 2025 and the forecast runs from 2026 to 2035. Market values come from the Credence Research model, which sums device spending by product, modality, application and end user across five regions. Splits by region and segment are Credence Research estimates, informed by World Health Organization disease data, World Bank population data, FDA clearances, CMS guidance, federal oversight findings and company releases. This edition relies on published sources only and did not use primary interviews or surveys.
Connected home monitoring outlook to 2035
The remote patient monitoring devices market is projected to reach USD 60.30 billion by 2035, with wearables and home care settings supplying most of the added value. Over-the-counter glucose biosensors will keep widening the buyer base, while shorter Medicare monitoring periods bring more short-term patients into paid programs. North America keeps the highest spending, and Asia Pacific adds the largest number of new users as populations age. As a result, accuracy, wear time and record integration will separate leaders from followers.
Frequently Asked Questions
How big is the global remote patient monitoring devices market?
Which product leads the remote patient monitoring devices market?
Which region leads spending on connected monitors?
Which end user accounts for the most device spending?
How many Medicare enrollees use remote monitoring?
Which clearances have shaped the market since 2024?
Who are the leading remote patient monitoring device companies?
What restrains growth in connected monitoring devices?
Table of Content
Chapter 1 Market Segmentation
- 1.1 Segmentation Framework
- 1.1.1 Product and Service Classification
- 1.1.2 Application and End-Use Classification
- 1.1.3 Technology and Solution Classification
- 1.1.4 Customer and Distribution Channel Classification
- 1.1.5 Geographic Segmentation
- 1.1.6 Market Segment Definitions and Boundaries
- 1.2 By Product
- 1.2.1 Vital Sign Monitors
- 1.2.2 Blood Glucose Monitors
- 1.2.3 Cardiac Rhythm Monitors
- 1.2.4 Respiratory Monitors
- 1.2.5 Fetal Heart Monitors
- 1.2.6 Prothrombin Monitors
- 1.2.7 Others
- 1.3 By Modality
- 1.3.1 Wearable
- 1.3.2 Handheld
- 1.3.3 Implants
- 1.4 By Application
- 1.4.1 Cardiovascular Diseases
- 1.4.2 Diabetes
- 1.4.3 Cancer
- 1.4.4 Weight Management and Fitness Monitoring
- 1.4.5 Others
- 1.5 By End User
- 1.5.1 Home Care Settings
- 1.5.2 Hospitals
- 1.5.3 Specialty Clinics
- 1.5.4 Ambulatory Surgical Centers
- 1.5.5 Others
Chapter 2 Introduction
- 2.1 Report Objectives and Scope
- 2.2 Product Definition and Industry Terminology
- 2.3 Market Inclusions and Exclusions
- 2.4 Research Process
- 2.4.1 Primary Research and Expert Interviews
- 2.4.2 Secondary Research and Source Review
- 2.4.3 Top-Down and Bottom-Up Estimation
- 2.4.4 Data Triangulation and Verification
- 2.5 Market Size Measurement Basis
- 2.5.1 2025: USD 29.81 billion → 2035: USD 60.30 billion
- 2.6 Historical and Forecast Reference Periods
- 2.6.1 Historical Period: 2018-2025
- 2.6.2 Base Year: 2025
- 2.6.3 Forecast Period: 2025-2035
- 2.7 Research Assumptions and Limitations
Chapter 3 Executive Summary
- 3.1 Market Snapshot and Key Findings
- 3.2 Base-Year Market Size, 2025
- 3.3 Forecast Market Size, 2035
- 3.4 Revenue and Volume Growth Outlook
- 3.5 Key Demand and Supply Indicators
- 3.6 Leading Market Segments
- 3.7 Fastest-Growing Market Opportunities
- 3.8 Regional Performance Highlights
- 3.9 Technology and Industry Transformation
- 3.10 Competitive Landscape Summary
- 3.11 Analyst View and Strategic Implications
Chapter 4 Global Remote Patient Monitoring Devices Market Trends and Developments
- 4.1 Historical Industry Development, 2018-2025
- 4.2 Recent Market Trends and Developments
- 4.3 Demand and Customer Behavior Trends
- 4.4 Technology and Product Innovation
- 4.5 Artificial Intelligence, Automation and Digitalization
- 4.6 Local Manufacturing and Supply Chain Realignment
- 4.7 Industry Partnerships, Mergers and Acquisitions
- 4.8 Sustainability and Circular Economy Developments
- 4.9 Government and Private Sector Investment Trends
- 4.10 Emerging Business Models and Commercialization
- 4.11 Industry Developments and Announcements
Chapter 5 Global Remote Patient Monitoring Devices Market Production, Supply and Demand Analysis
- 5.1 Demand Trend and Consumption Analysis, 2018-2025
- 5.2 Demand Forecast, 2025-2035
- 5.3 Production and Output Trend, 2018-2025
- 5.4 Production and Output Forecast, 2025-2035
- 5.5 Installed Capacity and Capacity Utilization
- 5.6 Company-Wise Production Plants and Statistics
- 5.6.1 Installed Production Capacity
- 5.6.2 Actual Production
- 5.6.3 Planned Capacity and Expansion Targets
- 5.7 Supply Chain Structure and Procurement Trends
- 5.8 Supply-Demand Gap and Bottlenecks
- 5.9 Import Dependence and Sourcing Structure
- 5.10 Contract Manufacturing and Outsourcing
- 5.11 Regional Supply and Demand Concentration
Chapter 6 Global Remote Patient Monitoring Devices Market Pricing Analysis
- 6.1 Pricing Structure and Measurement
- 6.2 Historical Pricing Trends, 2018-2025
- 6.3 Pricing Outlook, 2025-2035
- 6.4 Average Selling Price and Unit Economics
- 6.5 Pricing by Product and Market Segment
- 6.6 Geographic Pricing Differences
- 6.7 Key Input, Energy, Labor and Logistics Costs
- 6.8 Contract Pricing and Purchasing Models
- 6.9 Pricing Sensitivity and Competitive Positioning
- 6.10 Price, Margin and Profitability Implications
Chapter 7 Global Remote Patient Monitoring Devices Market Dynamics
- 7.1 Market Growth Drivers
- 7.1.1 Demand-Side Drivers
- 7.1.2 Technology and Innovation Drivers
- 7.1.3 Infrastructure and Investment Drivers
- 7.1.4 Regulatory and Policy Drivers
- 7.2 Market Restraints
- 7.2.1 Cost and Affordability Constraints
- 7.2.2 Technology and Adoption Barriers
- 7.2.3 Supply Chain and Operational Constraints
- 7.3 Market Challenges
- 7.3.1 Competitive Pressure and Margin Erosion
- 7.3.2 Skills, Infrastructure and Implementation Gaps
- 7.4 Emerging Market Opportunities
- 7.5 Market Dynamics Impact and Time-Horizon Assessment
Chapter 8 Global Remote Patient Monitoring Devices Value Chain Analysis
- 8.1 Industry Value Chain Overview
- 8.2 Upstream Suppliers and Critical Inputs
- 8.3 Technology and Component Providers
- 8.4 Manufacturing or Service Delivery
- 8.5 Distribution, Channel Partners and Integrators
- 8.6 Downstream Applications and End Users
- 8.7 Value Addition and Profit Pools
- 8.8 Vertical Integration and Outsourcing
- 8.9 Supplier Concentration and Risk
- 8.10 Supply Chain Localization and Resilience
Chapter 9 Global Remote Patient Monitoring Devices Market Regulations and Policies
- 9.1 Relevant Laws, Standards and Compliance Frameworks
- 9.2 Product, Service, Safety and Quality Requirements
- 9.3 Government Policies, Incentives and Subsidies
- 9.4 Imports, Exports and Trade Barriers
- 9.5 Public Procurement and Local Content Requirements
- 9.6 Environmental and Sustainability Compliance
- 9.7 Upcoming Policy Changes and Market Implications
Chapter 10 Global Remote Patient Monitoring Devices Market Hotspots and Opportunities
- 10.1 Market Opportunity Mapping and Growth Hotspots
- 10.2 High-Growth Applications and Customer Groups
- 10.3 Underserved Markets and White-Space Opportunities
- 10.4 Emerging Technology and Product Opportunities
- 10.5 New Capacity and Investment Hotspots
- 10.6 Market Entry and Expansion Opportunities
- 10.7 Distribution and Partnership Opportunities
- 10.8 Near-Term and Long-Term Commercial Potential
- 10.9 Opportunity Attractiveness and Execution Risks
Chapter 11 Global Remote Patient Monitoring Devices Market Outlook, 2025-2035
- 11.1 Market Size and Analysis
- 11.1.1 Revenue (Market Measurement: 2025: USD 29.81 billion → 2035: USD 60.30 billion)
- 11.1.2 Market Volume and Quantity Sold
- 11.1.3 Historical Market Size, 2018-2025
- 11.1.4 Base-Year Market Size, 2025
- 11.2 Market Forecast, 2025-2035
- 11.2.1 Revenue Forecast to 2035
- 11.2.2 Volume Forecast to 2035
- 11.2.3 CAGR and Year-on-Year Growth
- 11.2.4 Incremental Revenue Opportunity
- 11.3 Forecast Assumptions and Scenario Analysis
- 11.3.1 Base-Case Forecast
- 11.3.2 Optimistic and Conservative Scenarios
- 11.3.3 Technology, Pricing and Policy Sensitivities
- 11.4 Market Attractiveness and Growth Outlook
Chapter 12 Global Remote Patient Monitoring Devices Market Segmentation and Outlook
- 12.1 Segmentation Summary and Market Shares, 2025
- 12.2 Largest and Fastest-Growing Segments
- 12.3 By Product - Market Size and Forecast, 2025-2035
- 12.3.1 Segment Definition and Scope
- 12.3.2 Historical Market Size, 2018-2025
- 12.3.3 Revenue Forecast, 2025-2035
- 12.3.4 Volume Forecast, 2025-2035
- 12.3.5 Base-Year Market Share, 2025
- 12.3.6 Segment CAGR and Growth Drivers
- 12.3.7 Subsegment Market Size and Forecast
- 12.3.7.1 Vital Sign Monitors
- 12.3.7.2 Blood Glucose Monitors
- 12.3.7.3 Cardiac Rhythm Monitors
- 12.3.7.4 Respiratory Monitors
- 12.3.7.5 Fetal Heart Monitors
- 12.3.7.6 Prothrombin Monitors
- 12.3.7.7 Others
- 12.3.8 Subsegment Pricing and Adoption Trends
- 12.3.9 Leading Suppliers and Competition
- 12.3.10 Regional Demand and Opportunities
- 12.4 By Modality - Market Size and Forecast, 2025-2035
- 12.4.1 Segment Definition and Scope
- 12.4.2 Historical Market Size, 2018-2025
- 12.4.3 Revenue Forecast, 2025-2035
- 12.4.4 Volume Forecast, 2025-2035
- 12.4.5 Base-Year Market Share, 2025
- 12.4.6 Segment CAGR and Growth Drivers
- 12.4.7 Subsegment Market Size and Forecast
- 12.4.7.1 Wearable
- 12.4.7.2 Handheld
- 12.4.7.3 Implants
- 12.4.8 Subsegment Pricing and Adoption Trends
- 12.4.9 Leading Suppliers and Competition
- 12.4.10 Regional Demand and Opportunities
- 12.5 By Application - Market Size and Forecast, 2025-2035
- 12.5.1 Segment Definition and Scope
- 12.5.2 Historical Market Size, 2018-2025
- 12.5.3 Revenue Forecast, 2025-2035
- 12.5.4 Volume Forecast, 2025-2035
- 12.5.5 Base-Year Market Share, 2025
- 12.5.6 Segment CAGR and Growth Drivers
- 12.5.7 Subsegment Market Size and Forecast
- 12.5.7.1 Cardiovascular Diseases
- 12.5.7.2 Diabetes
- 12.5.7.3 Cancer
- 12.5.7.4 Weight Management and Fitness Monitoring
- 12.5.7.5 Others
- 12.5.8 Subsegment Pricing and Adoption Trends
- 12.5.9 Leading Suppliers and Competition
- 12.5.10 Regional Demand and Opportunities
- 12.6 By End User - Market Size and Forecast, 2025-2035
- 12.6.1 Segment Definition and Scope
- 12.6.2 Historical Market Size, 2018-2025
- 12.6.3 Revenue Forecast, 2025-2035
- 12.6.4 Volume Forecast, 2025-2035
- 12.6.5 Base-Year Market Share, 2025
- 12.6.6 Segment CAGR and Growth Drivers
- 12.6.7 Subsegment Market Size and Forecast
- 12.6.7.1 Home Care Settings
- 12.6.7.2 Hospitals
- 12.6.7.3 Specialty Clinics
- 12.6.7.4 Ambulatory Surgical Centers
- 12.6.7.5 Others
- 12.6.8 Subsegment Pricing and Adoption Trends
- 12.6.9 Leading Suppliers and Competition
- 12.6.10 Regional Demand and Opportunities
- 12.7 Segment Growth Comparison
- 12.8 Segment Attractiveness and Priority Matrix
Chapter 13 Global Remote Patient Monitoring Devices End-Use and Application Market Outlook
- 13.1 End-Use Industry and Customer Demand Structure
- 13.2 Leading Applications and Customer Groups
- 13.3 End-Use Market Size, Share and Forecast
- 13.4 Major End-Use Industry Deep Dives
- 13.4.1 Customer Requirements and Use Cases
- 13.4.2 Demand and Replacement Cycles
- 13.4.3 Technical and Regulatory Considerations
- 13.4.4 Purchasing and Procurement Models
- 13.4.5 Leading Vendors and Distribution Channels
- 13.4.6 Forecast and Commercial Opportunities
- 13.5 Emerging Applications and Cross-Segment Demand
- 13.6 End-Use Industry Investment Priorities
Chapter 14 Global Remote Patient Monitoring Devices Geographic Market Outlook, 2025-2035
- 14.1 Regional Market Size and Share, 2025
- 14.2 Regional Market Forecast, 2025-2035
- 14.3 Regional Pricing, Production and Demand Differences
- 14.4 North America
- 14.4.1 United States
- 14.4.2 Canada
- 14.4.3 Mexico
- 14.5 Europe
- 14.5.1 Germany
- 14.5.2 France
- 14.5.3 Italy
- 14.5.4 United Kingdom
- 14.5.5 Spain
- 14.5.6 Poland
- 14.5.7 Russia
- 14.5.8 Netherlands
- 14.5.9 Belgium
- 14.5.10 Sweden
- 14.5.11 Denmark
- 14.5.12 Norway
- 14.5.13 Rest of Europe
- 14.6 Asia Pacific
- 14.6.1 China
- 14.6.2 India
- 14.6.3 Japan
- 14.6.4 South Korea
- 14.6.5 Thailand
- 14.6.6 Indonesia
- 14.6.7 Vietnam
- 14.6.8 Malaysia
- 14.6.9 Australia
- 14.6.10 Rest of Asia Pacific
- 14.7 Latin America
- 14.7.1 Brazil
- 14.7.2 Argentina
- 14.7.3 Colombia
- 14.7.4 Chile
- 14.7.5 Rest of Latin America
- 14.8 Middle East
- 14.8.1 Saudi Arabia
- 14.8.2 United Arab Emirates
- 14.8.3 Turkey
- 14.8.4 Israel
- 14.8.5 Iran
- 14.8.6 Rest of the Middle East
- 14.9 Africa
- 14.9.1 South Africa
- 14.9.2 Egypt
- 14.9.3 Nigeria
- 14.9.4 Morocco
- 14.9.5 Rest of Africa
- 14.10 Regional Investment, Policy and Supply Chain Differences
- 14.11 Regional Competitive Landscape
- 14.12 Geographic Growth Hotspots
Chapter 15 Global Remote Patient Monitoring Devices Technology, Innovation and Sustainability Outlook
- 15.1 Technology Landscape and Maturity
- 15.2 Product, Process and Service Innovation
- 15.3 AI, Automation and Digital Tools in the Industry
- 15.4 Technology Adoption and Performance Benchmarking
- 15.5 Innovation Pipeline and R&D Investment
- 15.6 Patent and Intellectual Property Trends
- 15.7 Energy Efficiency and Resource Management
- 15.8 Sustainability, Recycling and Circularity
- 15.9 Technology Roadmap, 2025-2035
- 15.10 Risks of Obsolescence and Technology Substitution
Chapter 16 Global Remote Patient Monitoring Devices Market Key Strategic Imperatives
- 16.1 Growth and Market Entry Priorities
- 16.2 High-Return Products and Segments
- 16.3 Pricing, Profitability and Cost Optimization
- 16.4 Technology Investment and Product Differentiation
- 16.5 Supply Chain Localization and Resilience
- 16.6 Distribution and Customer Acquisition
- 16.7 Partnership, Acquisition and Capacity Strategy
- 16.8 Regional Expansion Priorities
- 16.9 Short-, Medium- and Long-Term Actions
Chapter 17 Competition Outlook
- 17.1 Industry Competition Characteristics
- 17.2 Market Structure and Concentration
- 17.3 Market Share and Competitive Positioning, 2025
- 17.4 Company-Wise Revenue and Product Benchmarking
- 17.5 Production and Service Capacity Benchmarking
- 17.6 Technology, Pricing and Differentiation
- 17.7 Regional Footprint and Distribution Strength
- 17.8 Mergers, Acquisitions and Strategic Alliances
- 17.9 New Entrants and Competitive Threats
- 17.10 Porter's Five Forces and Industry Attractiveness
- 17.11 Competitive Outlook, 2025-2035
Chapter 18 Company Profiles
- 18.1 Company Coverage and Selection Criteria
- 18.2 Shenzhen Mindray Bio-Medical Electronics Co., Ltd
- 18.2.1 Business Description
- 18.2.2 Company Ownership and Geographic Presence
- 18.2.3 Product and Service Portfolio
- 18.2.4 Manufacturing and Operating Footprint
- 18.2.5 Production Capacity and Expansion Plans
- 18.2.6 Financial Performance and Investment
- 18.2.7 Market Share and Competitive Position
- 18.2.8 Technology and Innovation Capabilities
- 18.2.9 Strategic Alliances or Partnerships
- 18.2.10 Recent Developments
- 18.2.11 Growth Strategy and Outlook
- 18.3 Nihon Kohden Corporation
- 18.4 Omron Corporation
- 18.5 OSI Systems, Inc.
- 18.6 Koninklijke Philips N.V.
- 18.7 F. Hoffmann-La Roche Ltd
- 18.8 Welch Allyn
- 18.9 Smiths Medical
- 18.10 Abbott
- 18.11 Boston Scientific Corporation
- 18.12 Dräger Medical
- 18.13 GE Healthcare
- 18.14 Honeywell
- 18.15 Johnson & Johnson
- 18.16 LifeWatch
- 18.17 Medtronic
- 18.18 Masimo
- 18.19 Vitls Inc.
- 18.20 CareValidate
- 18.21 Biotronik
- 18.22 American Telecare
- 18.23 Other Relevant Market Participants
Note: Every listed company is profiled on the structure shown under the first company. The company list is preliminary and may change based on research findings, market developments, data availability and client requirements.
Chapter 19 Disclaimer
- 19.1 Research and Forecast Disclaimer
- 19.2 Data Source and Estimation Limitations
Note: The depth of individual sections depends on data availability for this market. Volume, capacity, trade and other unit-based metrics are included where applicable.

